

1. Introduction
This paper builds a parsimonious US business cycle structural vector autoregressive moving average (SVARMA) model to assess the importance of Divisia monetary aggregates compared to a simple sum of monetary aggregates in transmitting US monetary policy shocks. The simple sum of monetary aggregation implies that financial assets are perfect substitutes with equal “moneyness.” However, the underlying information of monetary aggregates is lost when the unweighted aggregation dismally fails to internalize the long-run substitution effects within the money markets. As a result, in the past decade, conventional business cycle monetary models focused only on the behavior of output, inflation, and interest rates and paid little or no attention to the roles of monetary aggregates.
The Divisia monetary aggregates proposed by Barnett (Reference Barnett1980) are constructed monetary quantity indexes. They track movements in the actual monetary aggregates, where each monetary item, such as currency, demand deposits, time deposits, and other liquid assets, is weighted according to their level of “moneyness.” Divisia aggregates consider the varying degrees of substitutability among different forms of money and provide a more accurate reflection of the actual purchasing power of money in the economy. For example, the Federal Reserve (Fed)’s policy of “quantitative easing,” to affect the supply of liquid assets, highlights that all monetary disturbances have a significant “quantitative” component and should be captured by movements in properly measured monetary aggregates. Recently, a growing number of articles have shown the vital role of Divisia monetary aggregates in the conduct of monetary policy (see e.g. Barnett and Chauvet, Reference Barnett and Chauvet2011; Belongia and Ireland, Reference Belongia and Ireland2015, Reference Belongia and Ireland2016; Dery and Serletis, Reference Dery and Serletis2021, Reference Dery and Serletis2023)).
The dominant part of the analysis of our study is based on the dynamics of impulse response functions of domestic variables to various monetary shocks. These responses are derived using Wold’s decomposition theorem. We found that a finite-order VARMA model better approximates the Wold representation than a finite-order VAR, with the former producing more reliable impulse responses. Since the constructed monetary and economic data involve seasonal adjustment, detrending, and temporal and contemporaneous aggregation, they include moving average dynamics even if their constituents were generated by pure VAR processes. Further, the basic real business cycle models are found to follow VARMA processes (Cooley and Dwyer, Reference Cooley and Dwyer1998), while linearized dynamic stochastic general equilibrium models imply a finite-order VARMA structure (Fernández-Villaverde et al. Reference Fernández-Villaverde, Rubio-Ramírez, Sargent and Watson2007). In this regard, VAR approximations require models with highly long lag lengths, much longer than those selected by typical information criteria such as the AIC or BIC (Kapetanios et al. Reference Kapetanios, Pagan and Scott2007). For example, Havranek and Rusnak (Reference Havranek and Rusnak2013); Lucas and Nicolini (Reference Lucas and Nicolini2015) and Belongia and Ireland (Reference Belongia and Ireland2016) highlighted that as the US financial systems develop and experience regulatory changes, the lag between monetary policy actions and their effects on the economy appears to lengthen. Raghavan et al. (Reference Raghavan, Athanasopoulos and Silvapulle2016) and Raghavan and Athanasopoulos (Reference Raghavan and Athanasopoulos2019) found that the VARMA models have parsimonious representation compared to long-order VAR models to describe a system adequately and obtain reliable impulse responses. In addition, Athanasopoulos and Vahid (Reference Athanasopoulos and Vahid2008a) and Raghavan (Reference Raghavan2020) show that VARMA models forecast more accurately than VARs, and they justify that the forecast superiority comes from the presence of moving average components.
Monetary policy is a stabilization policy measure for steering economies toward achieving stable economic growth and price stability. In this paper, (i) we build a US business cycle SVARMA model and establish the necessary identification conditions to uncover the independent monetary shocks; (ii) we use the identified SVARMA model to assess whether the business cycle models with Divisia monetary aggregates, namely Divisia M3 and Divisia M4 compared to the simple sum of monetary aggregate M2 produce impulse responses to monetary policy shocks that are consistent with theoretical and stylized facts; (iii) we compare and contrast the changes in the transmission of monetary policy shocks across time for models with these three different monetary aggregates.
This study models the US economy using six variables similar to those in Sims (Reference Sims1992) to assess the role of money in US monetary policy.Footnote 1 Applying the methodology of Athanasopoulos and Vahid (Reference Athanasopoulos and Vahid2008b), we identify and estimate a canonical VARMA model where all parameters are efficiently determined and estimated simultaneously using full information maximum likelihood (FIML). The study period is from January 1974 to June 2022, and the identified reduced form model is VARMA $(2,1)$
. To identify the contemporaneous structure of the model, we draw on some of the identification strategies imposed by Kim and Roubini (Reference Kim and Roubini2000), Dungey and Osborn (Reference Dungey and Osborn2014), Belongia and Ireland (Reference Belongia and Ireland2015) and Dery and Serletis (Reference Dery and Serletis2021). The orthogonal monetary policy and money demand shocks identified through the SVARMA models with three different monetary aggregates are used to evaluate the impulse responses, forecast error variance decomposition and historical decomposition of the domestic variables to these shocks.
$(2,1)$
. To identify the contemporaneous structure of the model, we draw on some of the identification strategies imposed by Kim and Roubini (Reference Kim and Roubini2000), Dungey and Osborn (Reference Dungey and Osborn2014), Belongia and Ireland (Reference Belongia and Ireland2015) and Dery and Serletis (Reference Dery and Serletis2021). The orthogonal monetary policy and money demand shocks identified through the SVARMA models with three different monetary aggregates are used to evaluate the impulse responses, forecast error variance decomposition and historical decomposition of the domestic variables to these shocks.
Our SVARMA-based empirical results show no common empirical puzzles (output, price, liquidity, and exchange rate puzzles) found in the monetary literature. A one standard deviation monetary policy shock increases the FED by 20 basis points, decaying over three years. The contractionary monetary policy shock reduces output, inflation, and money demand while appreciating the exchange rate. This deflationary episode aligns with theoretical expectations across three models, with the policy rule using DivM3 showing a more significant effect. Across the models, the rise in the FED led to a temporary drop in commodity prices and inflation, while output experienced a more persistent decline. A positive money demand shock caused rapid interest rate rises in models with Divisia monetary aggregates but not in the SumM2 model, leading to a liquidity puzzle. Similarly, an unanticipated appreciation of the US dollar, prompting policymakers to counter currency appreciation, is more prevalent in models with Divisia monetary aggregates than in the SumM2 model.
Our findings highlight the significant impact of monetary effects on the business cycle and underscore the importance of broad Divisia monetary aggregates, consistent with Barnett and Chauvet (Reference Barnett and Chauvet2011); Belongia and Ireland (Reference Belongia and Ireland2015, Reference Belongia and Ireland2016); Serletis and Xu (Reference Serletis and Xu2020); Dery and Serletis (Reference Dery and Serletis2021, Reference Dery and Serletis2023). This has practical implications for economic policy, as Divisia aggregates provide valuable insights into how changes in money demand influence inflation, output, and interest rates. Our historical and variance decomposition reveals that fluctuations in different monetary aggregates exert distinct dynamic effects on macroeconomic variables over time. Notably, the time path of monetary shocks implied by our SVARMA models with DivM3 appears superior, further strengthening the robustness and relevance of our framework.
The paper is organized as follows: Section 2 briefly reviews the evolution of the Divisia monetary aggregates. Section 3 describes the VARMA methodology and choice of variables and illustrates the identification of the SVARMA model for the US business cycle. In Section 4, we report and discuss the empirical findings. In particular, we compare the performance of the three monetary aggregates. Section 5 concludes this paper.
2. Divisia monetary aggregates
Though many types of financial intermediaries and monetary substitutes have evolved over the years, economists and policymakers find the simple sum broad monetary aggregates to be less informative as it fails to capture the contributions of all monetary assets to the economy’s flow of monetary services. Barnett and Spindt (Reference Barnett and Spindt1979); Barnett (Reference Barnett1980); Barnett et al. (Reference Barnett, Offenbacher and Spindt1984) and Barnett and Chauvet (Reference Barnett and Chauvet2011) have highlighted several issues with using a simple sum of monetary aggregates as a structural economic variable. The main limitation of the simple sum approach is that it fails to account for the varying levels of “moneyness” among different monetary items. Each item represents a distinct financial asset with different user costs, which include the opportunity cost of holding them in terms of foregone interest. The simple sum index, however, overlooks these differences and assumes perfect substitutability among the assets. According to Barnett and Chauvet (Reference Barnett and Chauvet2011), these observations led to serious concerns about the reliability of the simple sum aggregation method.
Using a straightforward summation method to assess monetary aggregates has inherent limitations, leading to a loss of valuable information. The simplicity of the simple sum index fails to capture the dynamic nature of money markets over time, particularly overlooking the intricate long-run substitution effects that unfold within these markets. To address these deficiencies, alternative approaches like the Divisia approximations proposed by Barnett (Reference Barnett1980) offer a more sophisticated measure by accounting for the unequal moneyness of different assets. The Divisia index assigns varying weights to assets based on their relative importance in the economy. Barnett et al. (Reference Barnett, Offenbacher and Spindt1984) demonstrated that the velocity and the demand for money functions remain stable when using Divisia monetary aggregates. These aggregates outperform simple sum aggregates as robust information indicators, especially when dealing with high levels of aggregation. Barnett et al. (Reference Barnett, Chauvet and Tierney2009) and Belongia and Ireland (Reference Belongia and Ireland2019) further proved the superiority of Divisia aggregates across diverse temporal dimensions, business cycles, and varying phases of inflation and interest rates. Having accurate and comprehensive insights into monetary growth is crucial for informed policy decisions, especially when inflation accelerates or the economy weakens.
While the New Keynesian model primarily focuses on key economic indicators such as output, inflation, and interest rates, it overlooks including monetary aggregates. However, there is a growing acknowledgement regarding the crucial role of incorporating monetary aggregates into this model. Barnett and Serletis (Reference Barnett and Serletis2000) and Serletis (Reference Serletis2001) have underscored both the theoretical and empirical significance of considering monetary aggregates in economic analyses. The importance of accurate measurement becomes particularly evident when examining the behavior of monetary aggregates in response to disturbances in monetary policy. Therefore, integrating Divisia approximations into the model emerges as a valuable approach, enabling a more precise understanding of the complex relationship between monetary aggregates and macroeconomic variables. This enhanced level of precision contributes to a more thorough understanding of how changes in the monetary aggregates interact with and impact broader economic factors.
In recent years, an array of empirical studies has demonstrated the relevance of a monetary effect on the business cycle, providing a robust foundation for our analysis. Among these studies are the works of Dery and Serletis (Reference Dery and Serletis2021, Reference Dery and Serletis2023); Jadidzadeh and Serletis (Reference Jadidzadeh and Serletis2019); Belongia and Ireland (Reference Belongia and Ireland2016); Barnett and Chauvet (Reference Barnett and Chauvet2011). Collectively, these studies have emphasized the pivotal role of incorporating broad Divisia monetary aggregates in understanding the dynamics of the business cycle. Our research extends and contributes to this growing body of empirical literature by constructing an SVARMA framework. This framework is constructed based on macroeconomic theory and stylized facts, enabling us to impose relevant identifying restrictions on the contemporaneous and dynamic relationships among macroeconomic variables and monetary aggregates. By doing so, we aim to shed light on the interactions between these variables and their impact on the business cycle. Utilizing historical decomposition and variance decomposition, we disentangle the pathways through which these shocks transmit across time, providing valuable insights into the underlying mechanisms central to the interaction between Divisia monetary aggregates and broader macroeconomic dynamics.
3. Money and business cycle structural VARMA model
This section discusses the structural VARMA (SVARMA) methodology and its application to US money and business cycle analysis. We first discuss the choice of variables and then identify and estimate the SVARMA model for the US business cycle.
3.1. Data and choice of monetary aggregates
This study uses a similar set of six variables as Sims (Reference Sims1992) to model the US economy and assess money’s role in the US monetary policy analysis. The variables are listed in Appendix B, Table B.1.
Following Sims (Reference Sims1992), we include the world commodity price index (COM) to account for inflation expectations.Footnote 2 The COM is expected to capture the non-policy-induced changes in inflationary pressure to which the Fed may react when setting monetary policy. As in Dery and Serletis (Reference Dery and Serletis2021), the US industrial production index (IP) and consumer price inflation (INF) are taken as the target variables of monetary policy, known as non-policy variables. Inflation is calculated by taking the annual change in the log of the consumer price index, while the log-detrended IP series is used as a proxy for the output gap. The Federal funds rate (FED) represents a measure of the short-term nominal interest rate, where the statistical innovation to the FED is associated with monetary policy disturbances (see e.g. Belongia and Ireland, Reference Belongia and Ireland2016; Dery and Serletis, Reference Dery and Serletis2021) The exchange rate is an arbitrage variable that describes the financial market equilibrium, and we employ the real narrow effective exchange rate index (RER). As highlighted by Sims (Reference Sims1992), the inclusion of COM and RER are necessary for the business cycle modeling framework as these variables influence monetary policy.
As for the choice of monetary aggregates, we follow Dery and Serletis (Reference Dery and Serletis2023) and include the Fed’s broad, simple sum monetary aggregate M2 (SumM2) and the Center for Financial Stability (CFS) broad Divisia monetary aggregates, namely Divisia M3 (DivM3) and Divisia M4 (DivM4). Currently, the broadest money supply measure reported by the Fed is only SumM2.Footnote 3 In contrast, the CFS reports broader measures where DivM3 and DivM4 include more components that serve as money in varying degrees (see for details Barnett et al. Reference Barnett, Liu, Mattson and van den Noort2013; Hanke, Reference Hanke2019; Belongia and Ireland, Reference Belongia and Ireland2019; Dery and Serletis, Reference Dery and Serletis2021).Footnote 4 Moreover, to derive these Divisia indices, the simple sum assumption of perfect substitutability of the monetary components is relaxed, and a weighting scheme based on monetary component user costs is used. According to Barnett et al. (Reference Barnett, Liu, Mattson and van den Noort2013), the US Divisia narrow monetary aggregates such as Divisia M2 closely follow their simple sum (SumM2) counterparts, as these series only include fewer monetary components. Therefore, in this study, to examine the role of Divisia money in the US business cycle, we focus on the broadly defined DivM3 and DivM4 with SumM2.
The vector of $\mathbf{X}_{t}$
variables is represented as
$\mathbf{X}_{t}$
variables is represented as
 \begin{equation} \mathbf{X}_{t}=[\text{COM}_{t}, \text{IP}_{t}, \text{INF}_{t}, \text{MA}_{t}, \text{FED}_{t}, \text{RER}_{t}]' \end{equation}
The MA in (1) represents either DivM3, DivM4 or SumM2. The Divisia monetary aggregates are from the Centre for Financial Statistics, while the commodity price index is the CRB/BLS spot index from Thompson Reuters. The remaining variables are from the Fed Economic Database. All data are in monthly frequency and cover the period from January 1974 to June 2022. In this paper, all variables are seasonally adjusted, in log level and detrended, using a linear trend method, except for the INF and FED, which are expressed in percentages. Appendix B provides a description of the data and sources in Table B.1; with unit root test results in Table B.2 and plots of the data series in Figure B.1.Footnote 5
3.2. Identification of the VARMA model
In this section, we illustrate the application of the VARMA methodology on the selected six variables of the US business cycle model listed in (1).
A $K$
dimensional VARMA
$K$
dimensional VARMA $(p,q)$
process can be written as
$(p,q)$
process can be written as
 \begin{equation} \mathbf{X}_{t}= \mathbf{c}+\boldsymbol{\Phi }_{1} \mathbf{X}_{t-1}+\ldots +\boldsymbol{\Phi }_{p} \mathbf{X}_{t-p}+\boldsymbol{\upsilon }_{t} -\boldsymbol{\Theta }_{1} \boldsymbol{\upsilon }_{t-1}-\ldots -\boldsymbol{\Theta }_{q}\boldsymbol{\upsilon }_{t-q}, \end{equation}
where $\boldsymbol{\Phi }_{j}$
represent the autoregressive coefficients,
$\boldsymbol{\Phi }_{j}$
represent the autoregressive coefficients, $\boldsymbol{\Theta }_{i}$
represent the moving average (MA) coefficients while
$\boldsymbol{\Theta }_{i}$
represent the moving average (MA) coefficients while $\mathbf{X}_{t}$
is a (
$\mathbf{X}_{t}$
is a ( $K\times 1$
) vector of endogenous variables at time
$K\times 1$
) vector of endogenous variables at time $\mathbf{t}$
. To identify and estimate (2), we use the Athanasopoulos and Vahid (Reference Athanasopoulos and Vahid2008b) extension of the Tiao and Tsay (Reference Tiao and Tsay1989) scalar component model (SCM) methodology. The aim of identifying scalar components is to examine whether any simplifying embedded structures underlying this process can provide a parsimonious VARMA structure.Footnote 6
$\mathbf{t}$
. To identify and estimate (2), we use the Athanasopoulos and Vahid (Reference Athanasopoulos and Vahid2008b) extension of the Tiao and Tsay (Reference Tiao and Tsay1989) scalar component model (SCM) methodology. The aim of identifying scalar components is to examine whether any simplifying embedded structures underlying this process can provide a parsimonious VARMA structure.Footnote 6
The identification of the VARMA $(p,q)$
process is carried out in three stages. In stage 1, we identify the overall tentative order of the VARMA
$(p,q)$
process is carried out in three stages. In stage 1, we identify the overall tentative order of the VARMA $(p,q)$
. Conditional on the overall tentative order
$(p,q)$
. Conditional on the overall tentative order $(p,q)$
, we then repeat the search process for each individual component. Embedded scalar component models are identified through a series of canonical correlation tests. The test results from identifying the overall tentative order and the individual SCMs are tabulated in what is referred to as Criterion and Root tables.
$(p,q)$
, we then repeat the search process for each individual component. Embedded scalar component models are identified through a series of canonical correlation tests. The test results from identifying the overall tentative order and the individual SCMs are tabulated in what is referred to as Criterion and Root tables.
In Appendix A, we demonstrate the reading of the Criterion and Root tables. Panel A of Table A.1, is known as the “Criterion Table," allows us to identify the overall order of the model. From Panel A, the identified overall order of the system is VARMA $(2,1)$
. Conditional on the overall order of
$(2,1)$
. Conditional on the overall order of $\left ( 2,1\right )$
, canonical correlation tests described in Appendix A are performed to identify the individual orders of embedded SCMs. Panel B of Table A.1, referred to as the “Root Table," allows us to identify the individual orders of the scalar components. From Table B, the identified VARMA
$\left ( 2,1\right )$
, canonical correlation tests described in Appendix A are performed to identify the individual orders of embedded SCMs. Panel B of Table A.1, referred to as the “Root Table," allows us to identify the individual orders of the scalar components. From Table B, the identified VARMA $(2,1)$
consists of three SCM
$(2,1)$
consists of three SCM $\left ( 1,1\right )$
and three SCM
$\left ( 1,1\right )$
and three SCM $\left (2,1\right )$
.
$\left (2,1\right )$
.
Implementing Stage II of the Athanasopoulos and Vahid (Reference Athanasopoulos and Vahid2008b) identification process described in Appendix A leads to additional zero restrictions on the matrix containing the contemporaneous relationships between the variables and the canonical SCM representation of the identified VARMA models.Footnote 7 Among the variables, as defined in (1), COM, INF and RER are found to be loading as SCM $(1,1)$
, while IP, MA and FED are loading as SCM
$(1,1)$
, while IP, MA and FED are loading as SCM $(2,1)$
. Similar identification outcomes are observed for models with DivM3, DivM4 and SumM2, respectively.
$(2,1)$
. Similar identification outcomes are observed for models with DivM3, DivM4 and SumM2, respectively.
The identified VARMA $(2,1)$
model is
$(2,1)$
model is
 \begin{eqnarray*} \left [ \begin{array}{c@{\quad}c@{\quad}c@{\quad}c@{\quad}c@{\quad}c} 1 & 0 & 0 & 0 & 0 & 0 \\ 0 & 1 & 0 & 0 & 0 & 0 \\ 0 & 0 & 1 & 0 & 0 & 0 \\ 0 & 0 & 0 & 1 & 0 & 0 \\ 0 & 0 & 0 & 0 & 1 & 0 \\ 0 & 0 & 0 & 0 & 0 & 1 \end{array} \right ] \mathbf{X}_{t}=\mathbf{c}+\left [ \begin{array}{c@{\quad}c@{\quad}c@{\quad}c@{\quad}c@{\quad}c} \phi _{11}^{\left ( 1 \right ) } & \phi _{12}^{\left ( 1 \right ) } & \phi _{13}^{\left ( 1 \right ) } & \phi _{14}^{\left ( 1 \right ) } & \phi _{15}^{\left ( 1 \right ) } & \phi _{16}^{\left ( 1 \right ) } \\[2pt] \phi _{21}^{\left ( 1 \right ) } & \phi _{22}^{\left ( 1 \right ) } & \phi _{23}^{\left ( 1 \right ) } & \phi _{24}^{\left ( 1 \right ) } & \phi _{25}^{\left ( 1 \right ) } & \phi _{26}^{\left ( 1 \right ) } \\[2pt] \phi _{31}^{\left ( 1 \right ) } & \phi _{32}^{\left ( 1 \right ) } & \phi _{33}^{\left ( 1 \right ) } & \phi _{34}^{\left ( 1 \right ) } & \phi _{35}^{\left ( 1 \right ) } & \phi _{36}^{\left ( 1 \right ) } \\[2pt] \phi _{41}^{\left ( 1 \right ) } & \phi _{42}^{\left ( 1 \right ) } & \phi _{43}^{\left ( 1 \right ) } & \phi _{44}^{\left ( 1 \right ) } & \phi _{45}^{\left ( 1 \right ) } & \phi _{46}^{\left ( 1 \right ) } \\[2pt] \phi _{51}^{\left ( 1 \right ) } & \phi _{52}^{\left ( 1 \right ) } & \phi _{53}^{\left ( 1 \right ) } & \phi _{54}^{\left ( 1 \right ) } & \phi _{55}^{\left ( 1 \right ) } & \phi _{56}^{\left ( 1 \right ) } \\[2pt] \phi _{61}^{\left ( 1 \right ) } & \phi _{62}^{\left ( 1 \right ) } & \phi _{63}^{\left ( 1 \right ) } & \phi _{64}^{\left ( 1 \right ) } & \phi _{65}^{\left ( 1 \right ) } & \phi _{66}^{\left ( 1 \right ) } \end{array} \right ] \mathbf{X}_{t-1} \\[2pt] + \left [ \begin{array}{c@{\quad}c@{\quad}c@{\quad}c@{\quad}c@{\quad}c} 0 & 0 & 0 & 0 & 0 & 0 \\ \phi _{31}^{\left ( 2 \right ) } & \phi _{32}^{\left ( 2 \right ) } & \phi _{33}^{\left ( 2 \right ) } & \phi _{31}^{\left ( 2 \right ) } & \phi _{32}^{\left ( 2 \right ) } & \phi _{33}^{\left ( 2 \right ) } \\ 0 & 0 & 0 & 0 & 0 & 0 \\ \phi _{31}^{\left ( 2 \right ) } & \phi _{32}^{\left ( 2 \right ) } & \phi _{33}^{\left ( 2 \right ) } & \phi _{31}^{\left ( 2 \right ) } & \phi _{32}^{\left ( 2 \right ) } & \phi _{33}^{\left ( 2 \right ) } \\ \phi _{31}^{\left ( 2 \right ) } & \phi _{32}^{\left ( 2 \right ) } & \phi _{33}^{\left ( 2 \right ) } & \phi _{31}^{\left ( 2 \right ) } & \phi _{32}^{\left ( 2 \right ) } & \phi _{33}^{\left ( 2 \right ) } \\ 0 & 0 & 0 & 0 & 0 & 0 \end{array} \right ] \mathbf{X}_{t-2}\\ + \boldsymbol{\upsilon }_{t}-\left [ \begin{array}{c@{\quad}c@{\quad}c@{\quad}c@{\quad}c@{\quad}c} \theta _{11}^{\left ( 1 \right ) } & \theta _{12}^{\left ( 1 \right ) } & \theta _{13}^{\left ( 1 \right ) } & \theta _{14}^{\left ( 1 \right ) } & \theta _{15}^{\left ( 1 \right ) } & \theta _{16}^{\left ( 1 \right ) } \\[2pt] \theta _{21}^{\left ( 1 \right ) } & \theta _{22}^{\left ( 1 \right ) } & \theta _{23}^{\left ( 1 \right ) } & \theta _{24}^{\left ( 1 \right ) } & \theta _{25}^{\left ( 1 \right ) } & \theta _{26}^{\left ( 1 \right ) } \\[2pt] \theta _{31}^{\left ( 1 \right ) } & \theta _{32}^{\left ( 1 \right ) } & \theta _{33}^{\left ( 1 \right ) } & \theta _{34}^{\left ( 1 \right ) } & \theta _{35}^{\left ( 1 \right ) } & \theta _{36}^{\left ( 1 \right ) } \\[2pt] \theta _{41}^{\left ( 1 \right ) } & \theta _{42}^{\left ( 1 \right ) } & \theta _{43}^{\left ( 1 \right ) } & \theta _{44}^{\left ( 1 \right ) } & \theta _{45}^{\left ( 1 \right ) } & \theta _{46}^{\left ( 1 \right ) } \\[2pt] \theta _{51}^{\left ( 1 \right ) } & \theta _{52}^{\left ( 1 \right ) } & \theta _{53}^{\left ( 1 \right ) } & \theta _{54}^{\left ( 1 \right ) } & \theta _{55}^{\left ( 1 \right ) } & \theta _{56}^{\left ( 1 \right ) } \\[2pt] \theta _{61}^{\left ( 1 \right ) } & \theta _{62}^{\left ( 1 \right ) } & \theta _{63}^{\left ( 1 \right ) } & \theta _{64}^{\left ( 1 \right ) } & \theta _{65}^{\left ( 1 \right ) } & \theta _{66}^{\left ( 1 \right ) } \end{array} \right ] \boldsymbol{\upsilon }_{t-1}. \end{eqnarray*}
The $\boldsymbol{\upsilon }_{t}$
is the vector of residuals representing unexpected movements in each variable. It is given as
$\boldsymbol{\upsilon }_{t}$
is the vector of residuals representing unexpected movements in each variable. It is given as
 \begin{equation} \boldsymbol{\upsilon }_{t}=[\upsilon _{t}^{com}, \upsilon _{t}^{ip}, \upsilon _{t}^{inf}, \upsilon _{t}^{ma}, \upsilon _{t}^{fed}, \upsilon _{t}^{ex}]' \end{equation}
In Stage III, the identified VARMA model is estimated using FIML. As in Hannan and Rissanen (Reference Hannan and Rissanen1982), a long VAR is used to obtain initial values of the parameters.
3.3. Identification of the orthogonal shocks
To directly attribute the responses of variables to economically interpretable shocks, we need to transform the residuals ( $\boldsymbol{\upsilon }_{t}$
) in equation (3) to a new set of orthogonal shocks.Footnote 8 It is common in the literature to use economic theory and stylized facts to identify the contemporaneous relationships between variables. The relationship between the reduced form VARMA disturbances (
$\boldsymbol{\upsilon }_{t}$
) in equation (3) to a new set of orthogonal shocks.Footnote 8 It is common in the literature to use economic theory and stylized facts to identify the contemporaneous relationships between variables. The relationship between the reduced form VARMA disturbances ( $\boldsymbol{\upsilon }_{t}$
) and the orthogonal shocks
$\boldsymbol{\upsilon }_{t}$
) and the orthogonal shocks $\mathbf{u}_{t}$
is
$\mathbf{u}_{t}$
is
 \begin{equation} \mathbf{A}_{0}\boldsymbol{\upsilon }_{t}=\mathbf{u}_{t}, \end{equation}
where $\mathbf{A}_{0}$
is an invertible square matrix,
$\mathbf{A}_{0}$
is an invertible square matrix, $E(\mathbf{u}_{t})=0$
,
$E(\mathbf{u}_{t})=0$
, $E(\mathbf{u}_{t}\mathbf{u}^{\prime}_{t})=\boldsymbol{\Sigma }_{\mathbf{u}}$
and
$E(\mathbf{u}_{t}\mathbf{u}^{\prime}_{t})=\boldsymbol{\Sigma }_{\mathbf{u}}$
and $\boldsymbol{\Sigma }_{\mathbf{u}}$
is a diagonal matrix.
$\boldsymbol{\Sigma }_{\mathbf{u}}$
is a diagonal matrix. $\mathbf{A}_{0}$
is normalized across the main diagonal so that each equation in the system has a designated dependent variable.
$\mathbf{A}_{0}$
is normalized across the main diagonal so that each equation in the system has a designated dependent variable.
 \begin{equation} \mathbf{A}_{0}=\left [ \begin{array}{c@{\quad}c@{\quad}c@{\quad}c@{\quad}c@{\quad}c} 1 & 0 & 0 & 0 & 0 & 0 \\ a^{0}_{21} & 1 & 0 & 0 & 0 & 0 \\ a^{0}_{31} & a^{0}_{32} & 1 & 0 & 0 & 0 \\ 0 & a^{0}_{42} & a^{0}_{43} & 1 & 0 & 0 \\ 0 & a^{0}_{52} & a^{0}_{53} & a^{0}_{54} & 1 & 0 \\ a^{0}_{61} & a^{0}_{62} & a^{0}_{63} & a^{0}_{64} & a^{0}_{65} & 1 \\ \end{array} \right ] \end{equation}
A recursive identification structure on the contemporaneous matrix $\mathbf{A}_{0}$
is imposed with the variables ordered as in (1).Footnote 9
$\mathbf{A}_{0}$
is imposed with the variables ordered as in (1).Footnote 9
The world commodity price index (COM) is assumed to be contemporaneously exogenous to any variable in the domestic economy, while no restrictions are imposed on its lagged structural parameters. In contrast, in the Divisia monetary literature, COM is treated as an information market variable, implying that it is contemporaneously affected by all the variables in the model. As in (Kim and Roubini, Reference Kim and Roubini2000; Dungey and Osborn, Reference Dungey and Osborn2014), we treat the exchange rate (RER) as an information market variable while COM as a proxy for negative and inflationary supply shocks.Footnote 10 The RER is seen as responding quickly to all relevant economic disturbances and, therefore, is assumed to be contemporaneously affected by all the variables in the model. Since commodities are a crucial input for most economic sectors and account for inflation expectations, the COM is assumed to affect the domestic real sector (IP), inflation (INF) and RER contemporaneously.
The interest rate (FED), money (MA), and exchange rate are assumed not to affect the level of real activity and inflation contemporaneously but affect them with a one-period lag. As in Kim and Roubini (Reference Kim and Roubini2000) we assume businesses do not change their output and prices unexpectedly in response to unanticipated changes in monetary policy or financial signals within a month due to inertia, adjustment costs and planning delays. IP and INF are assumed to respond immediately to COM following their mark-up rule but not with the RER, as the exchange pass-through effect is not instantaneous. In line with Dungey and Osborn (Reference Dungey and Osborn2014), we assume output immediately affects inflation, but inflation does not enter the output equation contemporaneously.
According to Kim and Roubini (Reference Kim and Roubini2000) and Sims and Zha (Reference Sims and Zha2006), real demand money balances depend on real income and nominal interest rates, which represent the opportunity costs of holding money. Similarly, we also assume the money demand equation depends on economic activities and thus includes IP and INF contemporaneously while allowing the FED to influence it in the lag structure. As in Belongia and Ireland (Reference Belongia and Ireland2015) and Dery and Serletis (Reference Dery and Serletis2021), the US monetary policy equation is assumed to be the reaction function of the Fed, which sets the interest rate after observing the current IP, INF and MA. We include these variables in the monetary policy reaction function to control for current systematic responses of monetary policy to the state of the economy. We tried removing the monetary aggregate in the interest rate equation to represent the generalized Taylor restrictions studied within a New Keynesian framework. We found the results did not vary that much.
The contemporaneous structure identified in (5) is used to estimate the orthogonal shocks where the sizes of the shocks represent the one standard deviation of the corresponding orthogonal errors obtained from the SVARMA models. The vector of $\mathbf{u}_{t}$
orthogonal shocks in (4) is represented as
$\mathbf{u}_{t}$
orthogonal shocks in (4) is represented as
 \begin{equation} \mathbf{u}_{t}=[u_{t}^{com}, u_{t}^{ip}, u_{t}^{inf}, u_{t}^{ma}, u_{t}^{fed}, u_{t}^{ex}]' \end{equation}
where $u_{t}^{com}, u_{t}^{ip}, u_{t}^{inf}, u_{t}^{ma}, u_{t}^{fed}, u_{t}^{ex}$
are structural disturbances represented as commodity market shocks, output shocks, inflation shocks, money demand shocks, monetary policy shocks and exchange rate shocks respectively. The sizes of the shocks from the SVARMA models with different monetary aggregates are reported in Table 1.
$u_{t}^{com}, u_{t}^{ip}, u_{t}^{inf}, u_{t}^{ma}, u_{t}^{fed}, u_{t}^{ex}$
are structural disturbances represented as commodity market shocks, output shocks, inflation shocks, money demand shocks, monetary policy shocks and exchange rate shocks respectively. The sizes of the shocks from the SVARMA models with different monetary aggregates are reported in Table 1.
Magnitude of one standard deviation shocks from the SVARMA models with different monetary aggregates

With the exception of the money demand shock, the sizes of the other orthogonal shocks across the three models appear to be similar.
4. Empirical results
In this section, we present, compare and analyze key impulse response functions of the US business cycle variables to orthogonal shocks reported in Table (1). The shocks are derived from SVARMA models that use different monetary aggregates, namely SumM2, DivM3 and DivM4. In addition, we also present and discuss historical and variance decomposition derived from these models to assess the persistent and dynamic effects of monetary policy and money shocks using different monetary aggregates.
4.1. Impulse responses of business cycle variables to various shocks
The dynamic effects of the identified monetary and economic shocks in (6) are analyzed from impulse response functions, which are derived from pure vector moving average representations (VMA) of the model. The VMA representation of (2) is given by
 \begin{equation} \mathbf{X}_{t}=\mathbf{A}_{0}^{-1}\mathbf{u}_{t}+\sum _{i=1}^{\infty }\boldsymbol{\Psi }_{i}\mathbf{A}_{0}^{-1}\mathbf{u}_{t-i}. \end{equation}
where
 \begin{equation*} \mathbf {\Psi }_{i}=\mathbf {\Theta }_{i}+\sum _{j=1}^{i}\mathbf {\Phi }_{j}\mathbf {\Psi }_{i-j} \end{equation*}
and $\boldsymbol{\Psi }_{0}=\mathbf{I}_{k}$
,
$\boldsymbol{\Psi }_{0}=\mathbf{I}_{k}$
, $\boldsymbol{\Phi }_{j}=0$
for
$\boldsymbol{\Phi }_{j}=0$
for $j\gt p$
and
$j\gt p$
and $\boldsymbol{\Theta }_{i}=0$
for
$\boldsymbol{\Theta }_{i}=0$
for $i\gt q$
. To attribute the responses of business cycle variables to an economically interpretable shock, we replace the reduced form errors (
$i\gt q$
. To attribute the responses of business cycle variables to an economically interpretable shock, we replace the reduced form errors ( $\boldsymbol{\upsilon }_{t}$
) with a
$\boldsymbol{\upsilon }_{t}$
) with a $(K\times 1)$
orthogonal shocks (
$(K\times 1)$
orthogonal shocks ( $\mathbf{u}_{t}$
) as in (4).
$\mathbf{u}_{t}$
) as in (4).
The parameters on current and lagged $\mathbf{u}_{t}$
represent one standard deviation orthogonalized impulse response functions. To aid comparison, the impulse responses of the US variables across the three models are normalized by dividing them by the standard deviations estimated using the model with DivM3. The impulse responses of the US variables are observed over a period of 36 months.Footnote 11
$\mathbf{u}_{t}$
represent one standard deviation orthogonalized impulse response functions. To aid comparison, the impulse responses of the US variables across the three models are normalized by dividing them by the standard deviations estimated using the model with DivM3. The impulse responses of the US variables are observed over a period of 36 months.Footnote 11
In Figures 1 and 2, we present the impulse responses of the business cycle variables to monetary policy shocks when we allow the DivM3, the DivM4 and the SumM2 monetary aggregates to enter the monetary policy rule (as shown in the contemporaneous structure identified in 5). The responses of MA, FED and RER are shown in Figure 1. A positive monetary policy shock, defined as an unanticipated contractionary monetary policy, leads to a rise in the US interest rate by 20 basis points within the first three months. This increase decays over three years and is consistent across three models.
Impulse responses of MA, FED and RER to a monetary policy shock.
Note: Impulse responses of monetary models with DivM3, DivM4 and SumM2 respectively. The 68% confidence bands are shown as dashed lines.

The rise in interest rates creates excess demand for US currency in the foreign exchange market, resulting in the dollar’s appreciation. The appreciation is more pronounced when the narrowly defined SumM2 aggregate is included in the monetary policy rule. As expected, monetary aggregates DivM3 and DivM4 decline with the rise in interest rates, aligning with liquidity market expectations. A one standard deviation monetary policy shock causes DivM3 to fall by 4% in six months, nearly four times the decline observed for SumM2. These dynamic effects are distinguishable for up to 48 months, with the model including SumM2 indicating a positive response after six months, leading to a liquidity puzzle.
Figure 2 shows the responses of COM, IP, and INF to a contractionary monetary policy shock. The effects on COM are short-lived for models with DivM3 and DivM4 compared to the model with SumM2. Statistically negative effects on IP are observed across all three models after 3 months. Though the deflationary episode associated with a contractionary monetary policy shock appears to be consistent with theoretical expectations across the three models, the policy rule with DivM3 appears to have a more significant and pronounced effect. As the Fed adopted a more hawkish stance to control inflation, the sharp increases in US interest rates and the fall in monetary aggregates have been effectively captured by the Fed’s reaction function with the monetary rule that includes DivM3.
Impulse responses of COM, IP and INF to a monetary policy shock.
Note: Impulse responses of monetary models with DivM3, DivM4 and SumM2 respectively. The 68% confidence bands are shown as dashed lines.
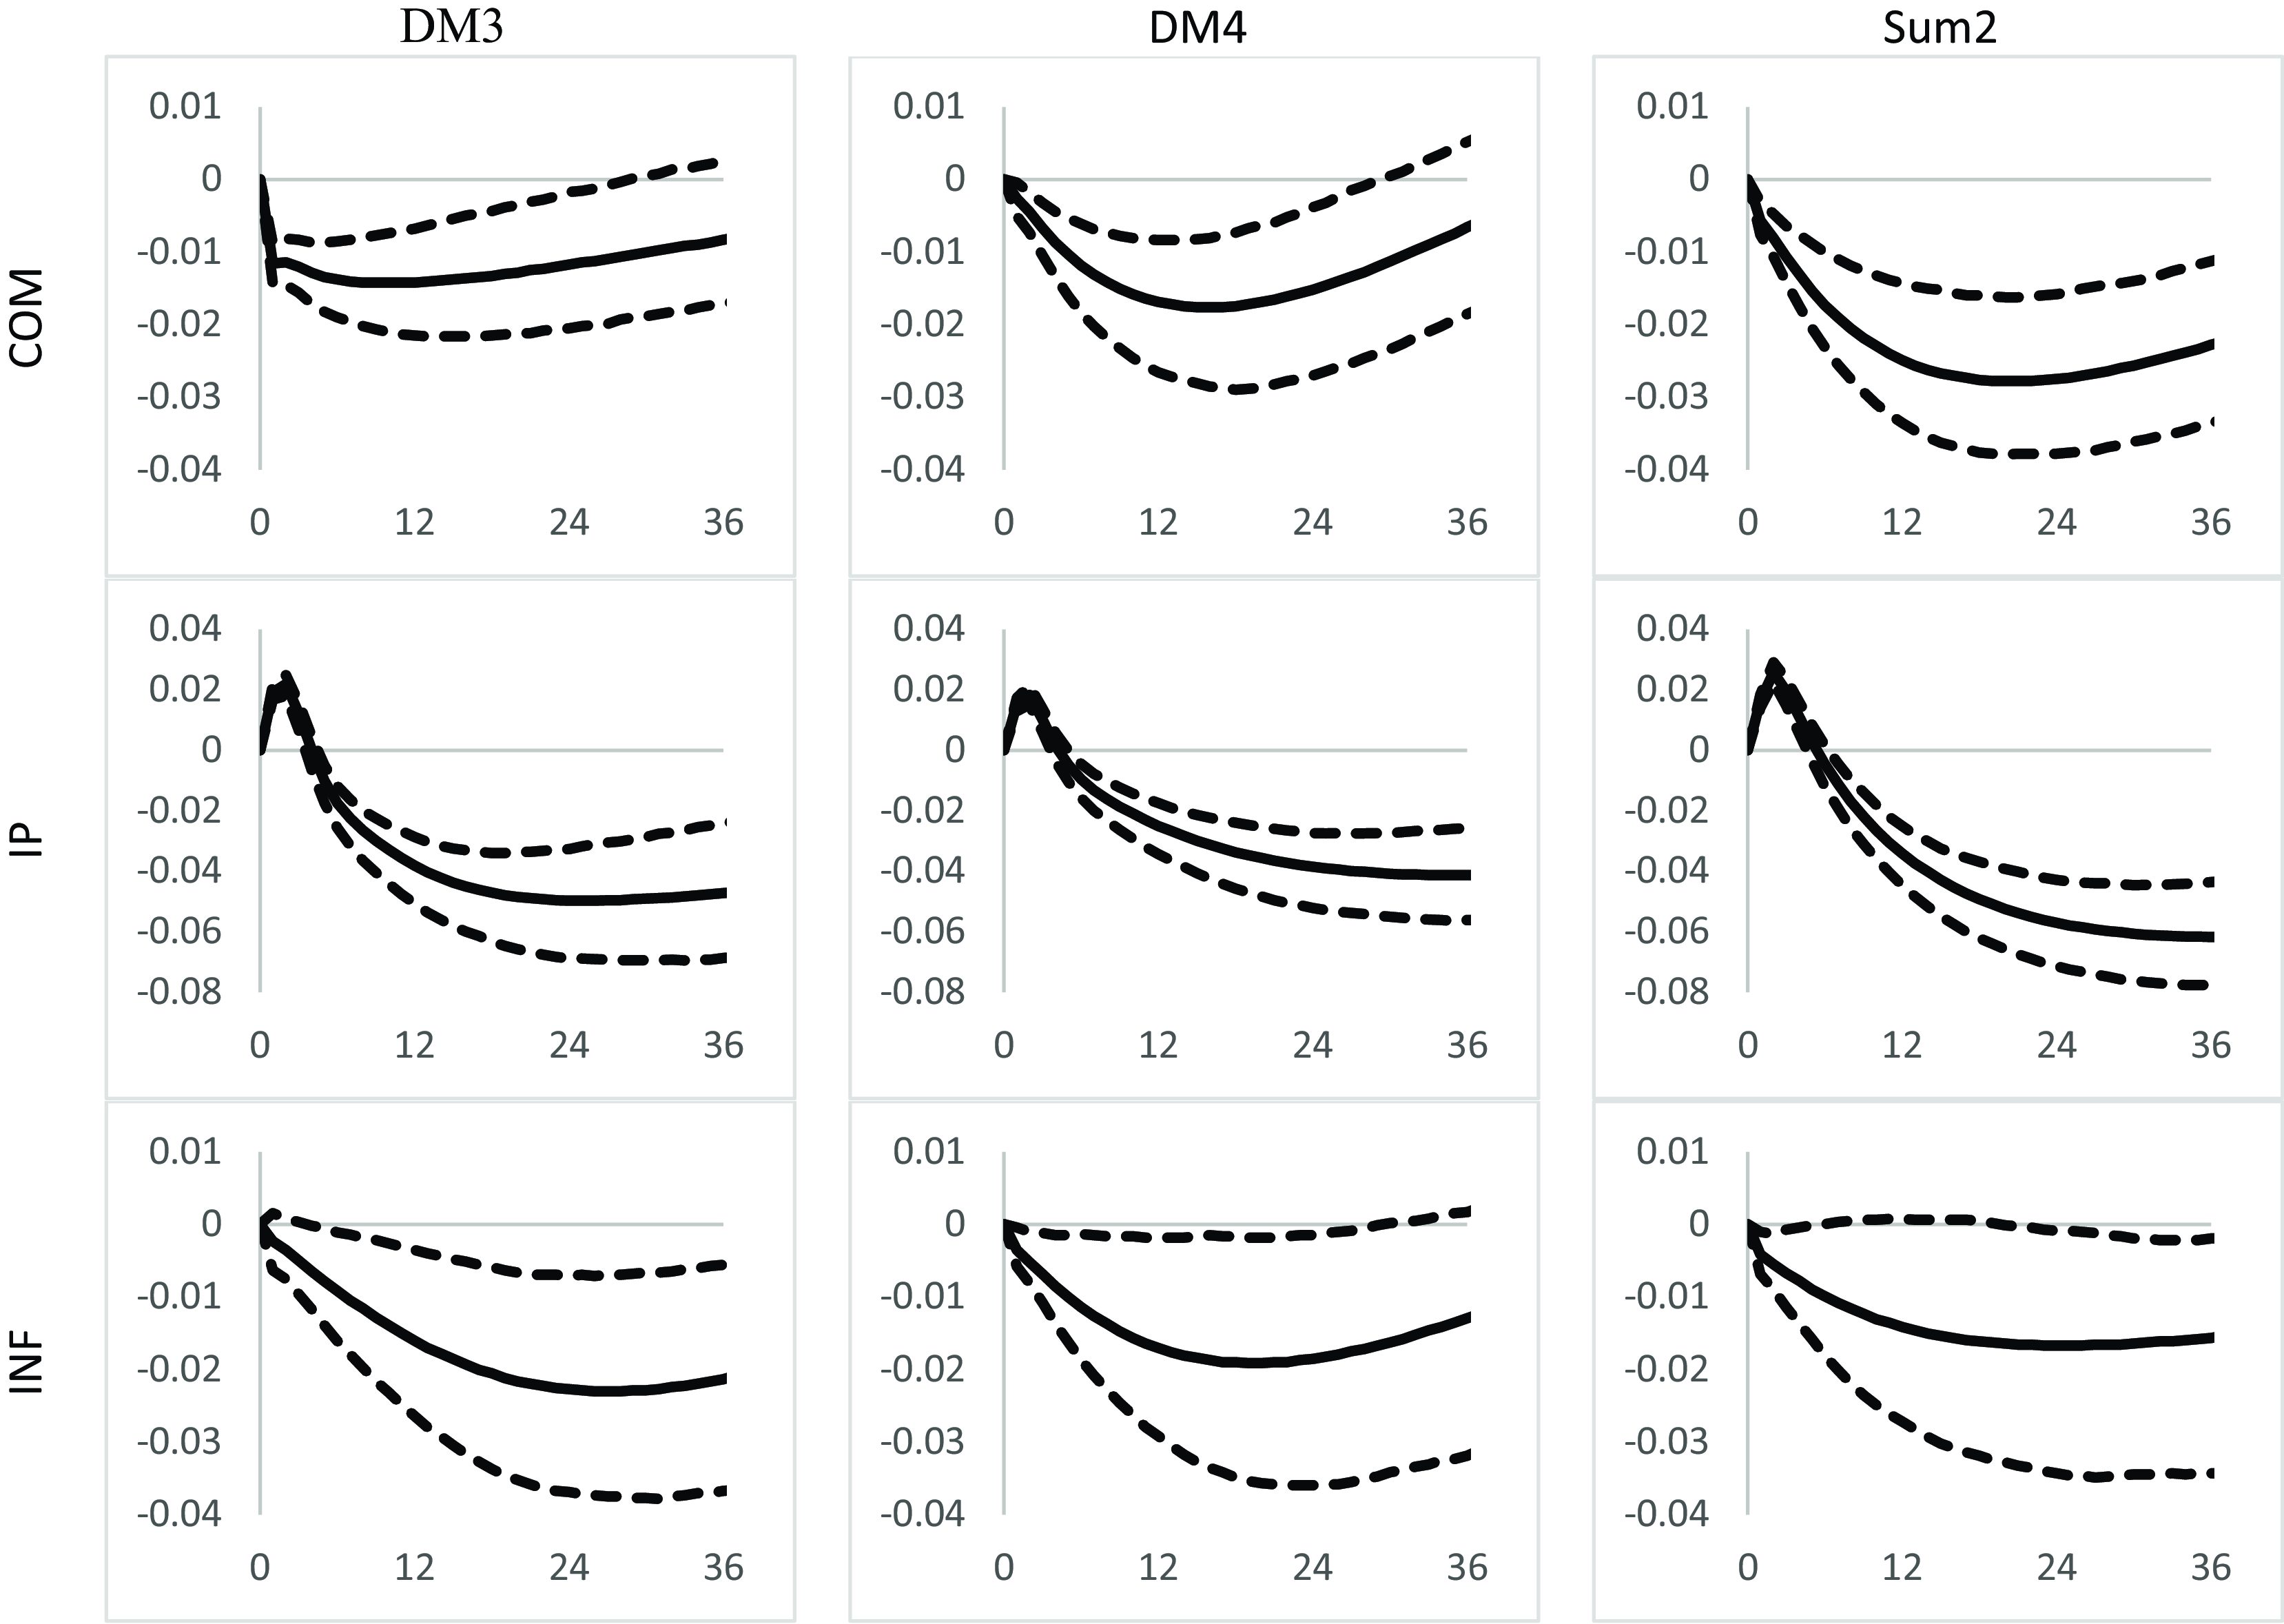
Figure 3 displays the responses of the IP, INF and FED to the identified money demand shock for models with DivM3, DivM4 and SumM2, respectively. A positive monetary shock is expected to trigger an increase in demand for money and a rise in demand for goods and services, leading to a temporary rise in output and more persistent inflationary pressure, causing a rise in the Fed rate. As shown in Figure 3, these outcomes are clearly observed in the model with DivM3, where IP increases and reaches a peak of 6% above the trend 18 months after the shock before declining. Inflation peaks at 4% around 36 months and remains at that level. On the other hand, in the SumM2 model, inflation does not respond significantly, and the output increase is more permanent. A one standard deviation money demand shock causes a notable rise in the Fed rate for DivM3, almost double that of SumM2, highlighting the transitory nature of the IP response in the DivM3 model.
Impulse responses of IP, INF, and FED to a money demand shock.
Note: Impulse responses of monetary models with DivM3, DivM4 and SumM2 respectively. The 68% confidence bands are shown as dashed lines.
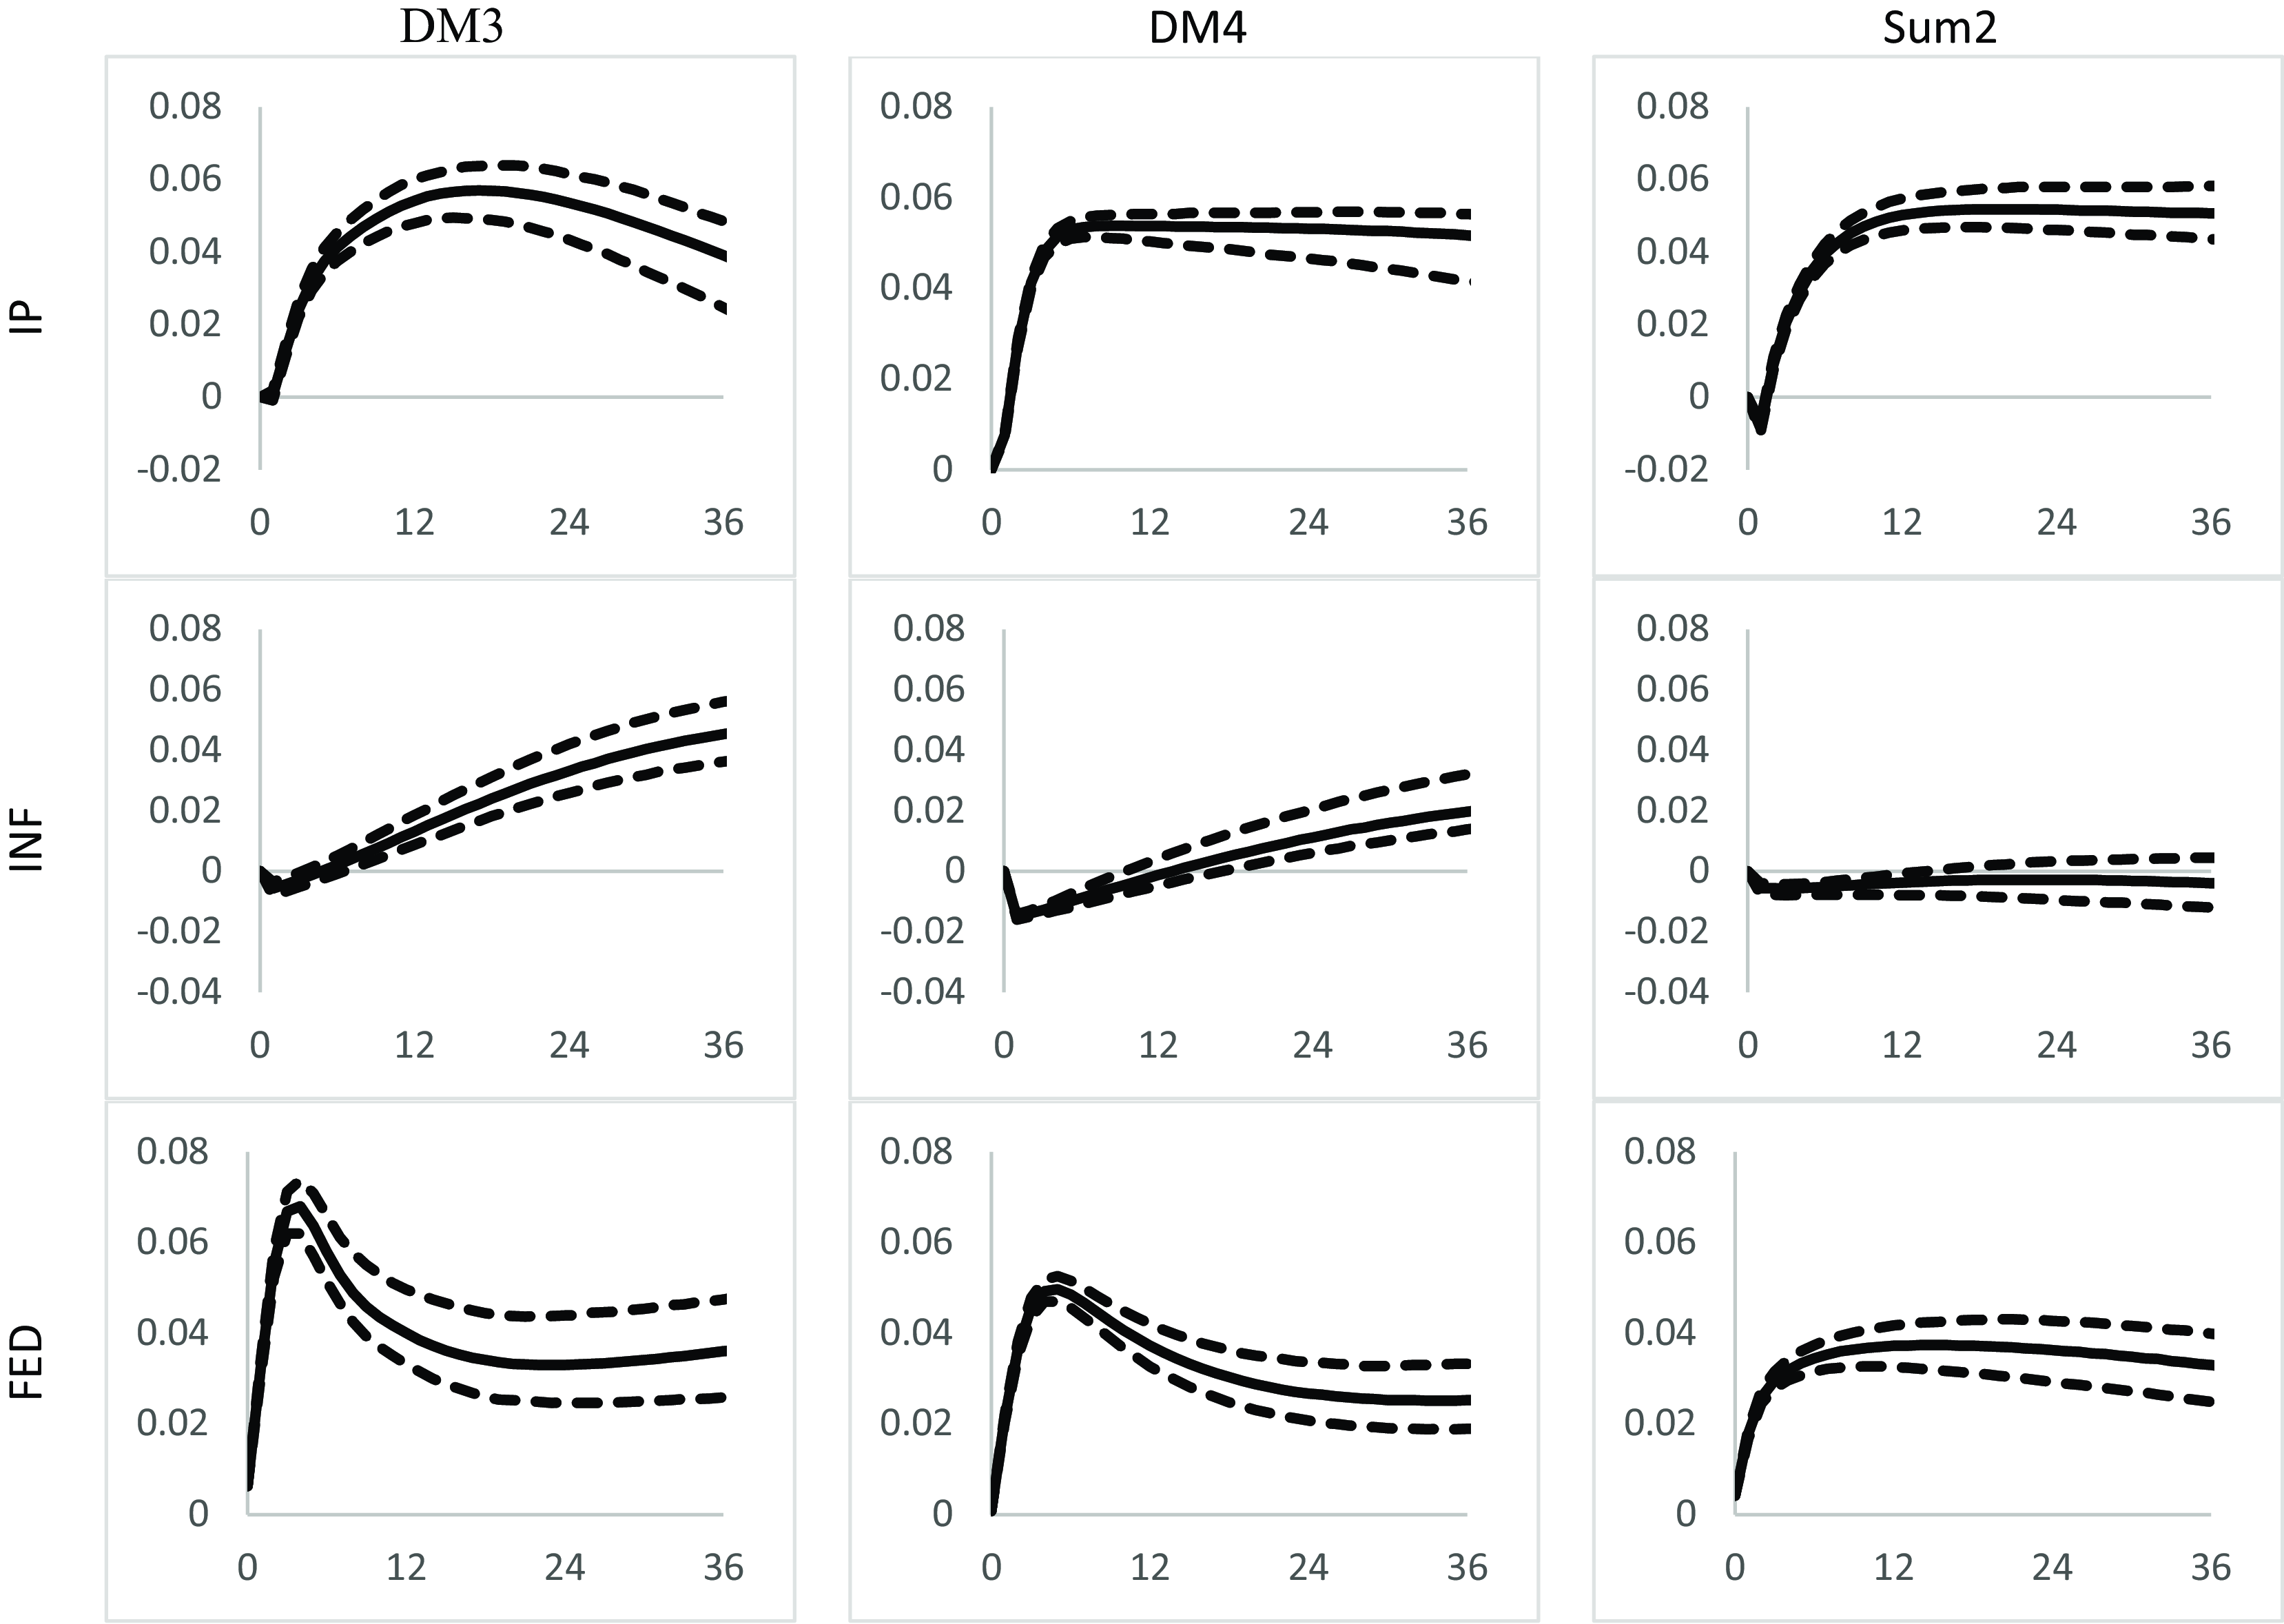
Figure 4 illustrates the Fed’s rate responses to various domestic shocks. A positive commodity price shock induces inflationary pressure on the economy, prompting the Fed to increase the policy rate, as seen across all three models. In response to a positive output shock, the Fed raises rates, consistent with its typical tightening policy in an expanding economy. This output expansion also generates inflationary pressure. When faced with a positive inflation shock, which represents unexpected inflationary pressure, the Fed’s response is gradual and positive. The models with DivM3 and DivM4 show a less pronounced response, while the model with SumM2 displays a sharp increase followed by a gradual decline. Regarding a positive exchange rate shock, policymakers typically counteract currency appreciation. Figure 4 shows that the Fed rate falls for the DivM3 model, lasting about two years before returning to a steady state. In contrast, the response for the SumM2 model is positive but insignificant.
Impulse responses of FED to commodity price, output, inflation and exchange rate shocks.
Note: Impulse responses of monetary models with DivM3, DivM4 and SumM2 respectively. The 68% confidence bands are shown as dashed lines.

Overall, the impulse responses provided evidence in support of broad Divisia M3 aggregates in monetary policy and business cycle analysis, consistent with Dery and Serletis (Reference Dery and Serletis2021) and Dery and Serletis (Reference Dery and Serletis2023). This is particularly so when the Taylor rule is augmented with the Divisia M3 monetary aggregate, suggesting that money measurement issues are important in the identification and transmission of shocks.
4.2. Robustness checks
In this section, we performed robustness checks to evaluate the crucial role of monetary aggregates in monetary policy analysis, the validity of our contemporaneous identification scheme and the significance of SVARMA models as opposed to the commonly used structural vector autoregressive (SVAR) models.
First, to demonstrate the importance of Divisia M3 and money broadly in identifying the monetary policy shock, in Figure 5, we present the impulse responses for the model with and without monetary aggregates entering the monetary policy rule. Compared to the model without money, the dynamic responses of COM, IP, INF and RER for the model with Divisia M3 appear to be more responsive and consistent with theoretical expectations.
Responses to monetary policy shocks identified for SVARMA models with and without money.
Note: Impulse responses of monetary models with and without DivM3 are shown as unbroken black lines and broken blue lines, respectively.

In our model, COM is ordered first and assumed to be contemporaneously exogenous to any variable in the domestic economy, while a commodity price shock is assumed to contemporaneously affect IP, INF, and RER. In our alternative model, consistent with the Divisia monetary literature, we treat COM as an information market variable, implying it is contemporaneously affected by all structural shocks in the model. Consequently, we assume that COM does not contemporaneously affect IP, INF, and RER. As shown in Figure 6, the results remain largely unchanged, indicating the robustness of our findings despite the different ordering and identification schemes.
Responses to monetary policy and money demand shocks identified for SVARMA models with different contemporaneous restrictions.
Note: Impulse responses of the original and alternative models with DivM3 are shown as unbroken black and blue lines respectively with confidence bands shown as dashed lines.

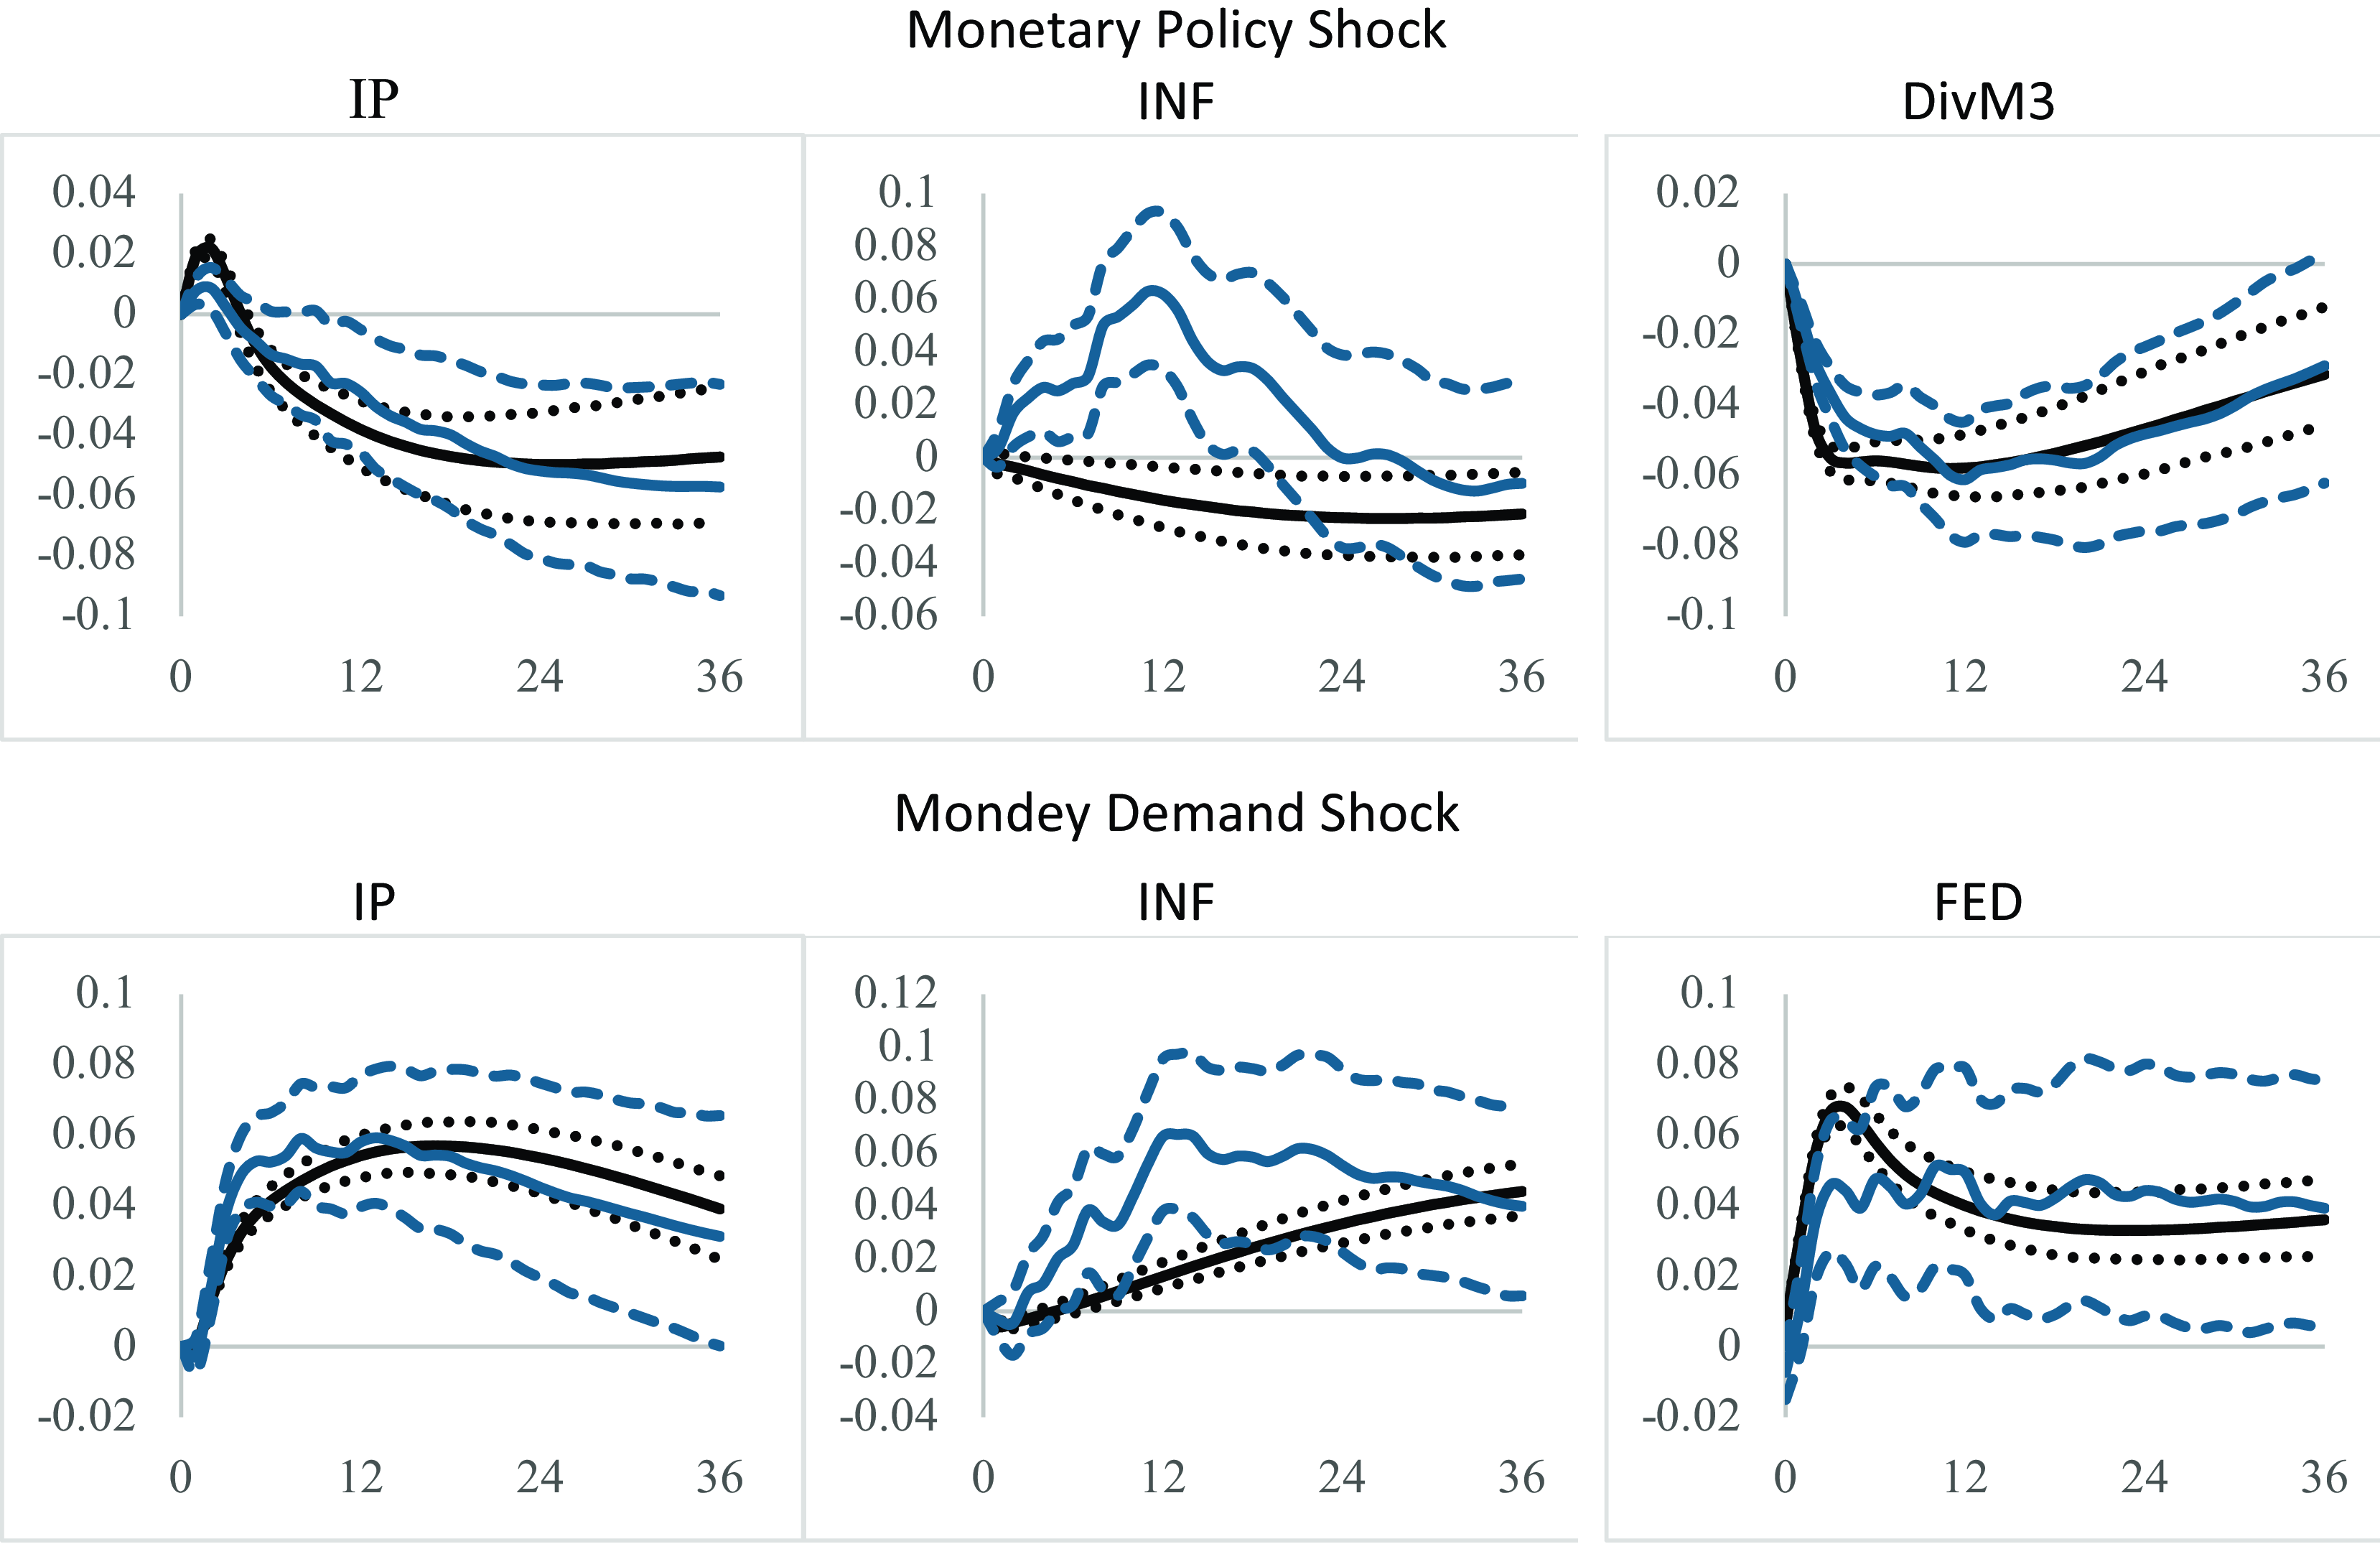
We compare the performance of our identified SVARMA(2,1) with the commonly used SVAR(12) for models with DivM3. Figure 7 shows that the SVARMA model has notable advantages over the SVAR model. While both models produce qualitatively similar impulse response functions, only the SVARMA model exhibits an immediate fall in the response of inflation to a contractionary monetary policy shock. In contrast, the SVAR model displays a price puzzle.Footnote 12 Additionally, the confidence bands around the SVARMA responses are narrower than those around the SVAR responses, indicating that the parsimonious SVARMA model yields more precise impulse response functions.
Responses to monetary policy and money demand shocks identified for SVARMA vs SVAR models.
Note: SVARMA and SVAR impulse responses are shown as unbroken black and blue lines respectively with confidence bands shown as dashed lines.
Overall, it is important to note that with the SVARMA method of identification, coupled with appropriate contemporaneous restrictions, by allowing money to enter the Taylor-type policy rule, we are able to produce theoretically consistent results marked by the absence of the usual price, liquidity and exchange rate puzzles that have plagued previous empirical work in the literature.
Variance decomposition of MA and FED.
Note: VDC of monetary models with DivM3, DivM4 and SumM2 respectively.

4.3. Forecast error variance decomposition
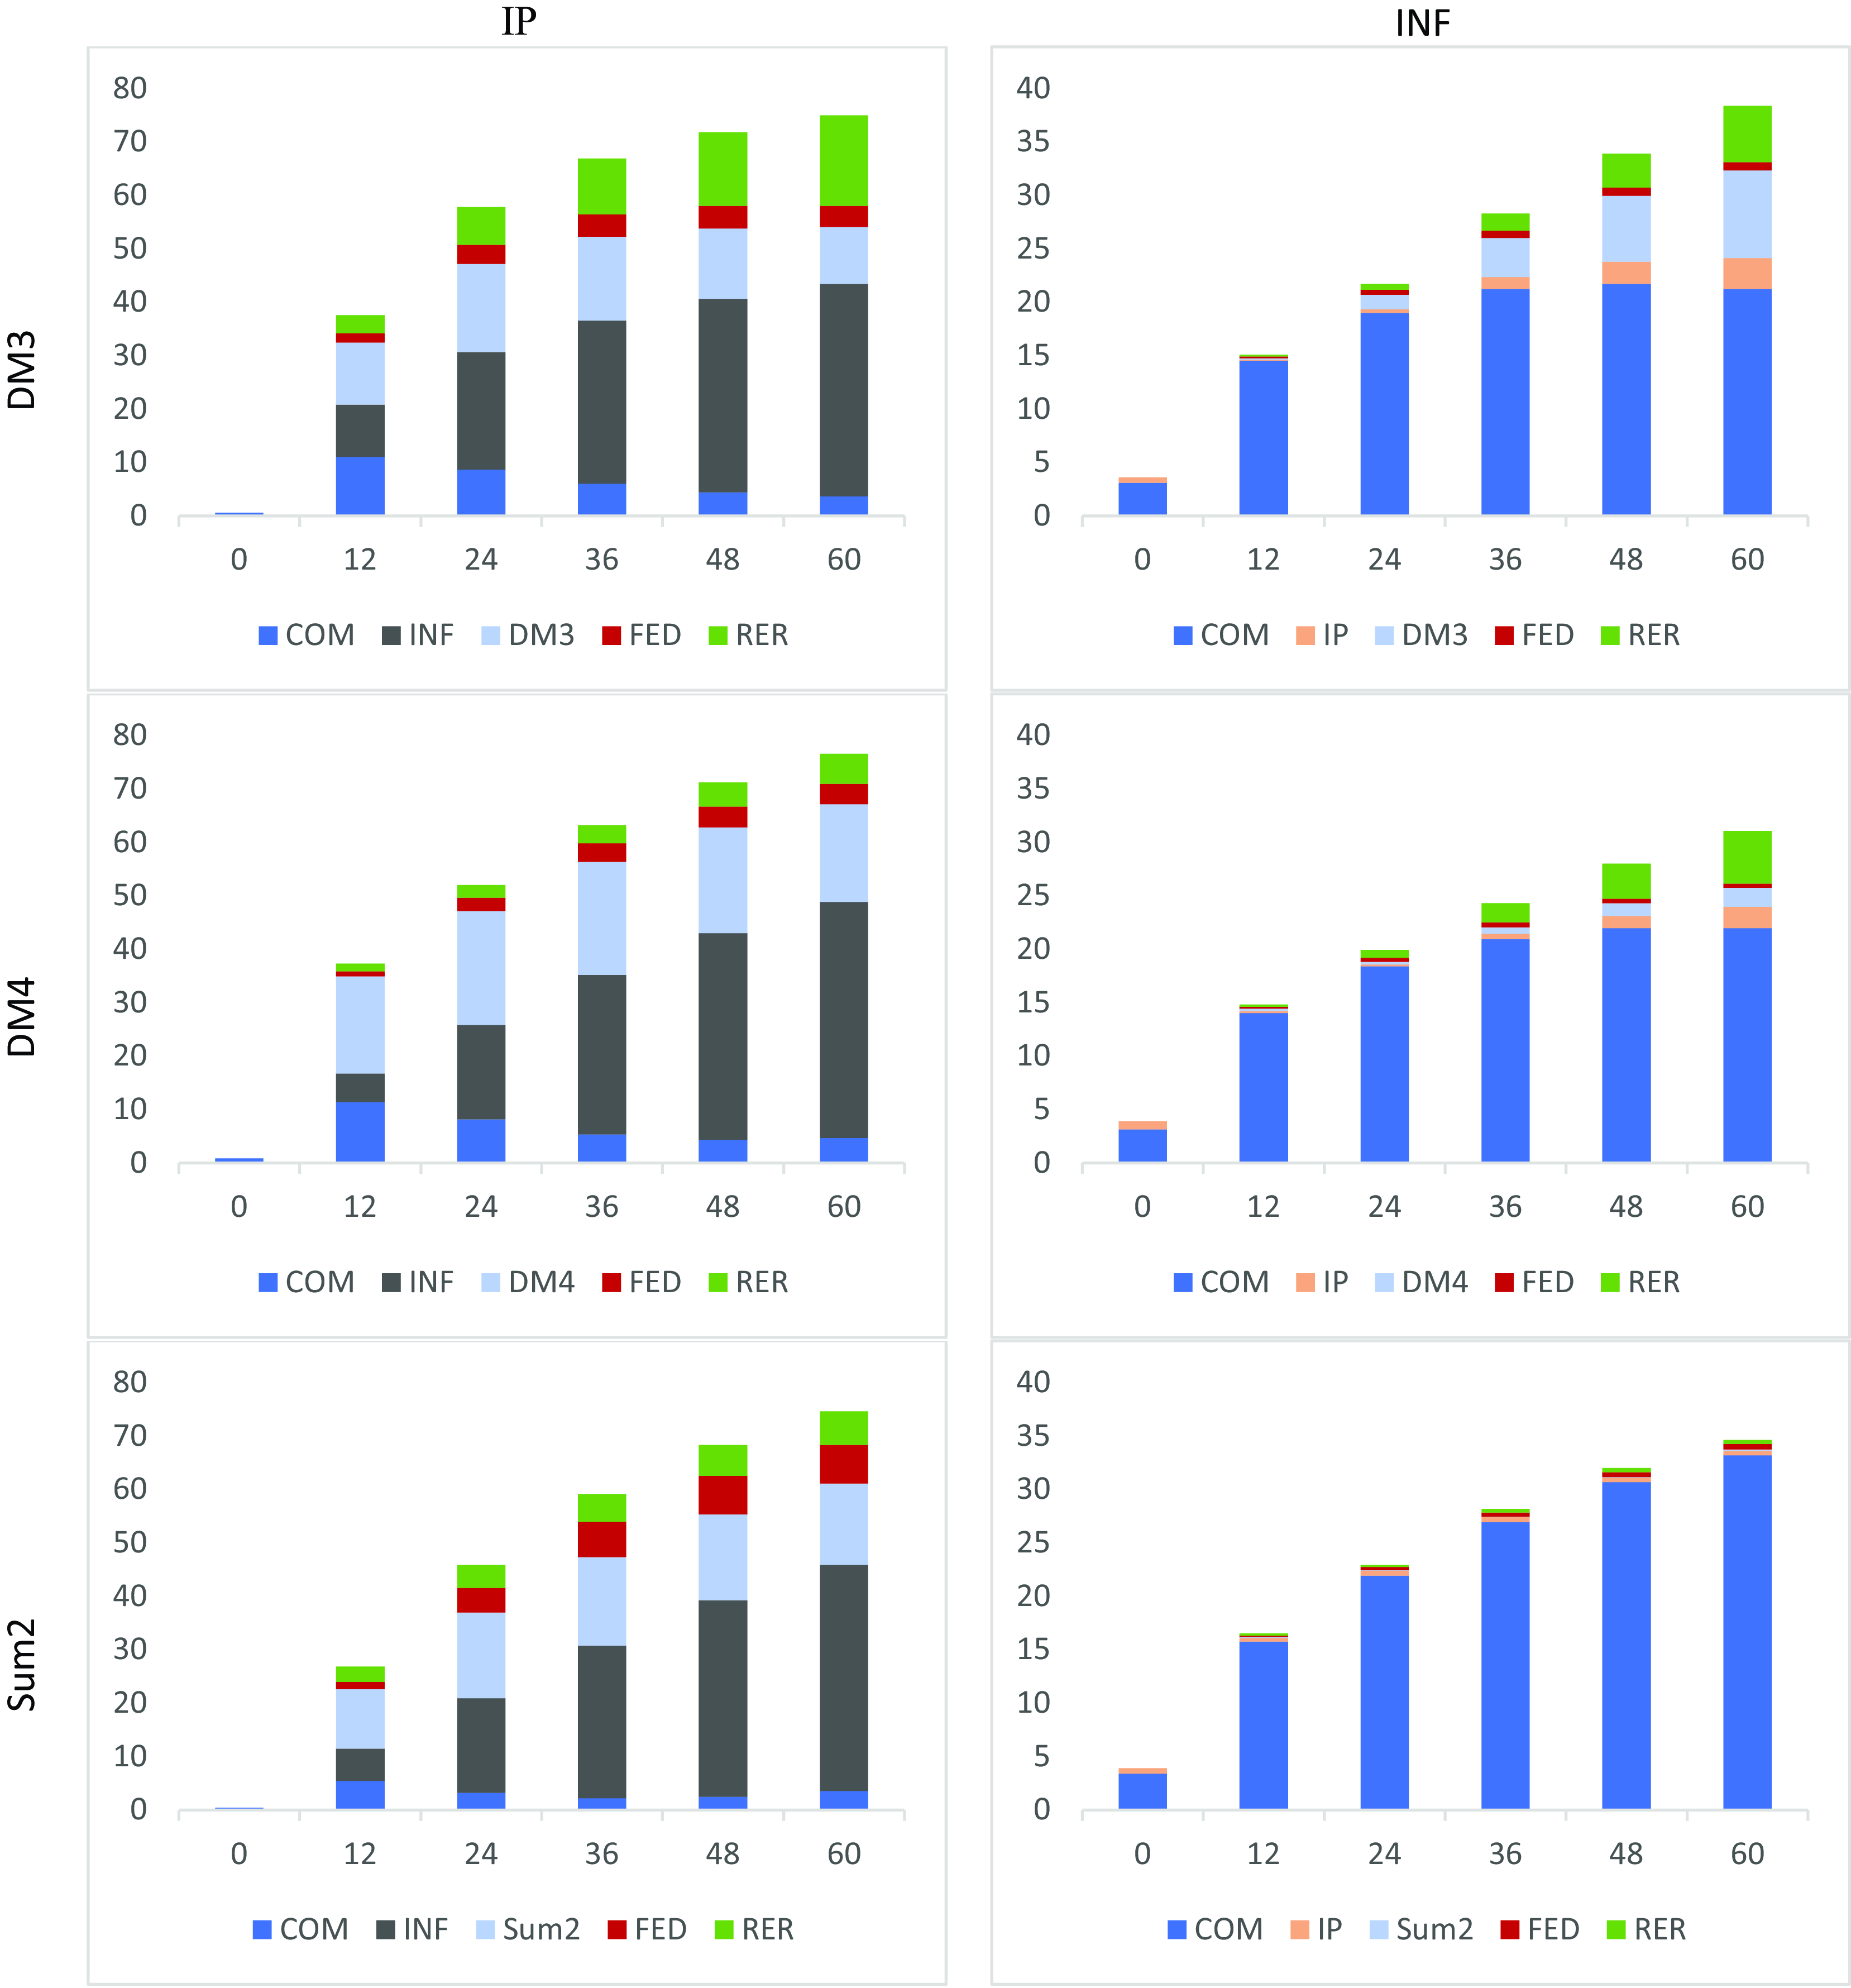
The forecast error variance decomposition (FEVD) determines how much of each variable can be explained by exogenous shocks to the other variables in the system. In Figures 8 and 9, the FEVD of the domestic variables for the models with DivM3, DivM4 and SumM2 are presented. Results are reported for forecast horizons 0 to 60 months ahead. The results appear to have a varied path between the three models.
Focusing first on the decomposition of the monetary aggregates, as shown in Figure 8, that over a twelve-month horizon, more than 15% of the variances are attributable to the output shocks. There is evidence that in the longer horizon of five years, both output and exchange rate shocks are important sources of fluctuations, while commodity price and inflationary shocks have minimal effects for all three monetary aggregates. Monetary policy shocks play a larger role when the Taylor rule is augmented with the DivM3. Its contribution is felt even in the shorter horizon, that is 12% over 12 months and the effects continue across the longer horizon. On the other hand, monetary policy shock is hardly a source of fluctuations for DivM4. Its effects on SumM2 are felt only after three years, and the size of the fluctuations is half of that attributed to DivM3.
Overall, the decomposition of the Fed rate across all three models, as presented in the right panel of Figure 8 show that the commodity price shock is an important source of fluctuation while the Fed rate is hardly affected by the exchange rate. However, different results are projected for the output, inflation and monetary shocks when the Fed rate is augmented with different monetary aggregate. Over a one-year horizon, the fluctuations in Fed rate due to DivM3 shocks are more than two times that due to SumM2. The monetary rule that includes DivM3 also appears to be more sensitive to output fluctuations compared to the models with SumM2 and DivM4. Over the five-year horizon, monetary rule with SumM2 saw Fed rate fluctuating to inflation shock around 4% compared to only 2% for the model with DivM3 and DivM4.
The FEVD of the output is presented in Figure (9). Over the five-year horizon, inflation and money demand shocks have larger effects on output across the three models, while the monetary policy and commodity price shocks have minimal effects. This demonstrates that monetary aggregates play an important role compared to the Fed rate in influencing output variation. According to the model with DivM3, the exchange rate shock plays an important role in affecting output, especially between the medium to the long-run horizon.
Different results are projected for inflation variation, which is largely influenced by commodity price shocks across the three models. From these results, we can deduce that commodity price shocks affect output indirectly through the inflation channel. For the model with SumM2, it appears that inflation is not largely affected by other variables. However, if we switch that with DivM3, money, output, and exchange rate contribute to inflation variation over a longer horizon. Overall, monetary policy shock has minimal effect on inflation. If the monetary rule is augmented with DivM3, the Fed rate could be affecting inflation via other channels, mainly through output and monetary aggregate.
Variance decomposition of IP and INF.
Note: VDC of monetary models with DivM3, DivM4 and SumM2 respectively.
4.4. Historical decomposition
A useful reorganization of an estimated VARMA is the historical decomposition, which exposes the contribution of shocks to the observed outcome at each point in time. The historical decomposition of a variable utilizes a representation of any variable in terms of the product of its impulse responses with estimates of the structural shocks. The structural VMA representation of (7) is given by
 \begin{equation} \mathbf{X}_{t}=\sum _{i=0}^{\infty }\boldsymbol{\Xi }_{i}\mathbf{u}_{t-i} \end{equation}
where $\boldsymbol{\Xi }_{i}=\boldsymbol{\Psi }_{i}\mathbf{A}_{0}^{-1}$
and the historical decompositions can be derived by simply recognizing that the VARMA form allows for any variable to be written as a weighted sum of previous shocks plus the effects of an initial condition, that is
$\boldsymbol{\Xi }_{i}=\boldsymbol{\Psi }_{i}\mathbf{A}_{0}^{-1}$
and the historical decompositions can be derived by simply recognizing that the VARMA form allows for any variable to be written as a weighted sum of previous shocks plus the effects of an initial condition, that is
 \begin{equation} {}_{t}=\text{initial conditions} + \sum _{i=0}^{t}\boldsymbol{\Xi }_{i}\mathbf{u}_{t-i} \end{equation}
and the contribution of the $k$
th structural shock to the
$k$
th structural shock to the $j$
th variable can be represented as
$j$
th variable can be represented as
 \begin{equation} x_{jt}^{(k)}=\text{initial conditions} + \sum _{i=0}^{t}{\xi }_{jk,i}{u}_{k,t-i} \end{equation}
Ideally, plotting the $x_{jt}^{(k)}$
for
$x_{jt}^{(k)}$
for $k=1,2,\ldots, K$
, throughout the sample period, we could interpret and analyze the relative contributions of the different structural shocks to the
$k=1,2,\ldots, K$
, throughout the sample period, we could interpret and analyze the relative contributions of the different structural shocks to the $j$
th variable.
$j$
th variable.
First, we delve into a comprehensive historical decomposition analysis, unraveling the complex interactions between selected macroeconomic variables (COM, IP, INF, FED, and RER) and the dynamic of DivM3, DivM4, and SumM2 from January 1974 to June 2022. Figure 10 unveils the historical decomposition of DivM3, DivM4, and SumM2 series, where the solid black line traces the demeaned monetary series. It is obvious from Figure 10 that the time paths of the five shocks significantly shape the movements in DivM3, overshadowing the impact on DivM4 and SumM2. Notably, SumM2 appears detached from the five shocks, exposing a disconnect between the simple sum monetary aggregates and the macroeconomic variables. Therefore, attention is directed towards examining the movements within the Divisia monetary aggregates, focusing specifically on DivM3.
We navigate through key periods, starting from mid-1974 to mid-1978, where the positive surge in the demeaned DivM3 series is predominantly attributed to the Fed rate. Transitioning to the period from mid-1978 to 1985, a decline in the demeaned DivM3 series confirms the influence of the Fed rate, a phenomenon unsurprising given the era of Volcker’s transformative policies. Moving into the era spanning the Great Moderation period, the early 1980s to the late 1990s, the trajectory of DivM3 aligns with contributions from commodity prices, output, and exchange rates. In contrast, inflation and interest rates serve as dampeners. The narrative shifts to the new millennium, from 2000 to 2010, witnessing a positive upswing linked to output and exchange rates, while the post-global financial crisis (GFC) era till the pre-COVID period is marked by negative movements attributed to inflation and the Fed rate. As we navigate the post-COVID environment, a resurgence in positive movements in DivM3 is observed, intricately tied to the dynamics of output, inflation and exchange rates. The unfolding narrative paints dynamic economic interactions, with DivM3 serving as an indicator, capturing the rebounds of policy decisions, global shocks, and the ever-evolving economic landscape.
Historical decomposition of MA for various domestic shocks.
Note: HDC of DivM3, DivM4 and SumM2 respectively. The solid line represents the demeaned series of the respective monetary aggregates.

Historical decomposition of IP and INF for monetary policy and monetary aggregate shocks.
Note: HDC of DivM3, DivM4 and SumM2 monetary models, with the blue lines representing monetary policy shocks and the red bars representing monetary aggregates shocks.

Next, we carry out historical decompositions to examine the relative contributions of the three identified monetary aggregates (DivM3, DivM4, and SumM2) shocks and monetary policy shocks to fluctuations in key domestic variables of output and inflation. Figure 11, illustrates noticeable differences in how these shocks influence IP and INF over time. DivM3 and DivM4 exert a more substantial influence on domestic variables, while SumM2 plays a comparatively minor role. These movements emphasize the pivotal role that Divisia monetary aggregates play in steering economic outcomes.
In the 1970s, particularly in 1974, concerns arose about a structural shift in money markets, indicated by a dramatic downward shift in the velocity function. By the early 1970s, evidence supported a stable demand for money function, which underpinned a monetary policy strategy based on intermediate targets for money supply growth rates (Belongia and Ireland, Reference Belongia and Ireland2019). Following the inflationary 1970s, Fed Chairman Paul Volcker sought to control inflation by reducing the money supply growth rate. As shown in Figure 11, this “Monetarist Experiment” successfully curbed inflation but led to an unintended recession (Barnett and Chauvet, Reference Barnett and Chauvet2011).
In the early 1980s, the stability of money demand remained questionable. Accumulating evidence indicated instability due to financial innovations affecting the velocity of simple sum M1 and M2. Consequently, as highlighted the minimal role of SumM2 in Figure 11, it appears the Fed abandoned its strategy of using money aggregate as an intermediate target. This period’s findings led to a consensus that money measures could be excluded from assessing monetary policy effects on economic activity. Later, the Taylor rule formalized this shift, outlining how the Fed could manipulate short-term interest rates to achieve economic goals.
During the Great Moderation, the growth rate measured by the Divisia index was higher than perceived, indicating that monetary policy was more contractionary before 1984 and more expansive afterwards than suggested by simple sum measures. The Divisia index exhibited a business cycle pattern more consistent with monetary policy, implying that more contractionary policies before recessions could have contributed to weak economic activity. During the Great Moderation period, the reactions of IP and INF to monetary policy shocks appeared subdued. According to Barnett and Chauvet (Reference Barnett and Chauvet2011), the Great Moderation may be unrelated to monetary policy, with factors such as increased US productivity, improved technology and communication, financial innovation, the rise of China and reduced size and volatility of shocks potentially playing significant roles.
The zero lower bound on nominal interest rates from 2008 to 2015 highlights the limitations of using the Federal funds rate alone to gauge monetary policy. This period suggests reconsidering monetary aggregates in policy analysis, especially for capturing the effects of unconventional policies like large-scale asset purchases and quantitative easing on money growth. Despite a decline in the user costs of all Divisia aggregates after the 2007–2009 financial crisis, they appear to contribute positively to economic growth, as demonstrated in Figure 11. As Belongia and Ireland (Reference Belongia and Ireland2019) notes, the Fed could have supplemented its unconventional policies with a targeting scheme for Divisia monetary aggregates, potentially stabilizing inflation even at the zero lower bound. During the post-2008 global financial crisis (GFC), DivM4 exhibited more significant effects than DivM3. This discrepancy can be attributed to the Fed’s implementation of quantitative easing, where the significant quantitative components of DivM4 effectively capture the repercussions of its monetary disturbances on domestic variables.
In response to the COVID-19 pandemic, the Fed implemented unprecedented monetary and fiscal measures, such as massive asset purchases, fiscal stimulus, and prolonged low interest rates, to stabilize the economy. These actions highlight the critical role and impact of unconventional monetary policies. The inflation resurgence in 2021–2022, with rates reaching multi-decade highs, has prompted a reevaluation of monetary policy. The Fed has begun tightening policy by raising interest rates and reducing asset purchases. The Divisia aggregates play a pivotal role in signaling the inflation value, with DivM3 and DivM4 acting in offsetting directions. This dichotomy reflects the inertia of the inflation rate, particularly evident up until late 2021. This shift highlights the dynamic nature of monetary policy and the necessity for the Fed to remain vigilant and responsive to evolving economic conditions.
In summary, the analysis provides compelling evidence that Divisia monetary shocks dominate in explaining variations in macroeconomic variables. The sources of these shocks exhibit considerable fluctuations over the sample period, at times asserting dominance in a positive direction while at other times acting as a dampening force.
5. Conclusion
The history of monetary policy, from the structural shifts in the 1970s to the financial innovations of the 1980s and the challenges of the 21st century, illustrates the complex and evolving nature of measuring and managing money growth and economic stability. In this study, we have constructed a parsimonious US SVARMA(2.1) open economy macro model, incorporating identification restrictions that align with the preferred theory and stylized facts derived from prior empirical research. Our aim is to examine the relationship between various monetary aggregates (SumM2, DivM2, and DivM3) and economic activity within the identified SVARMA framework. Using impulse responses, variance decomposition, and historical decomposition, we compare the transmission of shocks under different monetary aggregate models.
Over time, we have observed distinct fluctuations in the different monetary aggregates, each exerting varying dynamic effects on macroeconomic variables. Notably, our SVARMA model employing the Divisia M3 monetary aggregate demonstrates a superior ability to capture the time path of monetary shocks compared to the simple sum of monetary aggregate M2. These findings support the existence of a monetary effect on the business cycle and emphasize the significance of utilizing broad Divisia monetary aggregates. This outcome aligns with previous studies conducted by Dery and Serletis (Reference Dery and Serletis2023), Dery and Serletis (Reference Dery and Serletis2021), Jadidzadeh and Serletis (Reference Jadidzadeh and Serletis2019), Belongia and Ireland (Reference Belongia and Ireland2016) and Barnett and Chauvet (Reference Barnett and Chauvet2011). As the Fed navigates the post-pandemic recovery and addresses emerging economic and technological trends, lessons from past experiences on the importance of monetary measurements will continue to inform and shape future monetary policy strategies.
Supplementary material
The supplementary material for this article can be found at https://doi.org/10.1017/S1365100524000464.
Acknowledgements
The author wish to thank Professor Apostolos Serletis and the participants of the Society of Economic Measurement, 8th Annual Conference (2023) Milan for their constructive comments on the earlier version of this article.


 Open access