


Introduction
Tropical forests play a fundamental role in the Earth system by supporting ecosystem processes and functions and providing ecosystem services ranging from carbon sequestration and climate and water cycle regulation for the preservation of biodiversity (Lewis Reference Lewis2006, Barlow et al. Reference Barlow, Gardner, Araujo, Ávila-Pires, Bonaldo and Costa2007, Jackson et al. Reference Jackson, Randerson, Canadell, Anderson, Avissar and Baldocchi2008, Naidoo et al. Reference Naidoo, Balmford, Costanza, Fisher, Green, Lehner, Malcolm and Ricketts2008). Indeed, both primary and secondary tropical moist forests play particularly large roles in the provision of these services in comparison to most other forest biomes (Wright Reference Wright2005, Gibson et al. Reference Gibson, Lee, Koh, Brook, Gardner and Barlow2011,).
Primary tropical forests harbour the highest levels of biodiversity among the world’s terrestrial biomes and are therefore invaluable for biodiversity conservation (Gibson et al. Reference Gibson, Lee, Koh, Brook, Gardner and Barlow2011), while being severely threatened by human exploitation (Betts et al. Reference Betts, Wolf, Ripple, Phalan, Millers and Duarte2017). Tropical deforestation accounts for 15% of anthropogenic carbon emissions (Baccini et al. Reference Baccini, Goetz, Walker, Laporte, Sun and Sulla-Menashe2012, Houghton Reference Houghton2013, Le Quéré et al. Reference Le Quéré, Andrew, Friedlingstein, Sitch, Hauck and Pongratz2018), and the subsequent land use, such as pasture or crop plantation, often results in additional greenhouse gas emissions (Galford et al. Reference Galford, Melillo, Mustard, Cerri and Cerri2010). Throughout the tropics, these changes and pressures are largely driven by the demand for agricultural and commercial products on the international market, resulting in urbanization, resource extraction and conversion of forests to other land uses (Curtis et al. Reference Curtis, Slay, Harris, Tyukavina and Hansen2018, Seymour & Harris Reference Seymour and Harris2019, Akinyemi & Ifejika Speranza Reference Akinyemi and Ifejika Speranza2022). Accordingly, tropical forests are the focus of international policy initiatives and have seen the widespread establishment of protected areas (Fay & Nichols Reference Fay and Nichols2005, Newmark Reference Newmark2008, Venter et al. Reference Venter, Possingham, Hovani, Dewi, Griscom and Paoli2013). However, vast tracts of tropical forests, in particular smaller patches, have little or no protection, and tropical deforestation, degradation and fragmentation continue at an ever-increasing rate, thereby acutely threatening the continued provisioning of the ecosystem services (Achard et al. Reference Achard, Beuchle, Mayaux, Stibig, Bodart and Brink2014, Food and Agriculture Organization of the United Nations 2020).
Although deforestation is pronounced throughout the tropics, Africa saw the highest annual rate of net forest loss from 2010 to 2020, with 3.9 million ha lost. Moreover, the rate of net forest loss has increased in every decade since 1990, with concurrent exceptionally high rates of forest fragmentation being measured (Food and Agriculture Organization of the United Nations 2020, Fischer et al. Reference Fischer, Taubert, Müller, Groeneveld, Lehmann, Wiegand and Huth2021). Fragmentation is defined as ‘a landscape-scale process involving both habitat loss and the breaking apart of habitat’, with negative effects on habitat quality and local biodiversity (Fahrig Reference Fahrig2003, Luther et al. Reference Luther, Cooper, Wolfe, Bierregaard, Gonzalez and Lovejoy2020). Conservation measures have generally favoured protecting large forest fragments over small ones, yet studies demonstrate that the conservation value of small forest patches is sometimes remarkably high (Decocq et al. Reference Decocq, Andrieu, Brunet, Chabrerie, De Frenne and De Smedt2016, Abuhay et al. Reference Abuhay, Kassaw, Masresha and Asefa2024). Thus, conservation measures focusing only on large forest patches may result in less than optimal biodiversity outcomes (Riva et al. Reference Riva, Martin, Millard and Fahrig2022). Importantly, many small forest patches have no formal protection status. Small forest patches act as refuges between larger forest fragments, increasing habitat network connectivity (Volenec & Dobson Reference Volenec and Dobson2020, Tiang et al. Reference Tiang, Morris, Bell, Gibbins, Azhar and Lechner2021, Han et al. Reference Han, Wang, Wei, Wang, Shi and Ruckstuhl2022). Moreover, they provide multiple direct and indirect benefits to local communities in the surrounding agricultural areas (Valdés et al. Reference Valdés, Lenoir, De Frenne, Andrieu, Brunet and Chabrerie2020, Baez Schon et al. Reference Baez Schon, Woods, Cardelús and Montagnini2022). For example, on the one hand, they offer provisioning and cultural services such as timber, food and those relating to recreation and spirituality; on the other, their physical and biological characteristics support ecosystem functions that positively influence crop production in the surrounding agricultural lands and increase water quality and availability (Decocq et al. Reference Decocq, Andrieu, Brunet, Chabrerie, De Frenne and De Smedt2016). Ultimately, they contribute to mitigating climate change at a global level by providing carbon co-benefits (Matos et al. Reference Matos, Magnago, Aquila Chan Miranda, de Menezes, Gastauer and Safar2020).
Remnant small forest patches are found extensively throughout Africa, and they provide a wealth of ecosystem services and have biodiversity conservation potential (Neuenschwander et al. Reference Neuenschwander, Sinsin and Goergen2011, Reference Neuenschwander, Bown, Hèdégbètan and Adomou2015, Neuenschwander & Adomou Reference Neuenschwander and Adomou2017). However, they are also experiencing high rates of land-cover and land-use change, deforestation, forest fragmentation and degradation (Ahrends et al. Reference Ahrends, Burgess, Milledge, Bulling, Fisher and Smart2010, Fischer et al. Reference Fischer, Taubert, Müller, Groeneveld, Lehmann, Wiegand and Huth2021, Wingate et al. Reference Wingate, Akinyemi, Iheaturu and Speranza2022, Reference Wingate, Akinyemi and Speranza2023). Indeed, small forest fragments and remnant forest patches are disproportionately impacted by these processes (Hansen et al. Reference Hansen, Wang, Song, Tyukavina, Turubanova, Potapov and Stehman2020, Wingate et al. Reference Wingate, Akinyemi, Iheaturu and Speranza2022). Such patches present a high probability of disappearing and therefore constitute a key research and conservation priority. Furthermore, very small forest patches in West Africa have not been widely mapped or catalogued before and have been largely neglected in regional deforestation studies. Previous work has focused on inventorying remnant forest patches 100–10 000 ha in area (Wingate et al. Reference Wingate, Akinyemi, Iheaturu and Speranza2022, Reference Wingate, Akinyemi and Speranza2023) and on mapping forest fragments at continental scales (Hansen et al. Reference Hansen, Wang, Song, Tyukavina, Turubanova, Potapov and Stehman2020). Consequently, and in response to the pressing need to identify and characterize remnant forest patches before they disappear, this study maps the extent, area change and count in a subset of forest patches, namely those 0.5–100 ha in area and located outside protected areas across part of West Africa. To achieve this, we leveraged the Global Forest Watch (GFW) tree cover dataset from 2000 to 2022 and applied an object-based forest fragment mapping method (Wingate et al. Reference Wingate, Akinyemi, Iheaturu and Speranza2022) to quantify the changes in patch number and area, forest loss rates and trends in small forest patches.
Materials and methods
Study region
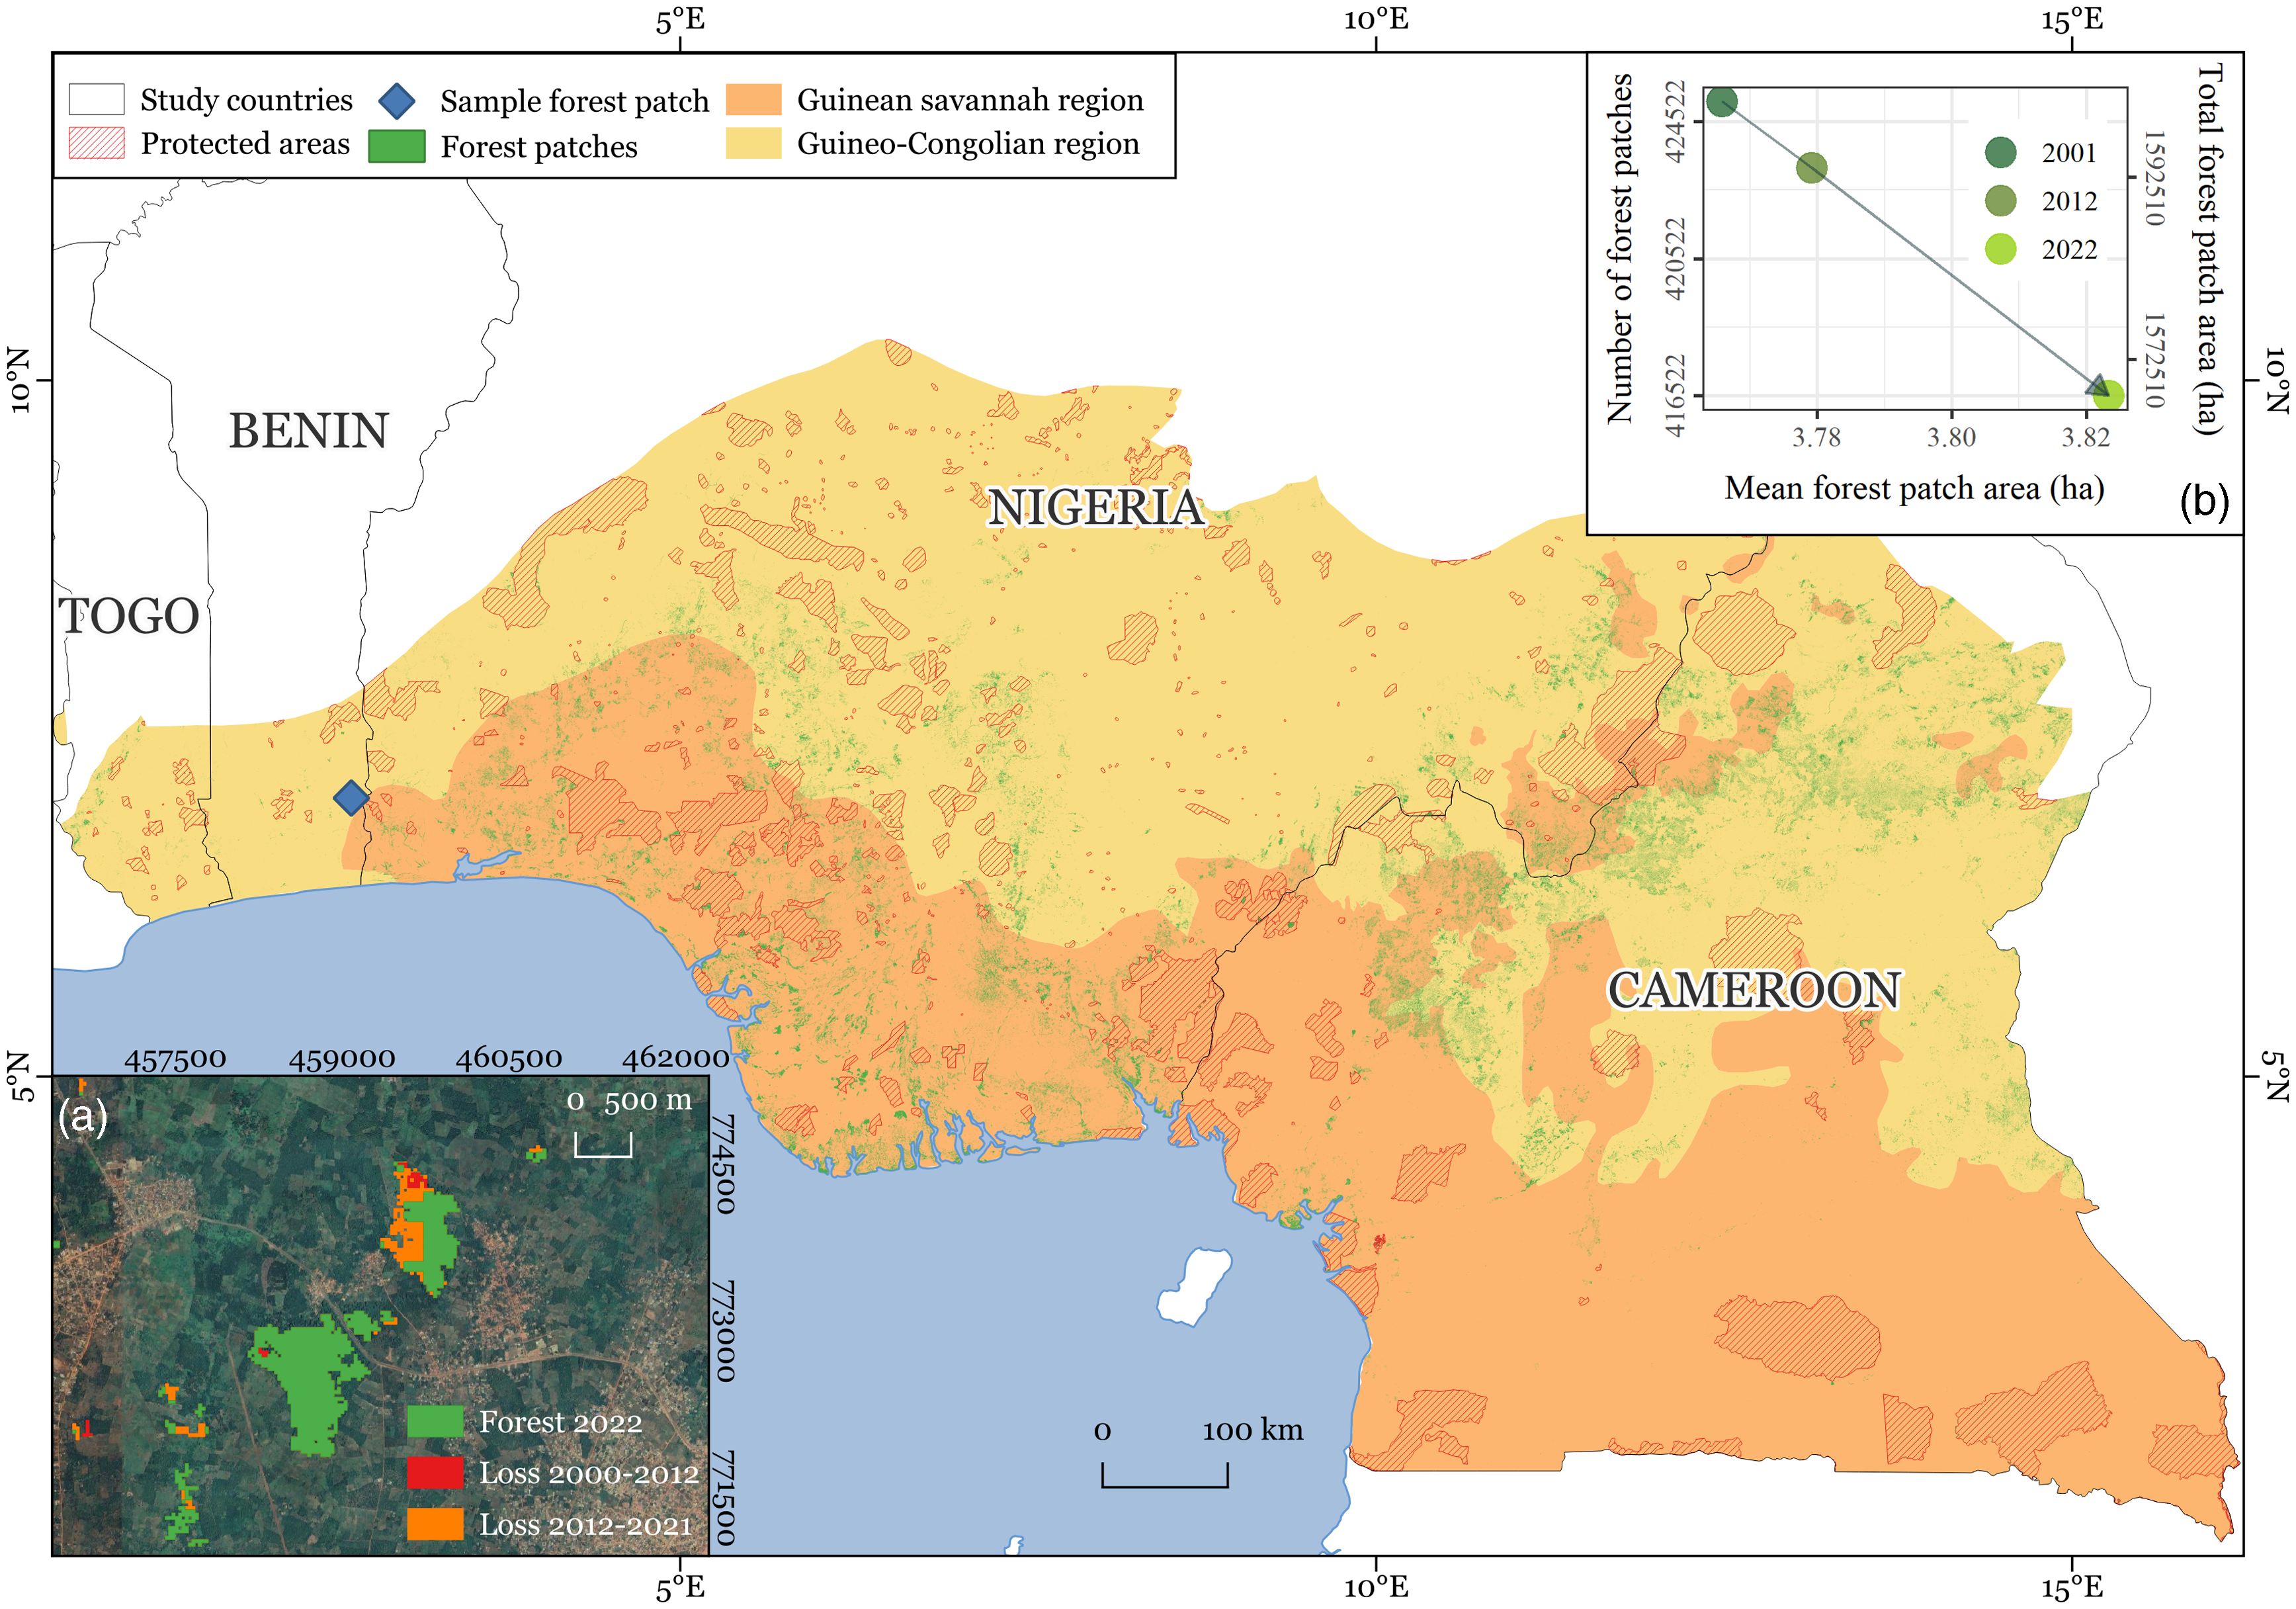
The study region spans the countries of Togo, Benin, Nigeria and Cameroon across the sub-humid Guinean savannah (GS) and humid Guineo-Congolian (GC) bioclimatic regions, covering an area of 835 301 km2 (Fig. 1). It encompasses diverse vegetation types, topographies and ecosystems, ranging from montane forests and savannah to mangrove (Dinerstein et al. Reference Dinerstein, Olson, Joshi, Vynne, Burgess and Wikramanayake2017). The GS bioclimatic region is characterized by a mean annual rainfall of 1200–2200 mm and harbours both seasonally humid and dry deciduous or semi-deciduous forests. Although it receives relatively high rainfall, the region has a distinct dry season of 8 months. The forest canopies are often 20 m high, dense and closed, with a heterogeneous understory; while they are not commonly impacted by seasonal fires, such as in other African bioclimatic regions, they have been widely converted to urban and arable land uses and continue to be heavily affected by land clearing. The current extent of GS forests is very limited; they are highly modified, comprising derived savannah, secondary forests, agricultural and plantation mosaics and gallery forest bordering waterways (Keay Reference Keay1959a, Reference Keay1959b, Cotillon & Tappan Reference Cotillon and Tappan2016). In contrast, the GC bioclimatic region has a mean annual rainfall that varies between 2200 and 5000 mm, which is generally distributed throughout the year or split into two rainy seasons. The region is divided into west and east forests by the Dahomey Gap, where the GS reaches the coast. GC forests are frequently tall (over 60 m high) and dense. The emergent layer is often discontinuous and covers a lower and denser canopy, while the understory holds a wide variety of climbers, epiphytes and herbaceous areas. Historically densely forested, at present only a fraction of the region harbours forest, yet the remnant forest flora constitutes one of the most biodiverse in West Africa (Harrison Church Reference Harrison Church1957, Cotillon & Tappan Reference Cotillon and Tappan2016). Mangroves – coastal forests that grow where sea, fresh water and land join in part of the study area – belong to the planet’s most productive ecosystems and are widespread along the coastline, yet they have experienced severe declines over the past four decades (Corcoran et al. Reference Corcoran, Ravilious and Skuja2007, Cotillon & Tappan Reference Cotillon and Tappan2016).
The study area spanning the West African countries of Togo, Benin, Nigeria and Cameroon within the Guinean savannah and humid Guineo-Congolian bioclimatic regions and encompassing primary and secondary forests outside of protected areas (Hansen et al. Reference Hansen, Potapov, Moore, Hancher, Turubanova and Tyukavina2013, UNEP-WCMC 2019).

Approach
Mapping and change detection
We focused on forest patches 0.5–100 ha in area using the method of Wingate et al. (Reference Wingate, Akinyemi, Iheaturu and Speranza2022), which is based on forest-cover data for the year 2000 and the forest loss data between 2001 and 2022 provided by GFW (Hansen et al. Reference Hansen, Potapov, Moore, Hancher, Turubanova and Tyukavina2013). We differentiated forest patches between primary and secondary forests based on the classification of Turubanova et al. (Reference Turubanova, Potapov, Tyukavina and Hansen2018), and we excluded forests inside protected areas using the World Database on Protected Areas (UNEP-WCMC 2019). Forest loss area was estimated per year for each forest patch by intersecting the GFW band ‘lossyear’ (2001–2022) with our forest patch map of the year 2000. Then, we mapped small forest patches for 2012 and 2022 by subtracting all changes between 2001 and 2012/2022 from the forest patch map of 2000, and we calculated the number, total area and mean area of small forest patches in 2000, 2012 and 2022. We specifically assessed the forest loss and gain associated with a subset of forest patches – namely those outside of protected areas and with an area ranging from 0.5 to 100 ha. In this subset, we found forest gain occurring immediately adjacent to the said forest patches to be negligible (5628 ha, or 0.2% of the total mapped area) – as opposed to forest loss (165 306 ha, or 6% of total mapped area), which was the primary land change; hence, we focus on forest loss. In addition, since the period for which forest gain data exist covers only a fraction of our study period (2000–2012), we opted to refrain from a detailed forest gain analysis. Furthermore, we have specifically not attempted to map new patches that appeared in the landscape between 2000 and 2012 and instead focus on forest loss that occurred in patches that we initially mapped in 2000. The percentage of total forest loss per country and bioclimatic region differentiating between primary and secondary forests was calculated according to Equation 1:
 $${\rm{Percentage}}\;{\rm{forest}}\;{\rm{loss}} = {{\;{\rm{forest}}\;{\rm{patch}}\;{\rm{loss}}\;\left( {2000 - 2022} \right)\;\left( {{\rm{ha}}} \right)} \over {{\rm{sum}}\left( {{\rm{forest}}\;{\rm{patch}}\;{\rm{area}}\;{\rm{in}}\;2000} \right)\; \times \;100}}$$
Validation
We validated the small forest fragments map for the year 2022 by comparing it to the Phased Array L-band Synthetic Aperture Radar (PALSAR) Forest/Non-Forest (FNF) dataset produced for the period 2017–2021 (accuracy: 92.3%; Koyama et al. Reference Koyama, Shimada, Watanabe and Tadono2022). First, we resampled the FNF dataset (25 m resolution) to the spatial resolution of the GFW dataset (30 m), then we merged the classes ’dense forest’ and ’non-dense forest’ into a single class ’forest’, as well as the classes ’non-forest’ and ’water’ into a single ’non-forest’ class. Lastly, we overlaid the small forest fragments map of the year 2022 on the FNF raster and sampled the mode (most frequent) pixel class value. Thus, a given forest patch polygon is assigned to either ’forest’ or ’non-forest’ classes based on the most frequent pixel value. An error matrix compared reference (FNF) and predicted (forest patch map) class values.
Analyses
To identify effects of forest patch size on forest loss and to reduce the spread of the data, we aggregated patches of similar area into size classes, disregarding geographical location and the possible impact of distinct drivers (e.g., distance to roads), as these were already analysed by Wingate et al. (Reference Wingate, Akinyemi, Iheaturu and Speranza2022). Since the forest patch area varies from 0.5 to 100 ha, we created 10–ha size classes (i.e., 0–10 ha, 10–20 ha, etc.). The total forest patch area and absolute and relative forest loss area were calculated within these size classes. Then, we fitted linear regressions with the percentage (relative) and absolute (cumulative) areas of forest change, per size class, as the dependent variables and the mean forest patch area as the independent variable to identify statistical relationships between forest patch size and forest loss. To quantify the variation in the relative forest loss, we computed the 95% confidence interval (CI) for each size class and forest type. Cumulative forest loss and rate of change for each forest type (primary/secondary) and each size class were assessed, and the rate of change was calculated as per Equation 2:
 $${\rm{rate}} = {\rm{ }}{{100 \times \left( {L\; - \;lag\left( L \right)} \right)} \over {lag\left( L \right)}}$$
where L is loss of area given as a percentage of total forest patch area and lag is the previous value (Crawley Reference Crawley2012). Finally, a Mann–Kendall trend analysis was applied to evaluate the trend rate and significance (Hipel & McLeod Reference Hipel and McLeod1994), and an autoregressive integrated moving average (ARIMA) forecast model was used to estimate the loss rate expected over the next 10 years and so provide estimates of the possible future extent of very small forest patches (Hyndman & Khandakar Reference Hyndman and Khandakar2008).
Results
Validation and change detection
The validation method resulted in an overall accuracy of 94%, suggesting that the GFW dataset accurately maps forest fragments of 0.5–100 ha in the study area when compared to the FNF reference dataset (Hansen et al. Reference Hansen, Potapov, Moore, Hancher, Turubanova and Tyukavina2013, Shimada et al. Reference Shimada, Itoh, Motooka, Watanabe, Shiraishi, Thapa and Lucas2014, Congalton & Green Reference Congalton and Green2019).
In 2000, we identified a total of 425 100 patches of continuous forest (tree cover >30%; tree height >5 m) of 0.5–100 ha in area (Fig. 2). This number decreased to 423 163 in 2012 and 416 522 in 2022 (Fig. 2b). Additionally, we found that 2% of patches lost 100% of their area, 6% lost 50% and 70% lost less than 1%. Moreover, the total forest patch area decreased from 1 600 834 ha in 2000 to 1 592 510 ha in 2022, accounting for a total forest loss of 8324 ha, while mean forest patch area increased from 3.76 to 3.82 ha (Fig. 2b).
Results of the forest change analysis showing remaining forest patches (0.5–100 ha) in 2022. (a) A sample of forest patches (green) that have undergone forest loss during the periods 2000–2012 (red) and 2012–2021 (orange). (b) The change in number, total area and mean fragment area of forest patches at three time steps.
Forest patches classed as primary forest constitute only 2% of the total mapped area, with a total number of 5889 fragments (33 710 ha). In contrast, secondary forest patches comprise 98% of the mapped forest patches, with a total of 419 211 in number (1 567 123 ha). Forest loss across both primary and secondary forests showed a significant positive trend (tau = 0.7, p < 0.01; tau = 0.6, p < 0.01, respectively). Secondary forest patches have cumulatively undergone more forest loss (158 661 ha) than primary forest patches (7462 ha).
A total of almost 8% of the mapped forest patch area was lost during 2000–2022, with an annual deforestation rate of 0.34% (including both primary and secondary forests). Of this loss, 7.10% comprised secondary forests, and nearly half of the forest loss area (3.44%) occurred in the 3-year period between 2020 and 2022 (Fig. 3a). Thus, for secondary forests during the 2020–2022 period, a more than sixfold increase in mean forest loss compared to the period 2000–2019 was observed: from 2904 ha (0.18% of mean deforestation rate for the period 2000–2019) to 18 307 ha (0.90% of mean deforestation rate for the period 2020–2022; Fig. 3a).
(a) Annual forest loss (in ha and %); blue dashed lines indicate the mean forest patch loss during the period 2001–2019 (2904 ha, 0.18%) and the annual mean forest patch loss during the period 2020–2022 (18 307 ha, 0.90%). (b) Annual mean forest loss per patch (in ha and %); the blue dashed lines show that, per patch, primary forest patches lose on average more of their area (47%) compared to secondary forests (23%). (c) Forest loss across small forest patches per country and forest type relative to the country’s forest patch area in 2000.

Primary forest patches lost on average a greater proportion of their area (47% yearly average) compared to secondary forest patches (23%; Fig. 3b). The areal loss of secondary forest patches was not proportionately equal in the four countries studied; patches in Benin experienced the highest relative forest loss, followed by Togo. Primary forest loss was less and occurred mainly in Cameroon, constituting 2% of the mapped forest patch area within the country (Fig. 3c).
Applying the forecast model, we found that the rate of annual loss may increase from 1.2% in 2022 to 1.7% in 2032, resulting in a loss of 14% (227 519 ha) of the total mapped forest patch area (2 739 542 ha; Fig. 4).
Annual small forest patch loss rate in the study area may increase from 1.2% to 1.7% in the coming decade, resulting in a 14% loss of forest cover in the small forest patches (0.5–100 ha) of the study area.

Forest patch loss and area
Forest patches in the smallest size class (0.5–10 ha) were the most common, with a total of 387 222 secondary patches (90% of all patches) and 5079 primary patches (1% of all patches). Of these, secondary forest patches spanned 728 938 ha or 26% of the total area, while primary forest patches spanned 10 252 ha or 0.4% of the total area. This smallest size class also showed the highest mean forest loss per patch, both for primary (36%) and secondary (9%) forest types (Fig. 5a). Mean forest loss per patch was inversely correlated with patch size; with increasing patch size both in primary (R2 = 0.50, p = 0.02) and secondary (R2 = 0.47, p = 0.03) forests, a decrease in the mean forest loss per patch was observed (Fig. 5a).
(a) Mean relative (%) forest patch loss between 2000 and 2022 in relation to mean patch area (ha) per size class; on average, the smallest primary forest patches (0.5–10 ha) have lost almost 40% of their area. (b) Similarly, cumulative forest patch loss (ha) is greatest for the smallest secondary forest patch class.

The total area of forest loss was also highest in the smallest forest patch size classes and was inversely correlated with patch size for both primary (R2 = 0.49, p = 0.025) and secondary (R2 = 0.51, p = 0.021) forests (Fig. 5b). Forest loss was exceptionally high in secondary forests of 0.5–10 ha (59 694 ha or 48% of the total loss area); in comparison, primary forests lost comparatively less (3096 ha or 2.5% of total loss area). Lastly, the number and area of patches for each size class declined slightly, with the largest decrease occurring in the smallest class, which lost 8096 ha and 8568 patches over the 2000–2022 period (see Supplementary Materials).
Discussion
The overall accuracy statistic suggests that forest patches are accurately mapped when compared to the FNF dataset (Hansen et al. Reference Hansen, Potapov, Moore, Hancher, Turubanova and Tyukavina2013, Shimada et al. Reference Shimada, Itoh, Motooka, Watanabe, Shiraishi, Thapa and Lucas2014). No attempt was made to distinguish natural forests from plantations or agroforestry; however, agroforestry could represent a portion of the total number of patches (Mbow et al. Reference Mbow, Smith, Skole, Duguma and Bustamante2014). Agroforestry areas are recognized as biodiversity reservoirs supporting tree biodiversity richness and climate change mitigation (Fifanou et al. Reference Fifanou, Ousmane, Gauthier and Brice2011, Mbow et al. Reference Mbow, Smith, Skole, Duguma and Bustamante2014). Hence, agroforestry is assumed to provide similar ecosystem services and functions as natural forests and to contribute to improving biodiversity in agricultural landscapes (Udawatta et al. Reference Udawatta, Rankoth and Jose2019).
Smallholder palm oil plantations (sometimes managed as agroforestry) could also represent a portion of the total number of the patches mapped. In West Africa, almost 70% of palm oil production stems from smallholder farming (parcels <50 ha), which are partly deforestation-free (Meijaard et al. Reference Meijaard, Garcia-Ulloa, Sheil, Wich, Carlson, Juffe-Bignoli and Brooks2018, Descals et al. Reference Descals, Wich, Meijaard, Gaveau, Peedell and Szantoi2021). Several studies suggest that palm oil smallholdings may harbour more species diversity than large-scale palm oil holdings (but still less than natural forests), and their species diversity may be enhanced by neighbouring forests (Azhar et al. Reference Azhar, Saadun, Puan, Kamarudin, Aziz, Nurhidayu and Fischer2015, Meijaard et al. Reference Meijaard, Garcia-Ulloa, Sheil, Wich, Carlson, Juffe-Bignoli and Brooks2018).
The annual forest loss associated with small forest patches mapped in this study was disproportionally high in the last 3 years. It accounted for over a third of the deforestation in the past 22 years. This period coincides with the possible effects of the COVID-19 pandemic (2020–2022) and the consequent global financial crisis, which may have indirectly driven more deforestation. Indeed, Antonarakis et al. (Reference Antonarakis, Pacca and Antoniades2022) concluded that financial crises lead to important changes in forest dynamics. Brancalion et al. (Reference Brancalion, Broadbent, De-Miguel, Cardil, Rosa and Almeida2020) examined GFW deforestation alerts the month after confinement measures were implemented all over the tropics in 2020 and found them to be two times more frequent than in the same months in 2019 before the pandemic. Similarly, in Cameroon, Indonesia and Ecuador, elevated deforestation during periods of financial crisis has been attributed to the need for increased food and income security (Mertens et al. Reference Mertens and Lambin2000, Sunderlin et al. Reference Sunderlin, Ndoye, Bikie, Laporte, Mertens and Pokam2000, Curatola Fernández et al. Reference Curatola Fernández, Obermeier, Gerique, Lopez Sandoval, Lehnert, Thies and Bendix2015). Moreover, Nolte et al. (Reference Nolte, Sipangule and Wendt2022) found increased expansion of agriculture, which may signify more deforestation occurring, across eight African countries (2020–2021) (Nolte et al. Reference Nolte, Sipangule and Wendt2022). When comparing our results to national deforestation rates (including all of the forested area and not only the small forest patches) from the GFW (Fig. S1), we find that deforestation has increased annually, although there is not an exceptionally high peak in the 2020–2022 period, as with our small forest patch dataset. Therefore, our results suggest that the cause of this disproportional deforestation rate may lie in the increased agricultural expansion and deforestation by smallholders during the pandemic; however, these results require further research.
Forest patches decreased in number (loss of 2%) and area (loss of 1%) over the 22 years, and predictions for 2032 estimate a loss of 14% from the initial cover in 2000. This could result in substantial negative impacts on biodiversity and climate. Norris et al. (Reference Norris, Asase, Collen, Gockowksi, Mason, Phalan and Wade2010) have related a reduction in plant, invertebrate and vertebrate species to a decrease in forest cover in West Africa; correspondingly, the region is particularly susceptible to changing rainfall patterns – with a decline of 30% of its forest cover, the consequent reduction in precipitation could drastically impact agriculture (Duku & Hein Reference Duku and Hein2021). What is more, smaller forests are more impacted by edge effects and loss of connectivity (Marjakangas et al. Reference Marjakangas, Abrego, Grøtan, de Lima, Bello and Bovendorp2020, Hending et al. Reference Hending, Randrianarison, Andriamavosoloarisoa, Ranohatra-Hending, Holderied, McCabe and Cotton2023).
We show that the main change dynamic occurring as a result of continuing forest loss is the disappearance of small patches and the persistence of large ones, thereby decreasing the total area of forest but concurrently increasing the average patch area. However, large forest patches might also fragment into smaller ones, hence increasing the number of patches and simultaneously decreasing the total size of the forested area. Furthermore, we found that secondary forest patches accounted for 98% of all the fragments; the smallest class (0.5–10 ha) was the most common and underwent the most significant mean relative forest loss for primary (36%) and secondary (9%) forest types. Moreover, deforestation was inversely correlated with the patch size. Wingate et al. (Reference Wingate, Akinyemi, Iheaturu and Speranza2022) and Hansen et al. (Reference Hansen, Wang, Song, Tyukavina, Turubanova, Potapov and Stehman2020) similarly identified greater proportional change occurring in smaller forest fragments. Forest loss associated with small patches was not similar in the different countries; Benin and, to a lesser extent, Togo were the most impacted by forest patch loss. We tentatively attribute this to these countries having fewer forest resources and higher population densities, and therefore we assume that their forest patches are under greater extractive pressures (Nagel et al. Reference Nagel, Sinsin and Peveling2004, Cotillon & Tappan Reference Cotillon and Tappan2016).
Primary forest patches underwent proportionally more forest loss, losing almost half of their area annually. These results imply that primary forest patches are preferentially deforested compared to those of secondary forests, possibly because they provide more forest and timber resources (Turubanova et al. Reference Turubanova, Potapov, Tyukavina and Hansen2018). However, only a spatiotemporal analysis of possible driving forces could reveal whether the geographical setting of the primary forests and their deforestation history are capable of explaining the higher deforestation rates. These results are in contrast to those of Wang et al. (Reference Wang, Ziv, Adami, de Almeida, Antunes and Coutinho2020), who found that for the Brazilian Amazon secondary forests were more deforested than primary forests; they concluded that the stronger protection of primary forests possibly explained these results. Since in our study area there is no formal protection of forest patches, our results serve to highlight that small primary forest patches should be prioritized for conservation as they are more threatened by deforestation and harbour higher levels of biodiversity (Turubanova et al. Reference Turubanova, Potapov, Tyukavina and Hansen2018). Importantly, our results demonstrate that the deforestation of small forest patches is accelerating and particularly impacting very small patches. We found that forest loss associated with forest patches increases with decreasing patch size. Hence, given the importance of small forest patches for conservation (Wintle et al. Reference Wintle, Kujala, Whitehead, Cameron, Veloz and Kukkala2019), these results underline the urgent need to implement sustainable management and conservation strategies to preserve the remaining small forest fragments before they entirely disappear.
Conclusion
We found that forest patches of 0.5–100 ha in area outside of protected areas in part of West Africa are widespread and have been heavily impacted by deforestation over the 2000–2022 period. Their total number and area decreased concurrently with an increased rate of forest loss, with 8% of the total forest patch area lost to deforestation during the study period and almost half of this occurring in the last 3 years, coinciding with the COVID-19 pandemic period. Moreover, we establish that forest loss particularly impacted the smaller forest patches, with 2% losing 100% of their area. Importantly, primary forest patches lost on average almost half of their area – twice as much as secondary forests – implying that deforestation preferentially occurs in primary forest patches. Our results highlight that if forest loss continues to increase, 14% of forest patch area may have disappeared by the next decade, stressing the need for measures to ensure their conservation.
Supplementary material
For supplementary material accompanying this paper, visit https://doi.org/10.1017/S0376892924000171.
Acknowledgements
We are grateful to Sandro Makowski Giannoni, Georges Alex Agonvonon, the editor and the reviewers for their valuable comments on the manuscript.
Financial support
This project received funding from the European Research Council (ERC) under the European Union’s Horizon 2020 research and innovation programme (grant agreement No 101001200 – SUSTAINFORESTS).
Competing interests
The authors declare none.
Ethical standards
None.


 Open access