

1 Introduction
One of the main challenges in comparative studies on populism is how to measure it across a large number of cases, including several countries and parties within countries. Previous literature has explored this possibility using different methods, textual analysis among them (Armony Reference Armony2005; Hawkins Reference Hawkins2009; Jagers and Walgrave Reference Jagers and Walgrave2007; Ribera Payá Reference Ribera Payá2019; Rooduijn and Pauwels Reference Rooduijn and Pauwels2011; Wettstein et al. Reference Wettstein2020). The advent of machine learning has cleared the way for further research in this direction, allowing for a faster processing of data and more accurate predictions. Text-as-data approaches based on automated tools are useful for investigating differentiated political questions because of the possibility of analyzing large quantities of data with fewer resources, inferring actors’ positions directly from the texts and obtaining more replicable results. Given these features, an increasing number of studies on comparative populism have relied on computer-assisted textual analysis through supervised learning (Hawkins et al. Reference Hawkins, Carlin, Littvay and Kaltwasser2018). The advantages of using text-as-data in the measurement of populism are several. For example, they allow focusing on the elites and their ideas; measuring populism across a large number of cases, within and between countries; and obtaining continuous populism measures which, unlike dichotomous ones, better account for the multi-dimensionality of populism and differentiate between its degrees (Meijers and Zaslove Reference Meijers and Zaslove2020a). However, most of the methods proposed to date are resource-intensive or suffer from structural limitations, particularly when they heavily rely on the process of human annotation for the analysis of vast corpora. Valuable contributions, such as expert surveys or extensive human-coded works, are expensive from an economic perspective and for time needed to obtain the results. Consequently, these contributions might be inadequate to seize the rapid changes and transformations of the party landscape.
Here, we propose a method for measuring populism based on Supervised Machine Learning (Hindman Reference Hindman2015; Ho Reference Ho1995), drawing on techniques commonly used in Natural Language Processing. We show that the use of text data (Laver, Benoit, and Garry Reference Laver, Benoit and Garry2003) and machine learning can significantly improve research in this field and reduce limitations inherent in human-coding techniques. Focusing on six western European countries that exhibit a long-standing tradition of populist parties (Italy, France, Spain, Germany, Austria, and the Netherlands), we used a Random Forest classification algorithm (Breiman Reference Breiman2001) to derive a score of populism for every party observed. To obtain the score, we performed text analysis on $243,659$
sentences drawn from
$243,659$
sentences drawn from $268$
national manifestos, mainly from 2002 to 2019. We downloaded
$268$
national manifestos, mainly from 2002 to 2019. We downloaded $229$
manifestos from the Manifesto Project Database (MPD; Krause et al. Reference Krause2018). To have a more accurate representation of the party landscapes in the electoral rounds, we integrated the MPD corpus with
$229$
manifestos from the Manifesto Project Database (MPD; Krause et al. Reference Krause2018). To have a more accurate representation of the party landscapes in the electoral rounds, we integrated the MPD corpus with $39$
extra manifestos taken from parties’ and governments’ official sources.
$39$
extra manifestos taken from parties’ and governments’ official sources.
The use of electoral manifestos for measuring populism is not uncontested. One of the standard arguments against their use is that they might show lower levels of populist rhetoric relative to other types of text, for example, party magazines (Pauwels Reference Pauwels, Heinisch, Holtz-Bacha and Mazzoleni2017). However, their use is grounded in the literature (e.g., (Rooduijn and Pauwels Reference Rooduijn and Pauwels2011; Rooduijn and Akkerman Reference Rooduijn and Akkerman2017) and meets some practical needs. Even if party manifestos are seldom widely read, they are official documents and offer the advantage of exploring parties’ discourses as institutions, rather than focusing on leaders who might promote narratives that significantly differ from those of their parties (Hawkins et al. Reference Hawkins, Carlin, Littvay and Kaltwasser2018). Furthermore, they convey party arguments in given times (Rooduijn and Pauwels Reference Rooduijn and Pauwels2011) and show the type of engagement that parties have with their electorates. They show how political actors use economic, social, and psychological crises as leverage for their electoral campaigns and set the boundaries between what parties have promised to do and what they have done. Not only are they the documents that summarize party stances while addressing a broader audience, but they are also the documents that (besides the speeches) are produced and made public with similar goals across cases (Hawkins et al. Reference Hawkins, Carlin, Littvay and Kaltwasser2018). Differently from other types of text, like speeches, manifestos are also easy to access. The facility with which to collect them and their other characteristics, above all the comparability of the textual source, makes them suitable for comparative analyses that aim to obtain a refined time line of party positions (Klemmensen, Hobolt, and Hansen Reference Klemmensen, Hobolt and Hansen2007), clearing the way for consistent, valid, and reliable temporal and spatial comparisons of levels of populism across parties (Hawkins et al. Reference Hawkins, Aguilar, Silva, Jenne, Kocijan and Kaltwasser2019).
Due to the absence of a monolingual comprehensive corpus, we trained six different models, one for each country. The algorithm was trained by assigning labels to chunks of text depending on whether they were drawn from manifestos of populist or nonpopulist parties. For our working definition of populism, we adhered to the broad ideational approach (Hawkins and Kaltwasser Reference Hawkins and Kaltwasser2017; Hawkins and Littvay Reference Hawkins and Littvay2019) and defined “populists” as those parties that understand politics as a Manichean struggle between a reified will of the people and a corrupt, conspiring elite (Hawkins Reference Hawkins2009). The algorithm was trained on $70\%$
of all the sentences. By applying it to the remaining
$70\%$
of all the sentences. By applying it to the remaining $30\%$
, we obtained a score ranging from
$30\%$
, we obtained a score ranging from $0$
to
$0$
to $1$
, which measured the probability that sentences that were taken from the manifestos of generic parties belong to those of prototypical populist parties in their countries. Put another way, the score measures how (dis)similar manifestos of nonpopulist parties are to those of populist parties in the same nation. When validating this method, we illustrated that the score is strongly correlated with key attributes of populism (e.g., anti-elitism and people centrism) drawn from the 2017 Chapel Hill Expert Survey (CHES; Polk et al. Reference Polk2017) and the 2018 Populism and Political Parties Expert Survey (POPPA; Meijers and Zaslove Reference Meijers and Zaslove2020b). We also validated the score against the latent populism variable in the POPPA data, constituted by five components of populism identified by the ideational approach (anti-elitism, people-centrism, Manichean worldview, general will, and indivisible people) as suggested by Meijers and Zaslove (Reference Meijers and Zaslove2020a). We further validated the method using the Global Populism Database (GPD; Hawkins et al. Reference Hawkins, Aguilar, Silva, Jenne, Kocijan and Kaltwasser2019). The significant correlations that we obtained show that the score captures the main dimensions of populism and can, thus, be used as a proxy of parties’ levels of populism. Finally, to further assess the robustness of the method and whether it can be applied to different textual sources (or datasets) without leading to substantially different outcomes, we repeated the analysis for Italy only, building a score using
$1$
, which measured the probability that sentences that were taken from the manifestos of generic parties belong to those of prototypical populist parties in their countries. Put another way, the score measures how (dis)similar manifestos of nonpopulist parties are to those of populist parties in the same nation. When validating this method, we illustrated that the score is strongly correlated with key attributes of populism (e.g., anti-elitism and people centrism) drawn from the 2017 Chapel Hill Expert Survey (CHES; Polk et al. Reference Polk2017) and the 2018 Populism and Political Parties Expert Survey (POPPA; Meijers and Zaslove Reference Meijers and Zaslove2020b). We also validated the score against the latent populism variable in the POPPA data, constituted by five components of populism identified by the ideational approach (anti-elitism, people-centrism, Manichean worldview, general will, and indivisible people) as suggested by Meijers and Zaslove (Reference Meijers and Zaslove2020a). We further validated the method using the Global Populism Database (GPD; Hawkins et al. Reference Hawkins, Aguilar, Silva, Jenne, Kocijan and Kaltwasser2019). The significant correlations that we obtained show that the score captures the main dimensions of populism and can, thus, be used as a proxy of parties’ levels of populism. Finally, to further assess the robustness of the method and whether it can be applied to different textual sources (or datasets) without leading to substantially different outcomes, we repeated the analysis for Italy only, building a score using $2,151$
sentences drawn from speeches of Italian leaders in electoral campaigns, talk shows, and TV programs from 2006 to 2019, and another score using the same manifesto dataset where sentences were manually coded as populist or not.
$2,151$
sentences drawn from speeches of Italian leaders in electoral campaigns, talk shows, and TV programs from 2006 to 2019, and another score using the same manifesto dataset where sentences were manually coded as populist or not.
Our method addresses four main issues associated with measuring populism across parties. First, it allows for the measurement of a great selection of parties without resource-intensive human-coding processes. Second, it ensures its measurement across space and over time, allowing for comparative temporal and spatial analyses (however, based on contemporary classifications). Third, as a continuous measure, it allows for obtaining more accurate analyses of the party landscape, reducing the risk of classifications that could be arbitrary (Meijers and Zaslove Reference Meijers and Zaslove2020a). Finally, unlike other more resource-intensive methods, it easily allows for obtaining updated results every time that a new party enters the political arena or researchers want to measure if (and to what extent) a party is populist or became “more” populist over time.
To show how the score can be applied, we studied trends across countries and over time using average levels of populism from the early 2000s for nearly two decades. Results show that the average amount of populism has significantly increased in Italy, whereas other countries show weaker growth or uneven trends. Our results suggest that textual data are a promising tool for expanding political research possibilities on measuring populism and its trajectories.
The paper develops as follows: in Section 2, we introduce the literature on populism and its measurement. In Section 3, we describe the datasets used to train the Random Forest algorithm. In Section 4, we describe how we trained the algorithm, the preprocessing procedure of the data, the algorithm accuracy, and the final derivation of the score. In Section 5, we validate the score, comparing it with expert-surveys’ scores and other text-based measures of populism. We discuss the possibility of using different datasets (political speeches and manually coded data) for the score derivation. Finally, we show how it can be used to describe countries’ temporal evolution of populism levels.
2 Populism and Its Measurement
The issue of defining populism has been the core of several studies, each of them highlighting the difficulty in finding a shared conceptualization of this phenomenon. The unclear nature of this term has led to an abundance of definitions in books, papers, and articles (for an extensive review on this, see Gidron and Bonikowski (Reference Gidron and Bonikowski2013) and Hawkins et al. (Reference Hawkins, Carlin, Littvay and Kaltwasser2018)). While some of them pivot around organizational features such as strong leadership or top-down mobilization (Weyland Reference Weyland2001), others highlight the centrality of economic aspects, for example, the promotion of unsustainable redistributive policies (Acemoglu, Egorov, and Sonin Reference Acemoglu, Egorov and Sonin2013; Guiso et al. Reference Guiso, Herrera, Morelli and Sonno2017) or discursive elements such as the presence of a moral and Manichean language nourishing people’s opposition against the elite (Mudde Reference Mudde2004). A common approach to the definition of populism is the “ideational approach.” It sees populism as a set of ideas understanding politics as a Manichean struggle between a reified will of the people and a conspiring elite (Hawkins Reference Hawkins2009; Hawkins et al. Reference Hawkins, Carlin, Littvay and Kaltwasser2018). It entails the combined presence of three features (Hawkins and Kaltwasser Reference Hawkins and Kaltwasser2017): the Manichean and moral cosmology, the depiction of the people as homogeneous and virtuous, and the elite’s depiction as selfish and corrupt (Hawkins et al. Reference Hawkins, Carlin, Littvay and Kaltwasser2018). The simplicity of populism’s set of ideas allows it to adapt to different contexts. Accordingly, several “varieties” of populism develop based on the most relevant social grievances politicized by populist forces in each society (Caiani and Graziano Reference Caiani and Graziano2019; Hawkins and Kaltwasser Reference Hawkins and Kaltwasser2017). Consistently, with the ideational approach, we considered populism as a set of ideas expressed through political texts (e.g., manifestos or speeches), which exalt popular sovereignty and understand the political field as a struggle between “the people” and “the elite.” This definition rests on the assumptions that parties’ populism and its levels can be assessed via textual analysis on political corpora (Bonikowski and Gidron Reference Bonikowski and Gidron2016; Deegan-Krause and Haughton Reference Deegan-Krause and Haughton2009; Hawkins Reference Hawkins2009) and are not necessarily stable. There can be substantial variation in the presence of populist claims in different temporal and spatial settings. This means that political actors might not always exhibit the same levels of populism over time.
2.1 Measuring Populism with Textual Analysis
Extant literature has made extensive use of texts to investigate differentiated political questions, including inferring parties and leaders’ political positions. Laver et al. (Reference Laver, Benoit and Garry2003) and Slapin and Proksch (Reference Slapin and Proksch2008) estimated political positions using word frequencies in party manifestos. Stewart and Zhukov (Reference Stewart and Zhukov2009) used public statements by Russian leaders to understand whether military or political elites influence Russia’s decisions to intervene in neighboring countries. Eggers and Spirling (Reference Eggers and Spirling2011) relied on parliamentary debates to analyze exchanges among politicians in the British House of Commons. Debus and Gross (Reference Debus and Gross2016) inferred local actors’ policy preferences based on information in local parties’ manifestos. Given the advantages of adopting a text-as-data approach (e.g., the possibility of analyzing large quantities of data with fewer resources, inferring actors’ positions directly from their texts, and obtaining more replicable results), it is not astonishing that textual analysis is increasingly used to study (and measure) populism across parties. Researchers have relied on electoral manifestos, blogs, websites, leaders’ tweets, speeches, posts, and newspapers to infer and quantify parties’ amount of populism (Aslanidis Reference Aslanidis2018; Bonikowski and Gidron Reference Bonikowski and Gidron2016; Bracciale and Martella Reference Bracciale and Martella2017; Engesser et al. Reference Engesser, Ernst, Esser and Büchel2017; Hawkins et al. Reference Hawkins, Aguilar, Silva, Jenne, Kocijan and Kaltwasser2019; Hawkins, Riding, and Mudde Reference Hawkins, Riding and Mudde2012; Herkman and Matikainen Reference Herkman, Matikainen, Tumber and Waisbord2019; Jagers and Walgrave Reference Jagers and Walgrave2007; Stulik Reference Stulik2019).
The reasons for supporting the use of textual analysis for measuring populism are at least two. First, it allows for focusing on the elites and their ideas, and, second, it allows for measuring populism across a large number of cases, within and between countries. However, notwithstanding the relevant achievements of some of the methodological contributions proposed to date, some of them have structural limitations, particularly when they heavily rely on the process of human annotation for the analysis of vast corpora. Reducing biases related to evaluations of individual readers (Ray Reference Ray1999) and ensuring intercoder reliability requires the action of numerous coders involved in resource-intensive coding processes, and this might not always be the case. In dictionary-based approaches, choosing one dictionary or another can lead to substantially different results (Aslanidis Reference Aslanidis2018), and even establishing whether the dictionary is valuable or not is far from easy (Grimmer and Stewart Reference Grimmer and Stewart2013).
Furthermore, the nature of comparative analyses involves multilingual datasets, and the coding of such extensive corpora can hardly be done by one or two researchers alone. The advent of automated text methods might help overcome some of these limitations, such as allowing for the analysis of extensive collections of text with limited resources and in a short time (for a discussion and comparison of these techniques, see Wilkerson and Casas (Reference Wilkerson and Casas2017)). The cross-fertilization between political science and Natural Language Processing (or related fields) has already shown its potentialities. For example, Born and Janssen (Reference Born and Janssen2020) used computational linguistics and computer science approaches to analyze MPs’ speeches and infer their positions by estimating distance measures between speeches. Gross and Jankowski (Reference Gross and Jankowski2020) relied on semi-automated content analysis techniques to detect dimensions of political conflict at the local German level using local manifestos. A valuable contribution that shows the potentialities of using automated text analysis for measuring populism comes from Hawkins and Castanho Silva (Hawkins et al. Reference Hawkins, Carlin, Littvay and Kaltwasser2018). They used machine learning techniques to perform supervised classification of 154 documents comprised of speeches and manifestos using “holistic grading” for training the algorithm (Hawkins Reference Hawkins2009). Holistic grading is a human-based approach that aims to evaluate the text as a whole and is used in educational psychology for assessing students’ writing (White Reference White1985). The statistical model they developed for analyzing texts is based on a comparison of word frequencies; it weights the words that predict whether a document should be classified as populist or not. After comparing results with those obtained via human coding, they concluded that computerized text analysis could potentially be successful in identifying populism provided that there are bodies of data large enough to train the models (Hawkins et al. Reference Hawkins, Carlin, Littvay and Kaltwasser2018).
3 The Dataset
The dataset includes $268$
electoral manifestos from
$268$
electoral manifestos from $99$
parties with a total of
$99$
parties with a total of $243,659$
sentences. We downloaded
$243,659$
sentences. We downloaded $229$
manifestos from the MPD (Krause et al. Reference Krause2018) and integrated the corpus with
$229$
manifestos from the MPD (Krause et al. Reference Krause2018) and integrated the corpus with $39$
extra manifestos taken from parties’ and governments’ official sources to have a more accurate representation of the party landscapes in the electoral rounds. Due to the uneven availability of data and the difficulty in integrating it with new manifestos, not all countries have the same number of electoral rounds, although a minimum of three waves is ensured to improve temporal comparison. For instance, Italian manifestos cover the period from 2006 to 2018, Dutch manifestos from 2002 to 2017, and Spanish manifestos from 2004 to 2019. We did not control for manifesto length, although it can be very heterogeneous from one party to another, and kept all the sentences included in the manifestos to improve the training. For information about the country selection process, see Section A.1 in the Supplementary Material.
$39$
extra manifestos taken from parties’ and governments’ official sources to have a more accurate representation of the party landscapes in the electoral rounds. Due to the uneven availability of data and the difficulty in integrating it with new manifestos, not all countries have the same number of electoral rounds, although a minimum of three waves is ensured to improve temporal comparison. For instance, Italian manifestos cover the period from 2006 to 2018, Dutch manifestos from 2002 to 2017, and Spanish manifestos from 2004 to 2019. We did not control for manifesto length, although it can be very heterogeneous from one party to another, and kept all the sentences included in the manifestos to improve the training. For information about the country selection process, see Section A.1 in the Supplementary Material.
Building an alternative corpus comprising leaders’ speeches would be an advancement, given that populism can also vary across different types of texts (Hawkins and Littvay Reference Hawkins and Littvay2019). This instability, or perhaps document specificity, stands out as a significant weakness of textual approaches to the measurement of populism (Zaslove and Meijers Reference Zaslove and Meijers2019), and cross-comparisons between speeches and manifestos could yield relevant insights into this issue. Indeed, for Italy only, we also had a corpus of $2,151$
sentences drawn from speeches of Italian leaders in electoral campaigns, talk shows, and TV programs from 2006 to 2019. We used the speech corpus to compare the method to one using different textual sources.Footnote
1
$2,151$
sentences drawn from speeches of Italian leaders in electoral campaigns, talk shows, and TV programs from 2006 to 2019. We used the speech corpus to compare the method to one using different textual sources.Footnote
1
3.1 Data Processing
We prepared the dataset following standard procedures in automated text analysis (for more details on preprocessing, see Kannan and Gurusamy (Reference Kannan and Gurusamy2014)). We split each national corpus into sentences according to the structure of the electoral programs and the language. Sentences were preprocessed, turning all words to lowercase, and removing punctuation, numbers, and stop words (e.g., and, but, or, and that). We stemmed the remaining words and removed unnecessary space between words. We then converted each sentence into a “bag-of-words,” in which the words’ order is irrelevant. A bag-of-words is a vector $X= [X_{1}\dots X_{N}]$
assigned to each sentence, where N is the total number of words in the manifestos of a selected country. Each element
$X= [X_{1}\dots X_{N}]$
assigned to each sentence, where N is the total number of words in the manifestos of a selected country. Each element $X_{i}$
corresponds to a specific word, being
$X_{i}$
corresponds to a specific word, being $X_{i} = 1$
if the word is present in the sentence and
$X_{i} = 1$
if the word is present in the sentence and $X_{i} = 0$
otherwise. We used the bag-of-words vectors as input features of the Random Forest to discriminate between “labels” assigned to each sentence. We gave the label
$X_{i} = 0$
otherwise. We used the bag-of-words vectors as input features of the Random Forest to discriminate between “labels” assigned to each sentence. We gave the label $Y=1$
to all the sentences belonging to manifestos of parties recognized as populist in the PopuList classification (https://popu-list.org/; Rooduijn et al. Reference Rooduijn2019). We also gave the label
$Y=1$
to all the sentences belonging to manifestos of parties recognized as populist in the PopuList classification (https://popu-list.org/; Rooduijn et al. Reference Rooduijn2019). We also gave the label $Y=1$
to all the sentences belonging to Power to People (PaP) in Italy, a newly emerged radical left-wing party, which exhibits some populist features in a country where all the pre-existing populist parties lean toward other ideological alignments. We gave the label
$Y=1$
to all the sentences belonging to Power to People (PaP) in Italy, a newly emerged radical left-wing party, which exhibits some populist features in a country where all the pre-existing populist parties lean toward other ideological alignments. We gave the label $Y=0$
to all sentences belonging to manifestos of parties not recognized as populist, for example, the Italian Democratic Party (PD), the French Republicans (LR), the Spanish People’s Party (PP), the German Christian Democratic Union (CDU), the Austrian Social Democratic Party (SPÖ), and the Dutch People’s Party for Freedom and Democracy (VVD). At this stage, we excluded from the data the manifestos of those parties that are ambiguously populist over time or are considered as populist only in some classifications, for example, Forward Italy (FI), the New Anti-Capitalist Party (NPA), Citizens (C’s), Peter Pilz List (Jetzt), and Denk.Footnote
2
Table 1 shows the fraction of sentences belonging to populist manifestos (i.e., labeled as
$Y=0$
to all sentences belonging to manifestos of parties not recognized as populist, for example, the Italian Democratic Party (PD), the French Republicans (LR), the Spanish People’s Party (PP), the German Christian Democratic Union (CDU), the Austrian Social Democratic Party (SPÖ), and the Dutch People’s Party for Freedom and Democracy (VVD). At this stage, we excluded from the data the manifestos of those parties that are ambiguously populist over time or are considered as populist only in some classifications, for example, Forward Italy (FI), the New Anti-Capitalist Party (NPA), Citizens (C’s), Peter Pilz List (Jetzt), and Denk.Footnote
2
Table 1 shows the fraction of sentences belonging to populist manifestos (i.e., labeled as $Y=1$
). This fraction is typically around
$Y=1$
). This fraction is typically around $0.2$
. Finally, we divided each national dataset into two parts, one used for training and validation and the other for testing. For every country,
$0.2$
. Finally, we divided each national dataset into two parts, one used for training and validation and the other for testing. For every country, $70\%$
of the sentences were used for training and validation to let the model learn to make the prediction and tune its hyperparameters using K-Fold cross-validation, and the remaining
$70\%$
of the sentences were used for training and validation to let the model learn to make the prediction and tune its hyperparameters using K-Fold cross-validation, and the remaining $30\%$
was used to test its predictive power on out-of-sample data and to build the score.
$30\%$
was used to test its predictive power on out-of-sample data and to build the score.
Details concerning the area under the receiver operating characteristic (AuROC) levels and F1-scores for validation and testing, and the number of sentences and the fraction of sentences belonging to populist manifestos per each country. In the case of validation, the values shown represent the mean and standard deviations of the AuROC over the different split of the K-Fold cross-validation.

4 Methods
For the score derivation, we resorted to a classification algorithm capable of discriminating between sentences belonging to populist or nonpopulist parties’ manifestos of a given country. The final party score is the fraction of its manifesto’s sentences that the classifier considers as belonging to a prototypically populist party manifesto in its nation. The classification algorithm we adopted was the Random Forest algorithm (Breiman Reference Breiman2001), which offers the advantage of ensuring accurate predictions in the case of nonlinear relationships (McAlexander and Mentch Reference McAlexander and Mentch2020). This characteristic has supported its use for casting predictions within many topics, including voting behavior, partisanship, and political sentiments (Ansari et al. Reference Ansari, Aziz, Siddiqui, Mehra and Singh2020; Bindi et al. Reference Bindi2018; Bustikova et al. Reference Bustikova, Siroky, Alashri and Alzahrani2020). We show a synthetic representation of the score computation’s procedure in Figure A in the Supplementary Material. As the choice of the Random Forest algorithm is arbitrary, we show some results also for other classification algorithms, namely a Logistic Regression, a Feedforward Neural Network, and a Gradient Boosting algorithm.
4.1 Training of the Algorithm
In the absence of a monolingual corpus, we performed separate training for each country, obtaining six different models. With the labeled text data, we built models capable of assigning to each chunk of text its corresponding label (Alpaydin Reference Alpaydin2020). Considering the training set of a country, we performed a “Grid Search” over a set of hyperparameters of the Random Forest algorithm to find the best combination according to a classification accuracy metric. In other words, we iterated all the combinations of the chosen hyperparameters, selecting the most accurate one. The Random Forest algorithm is well-known to have good performances using standard settings that can be found in many software packages (Probst, Wright, and Boulesteix Reference Probst, Wright and Boulesteix2019). However, tuning hyperparameters could still improve the classification accuracy of many tasks (Bernard, Heutte, and Adam Reference Bernard, Heutte and Adam2009). We chose the hyperparameters’ set among typical values for the Random Forest algorithm, and we show them in Table C in the Supplementary Material.
We estimated the classification accuracy for each combination of hyperparameters using K-Fold cross-validation. The training set is initially split into $K=5$
subsets. Hence,
$K=5$
subsets. Hence, $K-1$
subsets are used to train the model, while the remaining one is used as the validation set to compute the accuracy. This process is repeated for each possible choice of the
$K-1$
subsets are used to train the model, while the remaining one is used as the validation set to compute the accuracy. This process is repeated for each possible choice of the $K-1$
subsets, retraining the model each time. The accuracy score assigned to the hyperparameters’ combination is then the average of all the scores obtained with the re-trainings. As there are many possible choices for the accuracy score, we used the area under the receiver operating characteristic (AuROC) curve, as it is typically preferred in binary classification tasks. In Table 1, we show the fraction of sentences belonging to populist manifestos in each country. There is not a significant unbalance with those belonging to nonpopulist manifestos; therefore, we did not apply weights to reduce it during training. However, we can argue that weighting the data would improve the classification accuracy.
$K-1$
subsets, retraining the model each time. The accuracy score assigned to the hyperparameters’ combination is then the average of all the scores obtained with the re-trainings. As there are many possible choices for the accuracy score, we used the area under the receiver operating characteristic (AuROC) curve, as it is typically preferred in binary classification tasks. In Table 1, we show the fraction of sentences belonging to populist manifestos in each country. There is not a significant unbalance with those belonging to nonpopulist manifestos; therefore, we did not apply weights to reduce it during training. However, we can argue that weighting the data would improve the classification accuracy.
Once we found the best hyperparameters’ combination, we retrained the model on the whole training set. Finally, we used the whole training set to find the best threshold for the probabilities given by the Random Forest algorithm using the Receiver Operating Characteristic curve and the Youden index (Ruopp et al. Reference Ruopp, Perkins, Whitcomb and Schisterman2008). This latter procedure further increases the model’s final accuracy, choosing the best combination of true positive and false positive rates. The average values of AuROC for the best hyperparameters are shown in the “AuROC (Validation)” columns of Table 1, while Table D in the Supplementary Material shows the best hyperparameters’ values for each nation.
While the presented practice is quite common in Machine Learning, it can lead to underestimating the cross-validation variance (Bengio and Grandvalet Reference Bengio and Grandvalet2004). Better but more computationally intensive practices can be adopted (Cawley and Talbot Reference Cawley and Talbot2010); however, their application goes beyond this work scope. Since the choice of the Random Forest algorithm was somewhat arbitrary, we repeated the training for the Italian corpus using a logistic regression (Muchlinski et al. Reference Muchlinski, Siroky, He and Kocher2016), a gradient boosting (Friedman Reference Friedman2001) algorithm, and a feedforward neural network (Rumelhart, Hinton, and Williams Reference Rumelhart, Hinton and Williams1986), showing that results of prediction are mostly unvaried. Results and information about the models’ hyperparameters are reported in the Supplementary Material (from Table F to Table I).
5 Results
5.1 Testing the Model and Building the Score
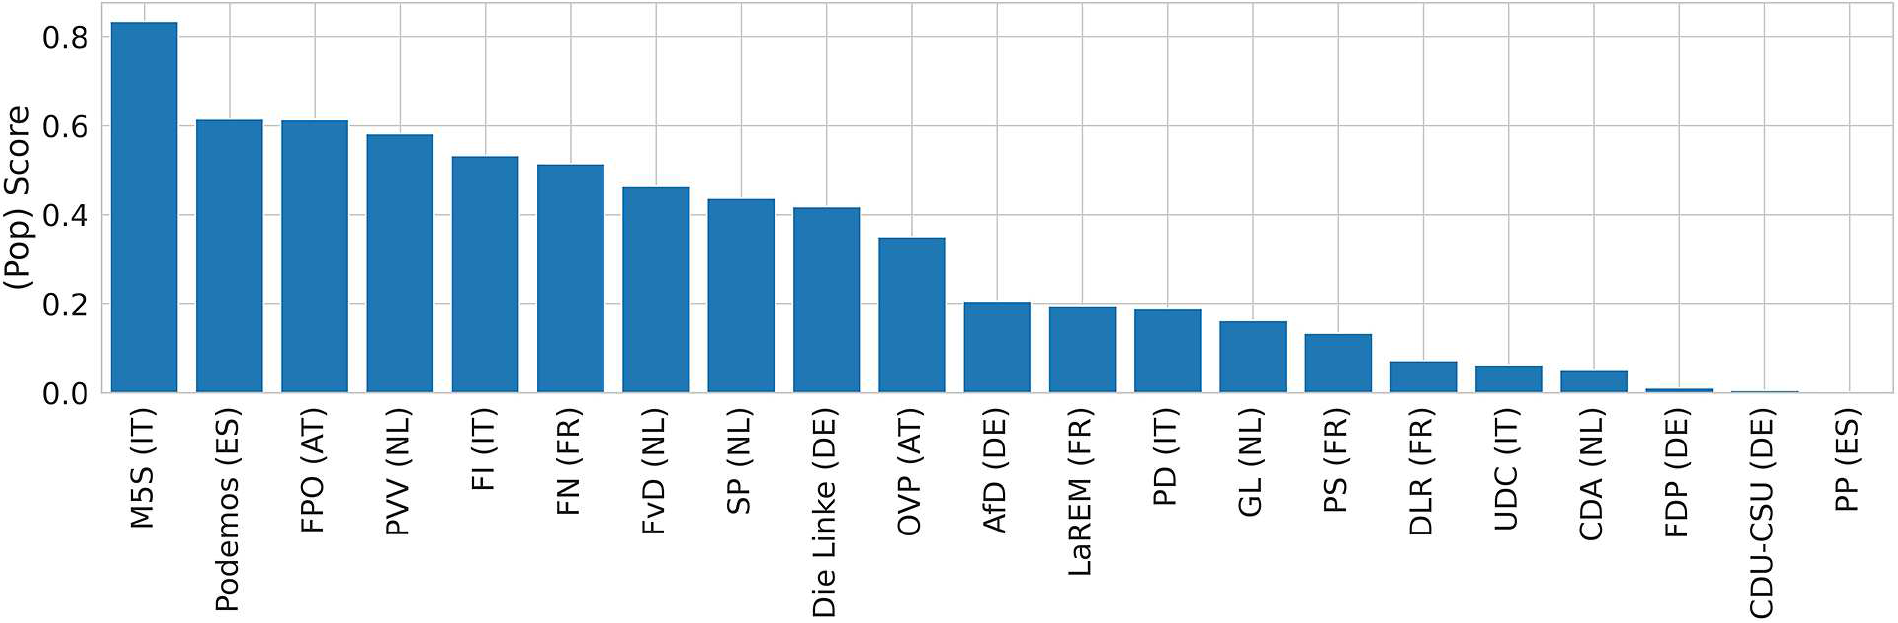
Before building the score, we tested the accuracy of the Random Forest with the best parameter sets found for each country. Thus, we used the six country-specific models to classify all the sentences in the test set, and we computed the corresponding AuROCs. For completeness’ sake, we also computed the F1-score for the validation and test sets, which can be used as an alternative accuracy score for the Grid Search. Table 1 shows the AuROCs and the F1-scores for the test and validation sets. While AuROCs for the test sets are not far from the corresponding average validation score, the F1-scores for the test sets are generally higher than those for the validation sets. This fact is due to the Youden index (Ruopp et al. Reference Ruopp, Perkins, Whitcomb and Schisterman2008) method that selects a reasonable threshold from the validation sets and increases the test sets’ accuracy. Finally, we also classified all the sentences of the parties excluded from the training. We built the parties’ scores by computing the fraction of the sentence classified as $Y=1$
. Figure 1 reports the rankings of a subsample of parties based on their relative level of populism and shows the potentialities of using the populism score for comparative analyses. According to our measures, also parties that are not usually included among the populists can exhibit some degrees of populism.
$Y=1$
. Figure 1 reports the rankings of a subsample of parties based on their relative level of populism and shows the potentialities of using the populism score for comparative analyses. According to our measures, also parties that are not usually included among the populists can exhibit some degrees of populism.
Example of how parties can be ranked by their relative score. The scores are derived from training one model for each country and refer to the last national election available.
5.2 Validation of the Score
We validated the score using two different approaches. On the one hand, we relied on populism-related dimensions drawn from expert surveys (i.e., CHES (Polk et al. Reference Polk2017) and POPPA (Meijers and Zaslove Reference Meijers and Zaslove2020b)) and the GPD database score (Hawkins et al. Reference Hawkins, Aguilar, Silva, Jenne, Kocijan and Kaltwasser2019). We selected two dimensions relevantly connected to populism from the 2017 CHES and five attributes of populism from the 2018 POPPA. In the CHES, a team of experts estimate the party positioning of national parties regarding integration, ideology, and policy issues in several European countries. In the 2017 wave, Austria is not covered, and we only have data for five of the countries in our analysis. In the POPPA, $294$
country experts ranked positions and attitudes of
$294$
country experts ranked positions and attitudes of $250$
parties regarding key attributes related to populism, political style, party ideology, and party organization in
$250$
parties regarding key attributes related to populism, political style, party ideology, and party organization in $28$
European countries. Rather than imposing a specific definition of populism, the POPPA aims to measure the relevant constitutive dimensions that underlie dominant conceptualizations of populism for all the political parties in each party system. Different from the 2017 CHES, this survey is explicitly focused on populist attributes and includes Austria. The GPD measures the level of populist discourse in the speeches of 215 chief executives (presidents and prime ministers) from 66 countries across all continents. The dataset includes more than
$28$
European countries. Rather than imposing a specific definition of populism, the POPPA aims to measure the relevant constitutive dimensions that underlie dominant conceptualizations of populism for all the political parties in each party system. Different from the 2017 CHES, this survey is explicitly focused on populist attributes and includes Austria. The GPD measures the level of populist discourse in the speeches of 215 chief executives (presidents and prime ministers) from 66 countries across all continents. The dataset includes more than $1,000$
speeches, mostly between 2000 and 2018. Each speech is coded manually by one or two coders using the “holistic grading” technique (Hawkins Reference Hawkins2009). The use of several validation sources allowed us to assess the results’ validity and provide insights into the dimensions that the score captures. On the other hand, we checked the method’s robustness deriving the score by using two different datasets for the Italian case: a dataset composed of leaders’ speeches, and the same Italian manifesto dataset where populist sentences were manually coded.
$1,000$
speeches, mostly between 2000 and 2018. Each speech is coded manually by one or two coders using the “holistic grading” technique (Hawkins Reference Hawkins2009). The use of several validation sources allowed us to assess the results’ validity and provide insights into the dimensions that the score captures. On the other hand, we checked the method’s robustness deriving the score by using two different datasets for the Italian case: a dataset composed of leaders’ speeches, and the same Italian manifesto dataset where populist sentences were manually coded.
5.2.1 Validation with CHES
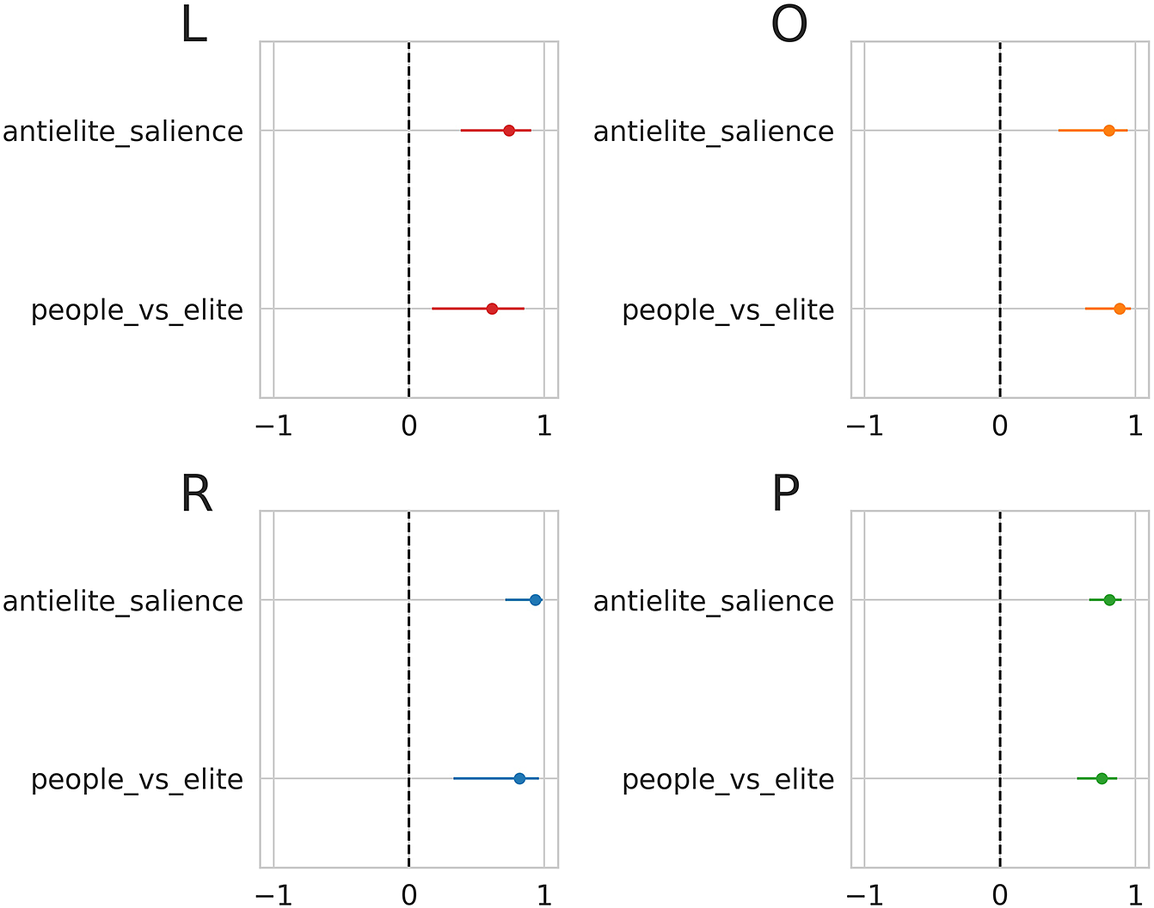
For the validation, we first relied on the 2017 CHES (Polk et al. Reference Polk2017). The two CHES dimensions that we selected are “anti-elite salience” and “people vs elite.” Anti-elitism, which is commonly used in the narrative of challenger parties in general (Hobolt and de Vries Reference Hobolt and de Vries2015), can be defined as an explicit attack on “the elites,” portrayed as a homogeneous power bloc (Zulianello Reference Zulianello2019). As for “people vs elite,” according to the 2017 CHES codebook, it measures the positions of direct vs representative democracy.Footnote 3 However, support for referendums does not constitute a defining feature of the ideational approach, and the way the question was framed can be misleading (Meijers and Zaslove Reference Meijers and Zaslove2020a). Framing the question as it was in the survey gives the impression that populists, per definition, oppose representative democracy and implies that populism is associable with plebiscitary democracy. Nevertheless, we decided to use this attribute because of the close relationship between populism and referendums. For example, populist parties consider themselves as the saviors of democracy and claim that direct democracy can help them save the people from the elites (Jacobs, Akkerman, and Zaslove Reference Jacobs, Akkerman and Zaslove2018).
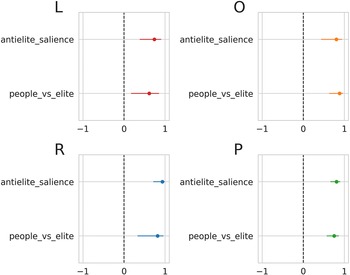
We excluded from the validation the Spanish regionalist parties, since they stand out as outliers; furthermore, their manifestos are sometimes in Catalan. We also excluded FI as the score that we have for the Italian 2013 national elections refers to the People of Freedom (PdL), and even if Berlusconi was the main leader of this party, it also included National Alliance (AN), plus some other minor parties. Figure 2 shows the correlations and $95\%$
confidence intervals for parties clustered according to the left–center–right classification,Footnote
4
plus a pooled analysis that includes all parties. “Anti-elite salience” and “people vs elite” are significantly correlated with our scores regardless of parties’ ideological positions. When looking at correlations between our score and anti-elitism for all the parties together, Pearson’s coefficient is
$95\%$
confidence intervals for parties clustered according to the left–center–right classification,Footnote
4
plus a pooled analysis that includes all parties. “Anti-elite salience” and “people vs elite” are significantly correlated with our scores regardless of parties’ ideological positions. When looking at correlations between our score and anti-elitism for all the parties together, Pearson’s coefficient is $\rho = 0.81$
(
$\rho = 0.81$
( $p<0.001$
) and
$p<0.001$
) and $95\%$
confidence interval
$95\%$
confidence interval $[0.67,0.90]$
, and it is
$[0.67,0.90]$
, and it is $0.75$
when looking at the correlation between the score and “people vs elite” (
$0.75$
when looking at the correlation between the score and “people vs elite” ( $p<0.001$
and
$p<0.001$
and $95\%$
confidence interval
$95\%$
confidence interval $[0.57, 0.87]$
). These outcomes are consistent with previous studies on the main components of populism (Canovan Reference Canovan, Mény and Surel2002; Laclau Reference Laclau and Panizza2005; Mudde Reference Mudde2004; Rooduijn Reference Rooduijn2018) and referenda as one of the key elements of a populist democracy (Mudde and Kaltwasser Reference Mudde and Kaltwasser2013).
$[0.57, 0.87]$
). These outcomes are consistent with previous studies on the main components of populism (Canovan Reference Canovan, Mény and Surel2002; Laclau Reference Laclau and Panizza2005; Mudde Reference Mudde2004; Rooduijn Reference Rooduijn2018) and referenda as one of the key elements of a populist democracy (Mudde and Kaltwasser Reference Mudde and Kaltwasser2013).
Correlation between the score and the relevant dimensions of the 2017 Chapel Hill Expert Survey (Polk et al. Reference Polk2017) for left-wing parties (L), centrist/other parties (O), right-wing parties (R), and all parties (P). Horizontal bars represent the $95\%$
confidence interval of the correlation coefficient estimations.
$95\%$
confidence interval of the correlation coefficient estimations.
5.2.2 Validation with POPPA
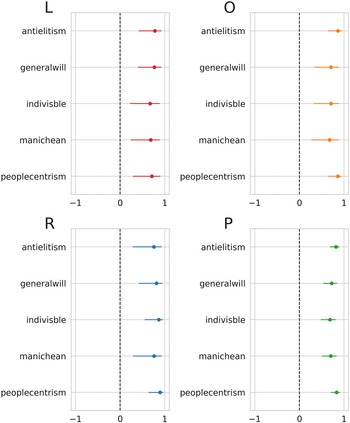
We repeated the validation process using the POPPA dataset (Meijers and Zaslove Reference Meijers and Zaslove2020b). The attributes that we selected for validating our score are considered as the five components of populism according to the ideational approach by Meijers and Zaslove (Reference Meijers and Zaslove2020a). These attributes include the Manichean vision of politics, the indivisibility of the ordinary people, people’s general will, people-centrism, and anti-elitism. Figure 3 presents correlations between our score and the selected dimensions for parties distributed according to the left–center–right classification.Footnote 5
Correlation between the score and the relevant dimensions of the 2018 POPPA (Meijers and Zaslove Reference Meijers and Zaslove2020b) for left-wing parties (L), centrist/other parties (O), right-wing parties (R), and all parties (P). Horizontal bars represent the $95\%$
confidence interval of the correlation coefficient estimations.
$95\%$
confidence interval of the correlation coefficient estimations.
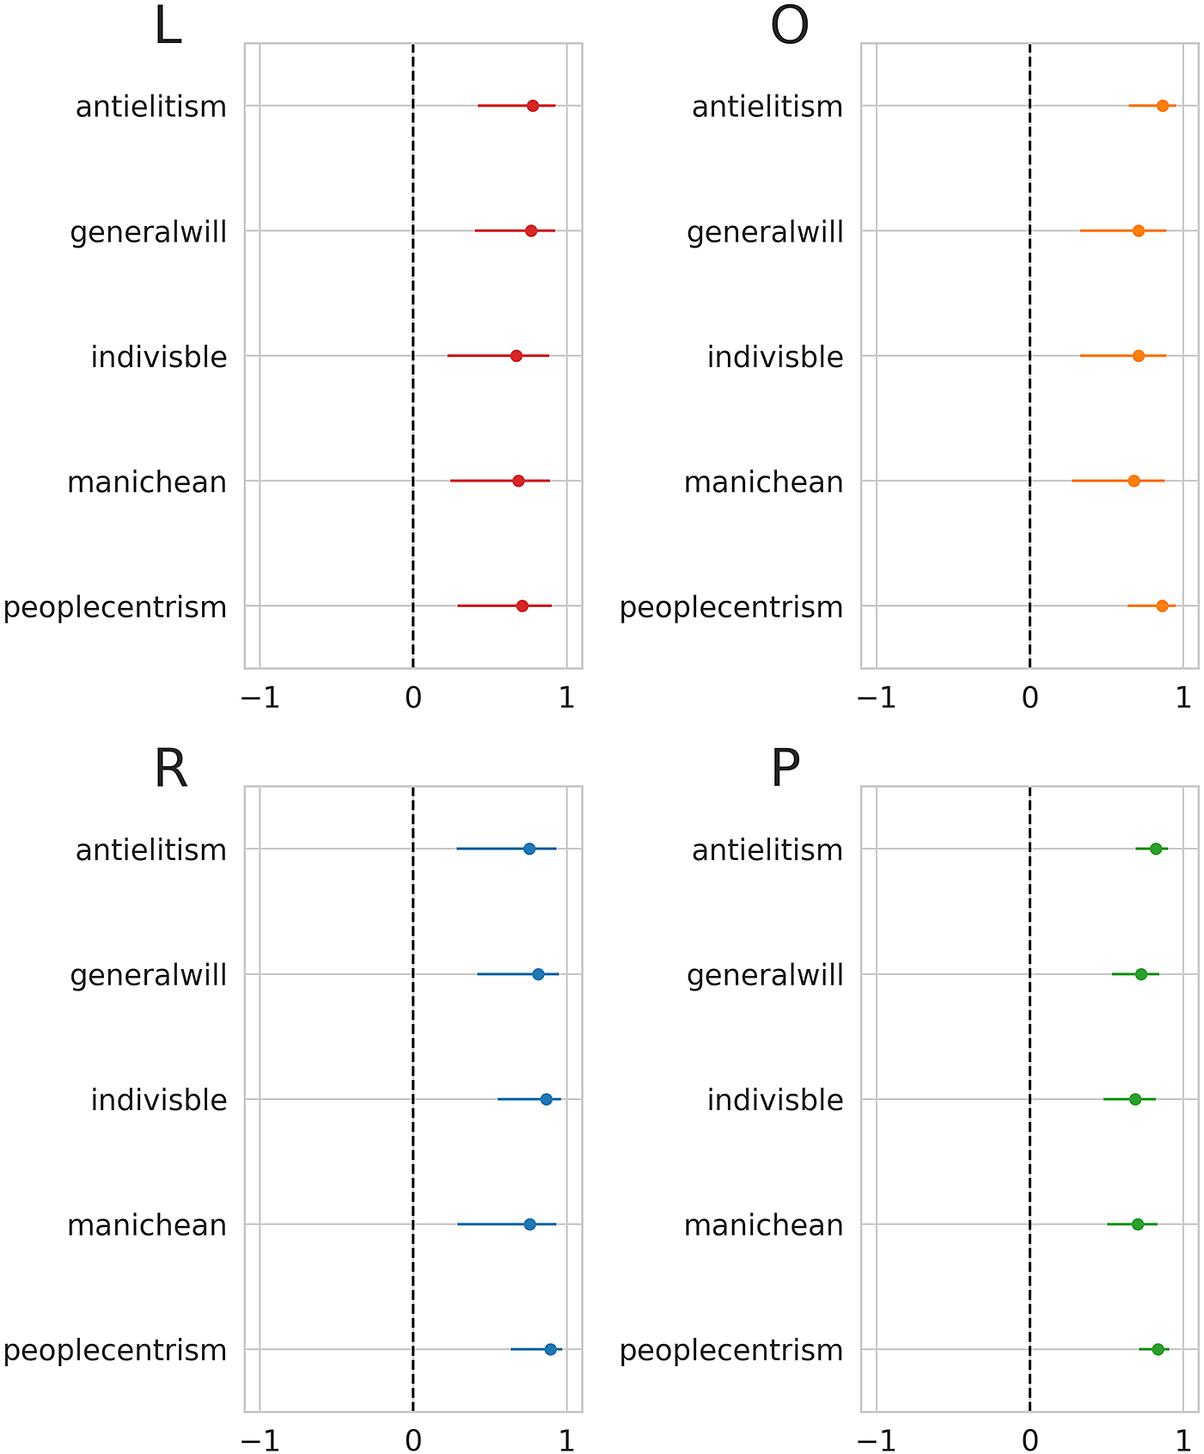
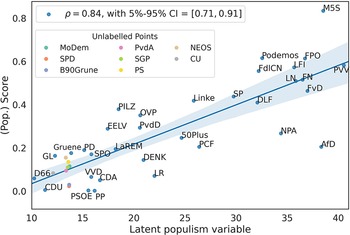
Since a measurement of the ideational approach to populism is valid when it captures its five components (Hawkins et al. Reference Hawkins, Carlin, Littvay and Kaltwasser2018), we also validated our score against a latent populism variable constructed using the five POPPA dimensions as suggested by Meijers and Zaslove (Reference Meijers and Zaslove2020a). We performed an iterated principal exploratory factor analysis on the mean expert judgment on the five items operationalizing populism to build the latent variable. We then summed all the dimensions after weighting them by their value in the first factor. Pearson’s coefficient when looking at the correlation between the score of populism and the latent populism variable is $\rho = 0.84$
(
$\rho = 0.84$
( $p<0.001$
and
$p<0.001$
and $95\%$
confidence interval
$95\%$
confidence interval $[0.71, 0.91]$
). Figure 4 shows how the correlation between the score of populism and the latent populism variable is built on the five POPPA dimensions. Our score for Alternative for Germany is likely to underestimate the party’s level of populism because of the broader presence of sentences from The Left (Linke) in the training set.
$[0.71, 0.91]$
). Figure 4 shows how the correlation between the score of populism and the latent populism variable is built on the five POPPA dimensions. Our score for Alternative for Germany is likely to underestimate the party’s level of populism because of the broader presence of sentences from The Left (Linke) in the training set.
Correlation between the score and the latent populism variable built on the five relevant dimensions of populism in the 2018 POPPA (Meijers and Zaslove Reference Meijers and Zaslove2020b). These dimensions are the Manichean vision of politics, the indivisibility of the ordinary people, people’s general will, people-centrism, and anti-elitism. Horizontal bars represent the $95\%$
confidence interval of the correlation coefficient estimations.
$95\%$
confidence interval of the correlation coefficient estimations.

5.2.3 Validation with GPD
For further validation of the score, we used the GPD by Hawkins et al. (Reference Hawkins, Aguilar, Silva, Jenne, Kocijan and Kaltwasser2019). We only used the nine parties available both in our and their database for the same years for the validation. If we exclude the Spanish Socialist Workers’ Party (PSOE), which stand out as outliers, there is a significant correlation between the two scores ( $\rho = 0.69$
with
$\rho = 0.69$
with $p<0.001$
). However, for a correct validation, we should have used the same corpus as the GPD, because manifestos and speeches can exhibit different levels of populism. Furthermore, the GPD scores measure the populism levels of leaders, whereas our scores measure the populism levels of parties. As a consequence, there can be discrepancies between the two measures. For example, according to our classification, the PSOE ranks significantly lower in its level of populism, whereas, according to the GPD, this party exhibits a more significant degree of populism. This discrepancy can depend either on the intrinsic differences existing between speeches vs manifestos and (or) the political leader’s personal view and style, which can be more populist than the view of the whole party in general. For further details, see Section F and Figure B in the Supplementary Material.
$p<0.001$
). However, for a correct validation, we should have used the same corpus as the GPD, because manifestos and speeches can exhibit different levels of populism. Furthermore, the GPD scores measure the populism levels of leaders, whereas our scores measure the populism levels of parties. As a consequence, there can be discrepancies between the two measures. For example, according to our classification, the PSOE ranks significantly lower in its level of populism, whereas, according to the GPD, this party exhibits a more significant degree of populism. This discrepancy can depend either on the intrinsic differences existing between speeches vs manifestos and (or) the political leader’s personal view and style, which can be more populist than the view of the whole party in general. For further details, see Section F and Figure B in the Supplementary Material.
5.2.4 Comparison with Leader Speeches’ and Manually Coded Datasets
To check whether our methodology can be applied to different textual sources and lead to substantially different outcomes when using a corpus made of manifestos rather than one comprising leaders’ speeches, we repeated the analysis, building a score using $2,151$
sentences drawn from speeches of Italian leaders in electoral campaigns, talk shows, and TV programs from 2006 to 2019. The method of derivation of the score is the same as the one used in Section 4. Moreover, even the method that we proposed for labeling is resource-efficient, it could lead to less accurate classification than the one obtained with training based on a manually coded corpus. Whereas our method models the probability that a sentence is drawn from a manifesto of a prototypically populist party, a method using a manually coded dataset for training would model the probability that a sentence is populist, regardless of the party. For assessing the effects of building the score with different datasets, we performed two separate analyses. First, we used a similar labeling procedure for sentences: we labeled
$2,151$
sentences drawn from speeches of Italian leaders in electoral campaigns, talk shows, and TV programs from 2006 to 2019. The method of derivation of the score is the same as the one used in Section 4. Moreover, even the method that we proposed for labeling is resource-efficient, it could lead to less accurate classification than the one obtained with training based on a manually coded corpus. Whereas our method models the probability that a sentence is drawn from a manifesto of a prototypically populist party, a method using a manually coded dataset for training would model the probability that a sentence is populist, regardless of the party. For assessing the effects of building the score with different datasets, we performed two separate analyses. First, we used a similar labeling procedure for sentences: we labeled $Y=1$
the sentences from populist party leaders’ speeches and
$Y=1$
the sentences from populist party leaders’ speeches and $Y=0$
the others. More information about this dataset can be found in Section G in the Supplementary Material. The comparative analysis reveals similar outcomes whether the algorithm was trained with manifestos or with speeches (
$Y=0$
the others. More information about this dataset can be found in Section G in the Supplementary Material. The comparative analysis reveals similar outcomes whether the algorithm was trained with manifestos or with speeches ( $\rho = 0.75$
and
$\rho = 0.75$
and $p<0.001$
; see Figure C in the Supplementary Material). Second, to assess the potential of using manual coding to train the model and to check consistency between the scores obtained using the two methods, we manually coded the Italian corpus and used it to derive new party scores. More information about this dataset can be found in Section G in the Supplementary Material. When coding, we gave label
$p<0.001$
; see Figure C in the Supplementary Material). Second, to assess the potential of using manual coding to train the model and to check consistency between the scores obtained using the two methods, we manually coded the Italian corpus and used it to derive new party scores. More information about this dataset can be found in Section G in the Supplementary Material. When coding, we gave label $Y = 1$
to sentences including content that expressed the three basic components of populism: people-centrism, anti-elitism, and the Manichean view of society as intended in the ideational approach (Hawkins et al. Reference Hawkins, Carlin, Littvay and Kaltwasser2018; Mudde and Kaltwasser Reference Mudde and Kaltwasser2013). Some examples of sentences labeled
$Y = 1$
to sentences including content that expressed the three basic components of populism: people-centrism, anti-elitism, and the Manichean view of society as intended in the ideational approach (Hawkins et al. Reference Hawkins, Carlin, Littvay and Kaltwasser2018; Mudde and Kaltwasser Reference Mudde and Kaltwasser2013). Some examples of sentences labeled $Y = 1$
can be found in Table N in the Supplementary Material. In addition to concerns related to biased coding and reliability, this extra analysis allowed us to determine if training the algorithm with a manually coded dataset would lead to a more precise quantification of levels of populism in parties’ documents. The score obtained by training the algorithm with the manually coded dataset is significantly correlated with the one obtained without manual coding (
$Y = 1$
can be found in Table N in the Supplementary Material. In addition to concerns related to biased coding and reliability, this extra analysis allowed us to determine if training the algorithm with a manually coded dataset would lead to a more precise quantification of levels of populism in parties’ documents. The score obtained by training the algorithm with the manually coded dataset is significantly correlated with the one obtained without manual coding ( $\rho = 0.88$
and
$\rho = 0.88$
and $p<0.001$
). Therefore, we conclude that the latter can be used as a proxy for levels of populism in the absence of manually coded datasets, offering the main advantage of being more resource-efficient (see Figure D in the Supplementary Material).
$p<0.001$
). Therefore, we conclude that the latter can be used as a proxy for levels of populism in the absence of manually coded datasets, offering the main advantage of being more resource-efficient (see Figure D in the Supplementary Material).
5.3 Temporal Evolution of the Populist Score
As a first application, we used the score for checking countries’ variations over time by measuring the average aggregate level of parties’ populism per year. We excluded from the analysis parties that gained less than $1\%$
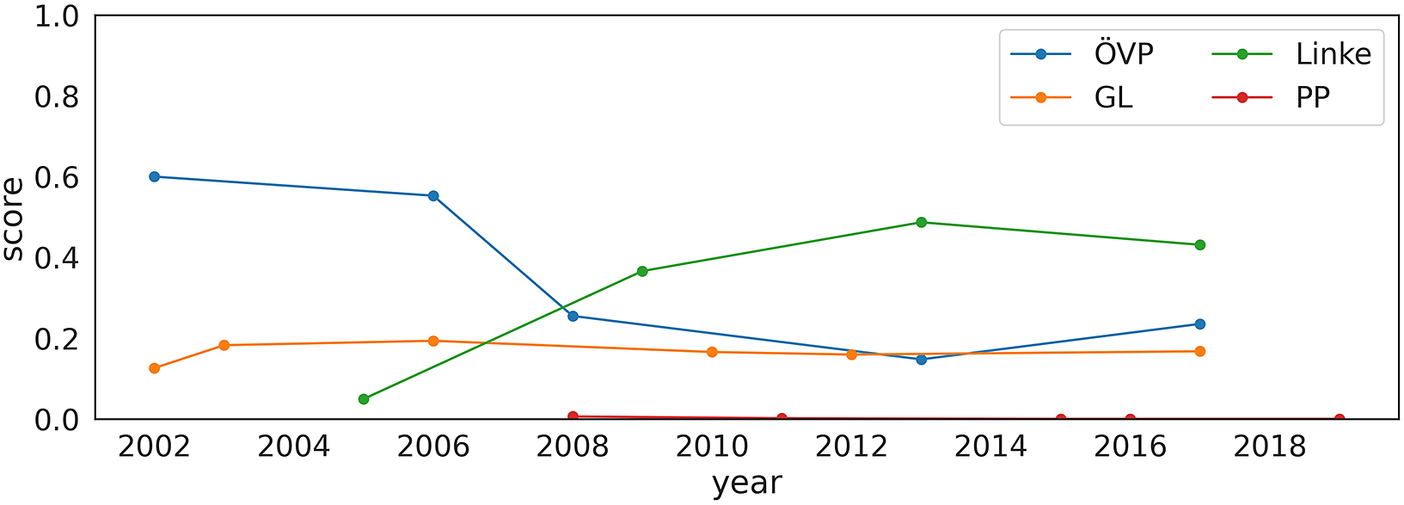
in the national elections. Since elections were not held at the same time, the lines refer to different years and periods. Figure 5 shows the average score in different years for all the countries in our data. Although trends vary unevenly from country to country, results show that there has been a sharp increase in the average score of populism in Italy, whereas other countries exhibit weaker growth or uneven trends. For instance, results suggest that average levels of populism in Spain have significantly decreased, possibly driven by We Can (Podemos; see Figure E in the Supplementary Material). Our findings suggest that studies on the determinants of populism should look beyond the 2008 economic crisis and explore the possibility that other turning points, such as the refugee crisis, or the crisis’ perceptions, might have driven the increase in the average populism in some countries rather than others. Furthermore, our analyses endorse the importance of investigating how populist parties react after becoming ruling parties. However, although further investigations are needed to shed light on these complex issues, we showed the potential of using our score for temporal and spatial comparative studies. Figure 6 shows the evolution of the populism scores for a subset of parties through time, including the Austrian People’s Party (ÖVP—Austria), the Green Left (GL—The Netherlands), The Left (Linke—Germany), and the People’s Party (PP—Spain). Whereas GL and PP have had only little fluctuations in their levels of populism, Linke and ÖVP have diversified trajectories over time, the former characterized by a sharp increase in the levels of populism and the second by a decrease. Figure E in the Supplementary Material shows the evolution of the populism scores for a subset of parties through time. In particular, we show the evolution of all the parties appearing in at least three electoral rounds for each country.
$1\%$
in the national elections. Since elections were not held at the same time, the lines refer to different years and periods. Figure 5 shows the average score in different years for all the countries in our data. Although trends vary unevenly from country to country, results show that there has been a sharp increase in the average score of populism in Italy, whereas other countries exhibit weaker growth or uneven trends. For instance, results suggest that average levels of populism in Spain have significantly decreased, possibly driven by We Can (Podemos; see Figure E in the Supplementary Material). Our findings suggest that studies on the determinants of populism should look beyond the 2008 economic crisis and explore the possibility that other turning points, such as the refugee crisis, or the crisis’ perceptions, might have driven the increase in the average populism in some countries rather than others. Furthermore, our analyses endorse the importance of investigating how populist parties react after becoming ruling parties. However, although further investigations are needed to shed light on these complex issues, we showed the potential of using our score for temporal and spatial comparative studies. Figure 6 shows the evolution of the populism scores for a subset of parties through time, including the Austrian People’s Party (ÖVP—Austria), the Green Left (GL—The Netherlands), The Left (Linke—Germany), and the People’s Party (PP—Spain). Whereas GL and PP have had only little fluctuations in their levels of populism, Linke and ÖVP have diversified trajectories over time, the former characterized by a sharp increase in the levels of populism and the second by a decrease. Figure E in the Supplementary Material shows the evolution of the populism scores for a subset of parties through time. In particular, we show the evolution of all the parties appearing in at least three electoral rounds for each country.
Trends in the average amount of populism using the score. Parties that gained less than $1\%$
are not included in the graph. Error bars represent the standard errors.
$1\%$
are not included in the graph. Error bars represent the standard errors.

Evolution of the populist score for Austrian People’s Party (ÖVP—Austria), Green Left (GL—The Netherlands), The Left (Linke—Germany), and People’s Party (PP—Spain) in time.
6 Discussion
Recent years have seen a growth in “methodological populism,” which attempts to measure party populism systematically and comparatively (Hawkins et al. Reference Hawkins, Carlin, Littvay and Kaltwasser2018). This paper adds to the existing literature by proposing a systematic method for measuring parties’ levels of populism using a text-as-data approach based on Supervised Machine Learning. Unlike other methods based on computer-assisted textual analysis (e.g., holistic grading in Hawkins et al. (Reference Hawkins, Carlin, Littvay and Kaltwasser2018)), the methodology that we proposed is based on the observation of units of text and not the text as a whole. Furthermore, it measures parties’ rather than leaders’ levels of populism; and does not rely on human-coding, nor does it require coders to assign scores to texts based on the elements that define the context of populism. Moreover, unlike dictionary-based approaches (see, e.g., Rooduijn and Pauwels (Reference Rooduijn and Pauwels2011)), our method does not rely on the use of dictionaries, leaving out potential concerns about the validity and the selection of the dictionary used. Hence, it reduces the risk of arbitrary classification of parties.
It offers four main advantages. First, it classifies a vast number of parties by identifying their levels of populism (if any) without resource-intensive human-coding processes. Second, it obtains a party score to perform temporal and spatial analyses of populism, a feature that can lead to significant advancements in comparative studies. Third, it provides a continuous score of parties’ populism. Continuous measures help avoid conceptual confusion on whether populism is “sincere” or “strategic,” clearing the way for more fine-grained analyses of the correlates of populism and reducing the risk of arbitrary classification (Meijers and Zaslove Reference Meijers and Zaslove2020a). Fourth, unlike other methods for measuring populism, it obtains updated and fast results with a low allocation of time and resources. Furthermore, our method allows text analysis to be performed even when researchers have little or no polyglot knowledge, an element that is crucial in the perspective of spatial comparisons.
We validated our populism scores by comparing them with some populism-related dimensions of the 2017 CHES (Polk et al. Reference Polk2017) and 2018 POPPA datasets (Meijers and Zaslove Reference Meijers and Zaslove2020b). We also validated the scores using the GPD (Hawkins et al. Reference Hawkins, Aguilar, Silva, Jenne, Kocijan and Kaltwasser2019), although we highlighted that the cross-validation should be based on the same corpus or a speech corpus. The scores are significantly correlated with the main attributes of populism, anti-elitism, and people-centrism in particular, as well as with a latent variable of populism built upon the five dimensions of populism proposed by Meijers and Zaslove (Reference Meijers and Zaslove2020a).
We also checked the method’s robustness by repeating the analysis, using different classification algorithms with small variations in the results. In the Italian case, we showed that scores measured using sentences from manifestos and those measured using leader speeches are highly consistent. We only focused on Italy, since the collection of a corpus made of speeches remains a difficult task. Finding videos preceding the expansion of social media and the diffusion of modern smartphones is not easy, and not all leaders are on YouTube. When the process cannot be automated, manual transcription is time-consuming and requires optimal knowledge of the languages involved. Furthermore, we explored the potentialities of extending the method by using manually coded populist sentences from the Italian corpus for training the algorithms. While this method applied to a monolingual corpus would allow for a general score independent from the nation-specific ones, we did not see large variations in the score’s estimation.
Finally, we showed a small application of the score by performing a spatial and temporal comparative analysis of populism for Italy, France, Spain, Austria, Germany, and the Netherlands from the early 2000s for nearly two decades. We found significant differences among the countries, with populism increasing sharply in Italy while showing uneven trends in the other countries. Our first application of the score highlighted the importance of exploring the relatively untapped potential of continuous measures to investigate a wide range of populism-related issues, such as the populist zeitgeist (Mudde Reference Mudde2004), how the different attributes of populism (e.g., anti-elitism, people-centrism, and general will) evolved, or the relationship between populism and the economic (and sociopolitical) crises in a temporal and spatial perspective (Caiani and Graziano Reference Caiani and Graziano2019; Kriesi and Pappas Reference Kriesi and Pappas2015). The method can also be used to examine a larger temporal interval, other types of textual sources, or other kinds of political and social phenomena.
Our method has some limitations that might be overcome in future developments of the present work. First, the different lengths of party manifestos could lead to less accurate estimates of the score, because the longer the manifesto, the higher the probability of covering more topics; the presence or absence of these topics could affect the score. However, we did not control for manifestos’ length at this stage. Segmenting the data so that each party is represented by a set of sentences belonging to specific topics could help solve this issue.
Second, in the absence of a monolingual corpus, that is, a corpus in which all manifestos have been translated to the same language, we performed a separate analysis for each country, training six different models. Besides adding complexity to the derivation of the score, the country-specific nature of populism can lead populism scores to have different scales. Therefore, a cross-country comparison would be more precise if using an integrated model trained on the same monolingual corpus.
Third, despite using a simple bag-of-words representation of sentences to obtain convincing results, such representation suffers from some shortcomings. For instance, the vocabulary should be carefully designed to manage the size, which impacts the sparsity of the document representations. Furthermore, by discarding word order, bag-of-words ignores the context and, therefore, the meaning of words in the document. We argue that more refined representations, such as Term Frequency-Inverse Document Frequency, which rescales the frequency of words (Baeza-Yates and Ribeiro-Neto Reference Baeza-Yates and Ribeiro-Neto1999), or word embeddings, in which words with similar meanings have a similar representation (Li and Yang Reference Li and Yang2018), might enhance the accuracy.
Furthermore, the score seems to show that all parties can potentially exhibit some levels of populism. This shortcoming could be due to all the manifestos containing some common sentences or expressions, and hence, there exists a small number of sentences from nonpopulist manifestos that could belong to populist ones. This effect can be considerably reduced by using more extensively manually annotated corpora or limiting the analysis to sentences belonging only to specific topics. Finally, the use of other types of corpora, such as tweets or Facebook posts, might allow for more fine-grained temporal analyses and help detect more precisely significant turning points over the years.
Acknowledgments
Special thanks go to Manuela Caiani, Steven van Hauwaert, and Stefaan Walgrave for their helpful and constructive comments on earlier versions of this study. We are also grateful to Theofanis Exadaktylos, Fabio Sabatini, Martin Guzi, Tommaso Reggiani, and Mario Pianta for the interesting discussions on the topics related to our work. Finally, we express our gratitude to the three anonymous reviewers as well as the journal’s editor Jeff Gill for their insightful comments.
Conflicts of Interest
The authors declare no conflicts of interest related to this work.
Data Availability Statement
Replication code for this article is available at https://doi.org/10.7910/DVN/BMJYAN (Di Cocco and Monechi Reference Di Cocco and Monechi2021).
Supplementary Material
For supplementary material accompanying this paper, please visit https://doi.org/10.1017/pan.2021.29.






 Open access

