


Introduction
Research on speech perception has revealed that the listener’s perceptual system attunes early and dynamically to sounds and sound sequences relevant to their native language (for a review, see Frost et al., Reference Frost, Armstrong and Christiansen2019; Saffran & Kirkham, Reference Saffran and Kirkham2018). However, what will happen when children learning to read and those with reading disorders encounter phonological sequences that are unattested or ill-formed in their native language? To answer this question, we focused on the phonological segmentation strategies of DYS children compared to CA and RL peers in a lexical decision task. Through this investigation, we addressed the issue of the nature of the phonological deficit in DYS children. We aimed to demonstrate that the phonological deficit stems from degraded access to intact phonological syllable representations, while a gradient-based preference that follows sonority markedness constraints rooted in an active universal grammar guides the syllable segmentation of unattested, ill-formed intervocalic ⟨C1C2⟩ clusters.
Sonority and sonority-based approach
Previous studies support the existence of a sonority projection effect to account for a fine-tuned, gradient-based preference for unattested well-formed onset clusters (e.g., /bn/) over unattested ill-formed clusters (e.g., /lb/; Albright, Reference Albright2009; Daland et al., Reference Daland, Hayes, White, Garelleck, Davis and Norrmann2011; Hayes & White, Reference Hayes and White2013; for a review, see Berent, Reference Berent2013). Evidence in speech perception and production, mostly in adults, shows a synchronically and gradually active repair of ill-formed onset clusters into well-formed ones with vowel epenthesis borrowed from the native stock of sounds (e.g., /lb/ 𝔻 /ləb/ > /bd/ 𝔻 /bəd/ > /bn/ 𝔻 /bən/; “>” stands for “preferred over”; in Brazilian Portuguese: Dupoux et al., Reference Dupoux, Parlato, Frota, Hirose and Peperkamp2011; in English: Davidson, Reference Davidson2006, Reference Davidson2011; Davidson & Shaw, Reference Davidson and Shaw2012; Berent et al., Reference Berent, Steriade, Lennertz and Vaknin2007, Reference Berent, Harder and Lennertz2011; in French: Maïonchi-Pino, Taki et al., Reference Maïonchi-Pino, Taki, Magnan, Yokoyama, Écalle, Takahashi, Hashizume and Kawashima2015; in Japanese: Dupoux et al., Reference Dupoux, Kakehi, Hirose, Pallier and Mehler1999; Guevara-Rukoz et al., Reference Guevara-Rukoz, Lin, Morii, Minagawa, Dupoux and Peperkamp2017; in Korean, Russian, or Hebrew: Berent et al., Reference Berent, Steriade, Lennertz and Vaknin2007, Reference Berent, Lennertz, Jun, Moreno and Smolensky2008, Reference Berent, Vaknin–Nusbaum and Galaburda2022; in Mandarin Chinese: Zhao & Berent, Reference Zhao and Berent2016; in Spanish: Berent, Lennertz, & Rosselli, Reference Berent, Lennertz and Rosselli2012). For instance, Berent et al. (Reference Berent, Steriade, Lennertz and Vaknin2007, Reference Berent, Lennertz, Jun, Moreno and Smolensky2008) and Berent, Lennertz, and Balaban (Reference Berent, Lennertz and Balaban2012) claim that such a repair relies on active phonological recoding based on universal phonological constraints (i.e., by inserting an epenthetic vowel; e.g., /ləbif/ > /lbif/). The authors rejected this repair as a consequence of a gestural failure to articulate ill-formed clusters (i.e., it seems to be impossible to pronounce /lb/ in onset clusters), a passive failure of acoustic-phonetic encoding, or an influence of phonetically grounded grammaticalization of unnatural sound sequences (Berent & Lennertz, Reference Berent and Lennertz2010; but see Hayes & Steriade, Reference Hayes, Steriade, Hayes, Kirchner and Steriade2004; Kirchner, Reference Kirchner, Hayes, Kirchner and Steriade2004; Redford, Reference Redford2008; Sun & Peperkamp, Reference Sun and Peperkamp2016; Wright, Reference Wright, Hayes, Kirchner and Steriade2004). The sonority projection effect derives from the sonority sequencing principle, a universal phonological bias that cross-linguistically generalizes that the most well-formed onset requires a maximum sonority rise throughout the onset to the vowel (e.g., /bʁa/, s [bʁ]=+4; s [ʁa]=+3) and a minimal fall from the vowel throughout the coda (e.g., /aʁm/, s [aʁ]=–3, s [ʁm]=–2; Clements, Reference Clements, Kingston and Beckman1990, Reference Clements, Raimy and Cairns2009).
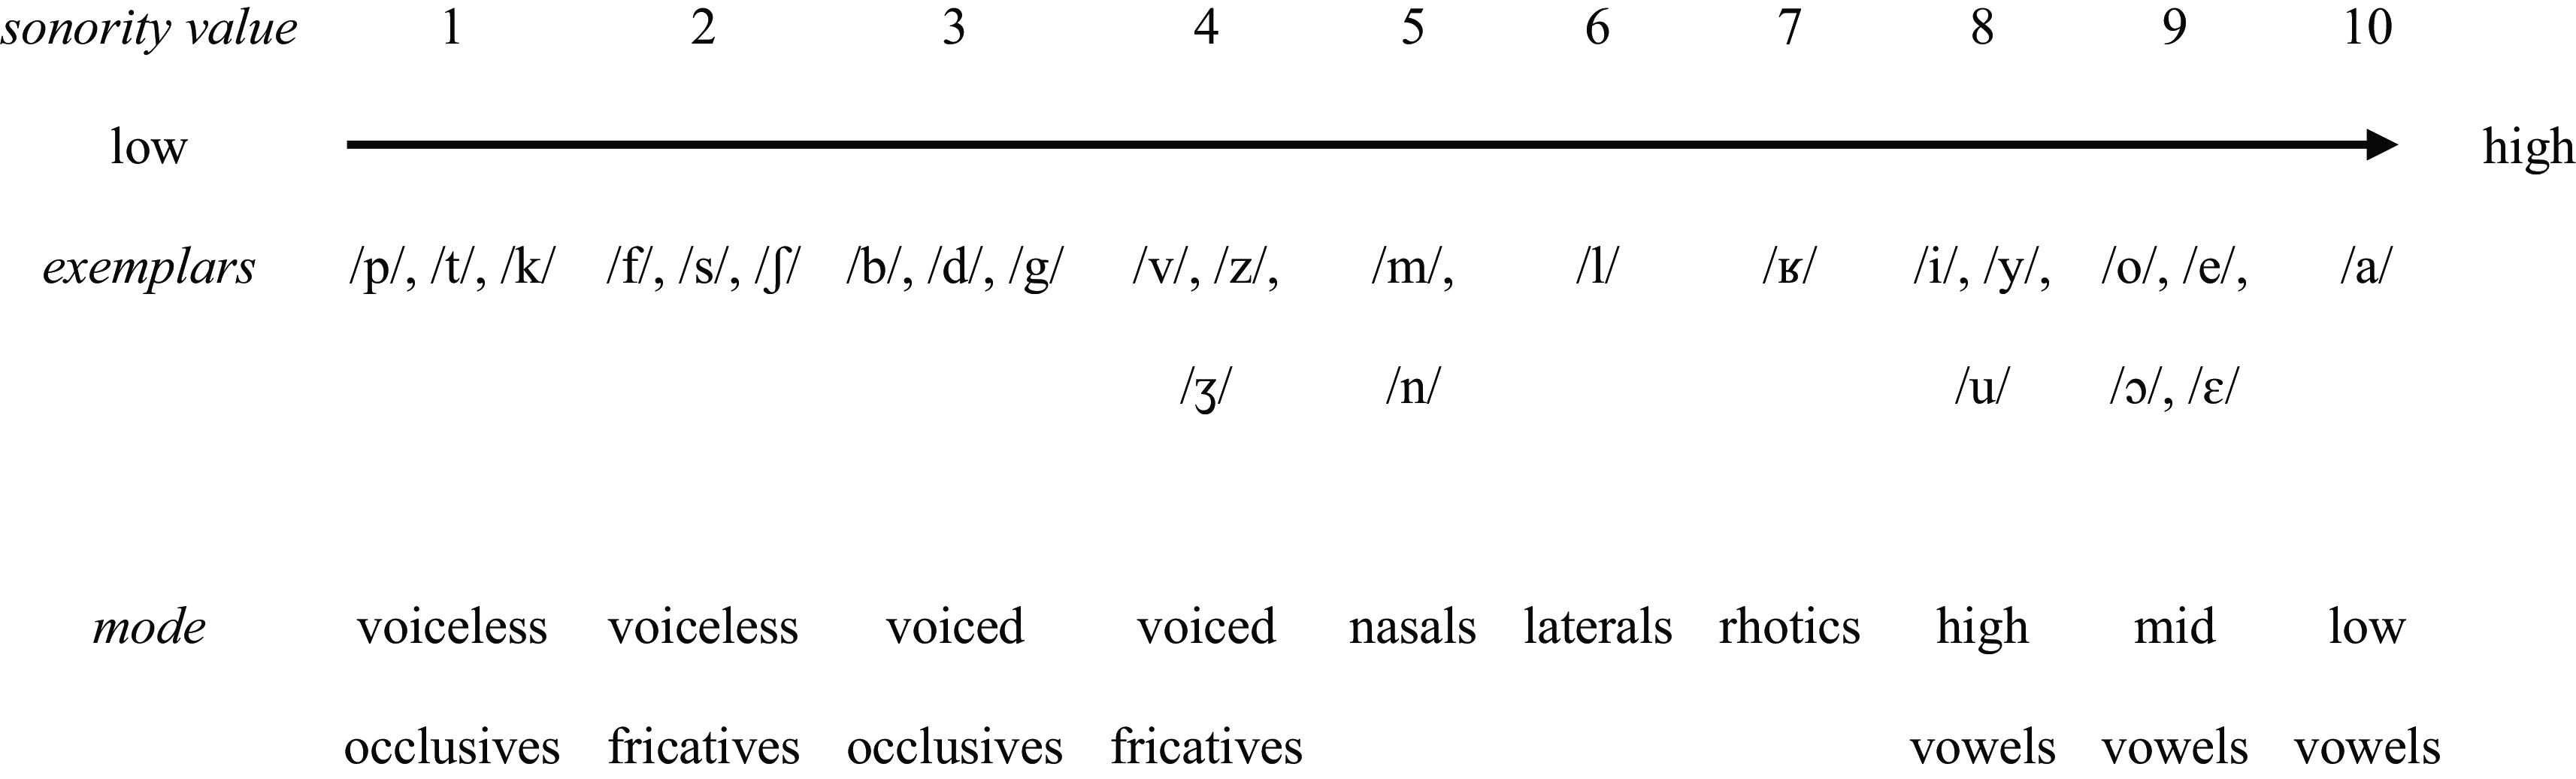
Although controversial in nature, sonority is described as a scalar phonological feature with quantifiable physical and perceptual properties. It categorizes all speech sounds into a hierarchical phonetically grounded scale, whose acoustic intensity is the most reliable correlate (Parker, Reference Parker2008, Reference Parker and Parker2012, Reference Parker2017; Figure 1).
Sonority scale for French sounds based on the physical property of acoustic intensity (from 1 to 10).
Note. This sonority hierarchy is adapted from Jespersen (Reference Jespersen1904, pp. 186–192; also see Gouskova, Reference Gouskova2004) following Parker’s (Reference Parker2008) suggestion for ranking sounds according to their respective intensity (sonority values are partly arbitrary; however, the sonority distance between each mode has a value of 1). Some sounds are grouped under the same sonority value, although this classification is still debated (e.g., rhotics or /n/ and /m/; for a review, see Krämer & Zec, Reference Krämer and Zec2020). We did not represent glides because they were not relevant for our purpose.

One perspective considers the sonority sequencing principle as a set of sonority markedness constraints grounded in universal grammar. These are abstract, hierarchically ranked phonological constraints that do not differ from one language to another, with differences arising from how each language orders and either minimally violates or maximally respects these constraints in Optimality Theory (Prince & Smolensky, Reference Prince and Smolensky2004, Reference Prince and Smolensky1997). The formalization of the phonological sonority markedness constraints is that an onset becomes more marked (illegal) and more ill-formed as the onset cluster sonority decreases from high-rise to high-fall sonority toward the vowel (e.g., /bna/ [unmarked – legal – well-formed] > /bda/ > /lba/ [marked – illegal – ill-formed]). Of interest is that this pattern reverses the phonotactic restrictions on the co-occurrence of sounds across syllable boundaries. The syllable contact law (Murray & Vennemann, Reference Murray and Vennemann1983; Vennemann, Reference Vennemann1988) attributes the well-formedness of syllable boundaries to a steep sonority fall between the coda and the onset (e.g., ⟨partir⟩, /paʁtiʁ/, s [ʁt]=–6, to leave). Gouskova (Reference Gouskova2004) extended and merged the sonority sequencing principle and the syllable contact law into a more sophisticated formalization of sonority markedness constraints through a stratified relational hierarchy implemented within Optimality Theory (for a review, see Pons-Moll, Reference Pons-Moll2011). She considered sonority not in isolation but in relation to the adjacent individual sonorities of onset and coda, respectively. This generates SPs that are insensitive to the sonority value of individual onset and coda but sensitive to the sonority distance (i.e., rise, plateau, fall, etc.); hence, /ʁd/ and /mt/ belong to the same stratum (i.e., the same SP) and are theoretically equivalent because these clusters share the same sonority distance.
However, a crucial issue that does not consensualize is whether, and if so when, the sonority projection effect stems from (1) phonological generalizations from lexical attestedness based on statistical and featural properties in the lexicon (e.g., unattested onset cluster /bn/ shares features with attested onset clusters /bʁ/ and /sn/; Albright, Reference Albright2009; Bailey & Hahn, Reference Bailey and Hahn2005; Daland et al., Reference Daland, Hayes, White, Garelleck, Davis and Norrmann2011; Hayes & Wilson, Reference Hayes and Wilson2008), (2) dissociates from – but interacts with – attestedness and reflects a phonological bias (in French: Basirat et al., Reference Basirat, Patin and Jozefowiez2021; in English: Deschamps et al., Reference Deschamps, Baum and Gracco2015; Ettlinger et al., Reference Ettlinger, Finn and Hudson Kam2012; Hayes & White, Reference Hayes and White2013; Vincent et al., Reference Vincent, Vanstavel, Patin, Mejias and Basirat2022; White & Chiu, Reference White and Chiu2017; in German: Ulbrich et al., Reference Ulbrich, Alday, Knaus, Orzechowska and Wiese2016; in Polish: Wiese et al., Reference Wiese, Orzechowska, Alday and Ulbrich2017), or (3) is innate, that is, as a part of universal grammar since unattested onset clusters have no statistical co-occurrences in the lexicon (Berent & Lennertz, Reference Berent and Lennertz2010; Berent et al., Reference Berent, Steriade, Lennertz and Vaknin2007, Reference Berent, Lennertz, Jun, Moreno and Smolensky2008, Reference Berent, Harder and Lennertz2011; Gómez et al., Reference Gómez, Berent, Benavides-Varela, Bion, Cattarossi, Nespor and Mehler2014). To determine whether the sonority projection effect lies in sonority markedness constraints, as a part of universal grammar, we investigated the segmentation strategies across syllable boundaries in silent reading in French-speaking DYS children. This point is an overlooked issue in DYS children who exhibit phonological deficits that remain unclear (Share, Reference Share2021).
Syllables as essential phonological reading units in French
Investigating sonority markedness constraints on syllable restrictions is appropriate in French. French is a syllable-timed language with clear-cut syllable boundaries, which allows non-canonical or complex onset clusters (e.g., ⟨VC⟩, ⟨CVC⟩, ⟨CCV⟩, etc.; Dell, Reference Dell1995; Kaye & Lowenstamm, Reference Kaye, Lowenstamm, Dell, Hirst and Vergnaud1984; Léon, Reference Léon2011) and polysyllabic words (> 90%; Lété et al., Reference Lété, Sprenger-Charolles and Colé2004).
Within Dual-Route models (Coltheart et al., Reference Coltheart, Rastle, Perry, Langdon and Ziegler2001), children must first learn grapheme-to-phoneme correspondences via a phonological route to read new, regular, and unfamiliar words or pseudowords, which progressively builds a lexical route to read irregular and familiar words. Teaching the grapheme-to-phoneme correspondences allows children to understand that words consist of letters (the graphemes) that represent sounds (the phonemes) to learn words that they have heard but have never seen before (Ziegler et al., Reference Ziegler, Castel, Pech-Georgel, George, Alario and Perry2008, Reference Ziegler, Perry and Zorzi2014, Reference Ziegler, Perry and Zorzi2020).
This echoes Dual-Foundation models (Ehri, Reference Ehri2005; Seymour, Reference Seymour, Snowling and Hulme2005) which assume a phonological sequence that progresses from phonemes to syllables (phonological route) to whole-word recognition (lexical route). This view posits that syllables progressively unitize and consolidate a large set of isolated phonemes into a small set of syllable structures, allowing syllable processing to require “fewer connections to secure the word in memory” (Ehri, Reference Ehri2005, p. 175; also see Guo et al., Reference Guo, Vazeux, Doignon-Camus, Bosse, Mahé and Zagar2023).
However, understanding that a letter – or a grapheme – corresponds to a phoneme being isolated from a sound sequence is rather difficult because phonemes are abstract phonological units (for a review, see Castles et al., Reference Castles, Rastle and Nation2018). Extensive literature on reading aloud and silent reading in French typically developing children supports the early role of syllables in segmenting and accessing words (from the end of Grade 1 to Grade 6; Bastien-Toniazzo et al., Reference Bastien-Toniazzo, Magnan and Bouchafa1999; Chetail & Mathey, Reference Chetail and Mathey2009a, Reference Chetail and Mathey2009b, Reference Chetail and Mathey2012, Reference Chetail and Mathey2013; Colé et al., Reference Colé, Magnan and Grainger1999; Maïonchi-Pino et al., Reference Maïonchi-Pino, Magnan and Écalle2010a; Sprenger-Charolles & Siegel, Reference Sprenger-Charolles and Siegel1997; Vazeux et al., Reference Vazeux, Doignon-Camus, Bosse, Mahé, Guo and Zagar2020).
A classical demonstration ensues from the expression of a syllable compatibility effect to account for syllables as segmental units: a word is segmented or identified faster when a syllable (⟨CV⟩ or ⟨CVC⟩) matches the syllable segmentation (e.g., ⟨PA⟩ in ⟨pa.role⟩, speech or ⟨PAR⟩ in ⟨par.tir⟩, to leave; the dot represents the syllable boundaries) than when it mismatches the syllable segmentation (e.g., ⟨PA⟩ in ⟨par.tir⟩, ⟨PAR⟩ in ⟨pa.role⟩). Further evidence reveals that the structural properties (i.e., ⟨CV⟩ > ⟨CVC⟩ > ⟨CCV⟩) and statistical distribution (i.e., high- vs. low-frequency) of orthographically defined syllables by the bigram trough (Seidenberg, Reference Seidenberg and Coltheart1987; see further) and phonologically defined syllables derived from speech perception and production modulates the direction – that is, facilitation vs. inhibition – and the amplitude of both segmental and prelexical processes. An interpretation was proposed within the non-implemented dual-route Interactive Activation model with Syllables (IAS; Mathey et al., Reference Mathey, Zagar, Doignon and Seigneuric2006). This model includes two routes to retrieve lexical representations. First, a direct orthographic route connects the letter level to the lexical level, and an indirect phonological route links the letter level to an intermediate syllable level that spreads activation to the lexical level. Two complementary processes account for how activation spreads from the letter level to the syllable level and then to the lexical level. When a letter cluster is displayed, the letter level activates the syllable level via facilitatory prelexical between-level connections (e.g., ⟨par⟩ pre-activates the syllable /paʁ/ and deactivates the syllables /baʁ/, /maʁ/, etc.), which, in turn, fires lexical within-level inhibition due to the cohort of lexical competitors between words that share the same initial syllable (i.e., /paʁtiʁ/, to leave, /paʁdɔ̃/, sorry, etc.). If the prelexical between-level activation exceeds the lexical within-level activation, syllable effect facilitation occurs, but this leads to syllable effect inhibition if the lexical within-level activation outclasses the between-level activation. Qualitative and quantitative phonological representations determine the effectiveness of the mapping between orthographic and phonological representations and hence the connection and activation strength between prelexical between-level facilitation and lexical within-level inhibition (Chetail & Mathey, Reference Chetail and Mathey2009a, Reference Chetail and Mathey2013).
Considering that phonemes are abstract phonological units, while syllables are phonological units available long before reading instruction (Duncan et al., Reference Duncan, Colé, Seymour and Magnan2006; Ziegler & Goswami, Reference Ziegler and Goswami2005), it has been proposed that syllables come into play early and are used first by children to decode and recode words. For instance, the syllabic bridge hypothesis (Doignon-Camus & Zagar, Reference Doignon-Camus and Zagar2014; Vazeux et al., Reference Vazeux, Doignon-Camus, Bosse, Mahé, Guo and Zagar2020) postulates that learning spelling-to-sound correspondences relies on the mapping of available phonological units with available orthographic units. Children can quickly learn and extract regularities from letter co-occurrences corresponding to orthographic syllables, which are gradually and straightforwardly connected to available phonological units. This would be even faster since the spelling-to-sound correspondences are less ambiguous at the syllable level than at the phoneme level (e.g., the word-letter cluster ⟨faim⟩, hunger, is easier to map to the syllable /fɛ̃/ rather than to single phonemes /f/+/a/+/i/+/m/ which lead to the incorrect representation). In turn, after learning the letter-to-syllable correspondences, children can allocate their attentional resources to individual letters and understand that ⟨faim⟩ comprises distinct letters connected to individual phonemes.
Another robust argument arises from the clear-cut syllable boundaries in French. How letters co-occur within words does not follow a random distribution, even if the distribution varies across orthographies. The frequency and patterns of letter occurrences and co-occurrences within words are governed by language-specific regularities that allow or ban certain positional associations (e.g., the bigram ⟨rt⟩ never occurs in French onset clusters but occurs in intervocalic positions; Dell, Reference Dell1995). Based on abilities to parse and learn regularities in letter co-occurrences through statistical learning (Arciuli, Reference Arciuli2018; Saffran, Reference Saffran2018), children could extract regularities across syllable boundaries to cluster letters into syllables early (Guo et al., Reference Guo, Vazeux, Doignon-Camus, Bosse, Mahé and Zagar2023). Indeed, letter clusters that straddle the syllable boundaries are of lower frequency than letter clusters that precede or follow the syllable boundaries, which accounts for the grouping of letters into syllables and marking the syllable boundaries, referred to as the bigram trough (e.g., ⟨rt⟩ in ⟨partir⟩, to leave, is lower in frequency than ⟨ar⟩ or ⟨ti⟩ which defines syllables and syllable boundaries, Seidenberg, Reference Seidenberg and Coltheart1987). The bigram trough could act as a powerful statistical cue that makes the syllable boundaries perceptually salient and the syllables functionally relevant in visual word processing in French children (Doignon & Zagar, Reference Doignon and Zagar2006; Doignon-Camus et al., Reference Doignon-Camus, Seigneuric, Perrier, Sisti and Zagar2013; Doignon-Camus & Zagar, Reference Doignon-Camus and Zagar2014; Guo et al., Reference Guo, Vazeux, Doignon-Camus, Bosse, Mahé and Zagar2023).
Although useful (for a review, see Chetail, Reference Chetail2015), the bigram trough is not a sine qua non condition since typically developing children and DYS children have been shown to locate syllable boundaries even in the absence or quasi-absence of distributional cues by relying on the individual sonority of consonants and SPs within intervocalic clusters (Berent et al., Reference Berent, Harder and Lennertz2011; Fabre & Bedoin, Reference Fabre and Bedoin2003; Maïonchi-Pino et al., Reference Maïonchi-Pino, de Cara, Écalle and Magnan2012a, Reference Maïonchi-Pino, de Cara, Écalle and Magnan2012b, Reference Maïonchi-Pino, de Cara, Écalle and Magnan2012c, Reference Maïonchi-Pino, Carmona, Tossonian, Lucas, Loiseau and Ferrand2020; Maïonchi-Pino, de Cara et al., Reference Maïonchi-Pino, de Cara, Écalle and Magnan2015; Marouby-Terriou & Denhière, Reference Marouby-Terriou and Denhière2002; see next paragraph). There are still few studies in silent reading in typically developing children – and even fewer in DYS children – that have focused on sonority, despite crucial literature demonstrating the importance of sonority in cluster reduction in children’s early speech production (i.e., ⟨CCV⟩ à ⟨CV⟩ or ⟨CVC⟩ à ⟨CV⟩; high-sonority consonants tend to be eliminated more frequently than low-sonority consonants, which preserves a maximal sonority distance; Demuth & McCullough, Reference Demuth and McCullough2009; Ohala, Reference Ohala1999; Sprenger-Charolles & Siegel, Reference Sprenger-Charolles and Siegel1997; for a discussion about sonority in children with phonological disorders, Klopfenstein & Ball, Reference Klopfenstein and Ball2010; Wyllie-Smith et al., Reference Wyllie-Smith, McLeod and Ball2006).
Phonological grammar in developmental dyslexia
Developmental dyslexia is a genetic neurodevelopmental disorder that affects 3–15% of school-aged children and refers to an impaired acquisition of reading skills despite normal intellectual, psychological, social, or educational factors (Grigorenko et al., Reference Grigorenko, Compton, Fuchs, Wagner, Willcutt and Fletcher2020; Snowling et al., Reference Snowling, Hulme and Nation2020). To date, there has been no clear conclusion about the nature of the phonological deficit in developmental dyslexia (Ramus et al., Reference Ramus, Marshall, Rosen and van der Lely2013; Share, Reference Share2021), which tends to be a universal marker of reading difficulties (Landerl et al., Reference Landerl, Ramus, Moll, Lyytinen, Leppänen, Lohvansuu, O’Donovan, Williams, Bartling, Bruder, Kunze, Neuhoff, Tóth, Honbolygó, Csépe, Bogliotti, Iannuzzi, Chaix, Démonet, Longeras and Schulte-Körne2013; Melby-Lervåg et al., Reference Melby-Lervåg, Lyster and Hulme2012; Saksida et al., Reference Saksida, Iannuzzi, Bogliotti, Chaix, Démonet, Bricout, Billard, Nguyen-Morel, Le Heuzey, Soares-Boucaud, George, Ziegler and Ramus2016; Ziegler, & Goswami, Reference Ziegler and Goswami2005).
While there is a consensus regarding the phonological deficit, its nature and origin can be accounted for by two contrasting views: the degraded/under-specified (or over-specified) phonological representation hypothesis and the phonological access hypothesis. The degraded/under-specified (or over-specified) phonological representation hypothesis asserts that the phonological deficit results from a categorical perception deficit. Such a deficit implicitly impacts the robustness and distinctiveness of the phonological units essential for merging orthographic representations with phonological representations. This deficit manifests as difficulties at the acoustic-phonetic level in identifying and/or discriminating sounds that differ in a brief and single acoustic-phonetic transition (i.e., voicing; e.g., /ba/ vs. /pa/; for a review, see Noordenbos & Serniclaes, Reference Noordenbos and Serniclaes2015).
The alternative hypothesis, the phonological access hypothesis, has received little attention. It supports the notion that the phonological deficit ensues from difficulties in memorizing, accessing, and retrieving intact phonological representations in contexts that impose perceptual and cognitive demands (e.g., lexical decision, speed or noise, etc.; Ramus & Ahissar, Reference Ramus and Ahissar2012). Evidence from studies in DYS children showed intact phonological abilities, both in the use of orthographic and phonological syllables and statistical regularities (Doignon-Camus et al., Reference Doignon-Camus, Seigneuric, Perrier, Sisti and Zagar2013; Maïonchi-Pino et al., Reference Maïonchi-Pino, Magnan and Écalle2010b, Reference Maïonchi-Pino, Runge and Chabanal2024), across different tasks, including those expected to highlight a phonological deficit in DYS children or adults (i.e., phonological grammar; Berent, Vaknin-Nusbaum et al., Reference Berent, Vaknin–Nusbaum, Balaban and Galaburda2012; Berent et al., Reference Berent, Vaknin–Nusbaum, Balaban and Galaburda2013, Reference Berent, Zhao, Balaban and Galaburda2016; Fabre & Bedoin, Reference Fabre and Bedoin2003; Maïonchi-Pino et al., Reference Maïonchi-Pino, de Cara, Écalle and Magnan2012a, Reference Maïonchi-Pino, Taki, Yokoyama, Magnan, Takahashi, Hashizume, Écalle and Kawashima2013; Marshall et al., Reference Marshall, Ramus and van der Lely2011; Soroli et al., Reference Soroli, Szenkovits and Ramus2010; Szenkovits et al., Reference Szenkovits, Darma, Darcy and Ramus2016; Szenkovits & Ramus, Reference Szenkovits and Ramus2005). The results in speech perception converged toward the recent proposal that the phonetic system dissociates from the phonological one, but impairments in acoustic-phonetic processing do not prevent normal phonological processing because the “phonological deficit all but vanishes” when the phonological grammar is considered (Berent et al., Reference Berent, Vaknin–Nusbaum and Galaburda2022, p. 498). Indeed, if the phonological deficit encompasses both the acoustic-phonetic and phonological systems although both have different representations (Berent et al., Reference Berent, Vaknin–Nusbaum and Galaburda2022), developmental dyslexia should impair the phonological grammar and suppress the gradient-based preferences for well-formed clusters over ill-formed ones. However, DYS children and adults gradually misperceived ill-formed onset clusters as well-formed ones, in the same way as typically developing children and adults (/lb/ 𝔻 /ləb/ > /bd/ 𝔻 /bəd/ > /bn/ 𝔻 /bən/; in English and Hebrew: Berent, Vaknin-Nusbaum et al., Reference Berent, Vaknin–Nusbaum, Balaban and Galaburda2012; Berent et al., Reference Berent, Vaknin–Nusbaum, Balaban and Galaburda2013, Reference Berent, Zhao, Balaban and Galaburda2016). They preferred well-formed syllable boundaries over ill-formed ones, thus segmenting within intervocalic clusters with well-formed clusters (e.g., /aʁ.zal/ > /a.ʁzal/). However, they preferred onset clusters with ill-formed syllable boundaries, thus segmenting before intervocalic clusters (e.g., /a.zʁal/ > /az.ʁal/; in French, Maïonchi-Pino et al., Reference Maïonchi-Pino, Taki, Yokoyama, Magnan, Takahashi, Hashizume, Écalle and Kawashima2013).
These results were replicated in silent reading in French typically developing children and, to a modest extent, in DYS children. What has been shown reveals preferences to detect individual consonants in syllables that conform to the sonority sequencing principle (i.e., high-sonority coda > low-sonority coda and low-sonority onset > high-sonority onset), segment pseudowords whose syllable boundaries respect the syllable contact law (e.g., high-sonority coda + low-sonority onset ⟨lp⟩ > low-sonority coda + low-sonority onset ⟨db⟩ > low-sonority coda + high-sonority onset ⟨tl⟩), and prefer cluster reduction by removing sonorant consonants rather than obstruent ones (e.g., from ⟨tolpude⟩, ⟨topude⟩ > ⟨tolude⟩; Fabre & Bedoin, Reference Fabre and Bedoin2003; Maïonchi-Pino et al., Reference Maïonchi-Pino, de Cara, Écalle and Magnan2012a, Reference Maïonchi-Pino, de Cara, Écalle and Magnan2012b, Reference Maïonchi-Pino, de Cara, Écalle and Magnan2012c; Maïonchi-Pino, de Cara et al., Reference Maïonchi-Pino, de Cara, Écalle and Magnan2015). A main concern related to these studies lies in the use of intervocalic ⟨C1C2⟩ clusters that have quantifiable orthographic and phonological statistical and distributional properties from which the children could have inferred their well-formedness from attested structures in real French words (e.g., ⟨lp⟩ or ⟨rl⟩ in ⟨tolpude⟩ or ⟨torlade⟩; Basirat et al., Reference Basirat, Patin and Jozefowiez2021). Maïonchi-Pino et al. (Reference Maïonchi-Pino, Carmona, Tossonian, Lucas, Loiseau and Ferrand2020), however, bypassed this issue with typically developing children and used intervocalic ⟨C1C2⟩ clusters that are unattested in French onset clusters but are either well-formed SPs (e.g., ⟨rz⟩) or ill-formed SPs (e.g., ⟨zm⟩). Their results revealed gradient-based preferences for well-formed SPs (high-fall SPs > low-fall SPs > plateau SPs > low-rise SPs > high-rise SPs), which followed the sonority-based markedness constraints formalized by Gouskova (Reference Gouskova2004).
The present study
To the best of our knowledge, the phonological grammar through the gradient-based sonority markedness constraints has never been gauged in silent reading in DYS children. Uncertainties persist as to the nature of the phonological deficit, although it affects their reading abilities. The present study aimed to determine whether DYS children have preserved abilities to use phonological syllable segmentation strategies and intact phonological grammar to locate and segment intervocalic ⟨C1C2⟩ clusters with null or quasi-null distributional properties while respecting or transgressing the gradient-based sonority markedness constraints (Gouskova, Reference Gouskova2004).
To do so, we used a lexical decision task in an adapted version of the paradigm used by Treiman and Chafetz (Reference Treiman, Chafetz and Coltheart1987): the children had to decide whether a printed stimulus, whose segmentation was cued in three possible positions, was a real French word or not (e.g., ⟨a*rgent⟩, /aʁʒɑ̃/, ⟨ar*gent⟩, or ⟨arg*ent⟩, money). Here, the best – expected – syllable segmentation is ⟨ar*gent⟩. Alternatively, the children saw a pseudoword whose segmentation was also cued in three possible positions where we manipulated the SPs of unattested intervocalic ⟨C1C2⟩ clusters from unmarked, well-formed SPs to marked, ill-formed SPs (high-fall SPs > low-fall SPs > plateau SPs > low-rise SPs > high-rise SPs). Here, a gradient-based preference following sonority markedness constraints favors the segmentation of high-fall SPs over plateau and high-rise SPs (e.g., ⟨yr*jyde⟩, /iʁʒid/ > ⟨ik*pyte⟩, /ikpit/ > ⟨oj*myze⟩, /ɔʒmiz/).
If one sticks to the degraded/under-specified (or over-specified) phonological representation hypothesis, which predicts imprecise, non-consolidated sublexical phonological representations, DYS children should be unable to use phonological syllable representations to segment and access words. We concur with the phonological access hypothesis. DYS children have intact orthographic and phonological sublexical representations, but their use for segmenting and accessing words in the lexicon is under-optimal. In the task that we proposed, which involved lexical decision, segmentation strategies, and comparisons between attested vs. unattested clusters, thereby overwhelming their short-term memory capacity and attentional resources, DYS children should then have more difficulties in retrieving and processing (pseudo)words. As a consequence, DYS children should be slower than CA and RL peers (Hypothesis #1) but should recognize words whose segmentation matches the syllable boundary (e.g., ⟨ar*gent⟩) faster than words whose segmentation mismatches the syllable boundary (e.g., ⟨ar*gent⟩ > ⟨a*rgent⟩ or ⟨arg*ent⟩; Hypothesis #2).
Next, we adhere to Berent’s (Reference Berent2013) hypothesis; humans are equipped with innate formally grounded constraints on syllable structure restrictions, which are expressed through algebraic optimization rules that guide the (dis)preferences of syllable structures. A universal phonological grammar that is not functionally grounded in constraints derived from the acoustic-phonetic properties of sounds should, therefore, confer the ability to process unattested intervocalic ⟨C1C2⟩ clusters even in the absence of statistical and distributional cues, following a gradient-based preference for syllable boundaries from unmarked, well-formed SPs (e.g., ⟨rj⟩) to marked, ill-formed SPs (e.g., ⟨vl⟩).
Further, if there is a dissociation between the phonetic and phonological systems (Berent, Reference Berent2017; Berent, Vaknin-Nusbaum et al., Reference Berent, Vaknin–Nusbaum, Balaban and Galaburda2012; Berent et al., Reference Berent, Vaknin–Nusbaum, Balaban and Galaburda2013, Reference Berent, Zhao, Balaban and Galaburda2016), even in the presence of an acoustic-phonetic deficit described as the true source of the phonological deficit in developmental dyslexia, which confuses and obstructs phoneme identification and discrimination, DYS children should be sensitive to such gradient-based preference for sonority markedness constraints and compensate for their acoustic-phonetic deficit through the top-down process from their intact phonological grammar (Berent et al., Reference Berent, Vaknin–Nusbaum and Galaburda2022). Hence, it would be easier for children to decide that ⟨y*rjyde⟩ is not a word (⟨rj⟩ is an unattested ill-formed onset cluster) compared with ⟨y*vlyde⟩ (⟨vl⟩ is an unattested well-formed onset cluster; Hypothesis #3). However, it would be more difficult for children to decide that ⟨ur*jyde⟩ is not a word (⟨rj⟩ is a well-formed syllable boundary) compared with ⟨iv*lyde⟩ (⟨vl⟩ is an ill-formed syllable boundary; Hypothesis #4).
Method
Participants
We first recruited 27 DYS children who were referred to by speech and language therapists and diagnosed with mixed profiles of developmental dyslexia (with impaired lexical and sublexical reading skills). We excluded six DYS children from the initial set because three (11.1%) were left-handed, two (7.4%) did not follow the instructions, and one (3.7%) was bilingual. Twenty-one DYS children who were diagnosed within the past 24 months and who had benefited from weekly reading- and phonological awareness-based interventions for less than 24 months were included. They had normal or corrected-to-normal vision and hearing and had no neurological, intellectual, emotional, or psychological disorders (based on parents’ and teachers’ self-reports or speech and language therapists’ reports).
We then tested 66 monolingual typically developing children who regularly attended school in 2nd to 5th grade from three urban and peri-urban elementary schools in the Auvergne-Rhône-Alpes region (France). All the children were from the middle to the upper-middle socioeconomic class and had been taught to read for nine months at least, using a classical mixture of analytical grapheme-to-phoneme correspondences and global procedures (Sprenger-Charolles, Reference Sprenger-Charolles, Verhoeven, Perfetti and Pugh2019). No child repeated a grade or skipped. They were predominantly right-handed (measured using a French translation of the Edinburgh Handedness Inventory – Short Form; Veale, Reference Veale2014). They were submitted to an individual 20-min French standardized age-based word-reading test, TIMÉ 3 (Écalle, Reference Écalle2006), which allows group testing and can be used with children from 7 to 15 years old. TIMÉ 3 enables the inspection of the children’s reading level by assessing the accuracy of the lexical representation level via the use of direct orthographic representations or indirect phonological representations. No analysis was carried out on their responses. We used it to (1) ensure that typically developing children did not experience any reading disorders and had adequate reading age-based profiles and (2) match the typically developing children with the DYS children based either on their chronological age (CA peers) or their reading level (RL peers). Regarding typically developing children, we used their scores in TIMÉ 3 and their personal information to exclude 24 of them (36.4%) because 17 (70.8%) were either of the same chronological age or of the same reading level as already selected CA and RL peers, five (20.8%) were left-handed, and two (20.8%) did not follow the instructions. We then matched the 21 DYS children to 21 CA and 21 RL peers.
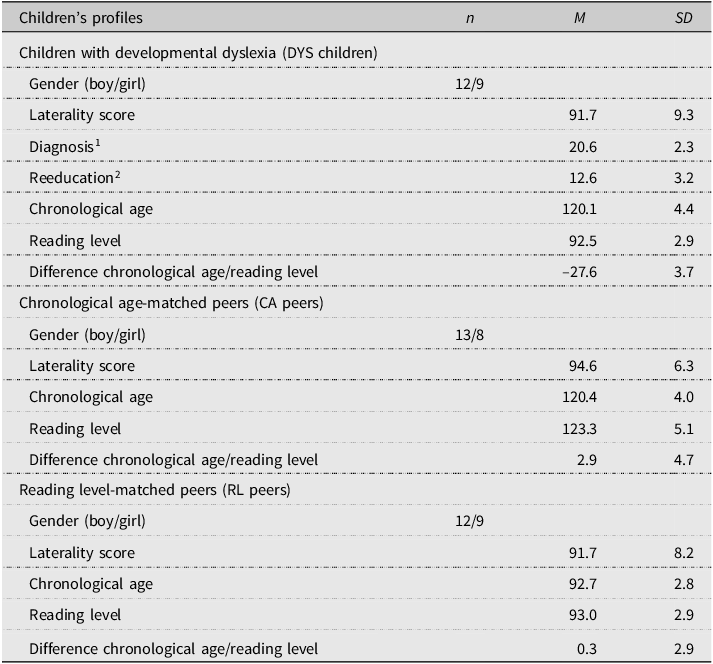
All the children participated after their parents had completed and signed an informed consent form. The Regional School Management Office and the Local Ethics Committee approved this research. Profiles and full descriptive data are provided in Table 1.
Descriptive profiles (numbers, means, and standard deviations) of children with developmental dyslexia (DYS children), chronological age-matched peers (CA peers), and reading level-matched peers (RL peers)

Note: N = 63 (n = 21 per Group). Laterality scores are expressed in percentage (%) and reflect either left-handedness (from –100 to –50) or right-handedness (from 50 to 100). Diagnosis, reeducation, chronological ages, reading levels, differences between chronological ages and reading levels, associated means (M), and standard deviations (SD) are expressed in months. 1 and 2 were obtained thanks to the speech and language therapists.
Material
We designed 35 six-letter long disyllabic ⟨V1C1C2V2C3V3⟩ pseudowords (e.g., ⟨otkyfe⟩) based on the original material in Maïonchi-Pino et al. (Reference Maïonchi-Pino, Carmona, Tossonian, Lucas, Loiseau and Ferrand2020). However, we made substantial changes to fix issues with some intervocalic ⟨C1C2⟩ clusters (n=16/35 [45.7%]). The three initial letters were still ⟨V1C1C2⟩ structures with no geminate, biphonemic grapheme (e.g., ⟨x⟩, /ks/), digraph (e.g., ⟨ch⟩, /ʃ/), or mute consonant grapheme, but with a final ⟨V3⟩ schwa-like vowel (i.e., ⟨e⟩, /ə/), and ⟨C2V2C3⟩ structures in which V2 was ⟨y⟩, the rarest vowel grapheme in French (i.e., /i/; we used ⟨o⟩, /o/ if ⟨y⟩ changes the pronunciation of ⟨C2⟩; e.g., with ⟨g⟩, /g/, ⟨gy⟩ becomes /ʒi/, so we used ⟨go⟩ which sounds /go/; n=4/35 [11.4%]).
All pseudowords had three consonants and three vowels that had regular spelling-to-sound correspondences. However, to ensure the reading and pronunciation of ambiguous ⟨V1C1⟩ (e.g., ⟨ym⟩ and ⟨um⟩ which can be pronounced either /im/, /ym/, /ɛ/, or /um/), we pretested five instances for each [n=10] in different pseudowords (e.g., ⟨umgove⟩, ⟨umdyze⟩, ⟨ymdyle⟩, ⟨ymjuve⟩, etc.) with 24 typically developing children native speakers of French selected in Grade 2 [n=12] and Grade 5 [n=12]. We reported that ⟨ym⟩ was pronounced /um/ [94.2%] while ⟨um⟩ was pronounced /ym/ [96.7%]). All pseudowords had intervocalic ⟨C1C2⟩ clusters which were ill-formed in both word-initial position and syllable-initial structures in French (Dell, Reference Dell1995). However, some can be attested within real French words but were among the rarest ones (i.e., ≥ 0.25 [using cross-databases for positional token frequency, see below]; e.g., ⟨bn⟩; n=17/35). No intervocalic ⟨C1C2⟩ cluster had voicing differences (to avoid regressive/progressive assimilation), and we minimized homorganic consonantsFootnote 1 (except for ⟨dl⟩ and ⟨lj⟩ to fulfill other distributional constraints). Although the intervocalic ⟨C1C2⟩ clusters were ill-formed in initial positions, three segmentations – which were manipulated in the present study – were possible: ⟨V1.C1C2V2C3V3⟩, ⟨V1C1.C2V2C3V3⟩, or ⟨V1C1C2.V2C3V3⟩. Whatever the segmentation, and regardless of whether the segmentation respected or violated the phonotactic restrictions of French, the syllable-initial structures were the rarest (i.e., ⟨V⟩ [8%], ⟨VC⟩ [1.9%], and ⟨VCC⟩ [0.5%]; Léon, Reference Léon2011).
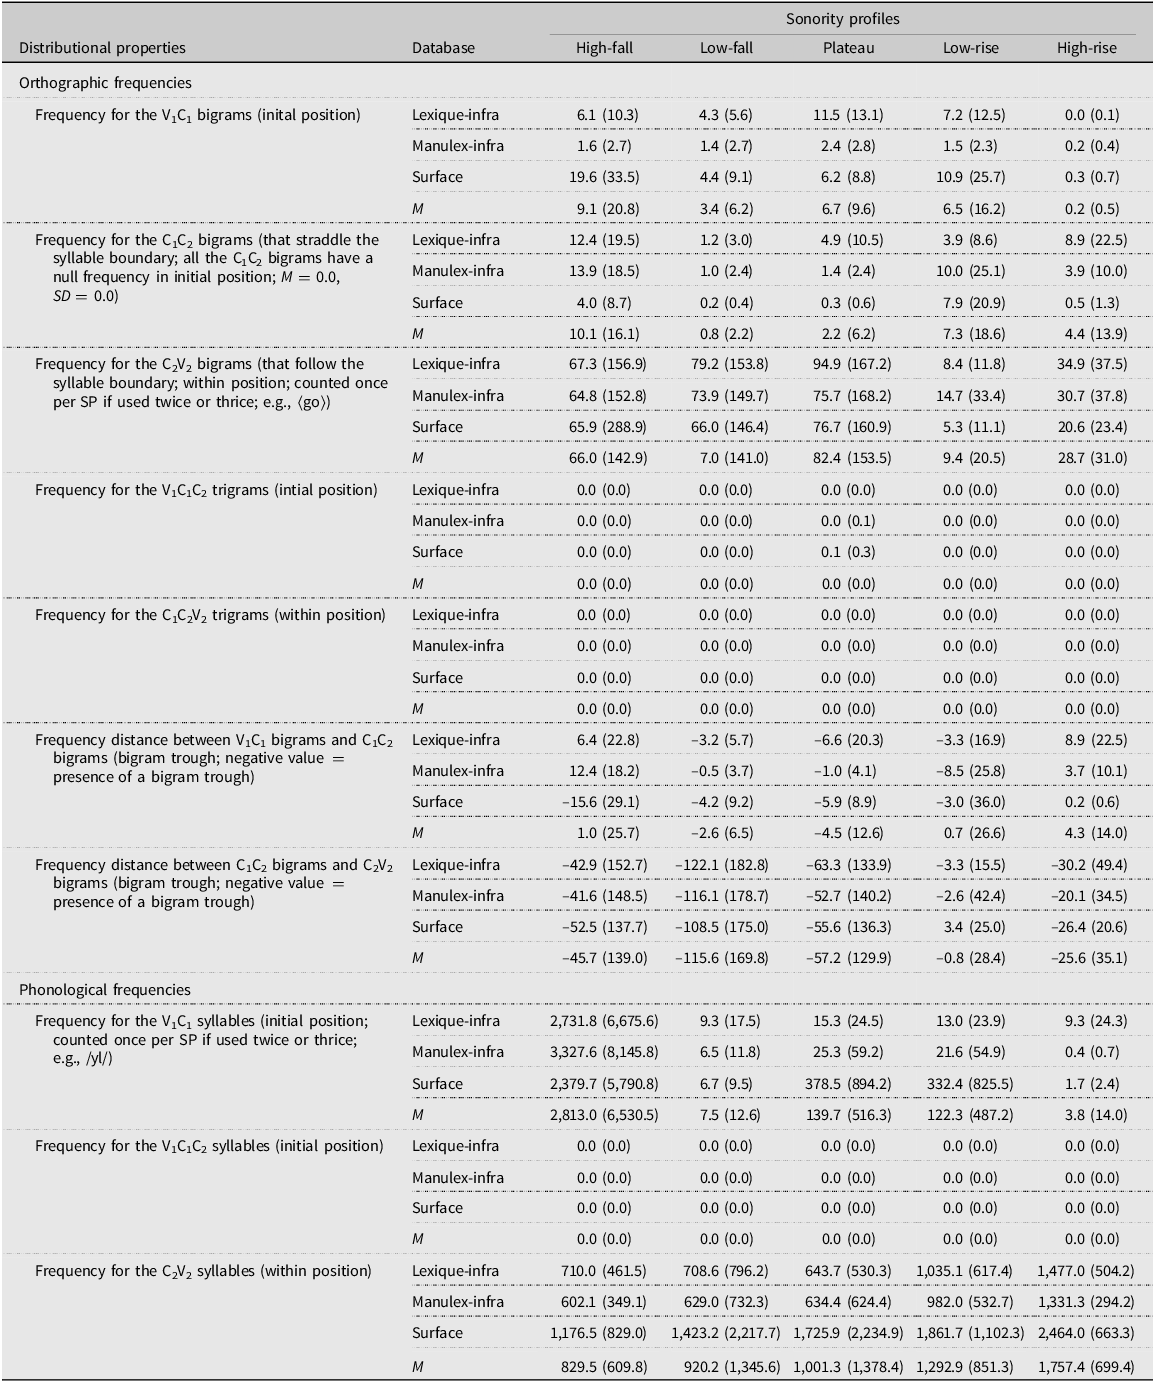
We extended the method of Maïonchi-Pino et al. (Reference Maïonchi-Pino, Carmona, Tossonian, Lucas, Loiseau and Ferrand2020) by combining three up-to-date databases – compared to two in Maïonchi-Pino et al.’s (Reference Maïonchi-Pino, Carmona, Tossonian, Lucas, Loiseau and Ferrand2020) study – to control and minimize the orthographic and distributional properties of the position-dependent sub-components of the ⟨V1C1C2V2C3⟩ pseudowords to null or quasi-null values (Lexique-infra 1.11, Gimenes et al., Reference Gimenes, Perret and New2020; Manulex-infra, Peereman et al., Reference Peereman, Lété and Sprenger-Charolles2007; Surface 2.10, New et al., Reference New, Pallier, Brysbaert and Ferrand2004). We thus extracted the U1-U5 token frequency computation (Grade 1 to Grade 5 instead of U1-U2 – Grade 1 to Grade 2 – previously) from Manulex-infra, which provides grade-level sublexical frequencies for French elementary school readers, to take into account the age ranges of the children who were tested and extrapolate possible exposures to orthographic and phonological co-occurrences provided by sublexical databases in adults (Lexique-infra 1.11 and Surface 2.10). Importantly, there was no clear bigram trough whatever the intervocalic ⟨C1C2⟩ clusters or SPs that we created. Distributional properties are reported in Table 2.
Distributional positional properties for the sub-components of the pseudowords by orthographic and phonological frequencies, sonority profiles, and databases

Note: Frequencies are given by token occurrences; standard deviations are provided in brackets.
Ill-formed intervocalic ⟨C1C2⟩ clusters were not duplicated and were subdivided into five SPs (7 ⟨C1C2⟩ × 5) inspired by the gradient-based sonority markedness of Gouskova (Reference Gouskova2004), from the least marked (legal) and most well-formed syllable contact to the most marked (illegal) and most ill-formed syllable contact as follows: high-fall (e.g., ⟨lb⟩; s=–4, –3, or –2), low-fall (e.g., ⟨fk⟩; s=–1), plateau (e.g., ⟨kp⟩; s=0), low-rise (e.g., ⟨vn⟩; s=+1), and high-rise (e.g., ⟨zr⟩; s=+2 or +3).
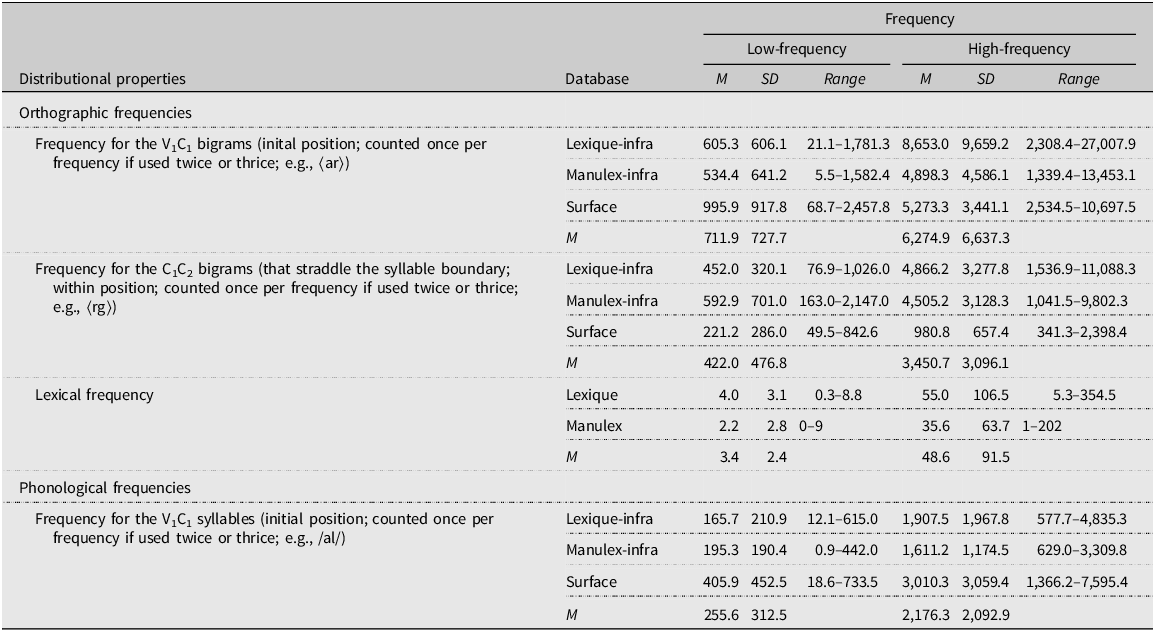
We also added 20 disyllabic, six-letter long real French words with initial ⟨V1C1C2V2⟩ (+⟨V3C3⟩ or ⟨C3V3⟩ or ⟨C3C3⟩) structures and whose acknowledged segmentation is ⟨V1C1.C2V2⟩ (e.g., ⟨argent⟩, money); orthographic and phonological syllable boundaries coincided. We subdivided them into high-frequency words (n=10) and low-frequency words (n=10) using the mean token frequency computed from Manulex (Lété et al., Reference Lété, Sprenger-Charolles and Colé2004) and Lexique 3.83 (New et al., Reference New, Pallier, Brysbaert and Ferrand2004).
We also manipulated the orthographic and the phonological syllable frequencies using the mean token frequency in initial position computed from Manulex-infra (Peereman et al., Reference Peereman, Lété and Sprenger-Charolles2007), Lexique-infra (Gimenes et al., Reference Gimenes, Perret and New2020), and Surface 2.10 (New et al., Reference New, Pallier, Brysbaert and Ferrand2004), and we subdivided them into high-frequency (n=10) and low-frequency orthographic syllables (n=10) and into high-frequency (n=12) and low-frequency phonological syllables (n=8). Finally, we calculated the mean positional bigram frequency for the ⟨C1C2⟩ clusters with the same methods and databases, and we found no systematic bigram trough (n=12/20 [60.0%]). Distributional properties are reported in Table 3. A full list of the words and pseudowords is provided in the Appendix.
Distributional positional properties for the sub-components of the words by orthographic and phonological frequencies, lexical frequency, and databases

Note: Frequencies are given by token occurrences; standard deviations are provided in brackets.
Procedure
The children were tested between March and July 2021. DYS children who were identified first participated first. They were tested individually in an undistracted and silent room in a single session. Neither the teachers nor the experimenters observed or supervised the children. No child missed the computer-driven task after completing the TIMÉ 3 and the Edinburgh Handedness Inventory – Short Form, interrupted the session, or quit the study.
The script was designed, compiled, and run with E-Prime® 3.0 Professional software (Psychology Software Tools, Inc., 2016) on Dell® Latitude laptop computers with a 1920 × 1080 LCD screen resolution, a 60-Hz refresh rate, and running under Windows® 10. The children were instructed to report whether the stimulus was a real French word or not. They had to press on the “green” (“yes”) or “red” (“no”) response keys (“n” and “x” keys on an AZERTY keyboard, respectively). The software automatically recorded the response times (RTs) and response accuracy (RA).
The stimuli were displayed in black-colored lowercase letters typed in Courier font on a white background. The words and pseudowords were displayed one at a time. They were segmented by an asterisk (i.e., “*”) placed either (1) before the ⟨C1C2⟩ cluster (e.g., ⟨y*rjyde⟩), (2) within the ⟨C1C2⟩ cluster (e.g., ⟨yr*jyde⟩), or (3) after the ⟨C1C2⟩ cluster (e.g., ⟨yrj*yde⟩). The children sat approximately 60 cm from the screen. The stimuli covered a visual angle of approximately 2.46°. Each trial proceeded as follows: a centered, black-colored fixation cross (+) was displayed for 500 ms, followed by a word or a pseudoword, which appeared at the center of the screen until the child responded (after 5,000 ms, a warning message indicated the absence of response, and this was labeled as an error). The next trial followed after a 750-ms delay. First, the children were trained with a practice list (n=10). No corrective feedback was provided on the practice list and the experimental lists.
Our material resulted in two conditions (i.e., word, “yes” responses vs. pseudoword, “no” responses). In both conditions, each word and pseudoword was displayed three times by undergoing the three segmentations as follows: ⟨V1*C1C2V2⟩, ⟨V1C1*C2V2⟩, or ⟨V1C1C2*V2⟩ (n words=60; n pseudowords=105). The conditions and segmentations were counterbalanced across five experimental lists (i.e., 33 trials per list; 12 “yes” responses and 21 “no” responses) that were separated by self-paced pauses. The distribution of the stimuli was pseudo-randomized (i.e., the same word or pseudoword was not presented in the same list, whereas the number of segmentation types was equivalent; i.e., 11 × 3). The order in which the stimuli were presented was randomized. To avoid decision bias, we inserted two additional fillers after each pause (n=10; i.e., at the beginning of each experimental list), and the corresponding results were excluded from the statistical analysis.
Results
We collected 11,655 data points, of which 3,780 were “yes” responses and 6,615 were “no” responses. We preprocessed and analyzed data for “yes” and “no” responses separately. We used a restrictive three-step data processing procedure for data inclusion. First, RTs associated with errors were excluded from the analysis (n ‘yes’=103, [2.7%]; n ‘no’=122 [1.8%]). No correct RT was ≤ 400 ms (motor anticipation) or ≥ 4,000 ms (late cognitive processes). Then, correct RTs were trimmed (for each child, RTs that deviated by ± 2.5 standard deviations from the mean for each segmentation type were replaced by the respective mean of each segmentation type; n ‘yes’=90, [2.5%]; n ‘no’=124 [1.9%]). We did not use imputation methods to fill in missing data. No child reached random threshold (50% ± 5%) after standardization (88.3% to 100.0%). No item returned null or random correct responses (71.4% to 100.0%).
Due to model misspecification (non-normally right-skewed distribution of the RTs; Skewness‘yes’=1.89, Kurtosis‘yes’=6.46; Skewness‘no’=0.94, Kurtosis‘no’=2.56), we used a log-normal transformation (ln(x); Skewness‘yes’=0.96, Kurtosis‘yes’=2.11; Skewness‘no’=0.16, Kurtosis‘no’=0.60). Log-transformed RTs for each item as a dependent variable were entered into Linear Mixed-Effects Models. Children and items were considered random factors, whereas Group (DYS children vs. CA peers vs. RL peers), Segmentation (⟨V1*C1C2V2⟩ vs. ⟨V1C1*C2V2⟩ vs. ⟨V1C1C2*V2⟩), and either Lexical Frequency, Orthographic Frequency, and Phonological Frequency (high- vs. low-frequency; “yes” responses) or Sonority Profile (high-fall vs. low-fall vs. plateau vs low-rise vs. high-rise; “no” responses) were fixed factors.
RTs that were standardized and converted into errors and the error rate represented 5.2% of the expected “yes” responses and 3.7% of the expected “no” responses. Due to ceiling effects, RA was not analyzed.
We submitted our mixed-design repeated-measures models to Jamovi 2.4.11 software (The Jamovi Project, 2023). All LMM models successfully converged (Bound Optimization By Quadratic Approximation [bobyqa] optimizer). Goodness-of-fit R2marg showed that fixed effects accounted for 23.6% (“yes”) and 41.1% (“no”) of variance, whereas all effects together (fixed + random effects; R2cond) accounted for 63.5% (“yes”) and 72.8% (“no”) of variance. When applicable, we used the post hoc p Bonferroni–Holm’s adjusted α level for significance to control the family-wise error rate for multiple comparisons (p B-H). To report Ms, CIs, and Δs, we back-transformed the log-normal data from ln to ms with e ln(x) = x.
For “yes” responses (i.e., words)Footnote 2, the main effect of Group was significant, F(2, 60.6)=15.51, p < .0001, 95% CI (1,044, 1,365); DYS children recognized words more slowly (M=1,228 ms, 95% CI [1,173, 1,286]) than CA peers (Δ=135 ms, M=1,093 ms, 95% CI [1,044, 1,145], t(60.7)=3.61, p B-H = .001) but responded faster than RL peers, although the difference was not statistically significant (Δ=76 ms, M=1,304 ms, 95% CI [1,244, 1,365], t(60.6)=–1.87, p B-H=.07).
The Segmentation main effect was also significant, F(2, 36.1)=20.57, p < .0001, 95% CI (1,120, 1,291); the words were identified with the ⟨V1C1*C2V2⟩ segmentation faster (M=1,155 ms, 95% CI [1,120, 1,192]) than the ⟨V1*C1C2V2⟩ segmentation (Δ=95 ms, M=1,250 ms, 95% CI [1,212, 1,291], t(36.1)=6.38, p B-H < .0001) or the ⟨V1C1C2*V2⟩ segmentation (Δ=56 ms, M=1,211 ms, 95% CI [1,174, 1,249], t(36.0)=–3.79, p B-H=.001).
There was no significant main effect or interaction with either the Lexical Frequency, Orthographic Frequency, or Phonological Frequency factors (p s > .1).
For “no” responses (i.e., pseudowords)Footnote 3, the Group main effect was significant, F(2, 60.0)=35.25, p < .0001, 95% CI (1,232, 1,631); DYS children rejected pseudowords more slowly (M=1,564 ms, 95% CI [1,500, 1,631]) than CA peers (Δ=280 ms, M=1,284 ms, 95% CI [1,232, 1,339], t(60.0)=6.73, p < .0001) but did not significantly differ from RL peers (Δ=46 ms, M=1,610 ms, 95% CI [1,544, 1,679], t(60.0)=0.99, p > .1).
The Group × Segmentation × Sonority Profile interaction was significant, F(16, 6,298.3)=6.81, p < .0001, 95% CI (1,103, 1,806) (Figure 2); we, therefore, inspected the Segmentation × Sonority Profile interaction for each Group.
Mean response times (RTs) in milliseconds (ms) for the Group × Segmentation × Sonority Profile interaction with the “no” responses (pseudowords; bars represent 95% confidence intervals [CI]; upper panel: DYS children, middle panel: CA peers, and lower panel: RL peers).
Note. “S1” stands for ⟨V1*C1C2V2⟩ segmentation, “S2” for ⟨V1C1*C2V2⟩ segmentation, and “S3” for ⟨V1C1C2*V2⟩ segmentation; “HF” is for high-fall, “LF” for low-fall, “PL” for plateau, “LR” for low-rise, and “HR” for high-rise sonority profiles.

Whichever Group, there was a significant gradual decrease from high-fall SPs to high-rise SPs for ⟨V1C1*C2V2⟩ segmentation with systematic significant differences between both extreme SPs (4.26 < t s < 9.26, p s < .02). The difference between high-fall SPs and plateau SPs was significant in DYS children, t(144.6)=4.09, p=.04 and CA peers only, t(143.8)=6.39, p < .0001 (in RL peers, t(143.3)=2.91, p > .1), while the difference between plateau SPs and high-rise SP was not significant whichever Group (–3.77 < t s < –1.34, p s > .1).
However, there was a reverse pattern for ⟨V1*C1C2V2⟩ segmentation with systematic significant differences between both extreme SPs (–9.58 < t s < –5.78, p s < .0001). The difference between high-fall SPs and plateau SPs was not significant whichever Group (–2.72 < t s < –2.16, p s > .1), while the difference between plateau SPs and high-rise SP was significant in DYS children, t(143.4)=4.95, p < .0001 and CA peers only, t(142.0)=6.87, p < .0001 (in RL peers, t(141.7)=3.62, p > .1).
For ⟨V1C1C2*V2⟩ segmentation, there was a decrease from high-fall SPs to plateau SPs but an increase from plateau SPs to high-rise SPs, which depicted a V-curve with no significant difference between high-fall SPs and high-rise SPs whichever Group (–0.93 < t s < 0.74, p s > .1). Although plateau SPs spiked down, there was no significant difference with high-fall SPs and high-rise SPs whichever Group (2.93 < t s < 3.71, p s > .1; 2.28 < t s < 3.86, .09 > p s > .1, respectively).
Discussion
We investigated whether DYS children, who are diagnosed with a phonological deficit, have preserved phonological representations that allow them to use the syllables to segment and access words in silent reading. Crucially, we examined whether DYS children benefit from their phonological grammar, which involves sonority markedness constraints. More specifically, we examined their abilities to segment intervocalic ⟨C1C2⟩ clusters across syllable boundaries when no statistical and distributional cues were available.
Our results support Hypothesis #1. DYS children are slower – but not less accurate – than CA and RL peers with either words or pseudowords. This observation accommodates our Hypothesis #2, which we validate too; DYS children – like CA and RL peers – recognize words when segmentation matches the syllable boundary (i.e., ⟨ar*gent⟩) faster than when segmentation mismatches the syllable boundary (i.e., ⟨a*rgent⟩ and ⟨arg*ent⟩). This confirms a syllable compatibility effect and attests to the abilities of DYS children to use syllable representations to segment and access words, but rarely with rare ⟨VC⟩ syllables (with ⟨CV⟩ and ⟨CVC⟩ syllables in Doignon-Camus et al., Reference Doignon-Camus, Seigneuric, Perrier, Sisti and Zagar2013; Maïonchi-Pino et al., Reference Maïonchi-Pino, Magnan and Écalle2010b). These first results do not support the degraded/under-specified (or over-specified) phonological representation hypothesis, which predicts that DYS children will be unable to access orthographic and phonological sublexical units like syllables, but rather fuel the phonological access hypothesis (Ramus & Ahissar, Reference Ramus and Ahissar2012; Ramus & Szenkovits, Reference Ramus and Szenkovits2008).
Following the predominant degraded/under-specified (or over-specified) phonological representation hypothesis, this syllable compatibility effect in a task involving lexical decision echoes that observed in beginning and poor readers in Chetail and Mathey (Reference Chetail and Mathey2009a, Reference Chetail and Mathey2013) who referred to the IAS model to account for this effect (Mathey et al., Reference Mathey, Zagar, Doignon and Seigneuric2006). Their interpretation suggests that beginning and poor readers have imprecise, non-consolidated phonological sublexical representations at the syllable level – a context similar to but distinct from that of DYS children – which weakens the connection and activation strength between the letters and syllables. Thus, the syllable compatibility increases the activation of orthographic sublexical representations at the letter level. However, poor phonological sublexical representations lower prelexical between-level facilitation. This, in turn, slows down activation propagation to the lexical level, triggering a within-level inhibition that underlies lexical competition. This resulted in strict syllable compatibility facilitation (with ⟨CV⟩ and ⟨CVC⟩ syllables). From our results, we discarded the hypothesis of degraded/under-specified phonological representations in DYS children to account for the syllable compatibility effect. First, their response patterns are similar to those observed in CA and RL peers who are “normal-to-good” readers and have, subsequently, built robust and dense sublexical representations that should have triggered syllable compatibility inhibition due to lexical competition. Then, despite their slowness, which could reflect a speed/accuracy trade-off and an impairment of the phonological route (Ziegler et al., Reference Ziegler, Castel, Pech-Georgel, George, Alario and Perry2008; Reference Ziegler, Perry and Zorzi2014), DYS children exhibit close-to-perfect accuracy at recognizing words, whether in syllable compatibility or syllable incompatibility. If DYS children have degraded/under-specified orthographic and phonological sublexical representations that should impair the processing of syllable representations, this should have affected access, as well as both the quality and quantity of lexical representations (i.e., lexical quality hypothesis; Perfetti, Reference Perfetti2007; Perfetti & Hart, Reference Perfetti, Hart, Verhoeven, Elbro and Riesma2002). Based on our results, this does not seem to be true. We propose that ⟨VC⟩ syllables are non-canonical phonological sublexical representations that are underrepresented in French. Hence, it reduces the stock of lexical representations, which is insufficient to trigger lexical competition. This explains both the slowness of DYS children and CA and RL peers compared to the results for ⟨CV⟩ and ⟨CVC⟩ syllables in previous studies that used a lexical decision task and the absence of orthographic and phonological syllable frequency effects. Indeed, either orthographic or phonological frequency modulates the facilitation vs. inhibition frequency effects. High-frequency orthographic and phonological syllables propagate activation quickly and strongly at each level to trigger lexical within-level inhibition. Low-frequency orthographic and phonological syllables slowly and weakly spread activation at each level, yet they prevent lexical inhibition. Furthermore, ⟨CV⟩ and ⟨CVC⟩ syllables are overrepresented in French (60% and 17%, respectively; Léon, Reference Léon2011), generating more possible lexical candidates to underlie lexical inhibition than ⟨VC⟩ syllables. Here, how rare are words that begin with ⟨VC⟩ syllables may suppress syllable frequency effects.
However, the preference for the ⟨V1C1*C2V2⟩ segmentation with words may also suggest the importance of statistical and distributional orthographic properties in locating the syllable boundaries and grouping letters into syllables. As proposed by Doignon-Camus et al. (Reference Doignon-Camus, Seigneuric, Perrier, Sisti and Zagar2013), DYS children have preserved abilities to parse and learn the statistical properties of letter co-occurrences via sensitivity to the bigram trough (but see Bonte et al., Reference Bonte, Poelmans and Blomert2007; Gabay et al., Reference Gabay, Thiessen and Holt2015; Vandermosten et al., Reference Vandermosten, Wouters, Ghesquière and Golestani2019 for impairments in tuning to statistical regularities in speech perception). Doignon-Camus et al. (Reference Doignon-Camus, Seigneuric, Perrier, Sisti and Zagar2013) pointed out that syllable segmentation does exist in DYS children when both the orthographic and phonological syllable boundaries coincide (e.g., ⟨BI#/MIR⟩ or ⟨RON#/TA⟩; the hash indicates the orthographic boundary, the slash stands for the phonological boundary) but disappears to favor segmentation based on the bigram trough only (e.g., ⟨BI.M/BU⟩ or ⟨RO/N.ER⟩) suggesting a pure orthographic syllable effect. We would like to qualify this conclusion. First, the bigram trough illustrates the typological tendencies in French to disallow some intervocalic ⟨C1C2⟩ clusters as onset clusters, which naturally impose restrictions on phonological representations and mechanically mark syllable boundaries. An in-depth inspection of the bigram frequency of the ⟨V1C1⟩ clusters and the ⟨C1C2⟩ in our words confirms a bigram trough for some – but not all (n=12 [60.0%]) – words that we used whatever the database that we considered, but this does not guide the children’s segmentation strategies. Therefore, there remains an issue to understand how – and why – the ⟨V1C1*C2V2⟩ segmentation has been preferred when there was no clear bigram trough.
We validate Hypothesis #3 and #4. For the first time, we manipulated sonority markedness constraints for intervocalic ⟨C1C2⟩ clusters which could be simultaneously marked, ill-formed SPs or unmarked, well-formed SPs for onset clusters (⟨V1*C1C2V2C3V3⟩), syllable boundaries (⟨V1C1*C2V2C3V3⟩), or coda clusters in silent reading (⟨V1C1C2*V2C3V3⟩; but see Maïonchi-Pino et al., Reference Maïonchi-Pino, Taki, Yokoyama, Magnan, Takahashi, Hashizume, Écalle and Kawashima2013 in speech perception). We find a clear-cut sonority projection effect, that is, a gradient-based preference of sonority markedness constraints for the intervocalic ⟨C1C2⟩ clusters, which differs according to cued segmentation. As such, this first observation refutes a category-based preference that predicts ⟨C1C2⟩ clusters to be perceived and processed equally regardless of the SPs because all of them are nonexistent in the language-specific phonological grammar of French (White & Chiu, Reference White and Chiu2017). Although we acknowledge the attestedness of some of our ⟨C1C2⟩ clusters, these ⟨C1C2⟩ clusters are rare in French, especially for children who have most likely never encountered them before, and, if attested, do exist in specific positions only (i.e., intervocalic position within words; e.g., ⟨lb⟩ in ⟨album⟩, album). Our analysis indicates that attestedness, which is observed in the different SPs that we designed, does not influence the gradual (dis)preference for these ⟨C1C2⟩ clusters whatever the segmentation. Hence, we concur with the view that attestedness and well-formedness are perceived and processed differently and potentially occur at two different levels with two different time courses (Basirat et al., Reference Basirat, Patin and Jozefowiez2021; Hayes & White, Reference Hayes and White2013; White & Chiu, Reference White and Chiu2017). Crucially, our results indicate that the sonority projection effect does not derive from statistical and distributional cues since neither attestedness nor orthographic and phonological statistical properties of ⟨V1C1⟩, ⟨V1C1C2⟩, and ⟨C1C2⟩ clusters, which were kept to null or quasi-null values, modulate the (mis)perception of sonority markedness constraints (Berent, Reference Berent2017; Berent & Lennertz, Reference Berent and Lennertz2010). This result confirms that of previous studies in French-speaking DYS children and typically developing children (Maïonchi-Pino et al., Reference Maïonchi-Pino, de Cara, Écalle and Magnan2012a, Reference Maïonchi-Pino, de Cara, Écalle and Magnan2012b; Maïonchi-Pino, de Cara et al., Reference Maïonchi-Pino, de Cara, Écalle and Magnan2015). An important issue lies in ⟨C1C2⟩ clusters that are inequally unattested but share features with attested ⟨C1C2⟩ clusters from which children can extract and generalize them to our ⟨C1C2⟩ clusters (e.g., ⟨ft⟩ 𝔻 ⟨st⟩; Hayes & Wilson, Reference Hayes and Wilson2008), although most are featurally distant and distinct and cannot directly account for response patterns (e.g., ⟨zg⟩; Daland et al., Reference Daland, Hayes, White, Garelleck, Davis and Norrmann2011). If true and corollary to gradient-based preferences, this suggests that DYS children have preserved sensitivity to the featural properties of sounds to enforce phonological changes which make ⟨C1C2⟩ clusters acceptable, indicating well-specified phonological representations and, hence, compensation from intact phonological grammar (Marshall et al., Reference Marshall, Ramus and van der Lely2011; Soroli et al., Reference Soroli, Szenkovits and Ramus2010; Szenkovits et al., Reference Szenkovits, Darma, Darcy and Ramus2016).
As mentioned, DYS children – like CA and RL peers – exhibit a gradient-based preference for sonority markedness constraints for the intervocalic ⟨C1C2⟩ clusters. With the ⟨V1*C1C2V2C3V3⟩ segmentation which highlights unattested ⟨C1C2⟩ onset clusters in French (e.g., ⟨lz⟩), DYS children gradually reject pseudowords faster as sonority-based markedness decreases from unmarked, well-formed ones (high-rise SPs; e.g., ⟨vl⟩) to marked, ill-formed ⟨C1C2⟩ onset clusters (high-fall SPs; e.g., ⟨rz⟩). With the ⟨V1C1*C2V2C3V3⟩ segmentation which stands for the expected segmentation within ⟨C1C2⟩ clusters that are unattested in the onset position in French, whatever the SPs that we designed, DYS children demonstrate a gradient-based preference of sonority markedness constraints that is proportionally reversed compared to the ⟨V1*C1C2V2C3V3⟩ segmentation; response times to reject pseudowords as words increase from marked, ill-formed ⟨C1C2⟩ onset clusters (high-rise SPs; e.g., ⟨vl⟩) to unmarked, well-formed ⟨C1C2⟩ onset clusters (high-fall SPs; e.g., ⟨rz⟩). Finally, with the ⟨V1C1C2*V2C3V3⟩ segmentation, both extreme SPs (high-fall SPs and high-rise SPs) do not differ but take longer to be rejected than plateau SPs. These a priori counterintuitive response patterns – native speakers generally show a preference for unmarked, well-formed SPs and phonologically repair marked, ill-formed ones (Berent et al., Reference Berent, Steriade, Lennertz and Vaknin2007, Reference Berent, Lennertz, Jun, Moreno and Smolensky2008, Reference Berent, Harder and Lennertz2011; Berent, Lennertz, & Balaban, Reference Berent, Lennertz and Balaban2012; Dupoux et al., Reference Dupoux, Parlato, Frota, Hirose and Peperkamp2011; Tamási & Berent, Reference Tamási and Berent2015; Zhao & Berent, Reference Zhao and Berent2016) – describe a possible dual underlying processing. First, high-rise SPs for ⟨C1C2⟩ onset clusters and high-fall SPs for intervocalic ⟨C1C2⟩ clusters respect the sonority sequencing principle and the syllable contact law, respectively, and hence conform to the well-formedness of ⟨C1C2⟩ clusters on which there is a sonority projection effect in their respective specific positions. After controlling and ruling out the effects of the statistical and distributional properties and attestedness of our ⟨C1C2⟩ clusters, we suggest that this sonority-based well-formedness generates a conflictual situation that arises from two-cycle processing. The ⟨C1C2⟩ clusters are first analyzed through phonological grammar. This allows children to quickly reject pseudowords that embed marked, ill-formed SPs. However, it engages an additional analysis of unmarked, well-formed SPs that are ambiguous through sonority-based similarities with attested, well-formed ⟨C1C2⟩ clusters in French. This analysis advocates the maximal onset satisfaction principle, which maximizes the number of consonants in onset clusters, as long as it does not contradict universal and language-specific phonotactic restrictions (Spencer, Reference Spencer1996).
We confirm previous studies on speech perception with adult listeners (Hayes & Wilson, Reference Hayes and Wilson2008; Ulbricht et al., Reference Ulbrich, Alday, Knaus, Orzechowska and Wiese2016; White & Chiu, Reference White and Chiu2017); here, children first activate their abstract phonological grammar, which scans the sonority markedness constraints from a gradient-based analysis to determine well-formedness and then perform a lexical analysis by comparing unmarked, well-formed ⟨C1C2⟩ clusters to plausible lexical candidates. Therefore, this slows down response times. However, if one considers that lexical analysis precedes analysis in the phonological grammar, we should have found equivalent response times regardless of the SPs – that is, no sonority projection effect – since the ⟨C1C2 clusters do not exist, in particular in onset position, and should be processed as category-based (dis)preferences. Of interest is what happens to coda clusters (⟨V1C1C2*V2C3V3⟩ segmentation). Although we did not predict specific response patterns, the V-curve that depicts the delayed response times for both extreme SPs accommodates the lexical interferences that we describe. Indeed, high-fall SPs respect the sonority sequencing principle (Clements, Reference Clements, Kingston and Beckman1990; Reference Clements, Raimy and Cairns2009; Parker, Reference Parker and Parker2012; e.g., ⟨rj⟩: an optimal coda should decrease minimally from the vowel, but high-rise SPs transgress this by describing an optimal onset that should increase maximally toward the vowel. However, both forms are attested SPs in some lexical representations of French (e.g., /aʁk/, ⟨arc⟩, bow [close sonority] or /apʁ/, ⟨âpre⟩, bitter [far sonority]). The gradient-based preferences between SPs, though visible, concern those with a specific sonority distance. This is true between high-fall and plateau SPs (s=–3/–2) and/or high-rise SPs and plateau SPs (s=+2/+3); and, of course, between high-rise SPs and high-fall SPs (s=–5/+5), except for the ⟨V1C1C2*V2C3V3⟩ segmentation. Beyond this observation, neither low-fall SPs nor low-rise SPs differ from either high-fall SPs, plateau SPs, or high-rise SPs, pinpointing the importance for clusters to respect the sonority dispersion principle, which posits a maximal sonority distance between the onset and the vowel (Clements, Reference Clements, Kingston and Beckman1990) and the minimal sonority distance (Selkirk, Reference Selkirk, Arnolf and Octyle1984; Zec, Reference Zec and de Lacy2007), which stipulates an optimal sonority rise by at least x degrees from the cluster to the vowel. Therefore, low-fall and low-rise SPs are under-optimal, which may explain their intermediate status, which makes them sometimes harder, sometimes easier to perceive and process (Gierut, Reference Gierut2007; Marouby-Terriou & Denhière, Reference Marouby-Terriou and Denhière2002).
Conclusion
Taken together, our results straightforwardly demonstrate that DYS children behave similarly to their CA and RL peers despite being diagnosed with developmental dyslexia with impaired phonological abilities. Although we ensured cautious upstream sampling of DYS children (M age = 120.1, SD = 4.4; M reading level = 92.5, SD = 2.9; M delay = –27.6, SD = 3.7), we observed variations in sensitivity to sonority markedness constraints and in abilities to segment words and pseudowords accordingly (as in CA and RL peers). Based on ad hoc correlation analysis in DYS children, there was no direct link between accuracy and reading delay (r = .0007, p > .1), but the correlation was significant between log-transformed RTs and reading delay (r = .14, p < .0001). Beyond the relative non-homogeneity within DYS children, their response patterns appear similar to those in CA and RL peers. Of course, this may be due to partial compensation by longer exposure to reading or remediation for some DYS children. This point needs further clarification. However, overall, this leads us to a threefold conclusion. First, we extended the hypothesis that all DYS children do not have degraded/under-specified (or over-specified) phonological representations (Ramus & Ahissar, Reference Ramus and Ahissar2012). We shed light on abilities to use phonological syllable representations to segment and access words through facilitation with syllable compatibility segmentation. However, we wondered whether their abilities to segment words uncontroversially denoted preserved phonological representations due to the systematic presence of a bigram trough. If this is the case, then their sensitivity to such a distributional cue attests to DYS children’s preserved abilities to parse and extract orthographic properties of letter co-occurrences (Doignon-Camus et al., Reference Doignon-Camus, Seigneuric, Perrier, Sisti and Zagar2013; for a review, see Arciuli, Reference Arciuli2018).
More importantly, we then found a gradient-based preference for the sonority markedness constraints when segmenting pseudowords. Their segmentation strategies follow a systematic sonority projection effect that resides in preferences for well-formed ⟨C1C2⟩ clusters but is not blind to the position of the segmentation to dissociate either possible onset clusters, coda clusters, or syllable boundaries. Their sensitivity to the sonority-based structural properties of syllables stems from an intact phonological grammar that compensates or repairs unattested and ill-formed clusters to favor optimal segmentations even in the absence or quasi-absence of statistical and distributional properties (Berent & Lennertz, Reference Berent and Lennertz2010; Berent et al., Reference Berent, Harder and Lennertz2011, Reference Berent, Vaknin–Nusbaum and Galaburda2022; Maïonchi-Pino et al., Reference Maïonchi-Pino, de Cara, Écalle and Magnan2012a, Reference Maïonchi-Pino, de Cara, Écalle and Magnan2012b, Reference Maïonchi-Pino, Carmona, Tossonian, Lucas, Loiseau and Ferrand2020; Maïonchi-Pino, de Cara et al., Reference Maïonchi-Pino, de Cara, Écalle and Magnan2015). Their slowness – whether in recognizing words or rejecting pseudowords that bear SPs, which make them similar to attested words – rather points to degraded access to both syllable representations and, to a lesser extent because we observe possible lexical interferences, lexical representations with under-specified phonological procedures.
We thus strengthen previous studies that claimed that if there is a phonological deficit, it does not lie in the phonological grammar, whether we consider an innate, universalist conception of the phonological grammar or the language-specific phonological grammar of French (Berent et al., Reference Berent, Vaknin–Nusbaum, Balaban and Galaburda2013, Reference Berent, Zhao, Balaban and Galaburda2016, Reference Berent, Vaknin–Nusbaum and Galaburda2022; Berent, Vaknin-Nusbaum et al., Reference Berent, Vaknin–Nusbaum, Balaban and Galaburda2012; Maïonchi-Pino et al., Reference Maïonchi-Pino, Taki, Yokoyama, Magnan, Takahashi, Hashizume, Écalle and Kawashima2013; Marshall et al., Reference Marshall, Ramus and van der Lely2011; Soroli et al., Reference Soroli, Szenkovits and Ramus2010; Szenkovits et al., Reference Szenkovits, Darma, Darcy and Ramus2016). If there is a phonological deficit, it is rooted elsewhere, like in the phonetic-phonological processing (Bonte et al., Reference Bonte, Poelmans and Blomert2007), the articulatory constraints (Hayes & White, Reference Hayes and White2013; Proctor & Walker, Reference Proctor, Walker and Parker2012), or in interaction with other factors that come into play in phonological processing (e.g., phonotactic transitional probabilities, frequency, etc.; Wiese et al., Reference Wiese, Orzechowska, Alday and Ulbrich2017; Wulfert et al., Reference Wulfert, Auer and Hanulíková2022). Further research is also needed to decipher to what extent the phonological grammar is fully or partly innate and whether a sonority-based intervention can play a play in the remediation of the phonological deficit in DYS children (Hunter, Reference Hunter2019).
Replication package
All research materials, data, analysis code, and instructions are freely and publicly available at: https://osf.io/ec87z/.
Acknowledgments
We would like to thank the three anonymous reviewers for their insightful comments. We would like to thank the speech and language therapists, neuropsychologists, teachers, parents, and children who voluntarily participated in this study. We thank Master’s students who were involved in the data collection.
Contributions
Norbert Maïonchi-Pino conceived, designed, and supervised this study. Norbert Maïonchi-Pino and Master’s students collected the data. Norbert Maïonchi-Pino and Master’s students analyzed and interpreted the data. Norbert Maïonchi-Pino wrote the paper. Élise Runge edited the text, figures, tables, and references. Norbert Maïonchi-Pino and Élise Runge revised the paper. Norbert Maïonchi-Pino and Élise Runge approved the submission of the manuscript for publication.
Funding
No funding supported this research.
Competing interests
The authors declare no competing interests.
Ethics approval
The Regional School Management Office and the Local Ethics Committee approved this research (IRB00011540–2021–25).
Consent to participate
All children participated after their parents had completed and signed an informed consent form.
Appendix. List of stimuli for the words and pseudowords by sonority profiles


 Open access