

1. Introduction
RNA molecules underlie many of the core processes of life. RNA's biological roles include catalysis of peptide bond formation and deciphering the genetic code in all living systems; elaborate alternative splicing of RNA messages in different tissues during metazoan development and evolution; and packaging, replication, and processing of pervasive parasitic elements, including viruses and retrotransposons [see (Gesteland et al. Reference Gesteland, Cech and Atkins2006) and references therein]. Even as the RNAs involved in these processes have been under intense investigation, a vast number of additional RNA molecules are being discovered in genomic segments that do not code for proteins but appear to be transcribed and processed in a regulated manner (see Amaral et al. Reference Amaral, Dinger, Mercer and Mattick2008; Eddy, Reference Eddy2014; Qureshi & Mehler, Reference Qureshi and Mehler2012 and references therein). Understanding whether, when, and how these RNA molecules functionally impact complex organisms is a major current challenge in biology.
Well-studied ‘RNA machines’ such as the ribosome and the spliceosome form and interconvert between intricate three-dimensional (3D) structures as they sense and respond to their protein, nucleic acid, and small molecule partners. It is possible that some or many of the newly discovered non-coding RNA molecules may transit through such functional structures and even interact to form an extended RNA machine (Amaral et al. Reference Amaral, Dinger, Mercer and Mattick2008). However, it is also possible that most non-coding RNAs harbor sparse or no regions that form functional structures. In either case, these possibilities are, for the most part, untested. On one hand, structure determination methods that achieve high-resolution are growing in power and applicability, with recent improvements in cryo-electron microscopy achieving near-atomic-resolution models for RNA complexes extracted from living cells (Amunts et al. Reference Amunts, Brown, Bai, Llacer, Hussain, Emsley, Long, Murshudov, Scheres and Ramakrishnan2014; Greber et al. Reference Greber, Boehringer, Leibundgut, Bieri, Leitner, Schmitz, Aebersold and Ban2014; Hang et al. Reference Hang, Wan, Yan and Shi2015; Nguyen et al. Reference Nguyen, Galej, Bai, Savva, Newman, Scheres and Nagai2015). On the other hand, these methods, along with crystallography and nuclear magnetic resonance (NMR) approaches, continue to face challenges in RNAs that form non-compact states, form multiple structures, bind a heterogeneous complement of partners, or that have large unstructured regions.
In contrast to high-resolution methods, chemical mapping (also called ‘footprinting’, ‘chemical probing’, or ‘structure mapping’) experiments can be applied to most RNAs under most solution conditions, including molecules that form heterogeneous, flexible structures or molecules functioning in their native cellular or viral milieu. Chemical mapping methods mark nucleotides that are accessible to chemical attack. Such reactivity is typically correlated to nucleotide solvent accessibility or flexibility, key features of RNA structure. As these techniques are read out by nucleic acid sequencing, chemical mapping methods have undergone accelerations over the last decade as sequencing technologies have rapidly advanced, enabling characterization of RNA chemical accessibilities of entire transcriptomes in vivo (see, e.g. Ding et al. Reference Ding, Tang, Kwok, Zhang, Bevilacqua and Assmann2014; Kwok et al. Reference Kwok, Tang, Assmann and Bevilacqua2015 and references therein). These experiments raise the prospect of nucleotide-resolution structural portraits of all RNAs being transcribed in an organism – the ‘RNA structurome’. Nevertheless, when tested through independent experiments, de novo models derived from chemical mapping and computational modeling have not always given consistently accurate structures, even on small domains folded into well-defined states and probed in vitro (Deigan et al. Reference Deigan, Li, Mathews and Weeks2009; Kladwang et al. Reference Kladwang, Vanlang, Cordero and Das2011c; Leonard et al. Reference Leonard, Hajdin, Karabiber, Mathews, Favorov, Dokholyan and Weeks2013; Tian et al. Reference Tian, Cordero, Kladwang and Das2014). These issues can be traced to the poor information content of chemical mapping measurements, which typically give single or few measurements per nucleotide, compared with high-resolution technologies such as crystallography, NMR, or cryo-electron microscopy, which can return datasets with ten or more measurements per nucleotide.
Multidimensional chemical mapping (MCM) techniques have been recently developed to help address the limited information content of conventional chemical mapping data (Das et al. Reference Das, Kudaravalli, Jonikas, Laederach, Fong, Schwans, Baker, Piccirilli, Altman and Herschlag2008; Kladwang & Das, Reference Kladwang and Das2010). MCM methods seek to determine not just chemical reactivities at each nucleotide but also how these reactivities are affected by systematic perturbations – nucleotide mutations, chemical modifications, or radical source attachments – at every other nucleotide (Fig. 1). Analogous to multidimensional forms of NMR spectroscopy, such multidimensional chemical data were hypothesized to give sufficient constraints to accurately model RNA secondary structure and tertiary structure at nucleotide resolution and to give detailed empirical information on heterogenous ensembles. If successful, MCM would provide a ‘front-line’ technique for inferring RNA structure: structured domains of long RNA transcripts could be rapidly defined and visualized from in vivo experiments. If a domain interconverts between multiple structural states, those states could be further parsed and separately stabilized through mutation, again with rapid nucleotide-resolution tests by MCM. After initial MCM-guided analysis, these domains would then become candidates for more detailed biochemical analysis, including discovery of protein partners; functional analysis through in vivo mutation and epistasis experiments; and detailed structural dissection through high-resolution techniques, such as crystallography and cryo-electron microscopy. However, prior to investing efforts into developing an MCM-initialized pipeline, it has been necessary to test the hypothesis that MCM methods will actually produce sufficient information to model RNA structures de novo. The purpose of this paper is to review recent studies on model systems and newly discovered RNAs that have evaluated this basic hypothesis, setting the stage for in vivo expansions.
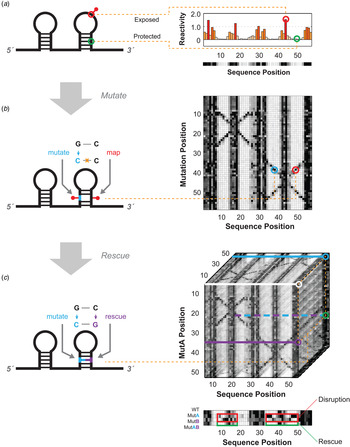
Schematics for multidimensional expansions of chemical mapping to infer RNA structure. (a) Schematic of 1D chemical mapping and simulated reactivity profile. The red pin illustrates a chemical modification event on an exposed (non-base-pairing) nucleotide. The red and green circles highlight a reactive (exposed) and unreactive (protected) nucleotide, respectively. (b) Schematic of 2D chemical mapping through the mutate-and-map (M2) strategy. A sequence mutation (cyan) breaks a base pair, exposing both itself and its partner (red), resulting in measurable increases in chemical reactivity at the partner (right). On a full dataset with mutations made separately at every position (right), a diagonal feature should trace perturbations near each single mutation position, while cross-diagonal features should report individual residues released upon mutation of their pairing partners. (c) Schematic of 3D chemical mapping. When all double mutants are chemically mapped, the entire dataset would fill a cube (mutate-mutate-map, M3, right). In practice, a smaller set of single and compensatory double mutations can target particular base-pair hypotheses. A quartet of chemical mapping profiles (WT, MutA, MutB, and MutAB) illustrates mutate-map-rescue (M2R, bottom). Here, perturbations that occur upon single mutations (at base pair partners, in MutA; or delocalized changes, in MutB; outlined in red) are rescued upon concomitant double mutation (outlined in green, MutAB). In all panels, simulated data are shown to illustrate concepts; see subsequent figures for experimental data. Orange dotted lines connect specific nucleotides or nucleotide pairs in RNA (left) to corresponding positions in multidimensional data (right).
The organization of the review is as follows. Section 2 briefly summarizes recent improvements to conventional 1D chemical mapping methods and their current limitations, motivating the development of MCM. Section 3 describes the best-tested MCM approach, the mutate-and-map (M2) technique, including its conception, its experimental evaluation, and a recent acceleration through mutational profiling (MaP). Section 4 describes and evaluates a second MCM method hypothesized to complement M2 with longer-distance data needed for 3D modeling, called multiplexed •OH cleavage analysis (MOHCA). Section 5 illustrates first applications of MCM to characterize RNA states with significant secondary structure or tertiary structure heterogeneity, including ligand-free riboswitch states intractable by other high-throughput methods. Section 6 summarizes current challenges in bringing MCM to bear on RNA transcripts longer than a few hundred nucleotides, especially within their biological milieu. These challenges include not only technical issues in making comprehensive nucleotide-level perturbations to cellular RNAs but also a more fundamental problem in how MCM sequencing costs scale with RNA length. A modify-cross-link-map (MXM) protocol – not yet put into practice – is proposed to solve these problems. A summary of the MCM methods reviewed herein is presented in Table 1. Conclusions in the review make use of publicly available data deposited in the RNA Mapping Database (RMDB) (Cordero et al. Reference Cordero, Lucks and Das2012b); accession IDs are listed in figure legends. Section 7 summarizes the review.
Multidimensional chemical mapping methods for RNA structure characterization

a N is the number of nucleotides in the RNA.
2. Prelude: 1D RNA chemical mapping
RNA structure has been empirically probed by ‘one-dimensional’ chemical mapping experiments for more than three decades. As a classic example, dimethyl sulfate (DMS) was tested as a structural probe almost immediately after its development for nucleic acid sequencing (Peattie & Gilbert, Reference Peattie and Gilbert1980). DMS remains in use to methylate the N1/N3 atoms of A/C nucleobases that have their Watson–Crick edges exposed to solution. Modification by DMS thus reports that a nucleotide is not engaged in a Watson–Crick pair in the secondary structure (Cordero et al. Reference Cordero, Kladwang, Vanlang and Das2012a; Tijerina et al. Reference Tijerina, Mohr and Russell2007). Chemical modification by DMS or other probes can be rapidly read out at every nucleotide of an RNA through primer extension reactions that terminate immediately 3′ to the modified bases, followed by electrophoresis or next-generation sequencing of the resulting cDNA products. The currently available set of chemical and enzymatic probes of RNA structure and methodological accelerations have been described in several recent reviews (Eddy, Reference Eddy2014; Kwok et al. Reference Kwok, Tang, Assmann and Bevilacqua2015; Weeks, Reference Weeks2010) and these methods continue to be advanced (see, e.g. Kielpinski & Vinther, Reference Kielpinski and Vinther2014; Poulsen et al. Reference Poulsen, Kielpinski, Salama, Krogh and Vinther2015; Spitale et al. Reference Spitale, Flynn, Zhang, Crisalli, Lee, Jung, Kuchelmeister, Batista, Torre, Kool and Chang2015).
Chemical mapping measurements provide 1D profiles of structure along entire transcripts (Fig. 1a ). These data, even in their raw form, can yield biological insights. For example, in recent transcriptome-wide studies, comparisons of in vitro and in vivo averaged structural accessibilities over numerous transcripts have illuminated the pervasive remodeling of RNA structure in cells, presumably by protein partners. Nevertheless, de novo structure determination from chemical mapping data has been more challenging. The protection of a given nucleotide from chemical modification does not directly reveal the nucleotide's interaction partner, which may be any of the other protected nucleotides in the transcript or, in the case of multi-molecular complexes, other molecular partners. Chemical cross-linking approaches can pinpoint pairing partners but give sparse data (few cross-links per molecule) and, not infrequently, artifacts that have strongly distorted 3D structure models; see, e.g. studies on tRNA, ribosomes, group II introns, and the spliceosome (Anokhina et al. Reference Anokhina, Bessonov, Miao, Westhof, Hartmuth and Luhrmann2013; Dai et al. Reference Dai, Chai, Gu, Gabel, Noskov, Blocker, Lambowitz and Zimmerly2008; Hang et al. Reference Hang, Wan, Yan and Shi2015; Levitt, Reference Levitt1969; Robart et al. Reference Robart, Chan, Peters, Rajashankar and Toor2014; Sergiev et al. Reference Sergiev, Dontsova and Bogdanov2001; Whirl-Carrillo et al. Reference Whirl-Carrillo, Gabashvili, Bada, Banatao and Altman2002). The information content of chemical mapping is therefore low. Until recently, expert intuition and ad hoc manual comparison of chemical mapping data with phylogenetic information and computational methods have been necessary to integrate chemical data into structure models, sometimes leading to significant errors (Anokhina et al. Reference Anokhina, Bessonov, Miao, Westhof, Hartmuth and Luhrmann2013; Dai et al. Reference Dai, Chai, Gu, Gabel, Noskov, Blocker, Lambowitz and Zimmerly2008; Deigan et al. Reference Deigan, Li, Mathews and Weeks2009; Hang et al. Reference Hang, Wan, Yan and Shi2015; Levitt, Reference Levitt1969; Robart et al. Reference Robart, Chan, Peters, Rajashankar and Toor2014; Sergiev et al. Reference Sergiev, Dontsova and Bogdanov2001; Tian et al. Reference Tian, Cordero, Kladwang and Das2014; Whirl-Carrillo et al. Reference Whirl-Carrillo, Gabashvili, Bada, Banatao and Altman2002).
Several studies suggested that direct integration of 1D chemical mapping data into energy-optimizing computational algorithms as ‘pseudoenergies’ would enable automated de novo secondary structure determination with high accuracy. There have been promising results on several model RNAs of known structure, including large molecules such as the 1542-nucleotide Escherichia coli 16S ribosomal RNA (Deigan et al. Reference Deigan, Li, Mathews and Weeks2009; Hajdin et al. Reference Hajdin, Bellaousov, Huggins, Leonard, Mathews and Weeks2013; Rice et al. Reference Rice, Leonard and Weeks2014). However, the general level of accuracy of these techniques for new RNAs has been questioned (Kladwang et al. Reference Kladwang, Vanlang, Cordero and Das2011c; Sukosd et al. Reference Sukosd, Swenson, Kjems and Heitsch2013; Tian et al. Reference Tian, Cordero, Kladwang and Das2014). For example, reanalysis of a model based on selective 2´-OH acylation by primer extension (SHAPE) of the 9173-nucleotide HIV-1 RNA genome (Watts et al. Reference Watts, Dang, Gorelick, Leonard, Bess, Swanstrom, Burch and Weeks2009) suggested that more than half of the presented helices were not well-determined (Kladwang et al. Reference Kladwang, Vanlang, Cordero and Das2011c), and subsequent work, including both experimental and computational improvements, have significantly revised these uncertain regions (Pollom et al. Reference Pollom, Dang, Potter, Gorelick, Burch, Weeks and Swanstrom2013; Siegfried et al. Reference Siegfried, Busan, Rice, Nelson and Weeks2014; Sukosd et al. Reference Sukosd, Andersen, Seemann, Jensen, Hansen, Gorodkin and Kjems2015). The debate over whether these methods produce acceptable structure accuracies continues (Deigan et al. Reference Deigan, Li, Mathews and Weeks2009; Eddy, Reference Eddy2014; Kladwang et al. Reference Kladwang, Vanlang, Cordero and Das2011c; Leonard et al. Reference Leonard, Hajdin, Karabiber, Mathews, Favorov, Dokholyan and Weeks2013; Rice et al. Reference Rice, Leonard and Weeks2014; Sukosd et al. Reference Sukosd, Swenson, Kjems and Heitsch2013; Tian et al. Reference Tian, Cordero, Kladwang and Das2014) and will not be reviewed in detail here. There is general agreement, however, on some points. First, combination of chemical mapping data with automated algorithms provides more predictive power and more reproducible results than using either method separately. Second, these methods face limitations when applied to RNAs that form significant tertiary structure, that form complexes with proteins or other molecular partners, or that populates multiple states (Leonard et al. Reference Leonard, Hajdin, Karabiber, Mathews, Favorov, Dokholyan and Weeks2013). These issues preclude the application of 1D chemical mapping to automated RNA domain structure detection – much less de novo structure determination – in many biological contexts of interest.
3. M2 (mutate-and-map) for 2D structure
3.1 M2 concept
The secondary structure and tertiary interactions of an RNA structure are defined by a list of which nucleotides come together to form Watson–Crick base pairs or non-canonical interactions. As noted above, conventional 1D chemical mapping constrains but does not directly return this list of pairings. In particular, the data do not directly report the pairing partner(s) of each protected nucleotide (Fig. 1a ).
The M2 approach was proposed in 2010 as a potentially general experimental route to resolve the ambiguity of RNA pairing partners (Kladwang & Das, Reference Kladwang and Das2010). The proposal was conceptually straightforward: If two nucleotides are paired in the RNA structure, mutation of one nucleotide might ‘release’ both partners, producing localized changes observable in single-nucleotide-resolution chemical mapping profiles. The proposed effect is illustrated in Fig. 1b , and was supported by observations in prior mutational studies on group I introns (Garcia & Weeks, Reference Garcia and Weeks2004; Pyle et al. Reference Pyle, Murphy and Cech1992). In general, disruption by a single mutation might not give precise release of partners but instead produce global unfolding of the RNA, localized unfolding of stems, or refolding of the RNA into an alternative structure. Fortunately, chemical mapping data would still discriminate between these scenarios based on the number and pattern of nucleotides with perturbed chemical reactivity. If even a subset of mutations give the desired pinpointed disruption of partners, this would provide strong information on RNA structure. However, at the time of the proposal, it was unclear if such an informative subset of mutations would generally be found in structured RNAs.
3.2 Proof-of-concept in designed systems
The M2 proposal motivated the development of methods to synthesize variants mutating every position in a nucleic acid sequence, analogous to alanine scanning in proteins but not carried out routinely in RNA biochemical studies. The proposal also motivated advances in high-throughput protocols for chemical mapping of these variants, replacing radioactive labeling of primers and slab gel electrophoresis with fluorescent readouts and capillary electrophoresis instruments developed for Sanger sequencing (Kladwang et al. Reference Kladwang, Cordero and Das2011a; Mitra et al. Reference Mitra, Shcherbakova, Altman, Brenowitz and Laederach2008; Yoon et al. Reference Yoon, Kim, Hum, Kim, Park, Kladwang and Das2011). These accelerations now allow M2 measurements to be carried out and analyzed in 2 days, after the receipt of automatically designed primers for template assembly from commercial DNA companies (Cordero et al. Reference Cordero, Kladwang, Vanlang and Das2014; Lee et al. Reference Lee, Kim, Tian, Lee, Yoon and Das2015; Tian et al. Reference Tian, Yesselman, Cordero and Das2015).
Proof-of-concept experiments for M2 were encouraging. A first study was carried out on a 20 base-pair DNA/RNA hybrid helix (Kladwang & Das, Reference Kladwang and Das2010). This X-20/H-20 system was chosen since every possible single-nucleotide mutation and deletion to the DNA could be ordered without further processing, and the RNA's DMS modification profile could be mapped with gel and capillary electrophoresis readouts. Visualization of the raw data showed ‘punctate’ events marking 15 of the 17 base pairs involving an A or C (the nucleotides visible to DMS read out by primer extension) on the RNA strand (outlined in orange, cyan, and green outlines; Fig. 2a ). Inferring these base pairs did not require visual inspection but could also be captured by an automated algorithm. The algorithm was based on Z-scores, the number of standard deviations by which reactivity at a nucleotide exceeded its mean reactivity over all constructs when a putative partner was mutated.
Proof-of-concept experiments for the M2 methodology. (a) Experimental M2 measurements (left) and secondary structure (right) of a H-20/X-20 DNA/RNA hybrid construct (Kladwang & Das, Reference Kladwang and Das2010). Single mutations of the H-20 DNA result in mismatches in the hybrid helix, exposing nucleotides in the X-20 RNA (purple) to DMS chemical modification. Purple line outlines region with expected base pair features; orange, blue, and green circles highlight a few strong features that correspond to expected base pairs. (b) M2 data and secondary structure of a MedLoop test RNA (Kladwang et al. Reference Kladwang, Cordero and Das2011a). The test helix is designed to be mostly A/C on one side and U/G on the other. DMS (blue) and CMCT (red) M2 datasets are overlaid. Regions corresponding to expected base pairs from the step are outlined in green on the data. Yellow and cyan circles mark a few single-nucleotide features in the M2 data (left) that demarcate specific base pairs (right). In both (a) and (b), yellow arrows mark perturbations from mutation that extend beyond ‘punctate’ release of a single base pair and involve disruption of an entire helix. RMDB Accession IDs for datasets shown: (a). X20H20_DMS_0001; (b). MDLOOP_DMS_0002 and MDLOOP_CMC_0002.

Further experiments on a 35-nucleotide ‘Medloop’ RNA hairpin confirmed that M2 could be applied to infer RNA–RNA base pairs, using data from DMS, SHAPE, and CMCT, a reagent specific to exposed G and U Watson–Crick edges. In Fig. 2b , perturbations near the site of each mutation and at partners are highlighted (cyan and yellow outlines). Not every mutation gave punctate release of partners. Some showed no perturbations, presumably due to replacement of the original Watson–Crick pair with a non-Watson–Crick pair; and others gave more delocalized perturbations (yellow arrows, Fig. 2a, b ; see Section 5 for further discussion). Some nucleotides appeared to be ‘hotspots’, becoming exposed by many different mutations (see, e.g. G27 in Fig. 2b ). Nevertheless, nine of the hairpin's ten base pairs could be inferred from a sequence-independent analysis searching for punctate features. The analysis was again based on finding M2 features with high Z-scores; enforcing that multiple such features clustered together was important in eliminating any of the 1460 possible false positives. This study also revealed that the strongest effects were seen when mutating each nucleotide to its complement. These most informative substitutions became the default mutation set in later studies. These early results also highlighted the importance of collecting data on mutants at all sequence positions, not only to capture base pairs throughout the RNA but also to establish whether observed perturbations were significant compared with the variability of chemical reactivity at a given site, as captured in the Z-score. Overall, these data suggested that the majority of single base pairs in a non-coding RNA might be discovered through systematic and unbiased M2 experiments.
3.3 Tests on natural RNAs
After the proofs of concept above, M2 studies were carried out on several RNA domains drawn from biological sources. These RNAs included a benchmark of several riboswitch and ribozyme domains that had challenged prior chemical mapping approaches (Kladwang et al. Reference Kladwang, Vanlang, Cordero and Das2011b), a ribosomal domain for which (1D) SHAPE-directed modeling gave a misleading structure (Tian et al. Reference Tian, Cordero, Kladwang and Das2014), newly discovered RNA regulons in vertebrate homeobox mRNA 5′ untranslated regions (Xue et al. Reference Xue, Tian, Fujii, Kladwang, Das and Barna2015), and molecules presented to the RNA modeling community as ‘RNA-Puzzle’ blind challenges before publication of their crystal structures (Miao et al. Reference Miao, Adamiak, Blanchet, Boniecki, Bujnicki, Chen, Cheng, Chojnowski, Chou, Cordero, Cruz, Ferre-D'amare, Das, Ding, Dokholyan, Dunin-Horkawicz, Kladwang, Krokhotin, Lach, Magnus, Major, Mann, Masquida, Matelska, Meyer, Peselis, Popenda, Purzycka, Serganov, Stasiewicz, Szachniuk, Tandon, Tian, Wang, Xiao, Xu, Zhang, Zhao, Zok and Westhof2015).
3.3.1 Initial benchmark on six natural RNAs
Visual inspection of M2 data for an initial benchmark of six natural non-coding RNAs provided informative lessons after the previous small, artificial proof-of-concept systems (Fig. 2). As hypothesized, punctate mutation-release signals appeared in the raw M2 data for the natural non-coding RNAs, signaling Watson–Crick base pairs. For example, for a double-glycine riboswitch aptamer, six helices that had been predicted by expert phylogenetic analysis – but not yet confirmed by crystallography – were visible as six cross-diagonal features in raw M2-SHAPE data (outlined in six different colors, Fig. 3a ). Nevertheless, these M2 datasets on biological non-coding RNA domains showed fewer punctate mutation-release signals compared with the original proof-of-concept systems (Kladwang & Das, Reference Kladwang and Das2010; Kladwang et al. Reference Kladwang, Cordero and Das2011a). Indeed, for some helices, all mutations tested either gave no detectable change in chemical reactivity or produced delocalized changes in chemical mapping profiles relative to the starting sequence, suggesting unfolding or refolding of entire helices (yellow, Fig. 3a ). Signatures for non-canonical base pairs, including those mediating tertiary contacts, were similarly delocalized (red arrows, Fig. 3a ); tertiary structure will be discussed in more detail in Section 4 below. This initial visual inspection indicated that the Z-score-based inference developed with artificial systems would, on its own, not allow complete secondary structure inference, much less tertiary structure inference, of natural non-coding RNAs.
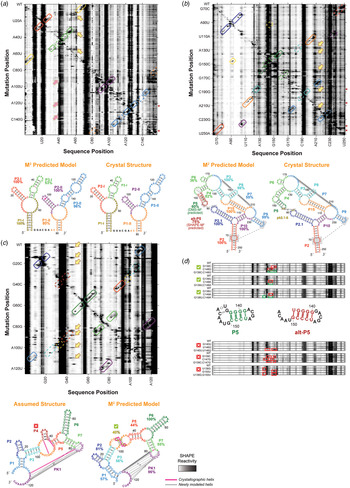
M2 reveals secondary structure of natural non-coding RNA domains. (a) M2 data and secondary structures of a double glycine riboswitch from F. nucleatum (Butler et al. Reference Butler, Xiong, Wang and Strobel2011; Lipfert et al. Reference Lipfert, Das, Chu, Kudaravalli, Boyd, Herschlag and Doniach2007, Reference Lipfert, Sim, Herschlag and Doniach2010). RNA was probed in presence of 10 mM glycine. M2–SHAPE data are shown with helices outlined according to their assigned color. Solid outlines mark helices in which mutations cause punctate or localized increases of SHAPE reactivity around its expected partner, providing evidence for the helix; dashed outlines mark helices that do not give clear mutate-and-map signals. Magenta arrows mark exposure of P3-I loop upon disruption of tertiary structure that results not only from mutation of its tertiary contact partner (PI-II) but also from mutations in other helices. In secondary structures, bootstrapping confidence scores are marked under helix labels. The M2 predicted model using the automated Z-score analysis captured all six helices with > 80% bootstrapping support except for P3-I, which also has an extra base pair. (b) M2 data and secondary structures of the GIR1 lariat-capping ribozyme from D. iridis, RNA-Puzzle 5 (Miao et al. Reference Miao, Adamiak, Blanchet, Boniecki, Bujnicki, Chen, Cheng, Chojnowski, Chou, Cordero, Cruz, Ferre-D'amare, Das, Ding, Dokholyan, Dunin-Horkawicz, Kladwang, Krokhotin, Lach, Magnus, Major, Mann, Masquida, Matelska, Meyer, Peselis, Popenda, Purzycka, Serganov, Stasiewicz, Szachniuk, Tandon, Tian, Wang, Xiao, Xu, Zhang, Zhao, Zok and Westhof2015). The data captured all helices and the pk2.1-5 tertiary contact observed in the subsequently released crystal structure (Meyer et al. Reference Meyer, Nielsen, Olieric, Roblin, Johansen, Westhof and Masquida2014). Both a P5 helix (dark green) and an alternative alt-P5 (dark red), differing by a single-nucleotide register shift, were modeled by M2 with similar bootstrap supports. Visual inspection of M2-DMS [not shown; see (Miao et al. Reference Miao, Adamiak, Blanchet, Boniecki, Bujnicki, Chen, Cheng, Chojnowski, Chou, Cordero, Cruz, Ferre-D'amare, Das, Ding, Dokholyan, Dunin-Horkawicz, Kladwang, Krokhotin, Lach, Magnus, Major, Mann, Masquida, Matelska, Meyer, Peselis, Popenda, Purzycka, Serganov, Stasiewicz, Szachniuk, Tandon, Tian, Wang, Xiao, Xu, Zhang, Zhao, Zok and Westhof2015)] suggested a tertiary contact involving non-canonical pairs between P9 and P2 (gray) that was indeed observed in the subsequently released crystal structure. (c) M2 data and secondary structures of the ydaO cyclic-di-adenosine riboswitch, RNA-Puzzle 12 (Gao & Serganov, Reference Gao and Serganov2014; Ren & Patel, Reference Ren and Patel2014). RNA was probed in presence of 10 µM c-di-AMP. The differences of each model compared with the subsequently released crystallographic structure are marked by magenta and gray lines. The secondary structure based on expert sequence analysis (left), assumed by all RNA-Puzzle modelers, included an incorrect P4 (dark red), while the M2 predicted model (right) correctly rearranged this region. (d) M2R data and secondary structures of the GIR1 lariat-capping ribozyme from D. iridis. The discrepancy in M2-predicted model was resolved by M2-rescue data testing base pairs in P5 and alt-P5, showing that compensatory double mutations predicted to rescue P5 succeeded in restoring the sequence's chemical mapping profile (outlined in green) after their disruption by single mutations (outlined in red), while double mutants based on alt-P5 failed to rescue the profile. In panels (a)–(c), yellow arrows mark perturbations from mutation that involve disruption of helices or formation of alternative secondary structure. In panels (a) and (b), rows with red asterisks are mutants for which data were not acquired; to aid visual inspection, these rows have been filled in with wild type data. RMDB Accession IDs for datasets shown: (a). GLYCFN_SHP_0004; (b). RNAPZ5_1M7_0002; (c). RNAPZ12_1M7_0003; (d). unpublished result.
3.3.2 Integration with automated secondary structure prediction
The benchmark results described above (Kladwang et al. Reference Kladwang, Vanlang, Cordero and Das2011b) motivated the integration of M2 data with well-developed secondary structure prediction methods, inspired by prior work involving 1D chemical mapping (Deigan et al. Reference Deigan, Li, Mathews and Weeks2009). The RNAstructure package and other methods predict the lowest energy (highest probability) secondary structure for an RNA sequence, given an energetic model. To guide these calculations to higher accuracy secondary structures, nucleotide pairs that gave high Z-scores in M2 data were assigned a proportionally strong energy bonus in RNA structure. Across the benchmark, the resulting automatically generated secondary structures were consistently accurate, with only 1 of 185 base pairs missed and with any mispredicted base pairs occurring only at the edges of helices (Fig. 3a–c ) (Kladwang et al. Reference Kladwang, Vanlang, Cordero and Das2011b). Furthermore, building on prior efforts to estimate reliability of 1D-mapping-guided secondary structures (Kladwang et al. Reference Kladwang, Vanlang, Cordero and Das2011c), an analysis was developed to estimate the helix-by-helix uncertainty in M2-guided secondary structures, based on the recovery of each helix in ‘mock’ analyses in which the M2 data were randomly resampled with replacement [non-parametric boostrapping (Efron & Tibshirani, Reference Efron and Tibshirani1998)]. These analyses exposed misleading inferences from conventional chemical mapping methods (Deigan et al. Reference Deigan, Li, Mathews and Weeks2009; Tian et al. Reference Tian, Cordero, Kladwang and Das2014), and uncertainties in register shifts (Fig. 3d , P5 versus alt-P5) or in helices (typically short 2-bp stems) that could be further tested (see below, Section 3.4).
3.3.3 RNA-Puzzle tests
As in other areas of macromolecule modeling (Das & Baker, Reference Das and Baker2008; Fleishman et al. Reference Fleishman, Corn, Strauch, Whitehead, Andre, Thompson, Havranek, Das, Bradley and Baker2010), the strongest tests of structure prediction have been blind tests. For most of the recent blind RNA-Puzzle targets, M2 data were acquired and shared with all modelers during the prediction period, before crystal structures were released after modeling. These targets included two problems (the D. iridis lariat-capping GIR1 ribozyme and the S. thermophilum adenosylcobalamin riboswitch) recently summarized in the RNA-Puzzles Round II paper (Meyer et al. Reference Meyer, Nielsen, Olieric, Roblin, Johansen, Westhof and Masquida2014; Miao et al. Reference Miao, Adamiak, Blanchet, Boniecki, Bujnicki, Chen, Cheng, Chojnowski, Chou, Cordero, Cruz, Ferre-D'amare, Das, Ding, Dokholyan, Dunin-Horkawicz, Kladwang, Krokhotin, Lach, Magnus, Major, Mann, Masquida, Matelska, Meyer, Peselis, Popenda, Purzycka, Serganov, Stasiewicz, Szachniuk, Tandon, Tian, Wang, Xiao, Xu, Zhang, Zhao, Zok and Westhof2015; Peselis & Serganov, Reference Peselis and Serganov2012) and four others for which crystal structures have since been reported (Ren & Patel, Reference Ren and Patel2014; Suslov, Reference Suslov, Dasgupta, Huang, Fuller, Lilley, Rice and Piccirilli2015; Trausch et al. Reference Trausch, Xu, Edwards, Reyes, Ross, Knight and Batey2014, Reference Trausch, Marcano-Velazquez, Matyjasik and Batey2015).
The M2-based analysis has consistently achieved accurate secondary structures, including stems that are scrambled with standard computational modeling and 1D chemical mapping analysis [see, e.g. Supporting Information in (Miao et al. Reference Miao, Adamiak, Blanchet, Boniecki, Bujnicki, Chen, Cheng, Chojnowski, Chou, Cordero, Cruz, Ferre-D'amare, Das, Ding, Dokholyan, Dunin-Horkawicz, Kladwang, Krokhotin, Lach, Magnus, Major, Mann, Masquida, Matelska, Meyer, Peselis, Popenda, Purzycka, Serganov, Stasiewicz, Szachniuk, Tandon, Tian, Wang, Xiao, Xu, Zhang, Zhao, Zok and Westhof2015)] and features that could not be captured by prior phylogenetic analysis (Fig. 3b , d). For example, the precise mutation-release signals in M2 data revealed novel interactions for the lariat-capping GIR1 ribozyme (RNA-Puzzle 5). Mutations in nucleotide G144 and A145 exposed nucleotides C92 and U91, respectively, making apparent a P2.1/P5 pseudoknot (yellow box, Fig. 3b , top panel) missed by conventional chemical mapping and by prior sequence comparisons and expert inspection (Beckert et al. Reference Beckert, Nielsen, Einvik, Johansen, Westhof and Masquida2008). The entire M2-derived secondary structure was accurate compared with the subsequently released crystal structure, up to edge base pairs (Fig. 3b ). In addition, a tertiary contact involving an A-minor interaction was detected by visual inspection of the M2 data; mutation of P2 sequences changed the reactivity of the apical loop of P9. These inferences enabled blind 3D modeling of the GIR1 ribozyme at better than 1 nm resolution (Miao et al. Reference Miao, Adamiak, Blanchet, Boniecki, Bujnicki, Chen, Cheng, Chojnowski, Chou, Cordero, Cruz, Ferre-D'amare, Das, Ding, Dokholyan, Dunin-Horkawicz, Kladwang, Krokhotin, Lach, Magnus, Major, Mann, Masquida, Matelska, Meyer, Peselis, Popenda, Purzycka, Serganov, Stasiewicz, Szachniuk, Tandon, Tian, Wang, Xiao, Xu, Zhang, Zhao, Zok and Westhof2015); see also Section 4.3 below.
Surprising results arose during automated M2 secondary structure modeling of RNA-Puzzle 12, the cyclic-di-adenosine monophosphate ydaO riboswitch from T. tengcongensis. Here, automated M2 secondary structure modeling returned a model with nearly all the stems expected from prior expert analysis of sequence conservation and covariation, including a long-range pseudoknot PK1 (Fig. 3c ). However, this analysis did not recover one hairpin stem P4, even though the target sequence included a GAAA tetraloop introduced to stabilize this stem (Fig. 3c ). During the prediction period, our group assumed this to be a failure of the M2 approach, and all models from our group and all other groups included P4. Nevertheless, when the crystal structure was released, the M2 analysis turned out to be accurate: the crystallized RNA did not show electron density for the P4 tetraloop, and the conserved nucleotides in this region formed a non-canonical internal two-way junction instead of a hairpin stem (Gao & Serganov, Reference Gao and Serganov2014; Ren & Patel, Reference Ren and Patel2014).
Overall, the studies carried out to date on well-structured RNAs have strongly supported the M2 strategy. Systematic mutagenesis can be coupled to chemical mapping to yield rich structural information hidden in or missed by conventional chemical mapping data. The data by themselves allow direct single-nucleotide-resolution inference of some Watson–Crick base pairs through punctate mutation-release signals. More generally, modeling that integrates M2 data with state-of-the-art secondary structure prediction methods give full models of all Watson–Crick pairs. This automated M2 approach has been consistently accurate at nucleotide resolution for RNAs that have been challenging for prediction methods based on computational modeling, conventional 1D mapping data, phylogenetic analysis, expert analysis, or combinations thereof (Kladwang et al. Reference Kladwang, Vanlang, Cordero and Das2011b; Miao et al. Reference Miao, Adamiak, Blanchet, Boniecki, Bujnicki, Chen, Cheng, Chojnowski, Chou, Cordero, Cruz, Ferre-D'amare, Das, Ding, Dokholyan, Dunin-Horkawicz, Kladwang, Krokhotin, Lach, Magnus, Major, Mann, Masquida, Matelska, Meyer, Peselis, Popenda, Purzycka, Serganov, Stasiewicz, Szachniuk, Tandon, Tian, Wang, Xiao, Xu, Zhang, Zhao, Zok and Westhof2015; Tian et al. Reference Tian, Cordero, Kladwang and Das2014). These conclusions have been borne out in 12 non-coding RNAs whose structures have been solved through crystallography, including six RNA-Puzzle blind modeling targets.
3.4 Stringent tests through mutation/rescue
The majority of RNA transcripts in biological systems will not necessarily form single well-defined structures. Thus, the tests of the M2 concept above, which relied on crystallization of an RNA to give ‘gold standard’ reference structures, were incomplete. The need for more general validation or falsification motivated a further expansion of the M2 concept to enable not only the discovery but also the incisive testing of RNA base pairs (Fig. 1c ).
The mutate-map-rescue (M2R) proposal is a high-throughput variant of compensatory rescue experiments, which have provided strong tests of Watson–Crick base pairing in nearly every well-studied RNA system, including striking examples in vivo (Graveley, Reference Graveley2005; Lehnert et al. Reference Lehnert, Jaeger, Michel and Westhof1996; Madhani & Guthrie, Reference Madhani and Guthrie1994; Reenan, Reference Reenan2005; Singh et al. Reference Singh, Singh and Androphy2007). In these experiments, two partners in a putative base pair are separately mutated to their complement. If concomitant introduction of these separately disruptive mutations restores the RNA's function, the pairing is strongly supported. One issue with conventional compensatory mutation analysis is that it requires both knowing an RNA's function a priori and having a precise experimental assay for that function. Another issue is that lack of rescue does not provide information for or against the tested base pair; in general, several base pairs for each helix, mutated not only to their complement but also to other Watson–Crick pairs, need to be tested. M2R proposes to use chemical mapping as a general and high throughput readout of the experiment, even for RNAs whose functions are unknown or are difficult to assay (Fig. 1c ).
3.4.1 M2R (mutate-map-rescue) results
Recent studies have established high-throughput M2R as a tool for rapidly validating or refuting RNA structure models, and have provided strong support for M2-derived models of systems without structures solved through conventional techniques. For an E. coli 16S ribosomal RNA domain 126–235, modeling guided by 1D SHAPE data gave a solution-state secondary structure model different from the structure seen in the crystallized protein-bound small ribosomal subunit (Deigan et al. Reference Deigan, Li, Mathews and Weeks2009). In contrast, M2 recovered a secondary structure that matched the crystallographic structure up to single-nucleotide register shifts, and M2R experiments involving 36 sets of compensatory mutations supported the M2 model, with no evidence for the 1D SHAPE-based alternative structure (Tian et al. Reference Tian, Cordero, Kladwang and Das2014). Beyond falsifying errors in prior methods, this study further demonstrates the use of M2R as a tool for disambiguating fine-scale uncertainties, including register shifts in two helices, P2a and P4a. As an additional independent example, Figure 3d shows use of M2R to distinguish between two register shifts of a helix P5/alt-P5 in the lariat-capping GIR1 ribozyme (S.T., R.D. unpublished data). The restoration of the chemical profile of the wild type RNA from double mutations predicted to rescue P5, but not alt-P5, was visually apparent and confirmed by the subsequently released crystal structure of the ribozyme (Meyer et al. Reference Meyer, Nielsen, Olieric, Roblin, Johansen, Westhof and Masquida2014).
It is important to note here that the confident interpretation of M2R measurements does not require the ‘punctate’ release of partner nucleotides upon single mutations. For example, if single mutations of both partners in a base pair lead to alternative secondary structures with dramatically different chemical profiles [see Section 5, and several examples in (Tian et al. Reference Tian, Cordero, Kladwang and Das2014)], M2 analysis would not provide clean evidence of their pairing. However, in M2R, restoration of the wild type profile upon double mutation would still provide strong experimental evidence for the base pairing of the nucleotides.
The M2R experiment has further provided strong tests of several stems of a recently discovered internal ribosome entry site (IRES) in the HoxA9 mRNA, including a previously uncertain pseudoknot predicted with low bootstrap support (56%) (Xue et al. Reference Xue, Tian, Fujii, Kladwang, Das and Barna2015). Further cellular assays tested the in vivo relevance of the M2–rescue structural model, again through compensatory rescue but with a functional readout of IRES activity.
3.4.2 Prospects for higher-dimensional chemical mapping (mutate-mutate-map, M3)
The nucleotides targeted by M2R have been limited to base pairs that remain uncertain after M2 analysis. The method might, in principle, be generalized to cases in which no secondary structure hypotheses or energetic models are assumed or modeled a priori, as was the original goal of M2 (Section 3.2). Such a ‘model-free’ method would involve profiling the effects of all double mutants of target RNA on the chemical reactivities of all other nucleotides, and cataloging the pairs of mutations that rescue perturbations of single mutations. These data would give a ‘three-dimensional’ dataset (Fig. 1c ); we refer to the procedure as a M3 analysis. The expected sequencing costs of M3 (see Section 6 below) have prevented broad testing of the concept, although massively parallel synthesis and sequencing methods may allow such datasets to be collected for short transcripts. At present, the M2R method, which provides a targeted subset of a full M3 dataset (Fig. 1c ), has turned out to be sufficient – and, in some cases, necessary – to achieve confidence in secondary structure models.
3.5 Acceleration from MaP
M2 measurements require separate synthesis and purification of single mutants of the target RNA. This is possible for RNA molecules that can be transcribed from DNA templates that can in turn be constructed through polymerase chain reaction (PCR) assembly of small primers. This synthesis process is straightforward for domains up to a few hundred nucleotides but becomes difficult for RNAs of longer length or for transcripts that require in vivo biogenesis to assemble into functional structures. A method that yields M2-like data without single mutant libraries has recently been achieved (Homan et al. Reference Homan, Favorov, Lavender, Kursun, Ge, Busan, Dokholyan and Weeks2014; Siegfried et al. Reference Siegfried, Busan, Rice, Nelson and Weeks2014). In this method, the initial perturbation to the RNA structure is not a mutation at an initially protected nucleotide but a chemical modification at that nucleotide when it is transiently available for modification. The effect of this first perturbation then affects the chemical modifications at other nucleotides that occur later in the reaction period (Fig. 4a ). Unlike conventional chemical mapping approaches where one typically seeks ‘single-hit’ modification kinetics (fewer than one average number of modifications per transcript), this protocol explicitly seeks multiple hits per transcript to enable detection of correlations between modification events at different sites. Detection of multiple hits per transcript was enabled by the development of mutational profiling (MaP), a protocol for primer extension and next-generation sequencing that allows reverse transcriptases to bypass modification sites and incorporate mutations into the cDNA transcript instead of terminating at those sites (Siegfried et al. Reference Siegfried, Busan, Rice, Nelson and Weeks2014).
Schematic of single-molecule correlated modification mapping and data comparison for the Tetrahymena group I intron P4–P6 domain. (a) Schematic of how multiple modifications can read out RNA structure. A primary modification serves as a ‘mutation’ similar to M2, leading to a correlated secondary modification at its base-pairing partner. Multiple chemical modification events on the same RNA are read out by reverse transcription under conditions in which mismatch nucleotides are incorporated into cDNA at modification sites. Simulated data are shown. (b) Secondary structure of the Tetrahymena group I intron P4–P6 domain. (c) M2-DMS measurements for the P4–P6 RNA; helix features color-coded as in (b). (d). Data using DMS in multiple-hit conditions, collected previously for RNA Interaction Group (RING-MaP) analysis (Homan et al. Reference Homan, Favorov, Lavender, Kursun, Ge, Busan, Dokholyan and Weeks2014) but displayed here in a distinct ‘MaP-2D’ view. The rate of modifications at each nucleotide position, given a detection of nucleotide modification at every other position, is shown. Each row shows such a profile, normalized by the sum of counts at each position.
In panels (c) and (d), red arrows mark exposure of the P5b loop upon disruption of the RNA tertiary structure from not only mutation of this loop's ‘receptor’ (J6a/b) but also other helix perturbations. RMDB Accession IDs for datasets shown: (c) TRP4P6_DMS_0002; (d) adapted from (Homan et al. Reference Homan, Favorov, Lavender, Kursun, Ge, Busan, Dokholyan and Weeks2014).

For several RNAs, novel RING-MaP (RNA Interaction Groups by MaP) analysis of multiple-hit DMS data revealed statistically significant modification–modification correlations between several nucleotide pairs in the same helices, pairs involved in tertiary contacts, and pairs that were not directly in contact but might be exposed concomitantly in weakly populated states (Homan et al. Reference Homan, Favorov, Lavender, Kursun, Ge, Busan, Dokholyan and Weeks2014). Figure 4 b shows an alternative 2D view of these same data for the P4–P6 domain of the Tetrahymena ribozyme: a heat-map of the modification frequency at one site given that a modification is observed at a second site. This view, termed herein ‘MaP-2D’ analysis, illustrates the similarities between this protocol that maps correlations between multiple chemical modifications and the M2 approach (Fig. 4c ). In both panels, vertical striations correspond to the general 1D DMS modification pattern: there is a high rate of modification at unpaired regions independent of where other modifications appear. Both panels also show detailed 2D information correlating the exposure of generally protected nucleotides with modifications at other nucleotides. Cross-diagonal features corresponding to all the RNA's helices are visible as punctate dots (in colored outlines) as well as signals for the tetraloop-receptor tertiary contact (magenta arrows). Interestingly, in the MaP-2D data, a punctate signal at, for example, an A–U Watson–Crick base pair involves DMS modification at both the adenosine and a ‘non-canonical’ modification at the uracil. It is not yet clear if the latter events are due to modification at uracil transiently deprotonated at the N1 position or to other kinds of modification.
Given the visual similarity of the M2 and MaP-2D data, automated secondary structure analysis developed for M2 measurements apply readily to MaP-2D data, allowing the recovery of all helices of this as well as other RNA domains that have been challenging for chemical-mapping-derived secondary structure modeling (S.T., R.D. unpublished data). These results suggest that MaP-2D will be able to achieve data and secondary structure models with quality comparable to M2 but through a simpler protocol that obviates preparation of sequence mutants. Independent validation procedures for MaP-2D experiments have not been developed, so testing the resulting models will still likely require synthesizing variants with single and double mutations and testing for compensatory rescue, as described in Section 3.4 above.
3.6 Summary
Critical benchmarks and blind tests of the M2 concept, high-throughput M2R, and MaP-2D have been carried out on more than a dozen RNA systems. These studies have supported the basic MCM hypothesis, especially with regards to secondary structure: multidimensional expansions of chemical mapping give rapid, automated, and consistently accurate solution-state structure models of RNA molecules.
4. MOHCA (multiplexed •OH cleavage analysis) for 3D structure
4.1 MOHCA proof-of-concept
Many RNAs are known to form specific tertiary structures to carry out catalysis or to recognize small molecule, protein, or nucleic acid binding partners. While the studies above have supported application of M2 and related methods to infer secondary structure, these data have not in general returned information needed to resolve the global tertiary arrangement of those helices, much less atomic-resolution tertiary structure. Tertiary information from M2 has been limited typically to pseudoknots or a fraction of the structure's other non-canonical base pairs, as in the P2/P9 A-minor interaction in the GIR1 ribozyme (Fig. 3b ). As an illustration of the difficulty of inferring non-canonical pairs, mutations in each A-minor interaction interconnecting the two aptamers of a double-glycine riboswitch successfully disrupted these interactions but also disrupted numerous other tertiary interactions as well (Kladwang et al. Reference Kladwang, Vanlang, Cordero and Das2011b) (yellow arrows, Fig. 3a ). 3D modeling is difficult without such precise tertiary contact information, and has been carried out only for favorable cases such as an adenine riboswitch aptamer (Kladwang et al. Reference Kladwang, Vanlang, Cordero and Das2011b) or at low resolution (Homan et al. Reference Homan, Favorov, Lavender, Kursun, Ge, Busan, Dokholyan and Weeks2014). Recent RNA-Puzzle blind trials further illustrate the problem: M2-guided 3D models with the correct global tertiary structure modeled at sub-helical (better than 1 nm) resolution have been submitted for most problems, but modelers have not been able to rank their most accurate submissions as their top models (Miao et al. Reference Miao, Adamiak, Blanchet, Boniecki, Bujnicki, Chen, Cheng, Chojnowski, Chou, Cordero, Cruz, Ferre-D'amare, Das, Ding, Dokholyan, Dunin-Horkawicz, Kladwang, Krokhotin, Lach, Magnus, Major, Mann, Masquida, Matelska, Meyer, Peselis, Popenda, Purzycka, Serganov, Stasiewicz, Szachniuk, Tandon, Tian, Wang, Xiao, Xu, Zhang, Zhao, Zok and Westhof2015).
4.1.1 Precedents for pairwise data from tethered radical cleavage
A different MCM protocol has been developed to help address the need for high-throughput RNA tertiary proximities, based on RNA-tethered radical sources. The protocol involves chemical attachment of iron chelates to single positions in the RNA backbone during or immediately after in vitro synthesis. After folding, hydroxyl radicals (•OH) are produced from these iron centers via the Fenton reaction, with Fe(II) being regenerated from Fe(III) by a reducing reagent such as ascorbate. The radicals attack nucleotides that are at distances of 15–30 Å to the radical source; oxidation of sugars can result in backbone cleavage (purple arrows leading to red lightning bolt, Fig. 5a ). While probing distance scales 2–5 fold longer in distance scale than the ~6 Å separation of adjacent nucleotides, these data are expected to be powerful for constraining tertiary folds. (An analogy to smaller distance scales may be helpful: NMR approaches achieve near-atomic resolution on small macromolecules using rich sets of NOE-derived proximities between atom pairs separated by 3–5 Å, several fold longer than the 1 Å atomic length scale.) Indeed, classic work with sources tethered to single residues of transfer RNA, ribosomes, and other non-coding RNAs calibrated the relationship of RNA backbone cleavage with distance and established the utility of these data for nucleotide-resolution RNA and RNA-protein modeling (see, e.g. Bergman et al. Reference Bergman, Lau, Lehnert, Westhof and Bartel2004; Culver & Noller, Reference Culver and Noller2000; Han & Dervan, Reference Han and Dervan1994; Lancaster et al. Reference Lancaster, Kiel, Kaji and Noller2002). The reliability of pairwise constraints from tethered radical source experiments has been further supported by comparison of these and other types of biochemical data on the ribosome with subsequently solved crystal structures (Sergiev et al. Reference Sergiev, Dontsova and Bogdanov2001; Whirl-Carrillo et al. Reference Whirl-Carrillo, Gabashvili, Bada, Banatao and Altman2002).
MOHCA-seq provides pairwise tertiary proximity information of RNA. (a) Schematic of MOHCA-seq (multiplexed •OH cleavage analysis read out by deep sequencing). After generation of hydroxyl radicals (•OH, purple), a strand scission event (red lightning bolt) and the corresponding iron chelate radical source position (yellow circle marked Fe) can be mapped out by subsequent reverse transcription to cDNA (green arrow) and paired-end sequencing. Simulated data are shown. (b) Additional oxidative damage events (red pins) that were not detectable in the original gel-based readout of MOHCA but are detectable by MOHCA-seq through termination of reverse transcription (green arrows). (c–e) MOHCA-seq data and tertiary structure models of (c) a double-aptamer glycine riboswitch from F. nucleatum with 10 mM glycine with cross-aptamer tertiary contacts (magenta arrows in MOHCA-seq map), (d) the GIR1 lariat-capping ribozyme from D. iridis, RNA-Puzzle 5, and (e) the ydaO cyclic-di-adenosine riboswitch with 10 µM c-di-AMP, RNA-Puzzle 12. The latter two are blind tests. Structures labeled ‘MCM predicted model’ were based on a MCM pipeline of M2 secondary structure analysis, MOHCA-seq tertiary proximity mapping, and Rosetta computational modeling. Crystal structures are from the protein data bank (PDB), (c) 3P49, (d) 4P8Z, (e) 4QK8. In (d), red asterisks mark two positions that undergo catalytic modification (lariat formation and hydrolytic scission) by the ribozyme; for visual clarity, data at those positions are not shown. MOHCA-seq maps of (c–e) are filtered to show features with signal-to-noise ratios above 2 (different from a cutoff of 1 in (Cheng et al. Reference Cheng, Chou, Kladwang, Tian, Cordero and Das2015b)). Cyan contours highlight map features corresponding to each secondary structure helix. Other contours mark hits that were inferred through visual inspection of MOHCA-seq maps; to aid visual comparison, only contours including at least one residue pair with phosphorus–phosphorus (P-P) distance <45 Å in the crystal structure are shown. Coloring of these tertiary contours reflect P–P distances of closest approach for residue pairs in the MCM predicted models (green, <30 Å; yellow, 30–45 Å; red, >45 Å). The same coloring is shown for cylinders in bottom panels of structures, which connect pairs of residues of closest distance corresponding to each contour; thick and thin cylinders correspond to strong and weak hits in (Cheng et al. Reference Cheng, Chou, Kladwang, Tian, Cordero and Das2015b). Each 3D model is shown with colored cylinders, or helices with matching color as in Fig. 3. MOHCA-seq maps have colored axes matching secondary structure in Fig. 3. In (e), gray spheres show positions of two c-di-AMP ligands in both model and crystal structure. RMDB Accession IDs for datasets shown: (c). GLYCFN_MCA_0002; (d). RNAPZ5_MCA_0001; (e–f). RNAPZ12_MCA_0000.

4.1.2 MOHCA with gel readout
MOHCA was reported in 2008 to give secondary and tertiary structure information on RNA structure from a chemical mapping method (Das et al. Reference Das, Kudaravalli, Jonikas, Laederach, Fong, Schwans, Baker, Piccirilli, Altman and Herschlag2008). MOHCA involved random incorporation of radical sources at all possible sites of an RNA, identification of the positions of radical cleavage through gel electrophoresis, and identification of which source position produced which cleavage events through in-gel RNA scission at radical source sites and electrophoresis in a perpendicular direction. Data from this first MCM technique gave 2D maps that reflect not base pairing, as in M2, but spatial proximity extending over tens of Angstroms. While necessarily lower in resolution, these maps can confirm the secondary structure of an RNA in several solution conditions and, crucially, describe lower resolution proximities between helical elements arranged in space. MOHCA maps were sufficiently information-rich to guide Rosetta 3D modeling methods to a 13 Å-root mean square deviation (RMSD) accuracy model of the tertiary structure of an RNA model system, the P4–P6 domain of the Tetrahymena ribozyme. The MOHCA-Rosetta method also gave initial ensemble models of the conformationally heterogeneous states of the P4–P6 RNA without magnesium. Several groups developed methods to incorporate MOHCA data into 3D computational methods (Jeon et al. Reference Jeon, Jung, Min, Chung and Yoon2013; Parisien & Major, Reference Parisien and Major2012; Seetin & Mathews, Reference Seetin and Mathews2011). However, the MOHCA experimental protocol required custom-synthesized nucleotides with double modifications (2′-NH2 for source attachment; α-phosphorothioate for iodine-catalyzed scission), 2D gel electrophoresis, and numerous gel replicates for separate 5′ and 3′ end-labeled samples and with different running times to resolve different lengths. These requirements prevented MOHCA from being subjected to blind tests or entering routine use for RNA structure inference.
4.2 Acceleration through MOHCA-seq
The advent of paired-end next generation sequencing resolved the difficulties of the original MOHCA method. An updated MOHCA-seq protocol has been developed, which uses commercially available nucleotides and iron chelate reagents to prepare the library of RNAs with radical sources (Cheng et al. Reference Cheng, Chou, Kladwang, Tian, Cordero and Das2015b). After folding and fragmentation, an RNA-seq-inspired protocol allows readout of radical cleavage events and associated source locations. Primer binding sites are ligated onto the cleaved RNA ends, and reverse transcription from these primers (green arrows, Fig. 5a ) terminate at the radical source. Unlike the original scission-based protocol, the reverse transcription can also terminate at and read out other oxidative damage events associated with the radical source, giving additional pairs of nucleotides that are both proximal to the radical source (red pins and lightning bolts, Fig. 5b ). A second adapter ligation step enables paired-end sequencing of these cDNA fragments and determination of these pairs of nucleotides. Because the final data are digital, background subtraction, correction for reverse transcription attenuation, and error estimates can be carried out through an automated procedure (closure-based •OH correlation analysis, COHCOA). Single MOHCA-seq experiments give data as rich as experiments involving dozens of gels with the original MOHCA method, mainly due to the readout of double-modification events (Fig. 4b ) and the ability to carry out digital data processing.
In a benchmark on five RNA domains of known structure with lengths up to 188 nucleotides, MOHCA-seq maps consistently gave signals that confirmed the RNA's solution-state secondary structure and, most importantly, gave information that enabled tertiary structure modeling. For a double glycine riboswitch aptamer, all six helices observed previously with M2 (Fig. 3a ) gave distinct hits in MOHCA-seq data (black features inside cyan contours, Fig. 5c ). Furthermore, the MOHCA-seq map marked riboswitch regions brought together by cross-domain A-minor contacts (magenta arrows in Fig. 5c ), information that could not be resolved by M2 (Fig. 3a ) due to cooperative loss of all cross-domain tertiary contacts upon mutation.
While these interactions could be seen through visual inspection, the MOHCA-seq map did not allow compilation of a complete list of non-canonical pairs at nucleotide resolution. On the tested domains and in prior work (Cheng et al. Reference Cheng, Chou, Kladwang, Tian, Cordero and Das2015b; Das et al. Reference Das, Kudaravalli, Jonikas, Laederach, Fong, Schwans, Baker, Piccirilli, Altman and Herschlag2008; Sergiev et al. Reference Sergiev, Dontsova and Bogdanov2001; Whirl-Carrillo et al. Reference Whirl-Carrillo, Gabashvili, Bada, Banatao and Altman2002), the median distance of MOHCA-seq-connected hits was ~30 Å, on the same scale as the diameter of an RNA helix (26 Å) and larger than the ~6 Å sugar-to-sugar separation of sequence-adjacent nucleotides. This intrinsic resolution is unlikely to improve significantly, even if the iron-chelate can be tethered more closely to the RNA, since pairs of nucleotides that are brought into distance much closer than 15 Å are typically buried within contacts and protected from radical attack. Given this likely intrinsic limit in resolution, achieving 3D structural pictures requires integration of MOHCA-seq data with de novo computational methods, analogous to the integration of M2 analysis with automated algorithms to give secondary structures (Section 2.3).
4.3 Tests for MCM 3D modeling
4.3.1 Integration with computational tertiary structure modeling
To test its information content for 3D structure, MOHCA-seq was integrated with the Rosetta Fragment Assembly of RNA with Full Atom Refinement (FARFAR) method for 3D structure modeling (Cheng et al. Reference Cheng, Chou and Das2015a). Analogous to the guidance of RNA secondary structure prediction with M2 data (Section 3.2), a list of nucleotide pairs with strong MOHCA intensities was compiled for each RNA to guide tertiary structure prediction. A low-resolution scoring function underlies initial FARFAR modeling, and 3D structures that brought these pairs of nucleotides were awarded an energy/score bonus. When carried out using the benchmark data described above and taking advantage of M2 data to predefine secondary structure, this M2-MOHCA-Rosetta pipeline achieved 8–12 Å RMSD accuracies, a resolution that allowed accurate visualization of the tertiary arrangement of helices at near-nucleotide resolution (Fig. 5c ). Modeling without MOHCA-seq data gave significantly worse RMSD (e.g., 30.5 Å instead of 7.9 Å for the glycine riboswitch aptamer), confirming the necessity of these MCM data. For a newly discovered HoxA9 mRNA IRES, MOHCA-seq data supported a secondary structure and pseudoknot detected by previous M2R experiments (Xue et al. Reference Xue, Tian, Fujii, Kladwang, Das and Barna2015) and allowed 3D modeling of the RNA as a ‘loose tertiary globule’ (Cheng et al. Reference Cheng, Chou and Das2015a).
4.3.2 Blind tests
As with the secondary structure tests for M2, the most important tests of MOHCA-seq tertiary structure inference have been blind trials. To date, two partial blind tests have been carried out. The first blind test involved refinement of nearly 40% of a GIR1 lariat-capping ribozyme model before the release of this RNA-Puzzle's crystal structure (Fig. 5d ). The MOHCA-seq-guided refinement indeed improved the accuracy of the refined regions from 17.0 to 11.2 Å and, for the whole ribozyme, from 9.6 to 8.2 Å (Cheng et al. Reference Cheng, Chou, Kladwang, Tian, Cordero and Das2015b). A second blind test involved an RNA-Puzzle on a cyclic-di-adenosine monophosphate riboswitch aptamer (Ren & Patel, Reference Ren and Patel2014). In this case, the MOHCA-seq protocol (which had only recently been developed) was carried out on the target molecule only a few days before the modeling deadline, too late to influence modeling. Nevertheless, post facto comparisons highlighted the discriminatory potential of MOHCA-seq maps. Several MOHCA-seq hits involved residue pairs that were more than 45 Å distant in the submitted models (MCM Predicted Model, Fig. 5e ), but these discrepancies were resolved when plotting distances were derived from the subsequently released crystal structure (Crystal Structure, Fig. 5e ). These results suggest that inclusion of MOHCA-seq data during 3D modeling could significantly improve accuracy. Collection and dissemination of MOHCA-seq data for more recent RNA-Puzzles are offering further rigorous tests of this hypothesis (C.Y. Cheng, M. Magnus, K. Kappel, R.D. unpublished data).
4.4 Towards mature MOHCA-seq modeling
The above studies have given initial support to the overall hypothesis that MOHCA-seq can complement M2 to produce RNA 3D models with useful sub-helical resolution. Nevertheless, there are at least two important aspects of the tertiary structure modeling that are underdeveloped in comparison with the M2-based secondary structure modeling: uncertainty estimation and independent validation protocols.
First, the studies above gave estimates of the 3D modeling precision based on the similarity of different low energy models from independent computational modeling runs, but these values may be biased towards overestimating accuracy, as occurs in NMR modeling (Rieping et al. Reference Rieping, Habeck and Nilges2005). A bootstrapping procedure, similar to that used for M2-derived secondary structure models in Section 3, might achieve more conservative estimates. While resampling MOHCA-seq constraint lists can already generate bootstrapped ‘mock’ datasets, Rosetta modeling is currently too computationally expensive to allow replicate runs with these datasets. Accelerations in Rosetta modeling, or use of alternative 3D modeling protocols (Krokhotin et al. Reference Krokhotin, Houlihan and Dokholyan2015; Parisien & Major, Reference Parisien and Major2012), will be needed to attain such uncertainty estimates.
Second, there is no tertiary structure analog yet of the compensatory rescue experiments that test secondary structure. MOHCA-seq modeling does not typically resolve individual base pairs of RNA tertiary contacts, precluding design of compensatory mutations. Even if the modeling could achieve such resolution, most tertiary interactions involve non-canonical pairs, often making additional interactions with other nucleotides. These pairs are not expected to be replaceable with alternative pairs without energetic cost.
As an alternative, one can envision a motif-level testing procedure involving substitution of entire motifs of the RNA. For example, if a 3D MCM model predicts a sharp bend and twist at a two-way junction, one could replace that junction with a previously solved junction known to form a similar bend and twist. Positive evidence for the predicted junction geometry would come from chemical mapping or functional experiments showing that separately substituting one strand or the other produces a disruption in 3D structure/function and that concomitant mutation rescues the structure/function. Similar replacements for three-way, four-way, and higher order junctions and for tertiary contacts might also be feasible. One challenge for this motif-by-motif approach would be to automatically find and design the appropriate substitutes. It is presently unclear if the database of known structures is large enough to provide such substitutes. Another challenge would be to ensure that false positives do not arise from simple rescue of secondary structure rather than tertiary structure. The development of incisive testing procedures of 3D model features, analogous to compensatory rescue of Watson–Crick pairs, is an important frontier for MCM and other RNA structural biology methods, especially as they seek to visualize transcripts whose functionally relevant structures may only form in vivo.
4.5 Summary
Benchmarks and a blind test of the MOHCA concept for RNA proximity mapping have been carried out on nearly a dozen RNA systems. Complementary to M2 data that pinpoint RNA secondary structure, MOHCA seeks proximal nucleotide pairs that would enable computer modeling of RNA tertiary structure at nanometer resolution. The studies to date have extended support of the basic MCM hypothesis from secondary to tertiary structure: multidimensional expansions of chemical mapping enable consistently accurate 3D structure models of RNA molecules.
5. Deconvolving multiple RNA structures with MCM
5.1 Multiple states of RNA as a major challenge
As noted in Section 1, most biological RNA molecules that have been studied in detail transit through multiple structures during their functional cycles. For example, viral RNA genomes interconvert between compact structures in packaged forms, less-structured cellular states that can recruit and organize host proteins, and states available for translation or replication [see, e.g. (Bothe et al. Reference Bothe, Nikolova, Eichhorn, Chugh, Hansen and Al-Hashimi2011; Filbin & Kieft, Reference Filbin and Kieft2009; Schneemann, Reference Schneemann2006) and references therein]. On one hand, 1D chemical mapping data are sensitive to multiple structures, and recent studies in vivo and in vitro support a picture of many, and perhaps most, regions of RNA transcripts interconverting between complex conformational states [see, e.g. (Kwok et al. Reference Kwok, Tang, Assmann and Bevilacqua2015; Rouskin et al. Reference Rouskin, Zubradt, Washietl, Kellis and Weissman2014; Spitale et al. Reference Spitale, Flynn, Zhang, Crisalli, Lee, Jung, Kuchelmeister, Batista, Torre, Kool and Chang2015)]. On the other hand, whether these conformational changes are functional or simply ‘structural noise’ is unknown for most regions, and the uncertainty is exacerbated by the difficulty of deconvolving the component structures from data that average over the entire ensemble of structures (Eddy, Reference Eddy2014; Washietl et al. Reference Washietl, Hofacker, Stadler and Kellis2012). MCM measurements give rich data on RNA structure and, in favorable cases, allow deconvolution of ensembles of secondary and tertiary structures from experiments.
5.2 Deconvolving riboswitch secondary structures with M2-REEFFIT (RNA ensemble extraction from footprinting insights technique)
Although M2 measurements were not originally developed to deconvolve multiple states of an RNA, early measurements suggested that these data captured evidence of alternative states. Even for well-structured RNAs, some single mutations produce changes in chemical reactivity over extended regions (yellow arrows in Fig. 3a–c ), and similar patterns of changes occur in several mutants. The secondary structure dominating the RNA ensemble apparently shifts to a distinct secondary structure in those variants. Indeed, for certain RNAs, the majority of mutations have been observed to produce such delocalized rearrangements. Examples have included riboswitches that are known from other techniques to form multiple structures, engineered sequences that failed to fold into target structures, and engineered switches explicitly designed to form multiple structures (Fig. 6) (Cordero & Das, Reference Cordero and Das2015; Lee et al. Reference Lee, Kladwang, Lee, Cantu, Azizyan, Kim, Limpaecher, Yoon, Treuille, Das and Ete2014; Reining et al. Reference Reining, Nozinovic, Schlepckow, Buhr, Furtig and Schwalbe2013; Serganov et al. Reference Serganov, Yuan, Pikovskaya, Polonskaia, Malinina, Phan, Hobartner, Micura, Breaker and Patel2004). For these cases, it is not possible to define a single secondary structure for the RNA, and a separate analysis method has been developed that models an ensemble of secondary structures and, importantly, estimates the associated increase in modeling uncertainty.
M2-REEFFIT reveals hidden states in secondary structure ensembles. (a, b). M2 data (left), fitted cluster weights (center), and fits from REEFFIT, (right) of the ‘Tebowned’ riboswitch designed to interconvert between two states upon binding of flavin mononucleotide (FMN). RNA was probed (a) in absence of FMN and (b) in presence of 2 mM FMN. Red rectangles in (A) mark nucleotide A30, which was not expected to be reactive in either of two target states of the riboswitch, but is explained by a third state uncovered by REEFFIT. (c) Secondary structures of REEFFIT predicted states. TBWN-A and TBWN-B were target states of the riboswitch design problem; TBWN-C was an unexpected state modeled by REEFFIT. (d) Prospective tests of REEFFIT model. 1D-SHAPE profiles of each state-stabilizing mutant agree well with the SHAPE profiles predicted from REEFFIT analysis. Red rectangle marks nucleotide A30, predicted and confirmed to be exposed in TBWN-C-stabilizing mutants. Data are from (Cordero & Das, Reference Cordero and Das2015). RMDB Accession IDs for datasets shown: (d). TBWN_1M7_0000; (b). TBWN_1M7_0001; (d). TBWN_STB_0000.

Modeling of full conformational ensembles from experimental data is a general problem in structural biology that is under active investigation in many laboratories. Since data must be used to infer not just a single structural model but instead the weights of a potentially large number of structures, no experimental method can directly read out an ensemble in a ‘model-free’ manner. Several approaches being currently developed for ensemble modeling find the minimal perturbations to a predefined, physically reasonable ensemble model that are necessary to recover experimental observables [see, e.g. (Beauchamp et al. Reference Beauchamp, Pande and Das2014; Pitera & Chodera, Reference Pitera and Chodera2012; Stelzer et al. Reference Stelzer, Frank, Kratz, Swanson, Gonzalez-Hernandez, Lee, Andricioaei, Markovitz and Al-Hashimi2011; van den Bedem & Fraser, Reference Van Den Bedem and Fraser2015) and references therein]. REEFFIT is the first such approach developed for M2 data (Cordero & Das, Reference Cordero and Das2015). The initial ensemble comes from automated prediction of equilibrium secondary structure ensembles. REEFFIT assumes that M2 data reflect a mixture of RNA secondary structures whose relative populations are shifted with mutation. While similar in concept to spectral analysis or principal component methods (Halabi et al. Reference Halabi, Rivoire, Leibler and Ranganathan2009; Homan et al. Reference Homan, Favorov, Lavender, Kursun, Ge, Busan, Dokholyan and Weeks2014), REEFFIT provides detailed models of the full ensemble and can make additional predictions. The method optimizes the ensemble model's posterior probability, based on a well-defined likelihood model and Bayesian priors. The priors are defined by empirical relationships between RNA pairing and chemical reactivity and by the initial model of population fractions of each structure within each mutant, estimated from current RNA secondary structure energetic models. Figure 6 a, b shows an example of M2-REEFFIT applied to understand an imperfectly engineered switch.
The probed multi-state RNA was designed as part of the Eterna massive open laboratory, which seeks basic design rules for RNA structure and function through an internet-scale videogame and high-throughput experiments (Lee et al. Reference Lee, Kladwang, Lee, Cantu, Azizyan, Kim, Limpaecher, Yoon, Treuille, Das and Ete2014). The molecule was designed to change its favored structure in response to flavin mononucleotide; chemical mapping confirmed the desired behavior for the starting sequence as well as for a large number of mutants. However, these data suggested that a region near nucleotide 30 that should have been protected prior to flavin mononucleotide (FMN) binding was instead exposed (red rectangle, Fig. 6a ). In this case, automated REEFFIT analysis provided a satisfactory fit to the entire dataset (Fig. 6a , b, right panels), automatically recovering the desired two states (TBWN-A and TBWN-B, respectively; the state names derive from the sequence's name ‘Tebowned’). As expected, the populations of these states (their ‘weights’ in the secondary structure ensemble) varied in different mutants (middle panels, Fig. 6a , b ), allowing automated estimation of the component reactivities, and the populations in the starting sequence were 56 ± 16 and 27 ± 12%. In addition, REEFFIT exposed an unexpected third state (TBWN-C, population 17 ± 11%, Fig. 6c ), which explained the anomalous reactivity of A30 (Fig. 6d ). Each states’ population in the starting sequence was greater than expected from the modeling uncertainty, estimated through bootstrapping, motivating further tests. As predicted, the population of TBWN-B, which presents an FMN aptamer sequence in the correct secondary structure context, increased significantly in conditions with FMN (compare weights in Fig. 6b to 6a ). Additional evidence for the three states and modeled structures came from design of mutations to strongly stabilize each mutant (Fig. 6d ); when synthesized, these constructs gave chemical reactivity patterns in agreement with predictions from REEFFIT on the original M2 data (Cordero & Das, Reference Cordero and Das2015).
5.2.1 Current limitations to secondary structure ensemble modeling
Applications of M2-REEFFIT to date have been limited to sequences of lengths of 100 nucleotides or less due to the computational expense of optimizing energies of structural ensembles. For longer RNAs, alternative structure detection methods that produce less detailed pairing information but require less computational power, such as RING-MaP, may be more appropriate for automatically detecting alternative secondary structure states in MCM data. Nevertheless, in any of these methods, the problem of validating proposed alternative structures remains a challenge. Unlike M2R in single-structure RNAs (Section 3.4), compensatory mutations that restore the stability of a weakly populated structure are expected to change the population of this state relative to others in the RNA's ensemble, leading to chemical mapping profiles different from the starting sequence even if ‘rescue’ of the single target structure is successful. For the cases to date, isolation of predicted alternative structures through the design of multiple stabilizing mutations has provided evidence of those structures, but these experiments neither constrain the population of these states in the starting sequence nor reveal whether those populations might be biologically relevant. For RNAs with single dominant secondary structure, MOHCA-seq can give independent support to M2-based secondary structure models (Fig. 5), but RNAs with multiple structures give diffuse, low signal-to-noise MOHCA-seq maps that do not strongly falsify or validate secondary structure ensembles (W. Kladwang, R.D. unpublished data). It seems likely that strong tests of MCM detections of alternative states will require probing their involvement in an RNA's functional cycle. In cases where the function is known, compensatory mutation/rescue can be read out through functional assays interpreted in detailed kinetic and thermodynamic frameworks. Such studies have been carried out for RNA machines and viruses but require significant specialized effort (see, e.g. Fica et al. Reference Fica, Tuttle, Novak, Li, Lu, Koodathingal, Dai, Staley and Piccirilli2013; Villordo et al. Reference Villordo, Alvarez and Gamarnik2010).
5.3 Preformed tertiary contacts in heterogeneous states with MOHCA-seq
In addition to the alternative secondary structures probed by M2, information on 3D conformational dynamics can be captured by MCM data. RNAs like the ribosome and some aptamer domains of riboswitches have largely preformed secondary structure but transit through multiple states as they fold or transit through their functional cycles (see e.g. Baird et al. Reference Baird, Kulshina and Ferre-D'amare2010a, Reference Baird, Ludtke, Khant, Chiu, Pan and Sosnickb; Behrmann et al. Reference Behrmann, Loerke, Budkevich, Yamamoto, Schmidt, Penczek, Vos, Burger, Mielke, Scheerer and Spahn2015; Das et al. Reference Das, Kwok, Millett, Bai, Mills, Jacob, Maskel, Seifert, Mochrie, Thiyagarajan, Doniach, Pollack and Herschlag2003; Noller, Reference Noller2005). For most RNAs with this property, however, it is unclear if tertiary structures are retained throughout the conformational cycle. For example, 1D chemical mapping measurements applied to riboswitch aptamers for glycine and for adenosylcobalamin, show loss of protections around ligand binding sites and in tertiary contacts in ligand-free states compared with ligand-bound states (Kwon & Strobel, Reference Kwon and Strobel2008; Nahvi et al. Reference Nahvi, Barrick and Breaker2004; Sudarsan et al. Reference Sudarsan, Lee, Weinberg, Moy, Kim, Link and Breaker2008), but these data do not resolve whether these tertiary structural features might still be present at low population in the ligand-free states. In contrast, MOHCA-seq positively detects tertiary interactions in these three aptamers even in ligand-free states. These hits occur at the same residue-pairs that give hits in ligand bound states, but at lower strength (Fig. 7) (Cheng et al. Reference Cheng, Chou, Kladwang, Tian, Cordero and Das2015b). These measurements, along with mutational analysis, suggest that the contacts are sampled transiently and perhaps without well-defined base pairing. Such contacts would otherwise be difficult to resolve without specialized experiments such as single molecule FRET studies with probes introduced at interacting residues. The MOHCA-seq data do not constrain whether these transient contacts occur independently or in an all-or-none fashion; ensembles based on low-energy conformations from MCM-guided Rosetta modeling (Fig. 7) give initial visualizations but are, at present, difficult to test or refine. Future work involving systematic mutagenesis coupled to a MOHCA readout (‘mutate-and-MOHCA’) and computational methods that produce better-converged 3D ensembles may enable the expansion of REEFFIT-like procedures for data-driven secondary structure ensemble modeling to tertiary structure ensemble modeling.
MOHCA-seq detects preformed tertiary contacts in riboswitches. MOHCA-seq data and tertiary structures for (a) a double glycine riboswitch from F. nucleatum (including a kink-turning forming leader sequence), probed in presence of 10 mM glycine (left) or in absence of glycine (right); and (b) an adenosylcobalamin (AdoCbl) riboswitch from S. thermophilus (Peselis & Serganov, Reference Peselis and Serganov2012), probed in presence of 70 µM AdoCbl (left) or in absence of AdoCbl (right). In each right panel, five MCM predicted models with lowest Rosetta energy provide an initial visualization of the ligand-free ensemble compared with the ligand-bound crystallographic structure (left panel). MOHCA-seq map filtering and color-coded contours in left panels (ligand-bound states) are same as in Fig. 5, except that contours for tertiary contacts are colored uniformly in magenta. The same contours are shown in right-hand panels (ligand-free states). Yellow arrows point to regions in the MOHCA-seq maps showing tertiary contacts in the ligand-bound states (left) that appear at lower intensity in the ligand-free states (right). To avoid clutter, not all such hits are marked. RMDB Accession IDs for datasets shown: (a). GLYCFN_KNK_0005 and GLYCFN_KNK_0006; (b). RNAPZ6_MCA_0002 and RNAPZ6_MCA_0003.

5.4 Summary
Non-coding RNA states with multiple secondary or tertiary structures are functionally important and likely pervasive in vivo but available experimental methods have difficulty in characterizing them. Benchmarks of M2-REEFFIT support its use to recover known secondary structure ensembles and to detect unexpected alternative RNA structures. Extending MCM to flexible tertiary structures, application of MOHCA-seq to ligand-free states of three riboswitch aptamers detects preformed RNA tertiary contacts. These results support the use of MCM to visualize RNA states that involve heterogeneous secondary structure or tertiary structure.
6. Towards solving RNA structures in vivo with MCM
6.1 Upcoming challenges: from in vitro to in vivo
The development of MCM techniques raises the prospect of de novo secondary structure and tertiary structure inference for the rapidly growing number of RNA molecules discovered in cells and viruses. Nevertheless, all MCM studies have been carried out in vitro, with separate experiments on each model system. Can MCM methods be extended to myriad RNA molecules interacting with their numerous other partners in their actual cellular or viral milieus? Several challenges will have to be solved before this is feasible.
6.1.1 Protection of RNA within RNPs and complexes
In terms of RNA biophysical states, it is possible that the binding of proteins and other partners will protect structurally important residues from chemical modification and therefore obscure readout via MCM methods. Tests on the ribosome fully assembled with proteins and on riboswitches complexed to large ligands suggest that protections from molecular partners still leave significant MCM-detectable nucleotide–nucleotide pairing information [(Cheng et al. Reference Cheng, Chou, Kladwang, Tian, Cordero and Das2015b) and C.Y. Cheng, R.D. unpublished data]. However, the secondary structure and tertiary structure modeling methods that are currently used to integrate MCM data will need to take into account the possibility of these protections.
6.1.2 Making chemical perturbations and modifications in vivo
All MCM methods require perturbing and reading out structural effects on transcripts at single nucleotide resolution. In terms of chemistry, several methods are now available for making chemical modifications in cells and then reading out modification sites by high-throughput sequencing [reviewed in (Ding et al. Reference Ding, Tang, Kwok, Zhang, Bevilacqua and Assmann2014)]. It has also long been possible to make single-nucleotide-level perturbations on entire transcriptomes through, e.g. chemical mutagens. Correlating the perturbations with their structural effects may be possible with RING-MaP/MaP-2D-style protocols but will be challenging. More fundamentally, these modifications will generally disrupt more than just localized RNA structure. The modifications will lead to the loss of functional interactions for each transcript, activation of stress responses, and other cell-wide perturbations, possibly including cell death. Possible solutions to this issue may be rapid delivery of chemical probes and quenching, as has been carried out in recent in vivo DMS and SHAPE measurements, although RING-MaP/MaP-2D approaches will require significantly higher modification rates than achieved in those experiments. Alternatively, MCM protocols might seek to introduce correlated chemical modifications into flash-frozen cells. For example, literature reports suggest that double-hit correlated modifications arise during irradiation of nucleic acids in frozen samples, although tests have only been described for double-stranded DNA (Chatterjee et al. Reference Chatterjee, Schmidt and Holley1994; Krisch et al. Reference Krisch, Flick and Trumbore1991).
6.1.3 Computational challenges
Obtaining structural models from MCM data requires integration via computational methods. Even for the least computationally expensive of these methods, which predict secondary structure without taking into account pseudoknots, modeling molecules longer than 2000 nucleotides remains challenging. For methods seeking 3D structure at sub-helical resolution, molecules longer than 200 nucleotides have been intractable, even with predefined secondary structures and use of supercomputers, some steps remain non-automated (Cheng et al. Reference Cheng, Chou and Das2015a; Miao et al. Reference Miao, Adamiak, Blanchet, Boniecki, Bujnicki, Chen, Cheng, Chojnowski, Chou, Cordero, Cruz, Ferre-D'amare, Das, Ding, Dokholyan, Dunin-Horkawicz, Kladwang, Krokhotin, Lach, Magnus, Major, Mann, Masquida, Matelska, Meyer, Peselis, Popenda, Purzycka, Serganov, Stasiewicz, Szachniuk, Tandon, Tian, Wang, Xiao, Xu, Zhang, Zhao, Zok and Westhof2015). Multi-scale computational pipelines involving low-resolution domain parsing, separate 3D folding of domains, assembly, and refinement will need to be developed as MCM data become available for viruses, ribosomes, and other large transcripts.
6.1.4 Sequencing costs
MCM methods seek more information than 1D chemical mapping approaches, and thus necessarily incur larger sequencing costs, e.g. in terms of the necessary numbers of reads. Since MCM perturbs every nucleotide of an RNA and assays the response of every other nucleotide, the number of measurements should scale quadratically with the number of nucleotides (see, however, Section 6.2 below). Will these quadratic costs be acceptable for large RNA transcripts? To get a preliminary answer, we have estimated the minimal number of reads needed to achieve signal-to-noise acceptable for modeling secondary structure (M2, MaP-2D) or tertiary structure (MOHCA-seq), through sub-sampling from available datasets (see Fig. 8 and its legend). As expected, the numbers of reads required to obtain such good quality datasets fit to a quadratic dependence with RNA length (Fig. 9a ). Compared with M2, which uses only the terminus of the read (orange), the MaP-2D analysis of RING-MaP data (red) gains efficiency by resolving multiple modification events via different mutations in a sequenced fragment. However, the most informative modifications occur at nucleotides that are most frequently sequestered into structure; these nucleotides contribute the fewest reads to the MaP-2D data, while they are mutated one-by-one in M2 to ensure sufficient signal-to-noise at all nucleotides. Overall, MaP-2D ends up requiring ~50% more reads than M2. For tertiary contact discovery, MOHCA-seq maps are necessary, but those maps give comparably few features that report tertiary information compared with features that report secondary structure helices (compare number of cyan contours with all contours in Fig. 5). Acquiring MOHCA-seq data for tertiary structure modeling is thus 2–3 times more expensive than M2 and MaP-2D data that target secondary structure (compare purple with red and orange curves, Fig. 9a ).
Subsampling of MCM data to determine minimal number of sequencing reads to infer RNA structure. MOHCA-seq data of a double glycine riboswitch from F. nucleatum were used (see also Fig. 3a ). A subset (1, 1/5, 1/500, and 1/5000) of the raw FASTQ file was randomly resampled and subjected to the complete COHCOA data processing and error estimation pipeline (Cheng et al. Reference Cheng, Chou, Kladwang, Tian, Cordero and Das2015b). Signal-to-noise ratio was estimated as the ratio between the mean of reactivity and the mean of statistical error across the whole dataset. Yellow arrows point to tertiary features that disappear as the number of resampled reads decreases. RMDB Accession IDs for datasets shown: GLYCFN_MCA_0002.

Scaling of sequencing costs for MCM. Expected sequencing costs (number of reads) versus RNA lengths, plotted on (a) linear scale and (b) logarithmic scale. The plotted values are the number of reads required to achieve usable signal-to-noise levels for 1D, 2D, and 3D chemical mapping methods described or proposed in text. Costs are estimated based on publicly available data for a number of RNAs and transcriptomes and the subsampling procedure described in Fig. 8. Most M2 data (orange triangles) were collected by capillary electrophoresis (CE); conversion to number of Illumina reads was achieved by comparison of signal-to-noise values of CE and Illumina datasets for a 16S rRNA 126–235 four-way junction, for which both measurements are available. References for next-generation sequencing technologies for 1D mapping (blue circles): SHAPE-Seq (Lucks et al. Reference Lucks, Mortimer, Trapnell, Luo, Aviran, Schroth, Pachter, Doudna and Arkin2011), MAP-Seq (Seetin et al. Reference Seetin, Kladwang, Bida and Das2014), SHAPE-MaP (Siegfried et al. Reference Siegfried, Busan, Rice, Nelson and Weeks2014) (Mauger et al. Reference Mauger, Golden, Yamane, Williford, Lemon, Martin and Weeks2015), HRF-Seq (Kielpinski & Vinther, Reference Kielpinski and Vinther2014), (Kielpinski & Vinther, Reference Kielpinski and Vinther2014) Mod-Seq (Talkish et al. Reference Talkish, May, Lin, Woolford and Mcmanus2014), PARS (Kertesz et al. Reference Kertesz, Wan, Mazor, Rinn, Nutter, Chang and Segal2010; Wan et al. Reference Wan, Qu, Ouyang, Kertesz, Li, Tibshirani, Makino, Nutter, Segal and Chang2012, Reference Wan, Qu, Zhang, Flynn, Manor, Ouyang, Zhang, Spitale, Snyder, Segal and Chang2014), DMS-Seq (Ding et al. Reference Ding, Tang, Kwok, Zhang, Bevilacqua and Assmann2014; Rouskin et al. Reference Rouskin, Zubradt, Washietl, Kellis and Weissman2014), CIRS-Seq (Incarnato et al. Reference Incarnato, Neri, Anselmi and Oliviero2014), icSHAPE (Spitale et al. Reference Spitale, Flynn, Zhang, Crisalli, Lee, Jung, Kuchelmeister, Batista, Torre, Kool and Chang2015). For the studies in which the number of total raw reads was not reported explicitly, plotted values were estimated by total length × coverage/average read length. Statistics (blue squares) from the Eterna massive open laboratory (Lee et al. Reference Lee, Kladwang, Lee, Cantu, Azizyan, Kim, Limpaecher, Yoon, Treuille, Das and Ete2014) used the MAP-Seq protocol and involved up to a thousand sequences per round; separate rounds are shown as separate data points. RMDB Accession IDs for datasets shown: (1D). 16SFWJ_STD_0001, TRP4P6_1M7_0006, ETERNA_R80_0001, ETERNA_R82_0001, ETERNA_R83_0003, ETERNA_R86_0000, ETERNA_R87_0003, ETERNA_R92_0000, ETERNA_R93_0000, ETERNA_R94_0000; (2D-M2). 16SFWJ_1M7_0001, 5SRRNA_SHP_0002, ADDRSW_SHP_0003, CIDGMP_SHP_0002, CL1LIG_1M7_0001, GLYCFN_SHP_0004, HOXA9D_1M7_0001, RNAPZ5_1M7_0002, RNAPZ6_1M7_0002, RNAPZ7_1M7_0001, RNAPZ12_1M7_0003, TRNAPH_SHP_0002, TRP4P6_SHP_0003; (2D-MaP). adapted from (Homan et al. Reference Homan, Favorov, Lavender, Kursun, Ge, Busan, Dokholyan and Weeks2014); (2D-MOHCA). 16SFWJ_MCA_0003, 5SRRNA_MCA_0001, CDIGMP_MCA_0003, GLYCFN_MCA_0002, HCIRES_MCA_0001, HOXA9D_MCA_0001, RNAPZ5_MCA_0001, RNAPZ6_MCA_0002, RNAPZ7_MCA_0001, TRP4P6_MCA_0004; (3D-M2-rescue). 16SFWJ_RSQ_0001.

When plotted on a log-log scale and extrapolated to longer RNA lengths (Fig. 9b ), the strong rise of MCM sequencing costs with number of nucleotides is apparent, especially compared with 1D chemical mapping approaches, which scale linearly with RNA length (blue curve in Fig. 9). At the time of writing, four billion reads can be achieved in a large-scale sequencing experiment if all lanes of an Illumina HiSeq machine are put to use (top dashed line, Fig. 9b ). A single experiment thus allows 1D chemical mapping of most of the highly expressed transcripts in a eukaryotic transcriptome (106–107 nucleotides) (Kwok et al. Reference Kwok, Tang, Assmann and Bevilacqua2015). For the same cost, MCM methods could, in principle, be applied to a single transcript with a length of at most 10 000 nucleotides. In practice, however this is still overly optimistic. First, available sequencing technologies remain limited to read lengths of a few hundred nucleotides, though this is improving. More fundamentally, all current MCM methods require primer extension by reverse transcriptase to connect events at one nucleotide to a second nucleotide (see, e.g. green arrows in Fig. 5a , b ). With currently tested reverse transcriptases, primer extension is inefficient for lengths beyond 1000 nucleotides even on unmodified transcripts; and, after chemical treatment, modified nucleotides either stop the enzyme (in M2 and MOHCA-seq) or reduce its processivity (under conditions tested for RING-MaP/MaP-2D). Based on these considerations, structure determination of the 1000-nucleotide RNA would appear to be the upper limit for current MCM methods, and even then would require significant methods development, such as characterization of newly available reverse transcriptases (Mohr et al. Reference Mohr, Ghanem, Smith, Sheeter, Qin, King, Polioudakis, Iyer, Hunicke-Smith, Swamy, Kuersten and Lambowitz2013). These calculations indicate that application of MCM to infer structures larger than 1000 nucleotides will require a fundamental advance in the methodology. Similar fundamental limitations would prevent application of current MCM methods to model a multitude of transcripts or to uncover intermolecular interactions, motivating the proposal of an extension, described next.
6.2 Proposal to overcome sequencing costs
6.2.1 Modify-cross-link-map (MXM)
Inspection of current data and new sequencing protocols suggests an experimental strategy to bypass the ~1000-nucleotide limit to MCM imposed by the quadratic growth of sequencing costs with sequence length. Most of the sequencing reads in an M2 or MaP-2D experiment (Figs 3 and 4) correspond to modifications at unstructured nucleotides that are not informative about RNA–RNA contacts (Fig. 9a ). Even for MOHCA-seq, which focuses its reads on proximal nucleotide pairs, background reverse transcriptase stops at non-proximal nucleotide pairs (which are subtracted from the maps in Fig. 5) dominate the sequencing cost for long RNAs (Fig. 9). Therefore, any experimental workup that filters out these uninformative hits at unstructured nucleotides and thereby focuses sequencing onto pairs of regions that are roughly proximal could bring the scaling of sequencing costs to be less than quadratic in RNA length. Assuming that each segment of an RNA molecule has a bounded number of possible neighbors within a bounded number of possible states, the sequencing costs would become linear and not quadratic in transcript size.
A method to coarsely filter for proximal segment pairs prior to sequencing can be envisioned by analogy to recently developed cross-linking/sequencing protocols. For example, Cross-linking Ligation and Sequencing of Hybrids (CLASH) and similar approaches (Mittal & Zavolan, Reference Mittal and Zavolan2014; Helwak & Tollervey, Reference Helwak and Tollervey2014) target RNA–RNA interactions by carrying out chemical cross-linking (primarily of nucleic acids bound to proteins), separation of these cross-linked species, removal of unstructured nucleotides through limited nuclease digestion, and ligation of the remaining segments into chimeric sequences (Fig. 10b ). See also RNA proximity ligation (Ramani et al. Reference Ramani, Qiu and Shendure2015), which relies on in situ ligation steps. The ligated segments are then reverse transcribed into chimeric cDNAs for amplification and sequencing; the cross-linked regions are recognized by aligning subsequences against the original transcript or transcriptome sequences (Fig. 10c ). These methods for inferring nucleotide–nucleotide contacts are powerful for inferring nucleic–acid interactions at the domain level but, in general, their resolutions are too poor for nucleotide-resolution de novo structure inference. Ligation boundaries are typically distal to the sites of the cross-links, and even when mapped through mutational profiling, these nucleotide–nucleotide chemical cross-links are sparse and can give false positives (Anokhina et al. Reference Anokhina, Bessonov, Miao, Westhof, Hartmuth and Luhrmann2013; Dai et al. Reference Dai, Chai, Gu, Gabel, Noskov, Blocker, Lambowitz and Zimmerly2008; Hang et al. Reference Hang, Wan, Yan and Shi2015; Levitt, Reference Levitt1969; Robart et al. Reference Robart, Chan, Peters, Rajashankar and Toor2014; Sergiev et al. Reference Sergiev, Dontsova and Bogdanov2001; Whirl-Carrillo et al. Reference Whirl-Carrillo, Gabashvili, Bada, Banatao and Altman2002). However, if chemical modifications correlated at a large number of proximal nucleotide pairs are introduced prior to the cross-linking (Fig. 10a ), they will later give rise to mutations in the final chimeric cDNAs (Fig. 10c ) upon reverse transcription via the MaP protocol (Homan et al. Reference Homan, Favorov, Lavender, Kursun, Ge, Busan, Dokholyan and Weeks2014; Siegfried et al. Reference Siegfried, Busan, Rice, Nelson and Weeks2014). The recovery of these correlations induced by single-nucleotide chemical modifications (rather than by cross-links) would yield rich and accurate MCM measurements, but focused on RNA segment pairs that are roughly proximal in vivo, trapped by cross-linking. The cost of this modify-cross-link-map method (MXM) protocol would scale in a reasonable manner – linearly with RNA length, if carried out as described above. A series of cross-linking and nuclease digestion times might need to be tested, varied in 2-fold increments to separately capture fragments from easily digested or difficult-to-digest RNA structures. In this case, the scaling of MXM would still increase only loglinearly with RNA length (Fig. 9, green dashed line). As a result, MXM should be a viable approach to de novo RNA structure characterization for bacterial transcriptomes and for targeted subsets of eukaryotic transcriptomes.
Schematic of the proposed modify-cross-link-map (MXM) expansion. (a) Correlated chemical modifications mark nucleotides brought together by RNA/protein structure in vivo. Shown are two sets of oxidative modifications produced by localized ‘spurs’ of hydroxyl radicals generated by scattering of a high-energy electron from water (Chatterjee et al. Reference Chatterjee, Schmidt and Holley1994; Krisch et al. Reference Krisch, Flick and Trumbore1991). (b) Additional processing steps of (i) sparse chemical cross-linking, (ii) nuclease digestion, and (iii) RNA ligation (Helwak & Tollervey, Reference Helwak and Tollervey2014) result in compact, chimeric RNA segments harboring correlated chemical modifications. This procedure removes unstructured RNA loops that yield no pairwise structural information and brings together segments distal in sequence or in different RNA strands. (c) Reverse transcription with mutational profiling (Siegfried et al. Reference Siegfried, Busan, Rice, Nelson and Weeks2014) reads out modifications at nucleotide resolution; sequence contexts for the modifications allow their alignment to the reference genome sequence.
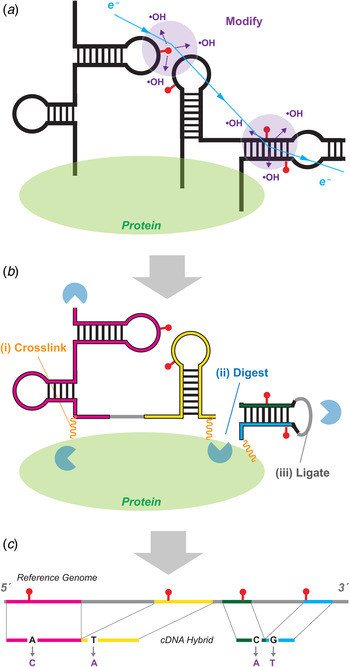
6.2.2 Additional advantages but multiple steps
The MXM protocol would give additional advantages besides reduced sequencing costs. First, by cross-linking and ligating separate RNAs brought together by direct interaction or by colocalization in complexes, MXM would expand MCM to detect pairwise structural interactions across transcripts rather than just within each transcript. Second, MXM would address current inefficiencies in reverse transcription of long RNAs and in sequencing of the associated long cDNAs; the long RNAs would be processed through digestion and ligation into smaller chimeras before sequencing (Fig. 10c ). Third, MXM could aid in experimentally separating multiple states of RNA transcripts prior to applying the computational deconvolution methods of Section 5. For example, suppose a region of a viral RNA genome forms three distinct local structures – one in the capsid, another while sequestering host factors such as miRNAs, and another while being translated by the ribosome. If these three states give rise to separable cross-linked species or are ligated to different RNA partners (miRNAs, ribosome), MXM maps could determine separate structural maps for the different states.
As with all high-throughput sequencing approaches, turning MXM into a quantitative technique for de novo structure inference will require significant investment of time and resources. Optimization and accounting for biases at the many steps – modification, cross-linking, separation, digestion, ligation, reverse transcription, amplification, sequencing, and computational dissection – will each be major challenges. Nevertheless, analogous sequencing approaches of comparable complexity are being developed and numerous groups have recognized steps to bring the methods onto a quantitative footing (Eddy, Reference Eddy2014; Konig et al. Reference Konig, Zarnack, Luscombe and Ule2011; Kwok et al. Reference Kwok, Tang, Assmann and Bevilacqua2015). Excitingly, rich microscopy data becoming available for actively translating ribosomes (Behrmann et al. Reference Behrmann, Loerke, Budkevich, Yamamoto, Schmidt, Penczek, Vos, Burger, Mielke, Scheerer and Spahn2015) will provide gold standard data to test MXM before its in vivo application to RNA messages, long non-coding RNAs, and viral genomes that will be difficult to probe with other methods.
7. Conclusion
MCM seeks detailed structural information about RNA molecules by measuring how the chemical reactivity of each nucleotide changes in response to perturbations at every other nucleotide. Single-nucleotide perturbations developed in recent years include mutations (M2), chemical modification (RING-MaP/MaP-2D), and radical source attachment (MOHCA). MCM experiments provide rich information to guide automated computer modeling methods. In the studies to date, MCM methods have given rich data on secondary and tertiary structure that can be assessed through direct visual inspection. When combined with automated computer modeling, the data have given consistently accurate secondary and tertiary structures at nucleotide resolution. The tests include blind structure prediction trials and modeling of RNA domains for which conventional chemical mapping methods have given incorrect or misleading results. RNA molecules that interconvert between multiple states – which are difficult for or require specialized interrogation with other structural techniques – can be dissected by rapid MCM approaches, albeit with lower resolution than single-structure cases. Incisive validation or falsification can be achieved by high-throughput compensatory rescue experiments for RNA secondary structure, but analogous tests for tertiary structure or ensemble models need to be developed.
The most important frontier for MCM will be the rapid de novo structure inference of RNA molecules in their native cellular or viral environments, eventually in a transcriptome-wide manner. Numerous chemical, computational, and sequencing challenges can be foreseen in applying MCM in vivo. Nevertheless, there appear to be no fundamental limitations precluding the development of such technologies, particularly if integration with cross-linking can reduce sequencing costs and recover nucleotide–resolution interactions across different RNA strands.
Acknowledgements
We thank C. Y. Cheng for special assistance in preparing MOHCA-seq figures. We gratefully acknowledge members of the Das laboratory for discussions over several years leading to the perspective outlined herein and the Burroughs Wellcome Foundation (Career Award at the Scientific Interface) and the National Institutes of Health (R01 GM102519) for supporting the writing of the review.


