


1. Introduction
Discrimination is an important issue in the insurance industry because applicants and policyholders are subject to differentiation through risk classification at every stage of their customer relationship, from underwriting to possible cancelation. This paper is motivated by gender-based discrimination within the European Union (EU). In 2011, the European Court of Justice concluded that any gender-based insurance discrimination must be prohibited. From December 21, 2012, after the Test-Achats ruling, all insurers operating in the EU are required to offer unisex premiums and benefits. However, as part of the guidelines on the application of the 2011 ruling, the use of true risk factors that might be correlated with gender remains permitted. Precisely, if the candidate rating factor enters the model because of its predictive power in the presence of gender, then it can still be used by the insurers operating in the EU, in application of these guidelines. The latter only prohibits the use of proxies without impact on the premium in presence of the protected variable.
Let us justify this interpretation of Article 17 in the “Guidelines on the application of Council Directive 2004/113/EC to insurance, in the light of the judgment of the Court of Justice of the European Union in Case C-236/09 (Test-Achats),” together with its footnote (3). The first example given in these guidelines refers to power of the car in motor insurance, which is likely to be an example of true risk factor because actuarial analyses consistently report higher claim frequencies associated with more powerful cars in motor third-party liability insurance, corrected for the effect of gender. In such a case, the guidelines still allow insurers to use power as a rating factor even if it may capture part of the gender effect when this protected attribute is removed from the analysis (because men generally drive more powerful cars). The second example in these guidelines considers driver’s height and weight, which have never been considered as risk factors in motor insurance, as far as we know. Both height and weight are obviously correlated to gender, so the guidelines prohibit their use as rating factors because they would not qualify as risk factors once gender is included in the analysis. They only become statistically significant when gender is omitted, resulting in prohibited indirect discrimination.
Indirect discrimination resulting from proxy discrimination may thus still be present on the market in application of these guidelines. Proxy discrimination originates from the relationship between a protected variable and a set of one or more surrogate variables recorded in the database. This occurs when premiums vary according to a facially neutral risk factor correlated with the protected variable. For instance, amounts of motor insurance premiums often differ according to the power of the vehicle or the distance traveled. If these features are correlated to gender, e.g. because men tend to drive more powerful cars over longer distance, then the insurer’s price list still indirectly discriminates according to gender.
The present paper demonstrates that demographic parity-adjusted prices are theoretically possible with tree-based techniques. The insurance premiums resulting from the proposed approach avoid indirect discrimination and thus strictly comply with the Gender EU Directive. This is achieved by adapting the splitting rules so that each risk class is gender-balanced. Therefore, it would theoretically be possible to enforce the prohibition of gender-based discrimination by adopting these techniques. In practice, some complications nevertheless remain, as explained in the final section of this paper.
The discrimination originating from insurance risk classification is an important topic in the literature. Let us briefly review some contributions related to the contents of the present paper. Abraham (Reference Abraham1985) proposed five criteria to evaluate risk classification plans: separation, reliability, incentive value, homogeneity, and admissibility. The last one emphasizes possible indirect discrimination by the use of “characteristics that are admissible on their face but that have a disparate impact on the members of one race or sex.” In a more general context, Avraham (Reference Avraham2018) and Prince and Schwarcz (Reference Prince and Schwarcz2020) proposed different properties that any rating factor should possess, irrespective of its discriminatory character. Frees and Huang (Reference Frees and Huang2021) discussed the predominant role of the actuary in the pricing process by choosing which information should be restricted or prohibited.
Discrimination has also been studied in relation to premium calculation algorithms. Lindholm et al. (Reference Lindholm, Richman, Tsanakas and Wüthrich2022) characterized direct and indirect discrimination and proposed discrimination-free premiums. Kusner et al. (Reference Kusner, Loftus, Russell and Silva2017), Kilbertus et al. (Reference Kilbertus, Rojas Carulla, Parascandolo, Hardt, Janzing and Schölkopf2017), Tschantz (Reference Tschantz2022), and Côté et al. (Reference Côté, Côté and Charpentier2024a) demonstrated that indirect discrimination issues can be formulated within the causal inference framework. Lindholm et al. (Reference Lindholm, Richman, Tsanakas and Wüthrich2022) and Araiza Iturria et al. (Reference Araiza Iturria, Hardy and Mariott2024) illustrated the connection between discrimination-free price and the back-door adjustment formula of Pearl (Reference Pearl2009) under Markovian Directed Acyclic Graph assumptions. Interestingly, Zhao and Hastie (Reference Zhao and Hastie2019) indicated that the definition of the Partial Dependence Plot (PDP-plot) introduced by Friedman (Reference Friedman2001) is similar to the back-door adjustment of Pearl (Reference Pearl2009). In this regard, the difference between the discrimination-free price and the unawareness price of Lindholm et al. (Reference Lindholm, Richman, Tsanakas and Wüthrich2022) is similar to the difference between the PDP-plot and the marginal plot (M-plot) of Cooks et al. (Reference Cook and Weisberg1997), used to identify a posteriori the relationship between the features and the predictions made by black-box models.
In the machine learning literature, several group-fairness criteria have been proposed in relation to discrimination. This paper considers independence, also referred to as demographic parity. Different approaches have been followed in order to reestablish model’s fairness:
-
− Pre-processing approaches focus on removing discrimination in the input data by using appropriate transformations. See e.g. Kamiran and Calders (Reference Kamiran and Calders2012) and Calmon et al. (Reference Calmon, Wei, Ramamurthy and Varshney2017).
-
− In-processing approaches enforce a constraint with respect to a fairness measure in the learning process by introducing a penalization parameter in the objective function. See e.g. Kamishima et al. (Reference Kamishima, Akaho and Sakuma2011), Dwork et al. (Reference Dwork, Hardt, Pitassi, Reinglod and Zemel2012) and Grari et al. (Reference Grari, Charpentier and Detyniecki2022).
-
− Post-processing approaches consist of removing discrimination a posteriori from the model’s predictions. See e.g. Hardt et al. (Reference Hardt, Price and Srebro2016) and Petersen et al. (Reference Petersen, Mukherjee, Sun and Yurochkin2021).
Recently, pre- and post-processing approaches have been increasingly developed using optimal transport theory, see Barrio et al. (Reference Barrio, Gamboa, Grodaliza and Loubes2019), Silvia et al. (Reference Silvia, Ray, Tom, Aldo, Heinrich and John2020), Chzhen et al. (Reference Chzhen, Denis, Hebiri, Oneto and Pontil2020a), Charpentier et al. (Reference Charpentier, Hu and Ratz.2023), and Lindholm et al. (Reference Lindholm, Richman, Tsanakas and Wüthrich2024).
While most discussions focus on fair classification, Agarwal et al. (Reference Agarwal, Dudik and Wu.2019) proposed two definitions of fair regression fulfilling demographic parity or bounded group loss. The latter notion requires that the prediction error for each protected group remains below a defined level. By considering bounded predictions and responses lying in $[0,1]$
, they transformed the original regression problem into a classification one and obtained theoretical results on solutions. Chzhen et al. (Reference Chzhen, Denis, Hebiri, Oneto and Pontil2020b) decomposed the problem of finding an optimal predictor fulfilling demographic parity into two successive optimization problems. The first one is standard risk minimization, and the second one applies the demographic parity constraint by means of Lagrange multipliers on discretized bins of predictions. This estimation involved the conditional expectation of the non-discriminatory features given the discriminatory one on an unlabeled data set left aside. These methods, however, introduce a large number of additional parameters.
$[0,1]$
, they transformed the original regression problem into a classification one and obtained theoretical results on solutions. Chzhen et al. (Reference Chzhen, Denis, Hebiri, Oneto and Pontil2020b) decomposed the problem of finding an optimal predictor fulfilling demographic parity into two successive optimization problems. The first one is standard risk minimization, and the second one applies the demographic parity constraint by means of Lagrange multipliers on discretized bins of predictions. This estimation involved the conditional expectation of the non-discriminatory features given the discriminatory one on an unlabeled data set left aside. These methods, however, introduce a large number of additional parameters.
This paper adopts the in-processing fairness approach in the insurance pricing framework. Proxy discrimination arises from the fact that the gender proportion may vary between risk classes. Therefore, premiums bring some information about gender and thus implicitly discriminate on that basis. This drawback can be eliminated by constraining each risk class to be gender-balanced. This is the idea explored in this paper with tree-based methods.
In relation to this framework, Kamiran et al. (Reference Kamiran, Calders and Pechenizkiy2010) and Raff et al. (Reference Raff, Sylvester and Mills2017) proposed integrating fairness into decision trees within a classification context. They evaluated discrimination during split creation by determining information gain concerning the protected variable, alongside the usual evaluation of accuracy through information gain related to the categorical response variable (class labels). Kamiran et al. (Reference Kamiran, Calders and Pechenizkiy2010) replaced the standard information gain maximized for the best split selection with various alternatives, such as difference, ratio, or sum of information gain with respect to the class label and the protected class, respectively. They combined this approach with leaf relabeling as a second step to mitigate discrimination. In contrast, Raff et al. (Reference Raff, Sylvester and Mills2017) introduced a normalized Gini impurity measure and only considered the difference between both information gains, with the second acting directly as a fairness penalization. These methods control fairness with respect to demographic parity in a global and implicit manner by incorporating a penalty based on the information gain computed with respect to the protected attribute during split selection. Although these approaches highlight the fact that they do not add new parameters to tune during the learning process for considering fairness, this effectively amounts to considering a Lagrange multiplier with respect to the fairness constraint equal to one in the objective function. Indeed, although both information gains lie within [0,1], their typical magnitudes can differ substantially, potentially limiting the effectiveness and flexibility of these methods without careful tuning of the Lagrange multiplier.
The approach described in this paper focuses on fair regression considering strong demographic parity (in distribution) by enforcing fairness locally at each split through a simple and interpretable constraint on group balance, filling the gap left by classification-only methods and information-based approaches that do not guarantee distributional fairness. This not only simplifies implementation but also provides explicit fairness guarantees, making the method more transparent, auditable, and suitable for deployment in regulated or high-stakes decision-making contexts. By constraining the splitting procedure, it is shown that we can end up with all risk classes containing the same proportion of men and women policyholders. The knowledge of the premiums then brings no more information about gender and discrimination is entirely removed as long as the composition of the portfolio remains unchanged. We refer to this approach as demographic parity corrected regression tree (DPTree) to emphasize that trees are made such that they satisfy demographic parity with respect to a binary protected variable. An extension to ensemble models allows us to introduce demographic parity corrected random forest (DPForest) built from DPTrees.
The present paper does not innovate in terms of fairness concepts, as demographic parity is a classical notion. Its contribution is a practical way to enforce demographic parity with tree-based machine learning methods, in a situation where the actuary has decided that demographic parity was the right fairness notion for the situation under consideration.
The remainder of this paper is organized as follows. Section 2 formalizes discrimination issues in insurance premiums. Section 3 describes the newly proposed DPTree approach, as well as the extension to random forests DPForest. Section 4 illustrates our new approach using motor insurance data. The final Section 5 briefly summarizes our main findings and concludes the paper with a discussion.
2. Demographic parity
Consider a claim response $Y$
and a set of non-discriminatory features
$Y$
and a set of non-discriminatory features $X_1$
, …,
$X_1$
, …, $X_p$
gathered in the random vector
$X_p$
gathered in the random vector $\boldsymbol{X}$
as well as a binary protected variable
$\boldsymbol{X}$
as well as a binary protected variable $D$
. In this paper, we are interested in policyholder’s gender
$D$
. In this paper, we are interested in policyholder’s gender $D$
, supposed to take values in
$D$
, supposed to take values in $\{0, 1\}$
. The random vector (
$\{0, 1\}$
. The random vector ( $\boldsymbol{X}$
,
$\boldsymbol{X}$
, $D$
) gathers all features at the insurer’s disposal.
$D$
) gathers all features at the insurer’s disposal.
The dependence structure inside the random vector ( $Y$
,
$Y$
, $\boldsymbol{X}$
,
$\boldsymbol{X}$
, $D$
) is exploited for extracting information about the expected response
$D$
) is exploited for extracting information about the expected response $Y$
contained in (
$Y$
contained in ( $\boldsymbol{X}$
,
$\boldsymbol{X}$
, $D$
). Without worrying about discriminatory features, the pure premium would be the conditional expectation
$D$
). Without worrying about discriminatory features, the pure premium would be the conditional expectation $\mu (\boldsymbol{X},D)=\text{E}[Y|\boldsymbol{X}, D]$
. The latter is called the best-estimate price (BEP) by Lindholm et al. (Reference Lindholm, Richman, Tsanakas and Wüthrich2022). Removing the protected variable
$\mu (\boldsymbol{X},D)=\text{E}[Y|\boldsymbol{X}, D]$
. The latter is called the best-estimate price (BEP) by Lindholm et al. (Reference Lindholm, Richman, Tsanakas and Wüthrich2022). Removing the protected variable $D$
from the analysis means that the resulting premium is the conditional expectation
$D$
from the analysis means that the resulting premium is the conditional expectation $\mu (\boldsymbol{X})=\text{E}[Y|\boldsymbol{X}]$
. The latter is called the unawareness price and is further considered in Section 4.4.1.
$\mu (\boldsymbol{X})=\text{E}[Y|\boldsymbol{X}]$
. The latter is called the unawareness price and is further considered in Section 4.4.1.
Classical group-fairness criteria include independence, separation, and sufficiency. See e.g. Corbett et al. (Reference Corbett-Davies, Pierson, Feller, Goel and Huq2017), Barocas et al. (Reference Barocas, Hardt and Narayanan2023), Steinberg et al. (Reference Steinberg, Reid and O’Callaghan2020), Caton and Haas (Reference Caton and Haas2020), and Charpentier (Reference Charpentier2022) for a discussion. In the literature, group-fairness criteria are often stated either with the model’s score or with the model’s predictions. Working with regression trees, model’s scores are equivalent to model’s predictions, so that we only mention model’s predictions throughout this text to avoid any confusion.
Let $\widehat {\mu }(\boldsymbol{X})$
denote the model’s prediction for the expected claim response. The independence criterion focuses on the independence between the model’s predictions
$\widehat {\mu }(\boldsymbol{X})$
denote the model’s prediction for the expected claim response. The independence criterion focuses on the independence between the model’s predictions $\widehat {\mu }(\boldsymbol{X})$
and the protected variable
$\widehat {\mu }(\boldsymbol{X})$
and the protected variable $D$
. This is often referred to as demographic parity, as formally stated next.
$D$
. This is often referred to as demographic parity, as formally stated next.
Definition 2.1 (Demographic parity). A predictor $\widehat {\mu }(\boldsymbol{X})$
satisfies demographic parity if
$\widehat {\mu }(\boldsymbol{X})$
satisfies demographic parity if $\widehat {\mu }(\boldsymbol{X})$
and
$\widehat {\mu }(\boldsymbol{X})$
and $D$
are mutually independent.
$D$
are mutually independent.
Notice that Definition 2.1 does not require $\boldsymbol{X}$
and
$\boldsymbol{X}$
and $D$
to be independent, only that the candidate pure premiums
$D$
to be independent, only that the candidate pure premiums $\widehat {\mu }(\boldsymbol{X})$
are independent from
$\widehat {\mu }(\boldsymbol{X})$
are independent from $D$
. This means that the distribution of
$D$
. This means that the distribution of $\widehat {\mu }(\boldsymbol{X})$
must remain the same for male and female policyholders. Therefore, the knowledge of the premium
$\widehat {\mu }(\boldsymbol{X})$
must remain the same for male and female policyholders. Therefore, the knowledge of the premium $\widehat {\mu }(\boldsymbol{X})$
charged to a policyholder does not bring any information about his or her gender. Denoting as
$\widehat {\mu }(\boldsymbol{X})$
charged to a policyholder does not bring any information about his or her gender. Denoting as $F_0$
the distribution function of
$F_0$
the distribution function of $\widehat {\mu }(\boldsymbol{X})$
given
$\widehat {\mu }(\boldsymbol{X})$
given $D=0$
and as
$D=0$
and as $F_1$
the distribution function of
$F_1$
the distribution function of $\widehat {\mu }(\boldsymbol{X})$
given
$\widehat {\mu }(\boldsymbol{X})$
given $D=1$
, we thus see that
$D=1$
, we thus see that
 \begin{equation*} \text{Demographic parity}\Leftrightarrow F_0=F_1. \end{equation*}
Equality of the distribution functions can be formally tested using Kolmogorov–Smirnov procedure, for instance.
Let us mention that the relevance of demographic parity as group fairness notion in insurance has been questioned by Baumann and Loi (Reference Baumann and Loi2023). As pointed out by these authors in the introduction to their paper, there is no consensus about the fairness criterion and different contexts may call for different criteria. Baumann and Loi (Reference Baumann and Loi2023) then specify that their analysis assumes that insurers implement chance solidarity and that there is no need for risk solidarity. In other words, premium transfers from over-priced low risks to under-priced high risks are prohibited. This point of view thus conflicts with the situation considered in the present paper, where it is assumed that the use of a risk factor is prohibited, which necessarily results in risk solidarity, or premium transfers. The equal treatment despite potentially different risk enforced in the EU in relation to gender is referred to by Baumann and Loi (Reference Baumann and Loi2023) as another approach.
While we agree with the analysis conducted by these authors and share their conclusion about the suitability of sufficiency, or well-calibration, as fairness condition in a context where “chance solidarity, and no other form of solidarity is meant to be achieved” (Baumann and Loi, Reference Baumann and Loi2023, page 45, bottom), this is not the context of the present study where risk solidarity automatically results from equal treatment despite different risk. The reason why Baumann and Loi (Reference Baumann and Loi2023) rule out demographic parity, as stated in the second paragraph of Section 3.3.1 in their paper, does not apply here since risk solidarity is present.
Notice that the definition of demographic parity adopted in this paper differs from the one stated in equation (3) of Baumann and Loi (Reference Baumann and Loi2023). We consider here the stronger independence condition corresponding to Definition 8.3 in Charpentier (Reference Charpentier2024). This does not modify the reasoning held in the preceding paragraphs, showing that demographic parity may be a desirable property under equal treatment despite different risk and that the latter requirement rules out well-calibration. As another example of proper use of demographic parity in an insurance context, we refer to Fröhlich and Williamson (Reference Fröhlich and Williamson2024), who consider the independence condition retained in the present paper in their Definition 4.1 with “having migrant background” as sensitive feature $D$
. There is thus no contradiction between the interesting study conducted by Baumann and Loi (Reference Baumann and Loi2023) and the one in the present paper, which just applies to different contexts.
$D$
. There is thus no contradiction between the interesting study conducted by Baumann and Loi (Reference Baumann and Loi2023) and the one in the present paper, which just applies to different contexts.
3. Demographic parity corrected regression tree
3.1 Regression tree
Let $\chi$
be the feature space spanned by the non-discriminatory features. Regression trees recursively partition the entire feature space
$\chi$
be the feature space spanned by the non-discriminatory features. Regression trees recursively partition the entire feature space $\chi$
into a set of disjoint subsets
$\chi$
into a set of disjoint subsets $\{\chi _{t}\}_{t \in \mathcal{L}}$
through successive binary splits, where
$\{\chi _{t}\}_{t \in \mathcal{L}}$
through successive binary splits, where $\mathcal{L}$
denotes the set of terminal nodes.
$\mathcal{L}$
denotes the set of terminal nodes.
The database $\mathcal{D}$
records observations of the form
$\mathcal{D}$
records observations of the form $(y_i,\boldsymbol{x}_i, d_i)$
for a large number of cases
$(y_i,\boldsymbol{x}_i, d_i)$
for a large number of cases $i$
. It is divided into a train set
$i$
. It is divided into a train set $\mathcal{D}^{\texttt {train}}$
and a validation set
$\mathcal{D}^{\texttt {train}}$
and a validation set $\mathcal{D}^{\texttt {valid}}$
, that is,
$\mathcal{D}^{\texttt {valid}}$
, that is, $\mathcal{D}=\mathcal{D}^{\texttt {train}} \cup \mathcal{D}^{\texttt {valid}}$
. The train set
$\mathcal{D}=\mathcal{D}^{\texttt {train}} \cup \mathcal{D}^{\texttt {valid}}$
. The train set $\mathcal{D}^{\texttt {train}}$
is itself divided into a training set
$\mathcal{D}^{\texttt {train}}$
is itself divided into a training set $\mathcal{D}^{\texttt {training}}$
and a testing set
$\mathcal{D}^{\texttt {training}}$
and a testing set $\mathcal{D}^{\texttt {testing}}$
, that is,
$\mathcal{D}^{\texttt {testing}}$
, that is, $\mathcal{D}^{\texttt {train}}=\mathcal{D}^{\texttt {training}} \cup \mathcal{D}^{\texttt {testing}}$
. Henceforth,
$\mathcal{D}^{\texttt {train}}=\mathcal{D}^{\texttt {training}} \cup \mathcal{D}^{\texttt {testing}}$
. Henceforth, $i=1,\ldots ,n$
refers to the cases included in
$i=1,\ldots ,n$
refers to the cases included in $\mathcal{D}^{\texttt {training}}$
.
$\mathcal{D}^{\texttt {training}}$
.
Let $\chi _t$
denote the subset of the feature space
$\chi _t$
denote the subset of the feature space $\chi$
corresponding to node
$\chi$
corresponding to node $t$
, meaning that an observation
$t$
, meaning that an observation $i$
belongs to node
$i$
belongs to node $t$
if
$t$
if $\boldsymbol{x}_i \in \chi _t$
. Let
$\boldsymbol{x}_i \in \chi _t$
. Let $s$
be a candidate split for node
$s$
be a candidate split for node $t$
. The candidate split
$t$
. The candidate split $s$
generates two child nodes, denoted as
$s$
generates two child nodes, denoted as $t_{L}^{(s)}$
and
$t_{L}^{(s)}$
and $t_{R}^{(s)}$
. More precisely,
$t_{R}^{(s)}$
. More precisely, $t_{L}^{(s)}$
and
$t_{L}^{(s)}$
and $t_{R}^{(s)}$
are the left and right child nodes of
$t_{R}^{(s)}$
are the left and right child nodes of $t$
resulting from split
$t$
resulting from split $s$
. Let
$s$
. Let $\chi _{t_{L}^{(s)}}$
and
$\chi _{t_{L}^{(s)}}$
and $\chi _{t_{R}^{(s)}}$
denote the subsets of the feature space
$\chi _{t_{R}^{(s)}}$
denote the subsets of the feature space $\chi$
corresponding to nodes
$\chi$
corresponding to nodes $t_{L}^{(s)}$
and
$t_{L}^{(s)}$
and $t_{R}^{(s)}$
, respectively. By construction, we have
$t_{R}^{(s)}$
, respectively. By construction, we have $\chi _t = \chi _{t_{L}^{(s)}} \cup \chi _{t_{R}^{(s)}}$
. The optimal split
$\chi _t = \chi _{t_{L}^{(s)}} \cup \chi _{t_{R}^{(s)}}$
. The optimal split $s_{t}$
at node
$s_{t}$
at node $t$
is obtained by minimizing a given loss function
$t$
is obtained by minimizing a given loss function $L$
, estimated on
$L$
, estimated on $\mathcal{D}^{\texttt {training}}$
, over the set of candidate splits
$\mathcal{D}^{\texttt {training}}$
, over the set of candidate splits $\mathcal{S}_{t}$
. Formally,
$\mathcal{S}_{t}$
. Formally,
 \begin{align} s_{t}=\underset {s \in \mathcal{S}_{t}}{arg\,min}\left \{{\sum \limits _{i: \boldsymbol{x}_i \in \chi _{t_{L}^{(s)}}}L\left (y_i, \overline {y}_{t_{L}^{(s)}}\right )+\sum \limits _{i: \boldsymbol{x}_i \in \chi _{t_{R}^{(s)}}}L\left (y_i, \overline {y}_{t_{R}^{(s)}}\right )}\right \}, \end{align}
where $\overline {y}_{t_{L}^{(s)}}$
and
$\overline {y}_{t_{L}^{(s)}}$
and $\overline {y}_{t_{R}^{(s)}}$
denote the average response, respectively, in the left and right candidate nodes. Often in insurance applications, the loss function
$\overline {y}_{t_{R}^{(s)}}$
denote the average response, respectively, in the left and right candidate nodes. Often in insurance applications, the loss function $L$
corresponds to the deviance associated with a distribution in the exponential dispersion family with the same support as
$L$
corresponds to the deviance associated with a distribution in the exponential dispersion family with the same support as $Y$
.
$Y$
.
Once the optimal split has been found at a node $t$
, the feature space
$t$
, the feature space $\chi _{t}$
is divided into two disjoint subsets
$\chi _{t}$
is divided into two disjoint subsets $\chi _{t_{L}}$
(left node) and
$\chi _{t_{L}}$
(left node) and $\chi _{t_{R}}$
(right node). We denote by
$\chi _{t_{R}}$
(right node). We denote by $\overline {y}_{t_{L}}$
and
$\overline {y}_{t_{L}}$
and $\overline {y}_{t_{R}}$
the associated average response, respectively, in the left and right nodes.
$\overline {y}_{t_{R}}$
the associated average response, respectively, in the left and right nodes.
At the end of the partitioning process, the regression tree produces predictions of the form
 \begin{align} \widehat {\mu }(\boldsymbol{x}) = \sum _{t \in \mathcal{L}}\overline {y}_{t}\unicode {x1D7D9}[\boldsymbol{x} \in \chi _{t}], \end{align}
where $\unicode {x1D7D9}[\cdot ]$
is the indicator function (equal to 1 if the event appearing within the brackets is realized and to 0 otherwise). In words,
$\unicode {x1D7D9}[\cdot ]$
is the indicator function (equal to 1 if the event appearing within the brackets is realized and to 0 otherwise). In words, $\widehat {\mu }(\boldsymbol{x})$
is the average response
$\widehat {\mu }(\boldsymbol{x})$
is the average response $\overline {y}_{t}$
in the terminal leaf
$\overline {y}_{t}$
in the terminal leaf $t$
corresponding to the risk profile
$t$
corresponding to the risk profile $\boldsymbol{x}$
.
$\boldsymbol{x}$
.
3.2 Demographic parity corrected regression tree
As the tree partitions $\chi$
into subsets
$\chi$
into subsets $\chi _t$
, demographic parity holds if the distribution of
$\chi _t$
, demographic parity holds if the distribution of $D$
remains the same given that
$D$
remains the same given that $\boldsymbol{X}\in \chi _t$
for all
$\boldsymbol{X}\in \chi _t$
for all $t$
. This is the essence of the DPTree, where any split must result in subgroups where the proportion of cases with
$t$
. This is the essence of the DPTree, where any split must result in subgroups where the proportion of cases with $D=0$
remains equal to the one observed in the root node. The next example justifies this approach for the simple “stump” tree, which is known to be the basic building block of all trees.
$D=0$
remains equal to the one observed in the root node. The next example justifies this approach for the simple “stump” tree, which is known to be the basic building block of all trees.
Regression tree “stump” with only one node and two leaves.

Example 3.1. Consider the simple one-split regression tree depicted in Figure 1, often referred to as a stump. The unique split corresponds to the one which leads to the maximum loss function reduction on $\mathcal{D}^{\texttt {training}}$
. To fix the ideas, we suppose in this example that this split is based on the numerical feature
$\mathcal{D}^{\texttt {training}}$
. To fix the ideas, we suppose in this example that this split is based on the numerical feature $X$
and a threshold value of
$X$
and a threshold value of $30$
, say. The observations in the root node are then divided according to the decision rule
$30$
, say. The observations in the root node are then divided according to the decision rule $X \leq 30$
versus
$X \leq 30$
versus $X\gt 30$
.
$X\gt 30$
.
Let $n_1$
be the number of observations in the left node and
$n_1$
be the number of observations in the left node and $n_2$
in the right node, as shown in Figure 1. Also, denote as
$n_2$
in the right node, as shown in Figure 1. Also, denote as $n_{t,0}$
and
$n_{t,0}$
and $n_{t,1}$
,
$n_{t,1}$
, $t \in \{0, 1, 2\}$
, the number of observations in the root node (
$t \in \{0, 1, 2\}$
, the number of observations in the root node ( $t=0$
), in left node (
$t=0$
), in left node ( $t=1$
) and in right node (
$t=1$
) and in right node ( $t=2$
) with protected variable
$t=2$
) with protected variable $D=0$
and
$D=0$
and $D=1$
, respectively. In the left leaf, the estimate of the unawareness price is given by
$D=1$
, respectively. In the left leaf, the estimate of the unawareness price is given by
 \begin{align*} \widehat {\mu }(X\leq 30) &= \overline {y}_{1,0}\frac {n_{1,0}}{n_1} + \overline {y}_{1,1}\frac {n_{1,1}}{n_1}, \end{align*}
where $\overline {y}_{1,0}=\frac {\sum _{i=1}^{n} y_i \unicode {x1D7D9}[x_i \leq 30, d_i=0]}{n}$
and
$\overline {y}_{1,0}=\frac {\sum _{i=1}^{n} y_i \unicode {x1D7D9}[x_i \leq 30, d_i=0]}{n}$
and $\overline {y}_{1,1}=\frac {\sum _{i=1}^{n} y_i \unicode {x1D7D9}[x_i \leq 30, d_i=1]}{n}$
. The corresponding estimate of the discrimination-free price maintaining the same proportion as in the root node writes
$\overline {y}_{1,1}=\frac {\sum _{i=1}^{n} y_i \unicode {x1D7D9}[x_i \leq 30, d_i=1]}{n}$
. The corresponding estimate of the discrimination-free price maintaining the same proportion as in the root node writes
 \begin{align*} \mu ^{*}(X\leq 30) &= \overline {y}_{1,0}\frac {n_{0,0}}{n} + \overline {y}_{1,1}\frac {n_{0,1}}{n}. \end{align*}
The equality of the estimates of the unawareness price and discrimination-free price holds if
 \begin{equation} \frac {n_{1,0}}{n_1}=\frac {n_{0,0}}{n}. \end{equation}
If we follow the same reasoning for the right leaf, we conclude that the estimates of the unawareness price and discrimination-free price coincide if
 \begin{align} \frac {n_{2,0}}{n_2}=\frac {n_{0,0}}{n}. \end{align}
As $n_{2,0} = n_{0,0} - n_{1,0}$
and
$n_{2,0} = n_{0,0} - n_{1,0}$
and $n_{2} = n - n_{1}$
, conditions (3.3) and (3.4) are in fact equivalent. Notice that we have silently assumed that
$n_{2} = n - n_{1}$
, conditions (3.3) and (3.4) are in fact equivalent. Notice that we have silently assumed that $n_1\gt 0$
and
$n_1\gt 0$
and $n_2\gt 0$
(one leaf cannot be empty).
$n_2\gt 0$
(one leaf cannot be empty).
Example 3.1 shows that constraining the proportion of observations with $D=0$
in the left node to be equal to the proportion of observations with
$D=0$
in the left node to be equal to the proportion of observations with $D=0$
in the root node is enough to characterize a DPTree. In general, a DPTree can thus be obtained by preserving the proportion of cases with
$D=0$
in the root node is enough to characterize a DPTree. In general, a DPTree can thus be obtained by preserving the proportion of cases with $D=0$
in the whole portfolio along each left node of the regression tree. This leads to the following definition.
$D=0$
in the whole portfolio along each left node of the regression tree. This leads to the following definition.
Definition 3.2 (DPTree). Let $p_{t_0}=\frac {\sum _{i=1}^{n} \unicode {x1D7D9}[d_i=0]}{n}$
be the proportion of cases with
$p_{t_0}=\frac {\sum _{i=1}^{n} \unicode {x1D7D9}[d_i=0]}{n}$
be the proportion of cases with $D=0$
in the root node
$D=0$
in the root node $t_0$
. The DPTree is built by reducing the set of candidate splits to
$t_0$
. The DPTree is built by reducing the set of candidate splits to
 \begin{align*} \mathcal{S}^{(0)}_{t}=\{s \in \mathcal{S}_t | p_{t_{L}^{(s)}}=p_{t_0}\} \end{align*}
with
 \begin{equation*} p_{t_{L}^{(s)}}=\frac {n_{t_{L}^{(s)}, 0}}{n_{t_{L}^{(s)}}} =\frac {\sum _{i=1}^{n}\unicode {x1D7D9}[\boldsymbol{x}_i \in \chi _{t_{L}^{(s)}}, d_i=0]} {\sum _{i=1}^{n}\unicode {x1D7D9}[\boldsymbol{x}_i \in \chi _{t_{L}^{(s)}}]}, \end{equation*}
where $n_{t_{L}^{(s)}, 0}$
(resp.
$n_{t_{L}^{(s)}, 0}$
(resp. $n_{t_{R}^{(s)}, 0}$
) denotes the number of cases in the left (resp. right) candidate node
$n_{t_{R}^{(s)}, 0}$
) denotes the number of cases in the left (resp. right) candidate node $t_{L}^{(s)}$
(resp.
$t_{L}^{(s)}$
(resp. $t_{R}^{(s)}$
) with
$t_{R}^{(s)}$
) with $D=0$
. The optimal split is then determined according to (
3.1
) by replacing the set
$D=0$
. The optimal split is then determined according to (
3.1
) by replacing the set $\mathcal{S}_{t}$
of candidate splits with
$\mathcal{S}_{t}$
of candidate splits with $\mathcal{S}^{(0)}_{t}$
.
$\mathcal{S}^{(0)}_{t}$
.
By ensuring that in every node, the proportion of cases with $D=0$
is the same as in the root node, the resulting price produced by the regression tree is free of direct and indirect discrimination and is unbiased. By construction, the resulting predictions fulfill demographic parity from Definition 2.1. Indeed, for
$D=0$
is the same as in the root node, the resulting price produced by the regression tree is free of direct and indirect discrimination and is unbiased. By construction, the resulting predictions fulfill demographic parity from Definition 2.1. Indeed, for $j=0,1$
, we have
$j=0,1$
, we have
 \begin{eqnarray*} F_j(u)&=&\mathbb{P}[\widehat {\mu }(\boldsymbol{X})\leq u | D=j] \\ &=& \sum _{t \in \mathcal{L}} \mathbb{P}[\widehat {\mu }(\boldsymbol{X})\leq u, \boldsymbol{X} \in \chi _{t} | D=j] \\ &=& \sum _{t \in \mathcal{L}} \mathbb{P}[\widehat {\mu }(\boldsymbol{X})\leq u | \boldsymbol{X} \in \chi _{t}, D=j] \mathbb{P}[\boldsymbol{X} \in \chi _{t} | D=j]. \end{eqnarray*}
Moreover, $\{\widehat {\mu }(\boldsymbol{X}) | \boldsymbol{X} \in \chi _{t}, D=j\} = \overline {y}_t = \{\widehat {\mu }(\boldsymbol{X}) | \boldsymbol{X} \in \chi _{t}\}$
and
$\{\widehat {\mu }(\boldsymbol{X}) | \boldsymbol{X} \in \chi _{t}, D=j\} = \overline {y}_t = \{\widehat {\mu }(\boldsymbol{X}) | \boldsymbol{X} \in \chi _{t}\}$
and
 \begin{eqnarray*} \mathbb{P}[\boldsymbol{X} \in \chi _{t} | D=j] = \frac {\mathbb{P}[D=j | \boldsymbol{X} \in \chi _{t}] \mathbb{P}[\boldsymbol{X} \in \chi _{t}]}{\mathbb{P}[D=j]}. \end{eqnarray*}
Hence, since by construction, $\widehat {\mathbb{P}}[D=j | \boldsymbol{X} \in \chi _{t}]=\widehat {\mathbb{P}}[D=j]$
on the training set, it comes
$\widehat {\mathbb{P}}[D=j | \boldsymbol{X} \in \chi _{t}]=\widehat {\mathbb{P}}[D=j]$
on the training set, it comes
 \begin{eqnarray*} \widehat {F}_j(u)\quad\, &=& \sum _{t \in \mathcal{L}} \widehat {\mathbb{P}}[\widehat {\mu }(\boldsymbol{X})\leq u | \boldsymbol{X} \in \chi _{t}] \widehat {\mathbb{P}}[\boldsymbol{X} \in \chi _{t}] \\\quad\, &=& \widehat {\mathbb{P}}[\widehat {\mu }(\boldsymbol{X})\leq u], \end{eqnarray*}
so that $\widehat {F}_0(u)=\widehat {F}_1(u)$
.
$\widehat {F}_0(u)=\widehat {F}_1(u)$
.
Strictly imposing the DPTree constraint may weaken the predictive power of the regression tree. This is why we propose to consider a margin $m$
on this constraint, allowing for moderate departures to improve the DPTree performances.
$m$
on this constraint, allowing for moderate departures to improve the DPTree performances.
Definition 3.3 (DPTree $(m)$
). The DPTree
$(m)$
). The DPTree $(m)$
is obtained by allowing for a margin
$(m)$
is obtained by allowing for a margin $m$
such that the set of candidate splits becomes
$m$
such that the set of candidate splits becomes
 \begin{align*} \mathcal{S}^{(m)}_{t}=\big \{s \in \mathcal{S}_t \hspace {2mm}\big | \hspace {2mm} |p_{t_0}-p_{t^{(s)}_L}| \leq m, \hspace {2mm} |p_{t_0}-p_{t^{(s)}_R}| \leq m\big \}. \end{align*}
The optimal split $s_{t}^{(m)}$
is then determined according to (3.1) by replacing the set
$s_{t}^{(m)}$
is then determined according to (3.1) by replacing the set $\mathcal{S}_{t}$
of candidate splits with
$\mathcal{S}_{t}$
of candidate splits with $\mathcal{S}^{(m)}_{t}$
.
$\mathcal{S}^{(m)}_{t}$
.
The margin $m$
in Definition 3.3 is generally expressed in relative terms, as
$m$
in Definition 3.3 is generally expressed in relative terms, as
 \begin{equation*} m=\varepsilon p_{t_0}\quad \text{with }\varepsilon =0,1\% ,2\% ,\ldots \end{equation*}
Henceforth, $m$
and
$m$
and $\varepsilon$
will be used interchangeably. Clearly,
$\varepsilon$
will be used interchangeably. Clearly,
 \begin{equation*} \mathcal{S}^{(0)}_{t} \subset \mathcal{S}^{(m)}_{t} \subset \mathcal{S}_{t}=\mathcal{S}^{(1)}_{t} \end{equation*}
and DPTree=DPTree(0). Thus, $\mathcal{S}^{(0)}_{t}$
corresponds to the constrained set of candidate splits with no margin (
$\mathcal{S}^{(0)}_{t}$
corresponds to the constrained set of candidate splits with no margin ( $m=0$
), while
$m=0$
), while $\mathcal{S}^{(1)}_{t}$
corresponds to unconstrained regression trees. Let us now come back to Example 3.1 to see how the constraint is relaxed when growing regression trees.
$\mathcal{S}^{(1)}_{t}$
corresponds to unconstrained regression trees. Let us now come back to Example 3.1 to see how the constraint is relaxed when growing regression trees.
Example 3.4 (Example 3.1 Ctd). When the margin $m$
is allowed, equality is weakened into the following inequality:
$m$
is allowed, equality is weakened into the following inequality:
 \begin{align} \left |\frac {n_{1,0}}{n_1}-\frac {n_{0,0}}{n}\right | \leq m \implies |n_{1,0}n-n_{0,0}n_{1}| \leq mn_1n. \end{align}
Similarly,
 \begin{equation*} |n_{2,0}n-n_{0,0}n_{2}| \leq mn_2n\Leftrightarrow |(n_{0,0}-n_{1,0})n-n_{0,0}(n-n_{1})| \leq m(n-n_1)n, \end{equation*}
resulting in
 \begin{align} |n_{1,0}n-n_{0,0}n_{1}| \leq mn(n-n_1). \end{align}
Example 3.4 shows that inequality (3.6) is different from inequality (3.5), so the margin constraint should be respected in each node of the tree and not only in left nodes. The DPTree $(m)$
approach has been implemented in Python following the approach of Breiman et al. (Reference Breiman, Friedman, Olshen and Stones1984). The following algorithm describes the optimal split research at a node
$(m)$
approach has been implemented in Python following the approach of Breiman et al. (Reference Breiman, Friedman, Olshen and Stones1984). The following algorithm describes the optimal split research at a node $t$
of the DPTree
$t$
of the DPTree $(m)$
:
$(m)$
:
DPTree(m) algorithm at node t

3.3 Demographic parity corrected ensemble methods
As mentioned in Denuit et al. (Reference Denuit, Hainaut and Trufin2020), regression trees often suffer from instability. For instance, the tree may sometimes exhibit a completely different structure in case of only slight modification of the training set $\mathcal{D}^{\texttt {training}}$
. Ensemble methods aim to improve stability by averaging predictions obtained from trees resulting from perturbed training set. The perturbations of
$\mathcal{D}^{\texttt {training}}$
. Ensemble methods aim to improve stability by averaging predictions obtained from trees resulting from perturbed training set. The perturbations of $\mathcal{D}^{\texttt {training}}$
are obtained from resampling and random selection of features used in the splitting process of each individual tree. Precisely, consider an ensemble of
$\mathcal{D}^{\texttt {training}}$
are obtained from resampling and random selection of features used in the splitting process of each individual tree. Precisely, consider an ensemble of $B$
different training sets denoted as
$B$
different training sets denoted as $\mathcal{D}^{\texttt {training,1}}$
,
$\mathcal{D}^{\texttt {training,1}}$
, $\mathcal{D}^{\texttt {training,2}}$
,
$\mathcal{D}^{\texttt {training,2}}$
, $\ldots$
,
$\ldots$
, $\mathcal{D}^{\texttt {training,B}}$
. The predictions obtained from the random forest are expressed as
$\mathcal{D}^{\texttt {training,B}}$
. The predictions obtained from the random forest are expressed as
 \begin{align*} \widehat {\mu }^{rf}_{\mathcal{D}^{\texttt {training}}}(\boldsymbol{x})=\frac {1}{B}\sum _{b=1}^{B}\widehat {\mu }_{\mathcal{D}^{\texttt {training,b}}}(\boldsymbol{x}) \end{align*}
where each $\widehat {\mu }_{\mathcal{D}^{\texttt {training,b}}}(\boldsymbol{x})$
is of the form (3.2).
$\widehat {\mu }_{\mathcal{D}^{\texttt {training,b}}}(\boldsymbol{x})$
is of the form (3.2).
The approach leading to DPTree $(m)$
described in Section 3.2 can be applied to any tree in the forest. An ensemble of discrimination-free regression trees can thus be obtained, depending on the number of trees
$(m)$
described in Section 3.2 can be applied to any tree in the forest. An ensemble of discrimination-free regression trees can thus be obtained, depending on the number of trees $B$
included in the ensemble, from the sampling rate
$B$
included in the ensemble, from the sampling rate $s$
used to generate the
$s$
used to generate the $B$
random training sets, and the number of features
$B$
random training sets, and the number of features $k\lt p$
randomly selected at each node.
$k\lt p$
randomly selected at each node.
The predictions of the discrimination-free random forest are given by
 \begin{align*} \widehat {\mu }^{rf(m)}_{\mathcal{D}^{\texttt {training}}}(\boldsymbol{x})=\frac {1}{B}\sum _{b=1}^{B}\widehat {\mu }^{(m)}_{\mathcal{D}^{\texttt {training,b}}}(\boldsymbol{x}), \end{align*}
where $\widehat {\mu }^{(m)}_{\mathcal{D}^{\texttt {training,b}}}(\boldsymbol{x})$
denotes the DPTree
$\widehat {\mu }^{(m)}_{\mathcal{D}^{\texttt {training,b}}}(\boldsymbol{x})$
denotes the DPTree $(m)$
prediction for risk profile
$(m)$
prediction for risk profile $\boldsymbol{x}$
on the training set
$\boldsymbol{x}$
on the training set $\mathcal{D}^{\texttt {training,b}}$
. When the number of features
$\mathcal{D}^{\texttt {training,b}}$
. When the number of features $k$
is equal to the number of explanatory variables
$k$
is equal to the number of explanatory variables $p$
, the random forest is equivalent to the bagging model. This approach is referred to as DPForest
$p$
, the random forest is equivalent to the bagging model. This approach is referred to as DPForest $(m)$
.
$(m)$
.
4. Numerical application
4.1 Database
The approach proposed in this paper is illustrated on a Belgian motor third-party liability portfolio, which comprises $234,178$
individual policies observed over one year. For each policy
$234,178$
individual policies observed over one year. For each policy $i$
,
$i$
, $p=14$
non-discriminatory features are available. The response variable
$p=14$
non-discriminatory features are available. The response variable $Y_i$
represents the number of reported claims for policy
$Y_i$
represents the number of reported claims for policy $i$
. Gender is the protected variable
$i$
. Gender is the protected variable $D$
, with
$D$
, with $D=0$
for men and
$D=0$
for men and $D=1$
for women. The data set is partitioned into a training set
$D=1$
for women. The data set is partitioned into a training set $\mathcal{D}^{\texttt {training}}$
composed of 64% of the observations, a testing set
$\mathcal{D}^{\texttt {training}}$
composed of 64% of the observations, a testing set $\mathcal{D} ^{\texttt {testing}}$
with 16% of the observations, and a validation set
$\mathcal{D} ^{\texttt {testing}}$
with 16% of the observations, and a validation set $\mathcal{D}^{\texttt {valid}}$
with the 20% remaining observations. Table 1 provides the summary statistics of the numerical features on the training set. Vehicle characteristics (power, weight, and value) tend to be higher for men than for women, whereas other variables remain similar for each gender. Tables 2–3 display the conditional distributions of the categorical features given gender. Table 2 shows little differences in terms of vehicle use (with more professional users among men). Premium cars (like Mercedes, BMW, Audi, or Volvo) are more frequent for men. Considering Table 3, we see some differences between men and women with respect to gasoil and petrol as fuel oils, as well as for monthly payments. These summary statistics suggest some degree of association between available features and gender, producing the kind of indirect discrimination discussed in the preceding sections.
$\mathcal{D}^{\texttt {valid}}$
with the 20% remaining observations. Table 1 provides the summary statistics of the numerical features on the training set. Vehicle characteristics (power, weight, and value) tend to be higher for men than for women, whereas other variables remain similar for each gender. Tables 2–3 display the conditional distributions of the categorical features given gender. Table 2 shows little differences in terms of vehicle use (with more professional users among men). Premium cars (like Mercedes, BMW, Audi, or Volvo) are more frequent for men. Considering Table 3, we see some differences between men and women with respect to gasoil and petrol as fuel oils, as well as for monthly payments. These summary statistics suggest some degree of association between available features and gender, producing the kind of indirect discrimination discussed in the preceding sections.
Summary statistics of the numerical features in $\mathcal{D}^{\texttt {training}}$
: power of the vehicle, weight of the vehicle, price of the vehicle, age of the vehicle, number of drivers mentioned in the contract, age of the main driver, and seniority of the contract
$\mathcal{D}^{\texttt {training}}$
: power of the vehicle, weight of the vehicle, price of the vehicle, age of the vehicle, number of drivers mentioned in the contract, age of the main driver, and seniority of the contract

Categorical features with associated levels and proportions according to gender on $\mathcal{D}^{\texttt {training}}$
: use of the vehicle, ADAS (Advanced Driver Assistance Systems) equipped vehicle, and make of the vehicle
$\mathcal{D}^{\texttt {training}}$
: use of the vehicle, ADAS (Advanced Driver Assistance Systems) equipped vehicle, and make of the vehicle

Categorical features with associated levels and proportions according to gender on $\mathcal{D}^{\texttt {training}}$
: parking in a garage, fuel of the vehicle, mileage limit specified in the policy, and premium payment
$\mathcal{D}^{\texttt {training}}$
: parking in a garage, fuel of the vehicle, mileage limit specified in the policy, and premium payment

4.2 Learning model
We assume that the observations $(Y_i,\boldsymbol{X}_i, D_i)$
are independent and identically distributed, sampled from the population of drivers in the portfolio. The expected number of claims is learned by assuming that, given
$(Y_i,\boldsymbol{X}_i, D_i)$
are independent and identically distributed, sampled from the population of drivers in the portfolio. The expected number of claims is learned by assuming that, given $\boldsymbol{X}_i=\boldsymbol{x}_i$
and
$\boldsymbol{X}_i=\boldsymbol{x}_i$
and $D_i= d_i$
,
$D_i= d_i$
, $Y_i$
is Poisson distributed with mean
$Y_i$
is Poisson distributed with mean $\mu (\boldsymbol{x}_i)$
, so that we adopt the Poisson deviance as loss function.
$\mu (\boldsymbol{x}_i)$
, so that we adopt the Poisson deviance as loss function.
The procedure can be described as follows. In accordance with Section 4.7 in Denuit et al. (Reference Denuit, Hainaut and Trufin2020), where a similar data set has been studied, we set $B$
to 1000 (this choice is supported by Figure 4.3 in that book) and check afterwards on the testing set that this value is large enough by considering predictive accuracy of the forest in function of the number of its constituent trees. Trees are grown on
$B$
to 1000 (this choice is supported by Figure 4.3 in that book) and check afterwards on the testing set that this value is large enough by considering predictive accuracy of the forest in function of the number of its constituent trees. Trees are grown on $\mathcal{D}^{\texttt {training}}$
, and
$\mathcal{D}^{\texttt {training}}$
, and $\mathcal{D}^{\texttt {testing}}$
is used to fine-tune hyperparameters of constrained random forests with different margins
$\mathcal{D}^{\texttt {testing}}$
is used to fine-tune hyperparameters of constrained random forests with different margins $m$
. Precisely, the hyperparameters are the maximum interaction depth (henceforth denoted as
$m$
. Precisely, the hyperparameters are the maximum interaction depth (henceforth denoted as $\texttt {id}$
) and the number of features randomly selected at each node (denoted as
$\texttt {id}$
) and the number of features randomly selected at each node (denoted as $k$
). We consider models
$k$
). We consider models $\mathcal{M}(m, \texttt {id}, k)$
or
$\mathcal{M}(m, \texttt {id}, k)$
or $\mathcal{M}(\varepsilon , \texttt {id}, k)$
with
$\mathcal{M}(\varepsilon , \texttt {id}, k)$
with
 \begin{eqnarray*} \texttt {id} &\in &\{1,2,3,4,5\}\\ k&\in &\{1,2,\ldots10\} \end{eqnarray*}
for increasing margins. Precisely, we consider regular random forests corresponding to $m=1$
. Then, we start from
$m=1$
. Then, we start from $m=0$
and gradually increase the margin as long as the null assumption
$m=0$
and gradually increase the margin as long as the null assumption $F_0=F_1$
is not rejected when tested on
$F_0=F_1$
is not rejected when tested on $\mathcal{D}^{\texttt {valid}}$
. To this end, we use the Kolmogorov–Smirnov distribution-free test for differences in two continuous distribution functions, implemented in the R function qKolSmirnLSA. All margins
$\mathcal{D}^{\texttt {valid}}$
. To this end, we use the Kolmogorov–Smirnov distribution-free test for differences in two continuous distribution functions, implemented in the R function qKolSmirnLSA. All margins $m$
for which the null is not rejected at confidence level of 95% are said to be tolerable in the remainder of the text.
$m$
for which the null is not rejected at confidence level of 95% are said to be tolerable in the remainder of the text.
For each tolerable relative margin $\varepsilon$
, best models are listed in Table 4 together with the null model (same prediction for every policy). Increasing the margin leads to lower out-of-sample (OOS) deviance on
$\varepsilon$
, best models are listed in Table 4 together with the null model (same prediction for every policy). Increasing the margin leads to lower out-of-sample (OOS) deviance on $\mathcal{D}^{\texttt {valid}}$
, as expected since the demographic parity constraint becomes less binding. Table 4 also displays the normalized deviance, defined as the difference between the OOS deviance and the OOS deviance of DPForest(
$\mathcal{D}^{\texttt {valid}}$
, as expected since the demographic parity constraint becomes less binding. Table 4 also displays the normalized deviance, defined as the difference between the OOS deviance and the OOS deviance of DPForest( $m=1$
) divided by the difference between the OOS deviance of the null model and the OOS deviance of DPForest(
$m=1$
) divided by the difference between the OOS deviance of the null model and the OOS deviance of DPForest( $m=1$
), so that the normalized deviance of the null model is
$m=1$
), so that the normalized deviance of the null model is $1$
and the one of DPForest(
$1$
and the one of DPForest( $m=1$
) is
$m=1$
) is $0$
. We can see from Table 4 that the values of the test statistic
$0$
. We can see from Table 4 that the values of the test statistic $J^*$
first lead to reject demographic parity up to
$J^*$
first lead to reject demographic parity up to $\varepsilon =0.03$
before falling below the critical level for
$\varepsilon =0.03$
before falling below the critical level for $\varepsilon =0.04$
and 0.05. This may seem surprising since decreasing
$\varepsilon =0.04$
and 0.05. This may seem surprising since decreasing $\varepsilon$
strengthens the demographic parity constraint, which should result in a smaller
$\varepsilon$
strengthens the demographic parity constraint, which should result in a smaller $J^*$
. However, this is not the case here because the optimal choices of id and k also vary with
$J^*$
. However, this is not the case here because the optimal choices of id and k also vary with $\varepsilon$
. The null assumption supporting demographic parity is not rejected for
$\varepsilon$
. The null assumption supporting demographic parity is not rejected for $\varepsilon =0.04$
and 0.05. The latter appears to be the largest tolerable relative margin, so we continue the analysis with a relative margin of 5%.
$\varepsilon =0.04$
and 0.05. The latter appears to be the largest tolerable relative margin, so we continue the analysis with a relative margin of 5%.
Best random forests and associated OOS deviances (OOS dev) computed on $\mathcal{D}^{\texttt {valid}}$
for different relative margins
$\mathcal{D}^{\texttt {valid}}$
for different relative margins $\epsilon$
together with the OOS deviance of the null model and the normalized deviances (norm. dev). The null hypothesis
$\epsilon$
together with the OOS deviance of the null model and the normalized deviances (norm. dev). The null hypothesis $H_0: F_0=F_1$
supporting demographic parity is rejected when
$H_0: F_0=F_1$
supporting demographic parity is rejected when $J^*\gt 1.358$

The evolution of in-sample and OOS deviances according to the number of trees in the random forest is visible in Figure 2. All deviances stabilize when forests include about 400 trees and almost flatten when more trees are added, so that the choice $B=1000$
appears to be large enough for the data set under consideration.
$B=1000$
appears to be large enough for the data set under consideration.
4.3 Impact of the demographic parity constraint
Figure 3 displays pairs of predicted claim frequencies for each individual for the largest tolerable relative margin $\varepsilon =5\%$
, along with those for the unconstrained model corresponding to
$\varepsilon =5\%$
, along with those for the unconstrained model corresponding to $m=1$
. We see there that the majority of pairs are located near the 45-degree line of equality. The constrained random forest creates two groups: the first one, with a majority of women, lies above the main diagonal and is therefore overpriced compared to the unconstrained random forest, while the second group, with a majority of men, lies below the main diagonal and is therefore underpriced.
$m=1$
. We see there that the majority of pairs are located near the 45-degree line of equality. The constrained random forest creates two groups: the first one, with a majority of women, lies above the main diagonal and is therefore overpriced compared to the unconstrained random forest, while the second group, with a majority of men, lies below the main diagonal and is therefore underpriced.
Feature importance is displayed in Figure 4 for both constrained and unconstrained random forests. The results are relatively similar between both models.
In-sample deviance (left panel) and out-of-sample deviance on $\mathcal{D}^{\texttt {testing}}$
(right panel) for each best model listed in Table 4.
$\mathcal{D}^{\texttt {testing}}$
(right panel) for each best model listed in Table 4.

Pairs of predictions for unconstrained random forest ( $m=1$
) and constrained random forest with the largest tolerable relative margin
$m=1$
) and constrained random forest with the largest tolerable relative margin $\varepsilon =5\%$
on
$\varepsilon =5\%$
on $\mathcal{D}^{\texttt {valid}}$
.
$\mathcal{D}^{\texttt {valid}}$
.

Feature importance for the unconstrained random forest (corresponding to $m=1$
) in the bottom panel and for the constrained random forest with the largest tolerable relative margin
$m=1$
) in the bottom panel and for the constrained random forest with the largest tolerable relative margin $\varepsilon =5\%$
in the top panel.
$\varepsilon =5\%$
in the top panel.

4.4 Comparison of DPForests with alternative methods
4.4.1 Discrimination-free insurance premiums
Often, insurance companies just remove the protected variable $D$
considered to be discriminatory from the pricing process. This means that the resulting premium is the conditional expectation
$D$
considered to be discriminatory from the pricing process. This means that the resulting premium is the conditional expectation $\mu (\boldsymbol{X})=\text{E}[Y|\boldsymbol{X}]$
. The latter is called the unawareness price. In our setting, the unawareness price writes
$\mu (\boldsymbol{X})=\text{E}[Y|\boldsymbol{X}]$
. The latter is called the unawareness price. In our setting, the unawareness price writes
 \begin{align*} \mu (\boldsymbol{X}) =\text{E}[Y|\boldsymbol{X}] = \text{E}[Y|\boldsymbol{X},D=0]\mathbb{P}[D=0| \boldsymbol{X}] + \text{E}[Y|\boldsymbol{X},D=1]\mathbb{P}[D=1| \boldsymbol{X}]. \end{align*}
Thus, $\mu (\boldsymbol{X})$
is a weighted average of the BEPs
$\mu (\boldsymbol{X})$
is a weighted average of the BEPs $\text{E}[Y|\boldsymbol{X},D=0]$
and
$\text{E}[Y|\boldsymbol{X},D=0]$
and $\text{E}[Y|\boldsymbol{X},D=1]$
, but the weights entering the calculation correlate with
$\text{E}[Y|\boldsymbol{X},D=1]$
, but the weights entering the calculation correlate with $\boldsymbol{X}$
, and thus possibly with the protected variable
$\boldsymbol{X}$
, and thus possibly with the protected variable $D$
.
$D$
.
The simple strategy leading to unawareness prices does not prevent indirect discrimination if there exists a dependence between $D$
and
$D$
and $\boldsymbol{X}$
, that is, if the distribution of
$\boldsymbol{X}$
, that is, if the distribution of $\boldsymbol{X}$
given
$\boldsymbol{X}$
given $D=0$
differs from the distribution of
$D=0$
differs from the distribution of $\boldsymbol{X}$
given
$\boldsymbol{X}$
given $D=1$
. This generally induces dependence between
$D=1$
. This generally induces dependence between $\mu (\boldsymbol{X})$
and
$\mu (\boldsymbol{X})$
and $D$
so that the protected variable implicitly enters the calculation of the unawareness price, resulting in indirect discrimination.
$D$
so that the protected variable implicitly enters the calculation of the unawareness price, resulting in indirect discrimination.
In order to remove indirect discrimination, Lindholm et al. (Reference Lindholm, Richman, Tsanakas and Wüthrich2022) suggested to derive the discrimination-free price from a weighted average using arbitrary weights $w_0$
and
$w_0$
and $w_1=1-w_0$
both in the interval
$w_1=1-w_0$
both in the interval $[0,1]$
. The discrimination-free price is thus given by
$[0,1]$
. The discrimination-free price is thus given by
 \begin{align*} \mu ^{*}(\boldsymbol{X}) = \text{E}[Y|\boldsymbol{X},D=0]w_0 + \text{E}[Y|\boldsymbol{X},D=1]w_1. \end{align*}
Lindholm et al. (Reference Lindholm, Richman, Tsanakas and Wüthrich2022) proved that the discrimination-free price is not unbiased in the sense that $\text{E}[\mu ^{*}(\boldsymbol{X})] \neq \text{E}[Y]$
in general. Equality only holds in the special case where
$\text{E}[\mu ^{*}(\boldsymbol{X})] \neq \text{E}[Y]$
in general. Equality only holds in the special case where $D$
and
$D$
and $\boldsymbol{X}$
are independent and the weights reflect the gender balance inside the portfolio, that is,
$\boldsymbol{X}$
are independent and the weights reflect the gender balance inside the portfolio, that is, $w_0=\mathbb{P}[D=0]$
.
$w_0=\mathbb{P}[D=0]$
.
4.4.2 Wasserstein barycenters
Charpentier et al. (Reference Charpentier, Hu and Ratz.2023) suggested to restore the equality in distribution of $\widehat {\mu }(\boldsymbol{X})$
given
$\widehat {\mu }(\boldsymbol{X})$
given $D=0$
and
$D=0$
and $D=1$
by using Wasserstein barycenters. Precisely, these authors define a discrimination-free predictor as
$D=1$
by using Wasserstein barycenters. Precisely, these authors define a discrimination-free predictor as
 \begin{align*} \widehat {\mu }_{w}(\boldsymbol{x}, D=0) &=\widehat {\mathbb{P}}[D=0] \widehat {\mu }(\boldsymbol{x}, D=0) + \widehat {\mathbb{P}}[D=1] \widehat {F}_{1}^{-1} \circ \widehat {F}_{0}(\widehat {\mu }(\boldsymbol{x}, D=0)) \\ \widehat {\mu }_{w}(\boldsymbol{x}, D=1) &=\widehat {\mathbb{P}}[D=0] \widehat {F}_{0}^{-1} \circ \widehat {F}_{1}(\widehat {\mu }(\boldsymbol{x}, D=1)) + \widehat {\mathbb{P}}[D=1] \widehat {\mu }(\boldsymbol{x}, D=1). \end{align*}
It corresponds to averaging the model’s predictions using the same quantile for both conditional distributions of the model given the value of the protected variable.
4.4.3 Comparison
Table 5 compares the performances of the different models on the validation set, while Figure 5 displays the corresponding predictions. Remember that the normalized deviance percentages are expressed with respect to the unconstrained random forest model ( $m=1$
). In terms of OOS deviance on
$m=1$
). In terms of OOS deviance on $\mathcal{D}^{\texttt {valid}}$
, we see in Table 5 that discrimination-free prices achieve the same OOS deviance as best estimates, despite their respective predictions differing (as will be seen below). Wasserstein barycenters correction and DPForest (0.05) exhibit higher OOS deviances as well as markedly different predictions. The 16.09% increase in OOS deviance appears to be the price to pay to achieve fairness in terms of demographic parity using constrained random forests. In terms of OOS deviance, DPForest is thus inferior to its competitors considered in this section. We nevertheless show next that the way predictions are modified may be preferable and that DPForest is the only approach fulfilling demographic parity with the data set under consideration.
$\mathcal{D}^{\texttt {valid}}$
, we see in Table 5 that discrimination-free prices achieve the same OOS deviance as best estimates, despite their respective predictions differing (as will be seen below). Wasserstein barycenters correction and DPForest (0.05) exhibit higher OOS deviances as well as markedly different predictions. The 16.09% increase in OOS deviance appears to be the price to pay to achieve fairness in terms of demographic parity using constrained random forests. In terms of OOS deviance, DPForest is thus inferior to its competitors considered in this section. We nevertheless show next that the way predictions are modified may be preferable and that DPForest is the only approach fulfilling demographic parity with the data set under consideration.
Best and constrained random forests and associated OOS deviances (OOS dev) on $\mathcal{D}^{\texttt {valid}}$
for the largest tolerable relative margins
$\mathcal{D}^{\texttt {valid}}$
for the largest tolerable relative margins $\epsilon =0.05$
together with the OOS deviance obtained with discrimination-free prices (DFP) and Wasserstein barycenters correction (WBC). The null hypothesis
$\epsilon =0.05$
together with the OOS deviance obtained with discrimination-free prices (DFP) and Wasserstein barycenters correction (WBC). The null hypothesis $H_0: F_0=F_1$
supporting demographic parity is rejected when
$H_0: F_0=F_1$
supporting demographic parity is rejected when $J^*\gt 1.358$

Pairs of predictions on $\mathcal{D}^{\texttt {valid}}$
for unconstrained random forest (
$\mathcal{D}^{\texttt {valid}}$
for unconstrained random forest ( $m=1$
) and those obtained with Wasserstein barycenters corrections in the left panel. Corresponding pairs with discrimination-free prices in the right panel.
$m=1$
) and those obtained with Wasserstein barycenters corrections in the left panel. Corresponding pairs with discrimination-free prices in the right panel.

The pairs of predictions between the unconstrained random forest and the Wasserstein barycenters correction are displayed in Figure 5. We observe that Wasserstein barycenters corrections overcharge (resp. undercharge) women (resp. men). Wasserstein barycenters corrections push predictions for men below the main diagonal and those for women above it. This is similar to DPForest(0.05) shown in Figure 3, except that this effect is more nuanced: the majority of women move in this way, but not all, and similarly for men.
Considering discrimination-free prices, we see that the predictions for women now tend to be located below the main diagonal.
The constrained random forest appears to be the only one respecting the demographic parity constraint on the data set under consideration. This is reflected in the empirical cumulative distribution functions of Figure 6. The reported Kolmogorov–Smirnov statistic $J^*$
decreases from 7.092 to 6.434 when moving from the unconstrained DPForest(
$J^*$
decreases from 7.092 to 6.434 when moving from the unconstrained DPForest( $m=1$
) to discrimination-free prices and to 2.210 when moving to the Wasserstein barycenters corrections. The minimum 1.063 is obtained with the constrained random forest DPForest(0.05). The latter is the only method for which demographic parity is not rejected.
$m=1$
) to discrimination-free prices and to 2.210 when moving to the Wasserstein barycenters corrections. The minimum 1.063 is obtained with the constrained random forest DPForest(0.05). The latter is the only method for which demographic parity is not rejected.
Empirical distribution functions $\widehat {F}_0$
and
$\widehat {F}_0$
and $\widehat {F}_1$
of
$\widehat {F}_1$
of $\widehat {\mu }(\boldsymbol{X})$
given
$\widehat {\mu }(\boldsymbol{X})$
given $D=0$
and
$D=0$
and $D=1$
, respectively, computed on
$D=1$
, respectively, computed on $\mathcal{D}^{\texttt {valid}}$
, for the unconstrained random forest (
$\mathcal{D}^{\texttt {valid}}$
, for the unconstrained random forest ( $m=1$
, left), the constrained random forest (
$m=1$
, left), the constrained random forest ( $\varepsilon =0.05$
, middle left), the Wasserstein barycenters corrections (middle right), and the discrimination-free price (right).
$\varepsilon =0.05$
, middle left), the Wasserstein barycenters corrections (middle right), and the discrimination-free price (right).

5. Discussion
The DPTree approach proposed in this paper has been implemented in Python. Note that the libraries Rpart and Scikit-learn, often used by actuaries to build unconstrained regression trees, make use of native C for speeding up the best split research. The extension to DPForest, including DPTrees, has been implemented in Python as well. We aim to make use of native C for DPTree and DPForest in order to speed up the current computation time. This is currently under development. To the best of our knowledge, this is the first attempt to correct discrimination within the regression trees framework. In the proposed examples, Poisson deviance is the objective function to be minimized, as is typically the case when modeling expected claim frequency in actuarial sciences. Extensions to other deviance functions are straightforward. The main advantage of the methodology developed in this paper is that the margin parameter allows the actuary to define the desired degree of fairness.
The approach proposed in this paper has been compared with the alternative methods developed in Lindholm et al. (Reference Lindholm, Richman, Tsanakas and Wüthrich2022) and Charpentier et al. (Reference Charpentier, Hu and Ratz.2023). In all cases, reestablishing fairness has a cost for some risk profiles, especially when considering a small margin constraint in DPForest, but also has an impact on the model performance. Insurance companies must thus determine the optimal trade-off between accuracy and fairness.
Adverse selection certainly remains an issue. See e.g Thomas (Reference Thomas2012) and Huang and Shimao (Reference Huang and Shimao2025). Any change in the composition of the portfolio may induce indirect discrimination because gender balance does no more hold within risk classes, producing correlation between $\widehat {\mu }(\boldsymbol{X})$
and
$\widehat {\mu }(\boldsymbol{X})$
and $D$
. Since premiums resulting from DPTree and DPForest will be attractive for some risk profiles and not for others, we may expect that the introduction of the demographic parity corrected premiums by a single insurer leads to a change in the composition of its portfolio. See also Côté et al. (Reference Côté, Côté and Charpentier2024b) for a discussion of portfolio compared to market. The same phenomenon is likely to occur if insurers resort to the DPForest approach but learned on the basis of different sets of features. Hence, it seems to be extremely difficult to reach truly discrimination-free insurance pricing.
$D$
. Since premiums resulting from DPTree and DPForest will be attractive for some risk profiles and not for others, we may expect that the introduction of the demographic parity corrected premiums by a single insurer leads to a change in the composition of its portfolio. See also Côté et al. (Reference Côté, Côté and Charpentier2024b) for a discussion of portfolio compared to market. The same phenomenon is likely to occur if insurers resort to the DPForest approach but learned on the basis of different sets of features. Hence, it seems to be extremely difficult to reach truly discrimination-free insurance pricing.
Among the strategies listed in Frees and Huang (Reference Frees and Huang2021), allowing insurers to use only a list of approved variables may be a good compromise, ensuring transparency and a reasonable degree of fairness. As documented in that paper, this is the strategy taken in the US individual health insurance market under the Affordable Care Act. Specifically, insurers may vary premium rates based on only four factors: (1) whether a plan covers an individual or family, (2) geographic area, (3) age, and (4) smoking status. If the regulator determines a limited number of rating factors and insurers use techniques as those derived in this paper or in Charpentier et al. (Reference Charpentier, Hu and Ratz.2023), then we may expect to protect consumers by ensuring high transparency and charge discrimination-free premiums.
Acknowledgements
The authors would like to express their gratitude to the anonymous referees and handling editor, whose comments have been extremely useful in revising a previous version of the present work.
Funding statement
This work was supported by P&V Assurances through the research chair “Telematics and Prevention.” The authors thank their colleagues from P&V Assurances, especially Nikias De Feyter and Carolina Aldana, for interesting discussions that greatly contributed to the success of this research project.
Data availability statement
The data are not publicly available due to privacy and commercial restrictions. The code will be available in the near future once it makes use of native C.
Competing interests
The authors have no competing interests to declare that are relevant to the content of this article.
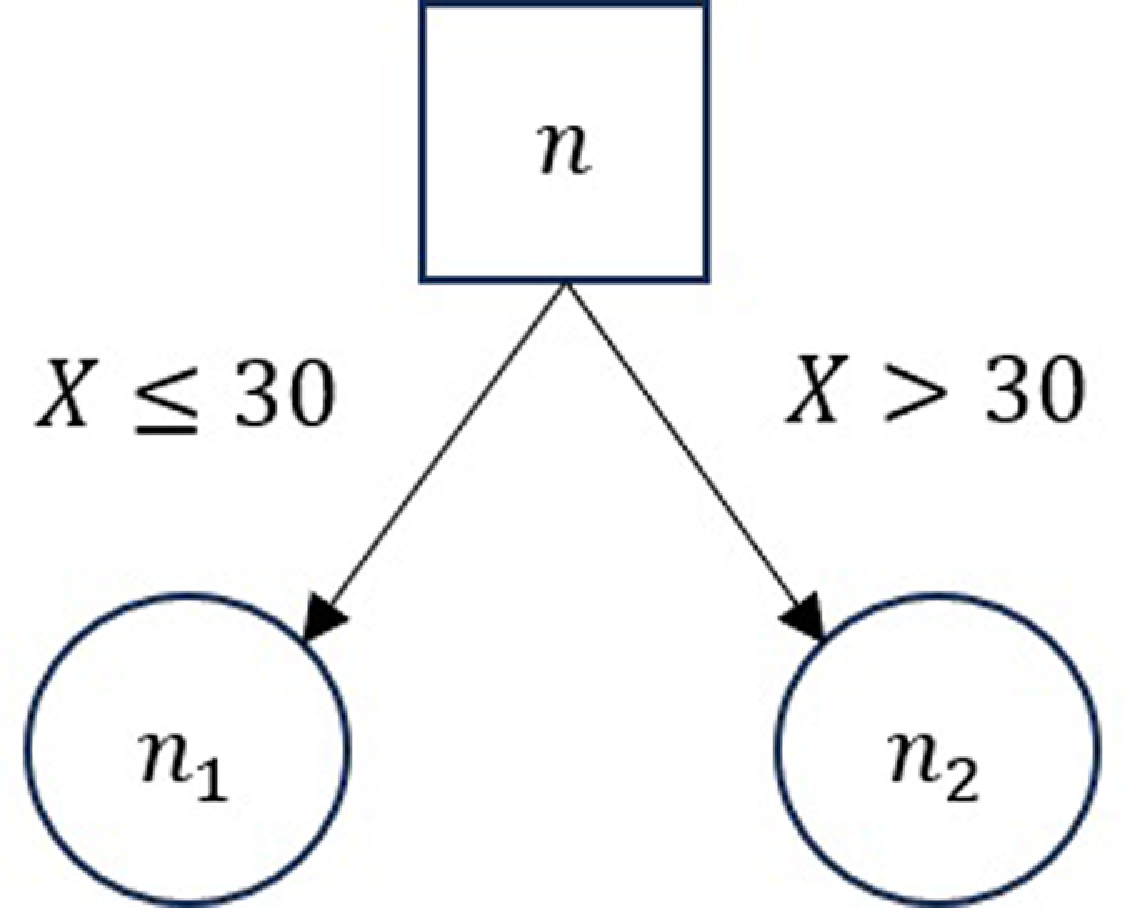
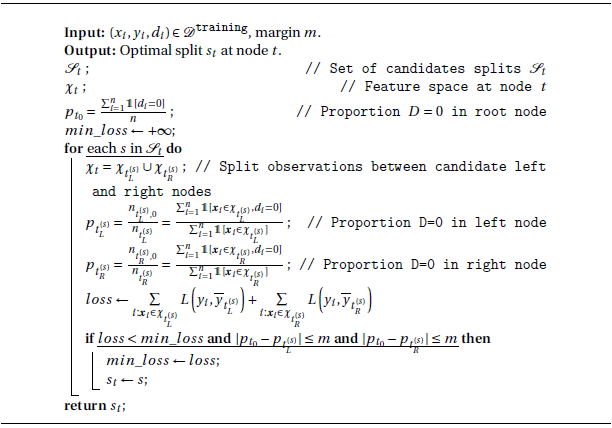
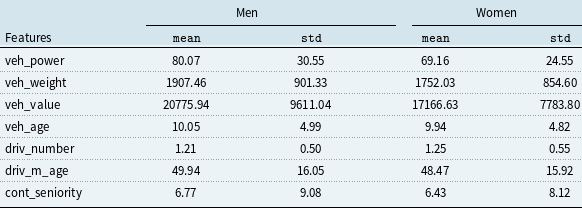

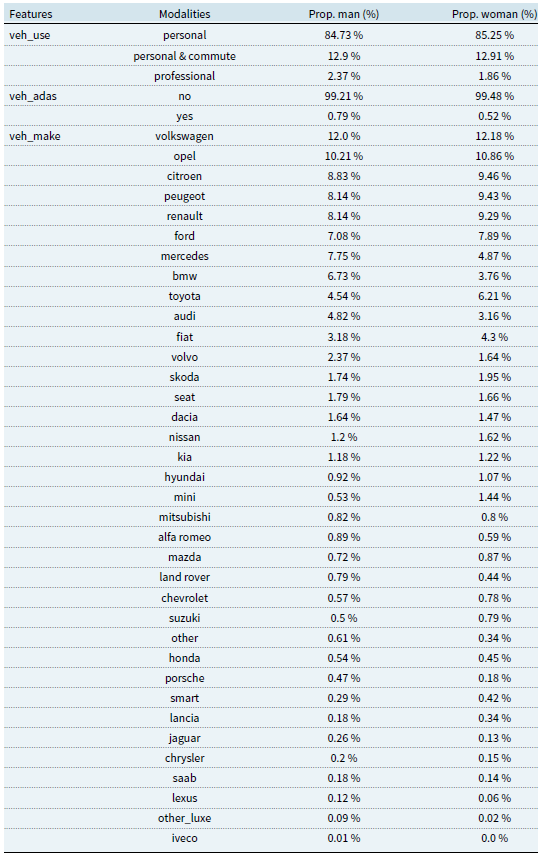

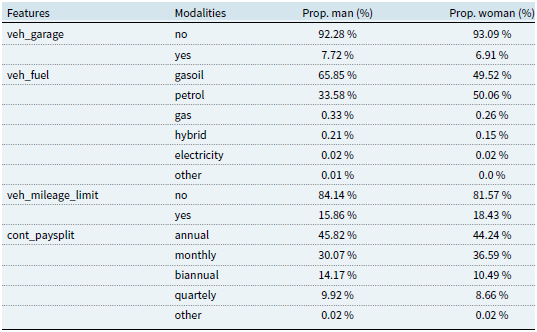

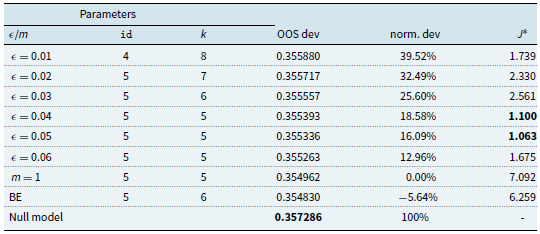


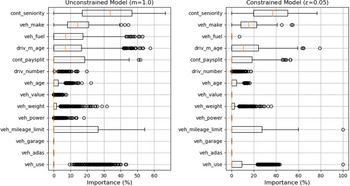


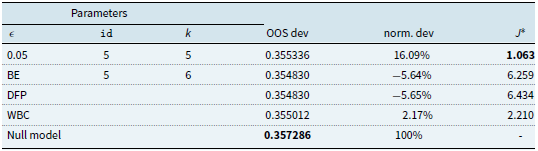


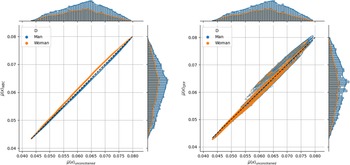


 Open access