


1. Introduction
Original equipment manufacturers for special machinery (OEMs) today face intense competitive pressure and shifting customer expectations, driving a shift from traditional product-centric models toward integrated smart services (servitization and digitalization) (Reference Reim, Parida and ÖrtqvistReim et al., 2015). Smart services are bundles of connected products and data-driven services that leverage embedded sensors, software, and analytics to deliver predictive maintenance, real-time optimization, and remote monitoring (Reference Filho, Loures, E. R. and CanciglieriMF Filho et al., 2017). In this paper, we define smart services from the OEM perspective as technically engineered systems that couple cyber-physical assets with continuous data flows, enabling the systematic development, deployment, and evolution of new value-added services through a structured technical process (Reference Beverungen, Müller, Matzner, Mendling and vom BrockeBeverungen et al., 2019).
Smart services offer OEMs a compelling economic proposition: they unlock new business models that generate recurring revenue streams with margins up to four times higher than one-off equipment sales, reduce revenue volatility, and foster stronger customer loyalty through differentiated offerings (Reference MarquardtMarquardt & others, 2017; Reference Soellner, Helm, Klee and EndresSoellner et al., 2024; Reference VescoVesco, 2024). Despite this promise, overall smart service adoption remains limited (Reference Pezzotta, Arioli, Adrodegari, Rapaccini, Saccani, Rakic, Marjanovic, West, Stoll and WiesnerPezzotta et al., 2023; Smart Service Welt Working Group & acatech, 2015). To achieve a higher adoption and realize the economic potential of smart services, the robustness of the underlying technical development process is critical.
While existing literature has extensively examined business, organizational, and strategic barriers to smart service adoption, there is little systematic analysis of the technical barriers that OEMs face when engineering these systems. At the same time, the rapid emergence of generative artificial intelligence (GenAI) – including Large Language Models (LLMs) retrieval-augmented generation (RAG), code-generation agents and industrial knowledge graphs – presents new options for addressing such barriers, but their concrete impact on smart-service engineering remains unclear and requires a focused evaluation (Reference RaneRane, 2023).
The contributions of this paper are threefold: First, barriers for technical development of smart services are identified and categorized through a systematic literature review. Second, the barriers are mapped onto a smart service architecture and relevant roles in the development process, to visualize their impact. Third, we link the identified barrier categories to concrete GenAI building blocks (e.g., LLMs, RAG, code-generation agents, industrial knowledge graphs) and outline a research agenda for integrating these technologies into smart service development.
Our results indicate that: (i) many barriers cluster around data management, semantics and integration, and (ii) these barriers disproportionately affect the role of the Data Engineer. We also identified that (iii) modular and contextual knowledge graphs enabled by GenAI technologies appear promising in resolving these barriers.
2. Methodology
For the methodology of this paper, we adopt the guidelines for preforming systematic literature reviews according to Kitchenham et al. (Reference Kitchenham and ChartersKitchenham et al., 2007). The identification of the need for a review was achieved in Section 1. The research questions will be specified in Section 2.1, the review protocol will be developed in Section 2.2, the relevant research will be identified and selected in Section 2.3 and reported according to the PRISMA guidelines (Reference Page, McKenzie, Bossuyt, Boutron, Hoffmann, Mulrow, Shamseer, Tetzlaff, Akl and BrennanPage et al., 2021) at the end of the same Section. Finally, the data will be extracted and synthesized with respect to the research questions in Section 3. In addition, Section 4 links the synthesized barrier categories to specific GenAI building blocks and discusses implications of integrating these technologies into the development process of smart services.
2.1. Research questions
While smart services have a tremendous potential for OEMs, adoption remains low (see Section 1). As a result, it is important to understand what technical barriers prevent smart service adoption. In addition, the current research of data-driven methods is dominated by GenAI technologies, therefore their effect on the barriers is also highly relevant. The research questions are therefore defined as follows:
-
1. What are barriers for smart service adoption of industrial companies, especially OEMs, concerning technical development?
-
2. How do the technical barriers to smart service adoption affect smart service subsystems and different roles in the development process?
-
3. Which GenAI building blocks are most promising to mitigate the identified technical barriers along the smart service architecture and across roles?
2.2. Research design
We choose Scopus as our primary database, since it offers extensive coverage of engineering, computer science, and management literature, indexes both peer-reviewed journals and leading conference proceedings and provides reliable metadata and export tools for reproducibility.
The search string was constructed by enforcing the inclusion of a keyword about the topic, the domain and the specific focus of this review. In addition, only literature from the last 10 years was considered to ensure that barriers still have relevance. We used the TITLE-ABS-KEY function in Scopus, that checks whether the contained keywords are present in the title, abstract or keywords. The search string was built as follows:
-
• Topic: TITLE-ABS-KEY(“smart service*” OR “product-service system*”)
-
• Domain: TITLE-ABS-KEY(“manufactur*” OR “assembly” OR “production” OR “engineering” OR “industr*” OR “machinery” OR “factory”)
-
• Focus: TITLE-ABS-KEY(“barrier*” OR “challenge*” OR “obstacle*” OR “limitation*” OR “hurdle*” OR “obstacle*” OR “survey” OR “review”)
We included only peer-reviewed journals and conference publications that focus on smart service development in the engineering and OEM context, specifically targeting the industrial production of complex machinery. To ensure relevance to our technical development perspective, we required that each study examine barriers of a technical nature, meaning issues that arise during the design, implementation, or integration of smart service capabilities, rather than barriers encountered by end-users or customers. We further restricted our sample to research articles that provide original empirical evidence from industry settings, such as surveys of engineering teams, case studies of pilot projects, field experiments, or action-research interventions. Studies that did not focus on the company’s engineering and production processes or that lacked firsthand evidence on technical barriers were excluded.
2.3. Identification and selection of research
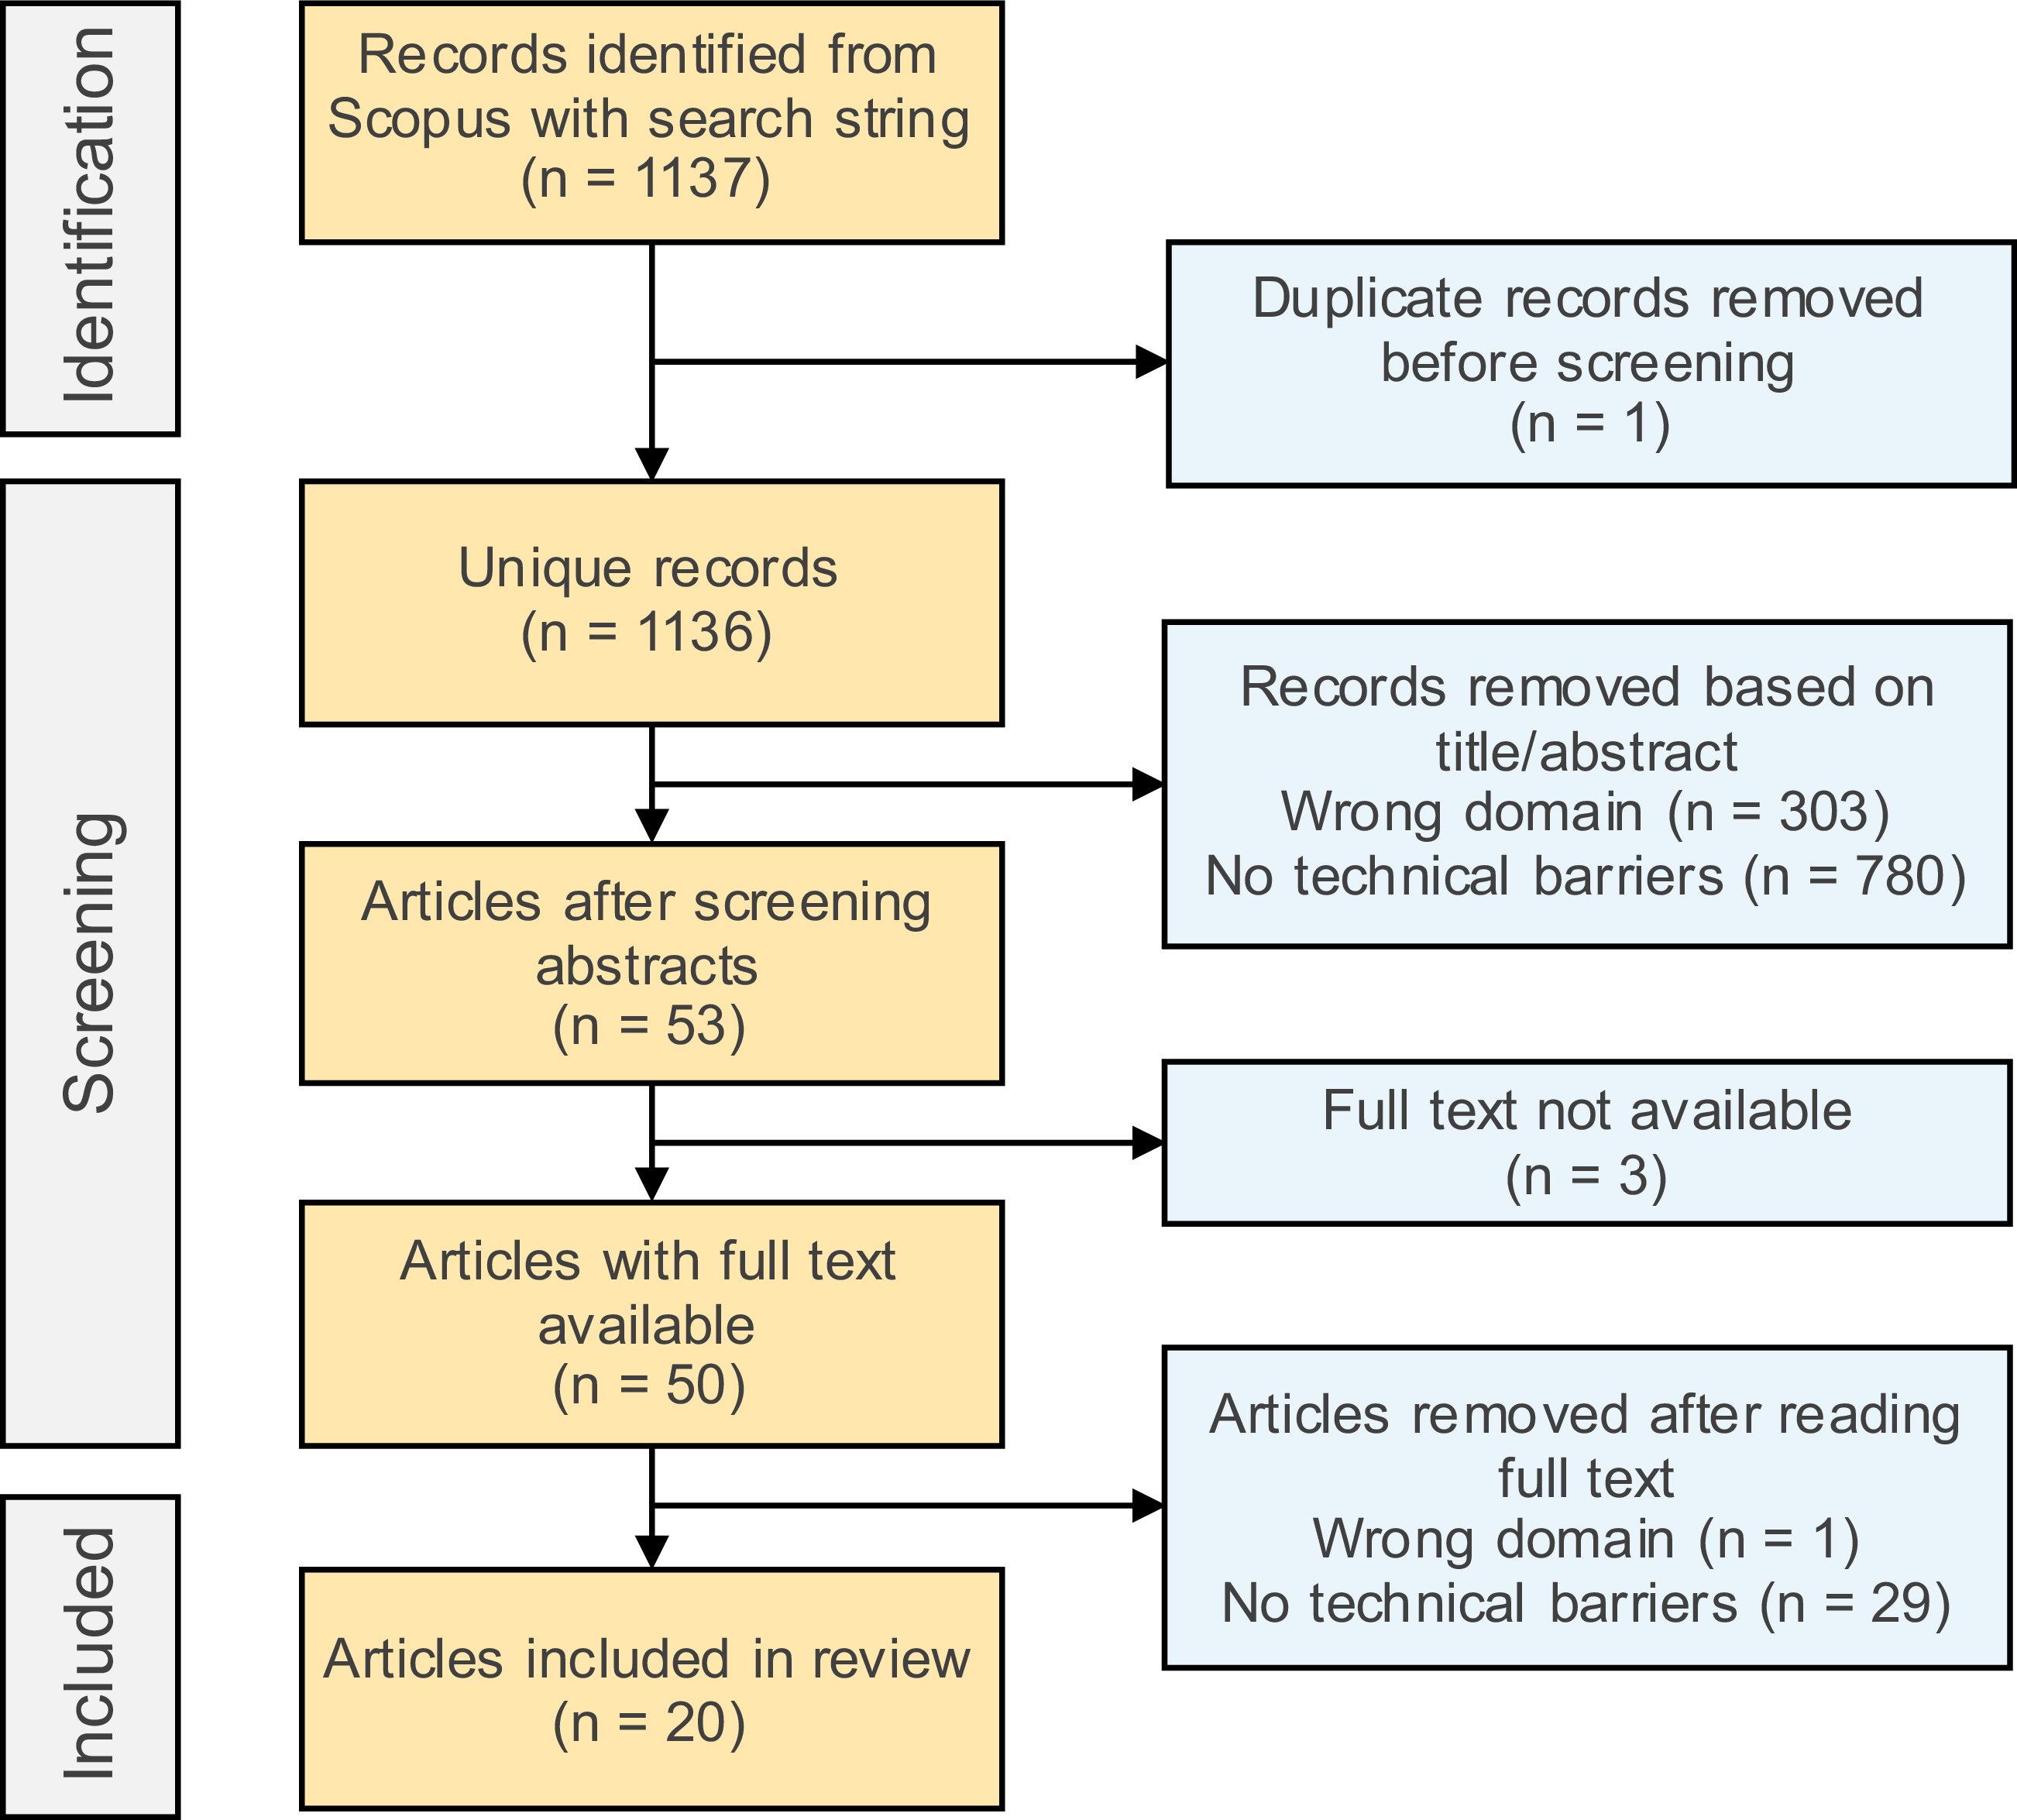
1136 unique records were identified with the specified search string between the years of 2015 to 2025 (as of the 7th of July 2025). 1083 records were removed after screening the title and abstract. 303 of those were removed since they conducted research in a non-industrial domain or it was a domain-agnostic paper, 780 were removed since they did not contain original evidence from industry about barriers regarding the technical development of smart services. Most of the excluded papers either contained no original evidence from industry or presented a new method or approach, not focusing on the barriers themselves. The 53 articles that remained were checked for full-text availability, three full texts were not available to the authors. Finally, after the available full texts were assessed, a further 30 articles were excluded, since reading the full text revealed that they were too broad or did not contain information about technical barriers, contrary to what could have been assumed from reading the abstracts. Figure 1 offers an overview of the process of selecting the relevant literature.
PRISMA-style flow chart of article identification and screening, based on (Reference Page, McKenzie, Bossuyt, Boutron, Hoffmann, Mulrow, Shamseer, Tetzlaff, Akl and BrennanPage et al., 2021)

2.4. Data extraction, coding and GenAI mapping
For each included study, we extracted all statements that explicitly describe obstacles, limitations, or challenges encountered during the technical development of smart services. Based on this, the synthesis of barriers followed a structured qualitative coding process:
-
1. Barrier statements were extracted verbatim from each included study.
-
2. Similar formulations were normalized to common labels.
-
3. Labels were iteratively grouped into higher-level categories.
-
4. Category definitions were revised until internal coherence and cross-paper applicability were achieved.
To address RQ3, we used a targeted scoping linkage rather than a second full systematic review. We linked barrier categories to representative GenAI building blocks through barrier-specific searches and by selecting peer-reviewed approaches that (i) describe an implementable technical mechanism relevant to industrial data/software engineering and (ii) plausibly mitigate the respective barrier category. It should be noted that the resulting mapping is illustrative rather than exhaustive, which is sufficient for the purposes of this paper because it supports our goal of deriving plausible mitigation directions and a prioritized evaluation agenda, not of cataloguing all GenAI methods.
3. Findings
This section will present the data extraction and synthesis into a structured format. First, the extracted barriers will be coded and divided into categories to answer the first research questions in Section 3.1. Second, the barrier categories will be analyzed in terms of their effect on smart service systems and roles to answer the second research question in Section 3.2.
3.1. Extracted barriers
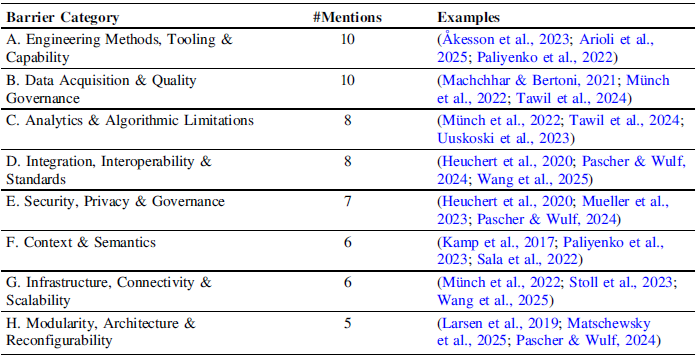
The literature was processed as described in Section 2.4, with the final categories presented in Table 1. In the following, all barrier categories will be explained in detail.
Identified barrier categories, number of mentions in relevant literature and examples

A. Engineering Methods, Tooling & Capability: This category refers to the availability and maturity of methods, SDKs, simulation or digital twin support, and developer skills required to engineer smart services (Reference Arioli, Pezzotta, Romero, Adrodegari, Sala, Rapaccini, Saccani, Marjanovic, Rakic and WestArioli et al., 2025). Gaps in design tooling, process guidance, and hands-on competence translate into slow, error-prone implementation (Reference Åkesson, Sundström, Johansson and ChirumallaÅkesson et al., 2023). The absence of fit-for-purpose tools and practices inhibits systematic, repeatable development (Reference Paliyenko, Tüzün, Roth and KreimeyerPaliyenko et al., 2022).
B. Data Acquisition & Quality Governance: This category concerns what to measure, how to sample, and how to ensure completeness, reliability, and usability of data from heterogeneous sources (Reference Münch, Marx, Benz, Hartmann and MatznerMünch et al., 2022; Reference Tawil, Mohamed, Schmoor, Vlachos and HaidarTawil et al., 2024). Typical issues include sensor selection, sampling rates, missing or noisy data or unstructured records (Reference Machchhar and BertoniMachchhar & Bertoni, 2021). Poor quality governance degrades downstream analytics and increases rework in pipelines.
C. Analytics & Algorithmic Limitations: This category includes shortcomings in modeling, explainability, robustness, and performance of algorithms deployed on industrial data (Reference Münch, Marx, Benz, Hartmann and MatznerMünch et al., 2022; Reference Tawil, Mohamed, Schmoor, Vlachos and HaidarTawil et al., 2024). Challenges arise from multi-modal signals, domain shift, and difficulties in translating model outputs into actionable insights. Insufficient accuracy or transparency undermines trust and delays deployment (Reference Uuskoski, Mittal, Menon and KärkkäinenUuskoski et al., 2023).
D. Integration, Interoperability & Standards: This category covers incompatibilities in data models, interfaces, and protocols as well as the difficulty of integrating legacy systems and vendor-specific platforms (Reference Pascher and WulfPascher & Wulf, 2024). The lack of common standards and robust APIs impedes cross-system data exchange and reuse (Reference Heuchert, Verhoeven, Cordes and BeckerHeuchert et al., 2020). Consequences include duplicated integration logic, fragile adapters, and limited scalability of solutions (Reference Wang, Ming, Gao and ZhangWang et al., 2025).
E. Security, Privacy & Governance: This category encompasses data protection, access control, regulatory compliance, and questions of data ownership and sharing (Reference Mueller, Stegelmeyer and MishraMueller et al., 2023; Reference Pascher and WulfPascher & Wulf, 2024). OEMs must reconcile technical integration with legal and contractual constraints. Weak controls or unclear ownership structures block data flows and restrict the design space of services (Reference Heuchert, Verhoeven, Cordes and BeckerHeuchert et al., 2020).
F. Context & Semantics: This category captures the absence of machine-interpretable context, such as missing ontologies, unified namespaces, provenance, and domain semantics (Reference Paliyenko, Lukjanenko, Tüzün, Roth and KreimeyerPaliyenko et al., 2023; Reference Sala, Pirola, Pezzotta and CavalieriSala et al., 2022). Without explicit semantics, data remain difficult to interpret, integrate, and trace across lifecycle stages (Reference Kamp, Ochoa and DiazKamp et al., 2017). The result is brittle analytics and duplicated modeling effort, especially when transferring insights across products and variants.
G. Infrastructure, Connectivity & Scalability: This category addresses runtime constraints such as network latency, bandwidth, real-time processing, storage/compute scaling, and cost-efficient operations (Reference Münch, Marx, Benz, Hartmann and MatznerMünch et al., 2022; Reference Wang, Ming, Gao and ZhangWang et al., 2025). Bottlenecks emerge from distributed assets, edge–cloud coordination, and uneven connectivity (Reference Stoll, West, Pirola and SalaStoll et al., 2023). These constraints limit the feasibility of time-critical services and increase total cost of ownership.
H. Modularity, Architecture & Reconfigurability: This category covers the architectural ability to compose, reuse, and evolve service modules across product variants and lifecycles (Reference Matschewsky, Kambanou and SakaoMatschewsky et al., 2025; Reference Pascher and WulfPascher & Wulf, 2024). Lack of modularization and variant management complicates maintenance and inflates engineering effort (Reference Larsen, Andersen, Nielsen and BrunøLarsen et al., 2019). Reconfigurability deficits hinder rapid adaptation to changing requirements and operating contexts.
There was no discernible trend in how the number of mentions of each barrier evolved over the last 10 years, which may also be due to the low sample size of 20 research articles and 60 total barrier mentions.
An illustrative example for the stated barriers would be smart services based on remote troubleshooting of faults (Reference Klein, Malburg and BergmannKlein et al., 2025; Reference Sala, Pirola, Pezzotta and CavalieriSala et al., 2024). An OEM might want to offer remote troubleshooting for special machinery using sensor data along with PLC/event logs, which needs to be analyzed in the context of maintenance tickets, manuals, configurations and similar documentation. In practice, engineers might face incomplete or noisy signals (barrier B), inconsistent naming and missing/non-traceable semantic context (barrier F), and substantial integration effort across systems and vendor interfaces (barrier D). Limited connectivity at customer sites and edge-cloud constraints further restrict the analysis (barrier B and G), which might be related to concerns regarding data security (barrier E). If the special machinery is able to be configured with different parts and functionalities, the services would also need to be designed in a modular fashion (barrier H) (Reference Klein, Malburg and BergmannKlein et al., 2025; Reference Sala, Pirola, Pezzotta and CavalieriSala et al., 2024). These issues slow or even prevent development of the services.
3.2. Mapping of barriers to architecture and stakeholders
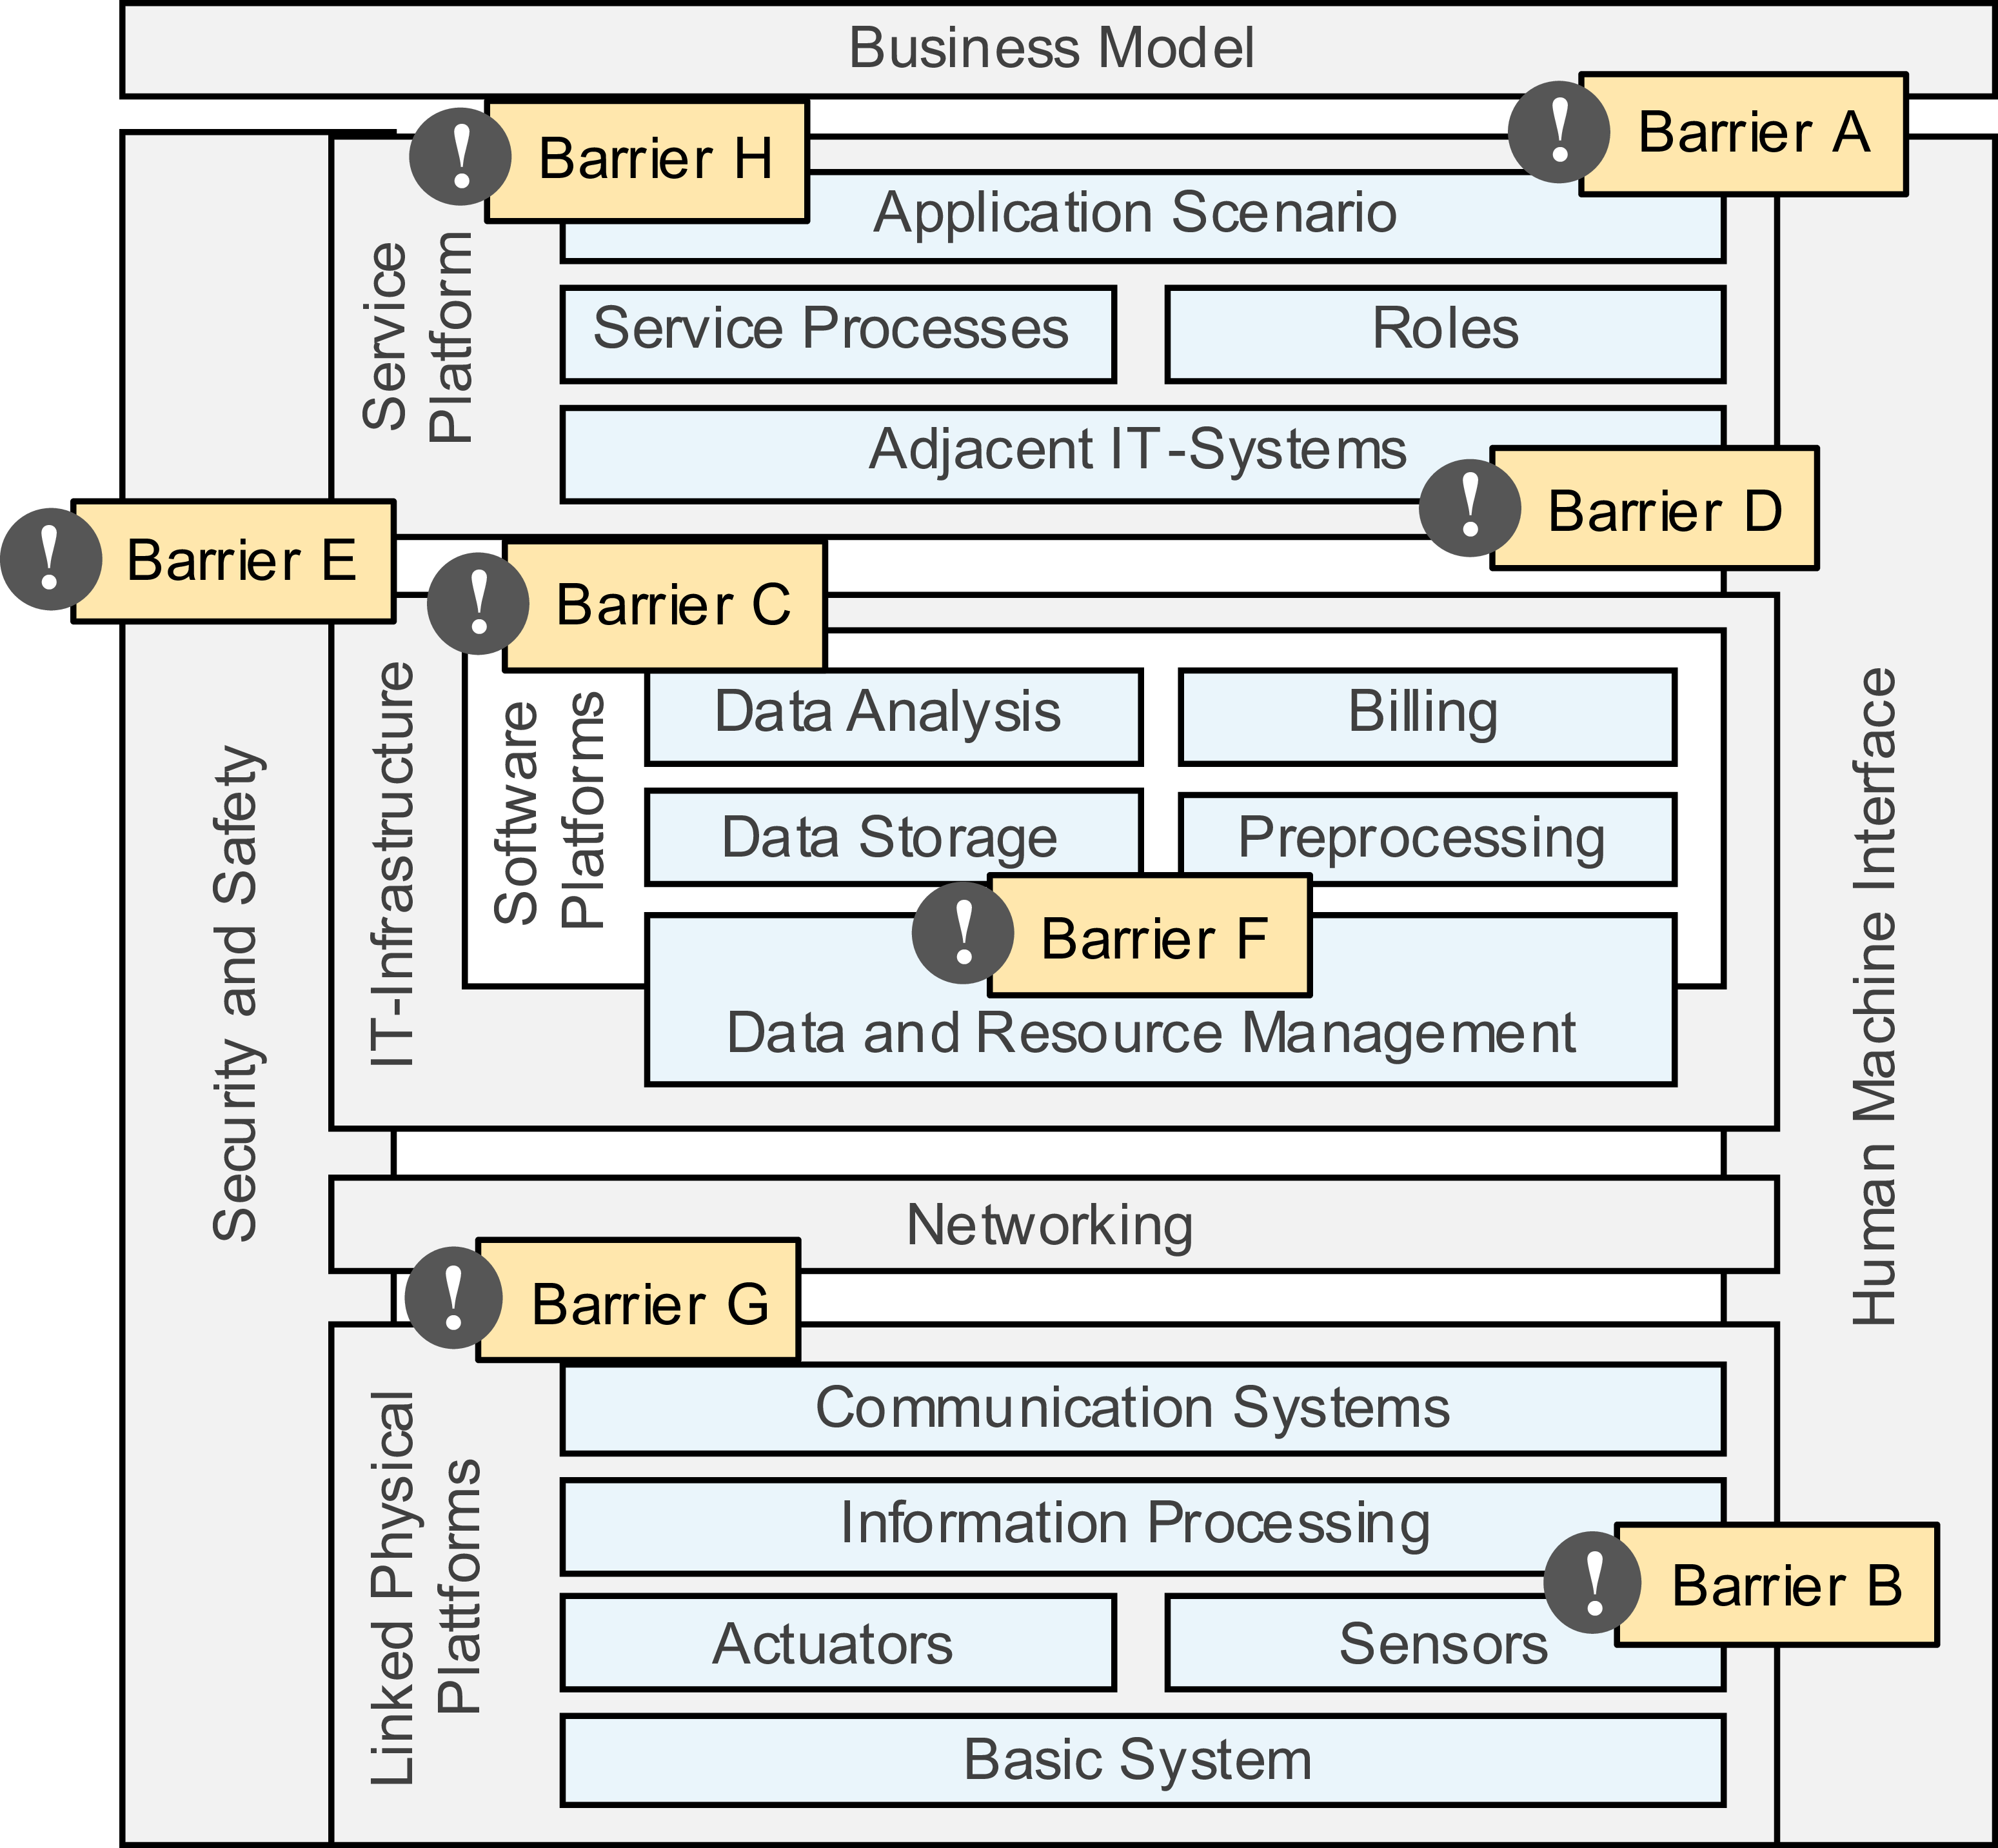
The second research question addresses the question of which systems, and which roles are affected by the identified barriers. Answering this question helps to pinpoint heavily affected systems and roles, narrows down the solution space and helps to map out migrations. For the purpose of this paper, we use the smart service reference architecture of Reference Wegel, Sahrhage, Rabe and DumitrescuWegel et al. (2021), since it includes technical elements as well as a high level of detail for systems involved in the technical development process. Figure 2 offers an overview of a smart service reference architecture with annotations based on which elements are affected by the identified barriers.
Wegel et al.’s reference architecture extends the acatech layer model into a data-flow-oriented stack from Linked Physical Platforms (sensors, actuators, on-device processing) via Networking and IT-Infrastructure/Software Platforms up to the Service Platform and Business Model, with Security and Safety and Human–Machine Interface as cross-cutting concerns (Reference Wegel, Sahrhage, Rabe and DumitrescuWegel et al., 2021). Our mapping shows that barriers are concentrated in the middle and top of the stack: data acquisition and quality issues (barrier B) appear mainly at the physical layer, but most barriers relate to data and resource management, analytics, and integration (barriers C, D, F, G) in the Networking, IT-Infrastructure and Software Platform layers, where heterogeneous data must be stored, enriched with context and semantics, and transformed into explainable insights (Reference Kamp, Ochoa and DiazKamp et al., 2017; Reference Tawil, Mohamed, Schmoor, Vlachos and HaidarTawil et al., 2024; Reference Wang, Ming, Gao and ZhangWang et al., 2025). Near the top of the stack, barriers around governance, modularity and architecture design (barriers A, E, H) constrain how service processes, roles and adjacent IT systems (e.g. ERP) can exploit these data services (Reference Åkesson, Sundström, Johansson and ChirumallaÅkesson et al., 2023; Reference Matschewsky, Kambanou and SakaoMatschewsky et al., 2025; Reference Pascher and WulfPascher & Wulf, 2024). This yields two key insights: (1) resolving mid-stack barriers around data management, semantics and integration is likely to have the largest leverage on smart-service development, and (2) governance- and architecture-related barriers propagate vertically across all layers, so they cannot be solved locally within individual components of the stack.
Identified barriers in relation to the smart service reference architecture based on Wegel et al. (Reference Wegel, Sahrhage, Rabe and DumitrescuWegel et al., 2021) extended with identified barriers

Figure 2 Long description
A diagram of the barriers in relation to the smart service reference architecture. The diagram is structured into several horizontal layers representing different components and processes. The layers include Business Model, Service Platform, Software Platforms, Networking, and Linked Physical Platforms. Each layer contains specific elements such as Application Scenario, Service Processes, Roles, Adjacent IT-Systems, Data Analysis, Billing, Data Storage, Preprocessing, Data and Resource Management, Communication Systems, Information Processing, Actuators, Sensors, and Basic System. Various barriers labeled as Barrier A, Barrier B, Barrier C, Barrier D, Barrier E, Barrier F, Barrier G, and Barrier H are placed within these layers, indicating points of potential challenges or obstacles. The barriers are connected to specific elements within the layers, suggesting their impact on those elements. The overall structure of the diagram shows the flow and interaction between different components and processes within the smart service reference architecture, highlighting areas where barriers may affect the system.
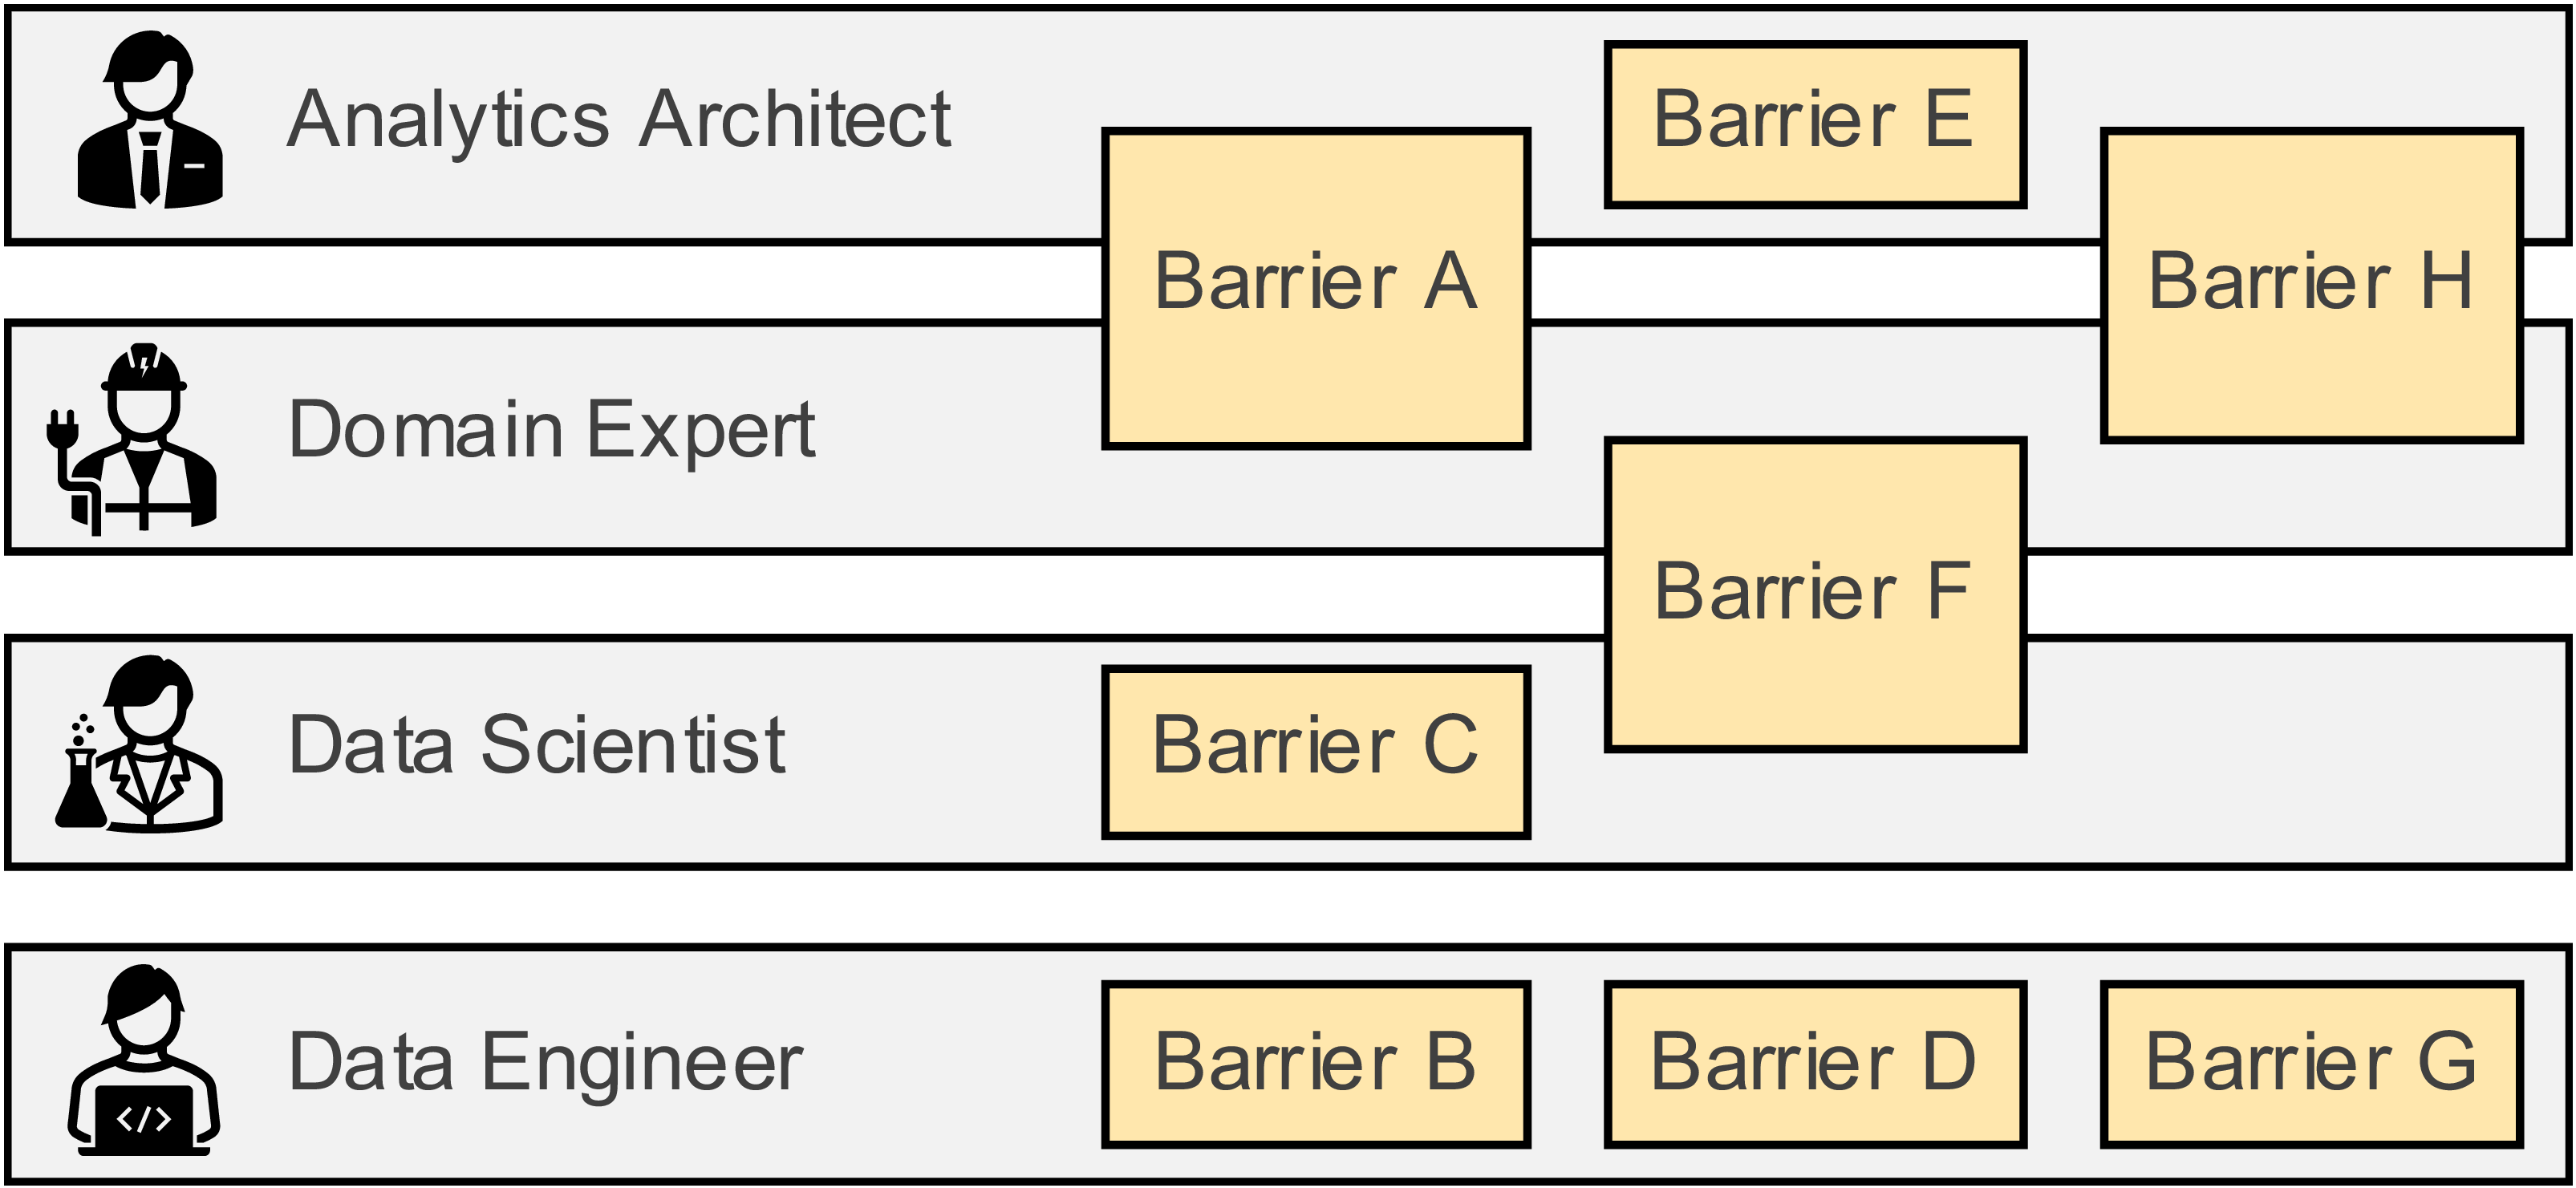
Shifting focus from systems to development teams, Figure 3 shows which roles from a typical analytics department (role definitions adapted from (Reference Kühn, Joppen, Reinhart, Röltgen, Enzberg and DumitrescuKühn et al., 2018)) are affected by which barriers. If barriers are drawn between roles, it indicates that both roles are (partially) affected.
Mapping of roles of an analytics department to barrier categories

All four core roles in analytics-driven smart service development are affected by the identified barrier categories. Data Engineers are mainly associated with Data Acquisition & Quality Governance (B), Integration, Interoperability & Standards (D), and Infrastructure, Connectivity & Scalability (G), reflecting their responsibility for deciding what to measure, connecting heterogeneous systems, and operating scalable data pipelines (Reference Kamp, Ochoa and DiazKamp et al., 2017; Reference Münch, Marx, Benz, Hartmann and MatznerMünch et al., 2022). Data Scientists are primarily exposed to Analytics & Algorithmic Limitations (C) and Context & Semantics (F), since they must build models on top of imperfect data and often lack a consistent semantic representation of machine states and events (Reference Kamp, Ochoa and DiazKamp et al., 2017; Reference Wang, Ming, Gao and ZhangWang et al., 2025). Domain Experts face Engineering Methods, Tooling & Capability (A), Context & Semantics (F), and Modularity & Reconfigurability (H), as they contribute operational knowledge, define service variants, and validate whether technical solutions match real-world needs (Reference Larsen, Andersen, Nielsen and BrunøLarsen et al., 2019; Reference Matschewsky, Kambanou and SakaoMatschewsky et al., 2025). The Analytics Architect spans Engineering Methods & Tooling (A), Security, Privacy & Governance (E), and Modularity & Reconfigurability (H), setting standards and guardrails across projects.
Two insights emerge from this mapping. (1) all roles are systematically affected; technical barriers are not confined to “data people” but shape work across engineering, data science, and domain expertise. (2) data-engineering-related work is most affected: in our mapping, the Data Engineer role is linked to three barrier categories at full strength, roughly twice as many assignments as any other role. This suggests that many technical barriers manifest first as data-engineering challenges, making this role a critical leverage point for mitigation.
4. Discussion
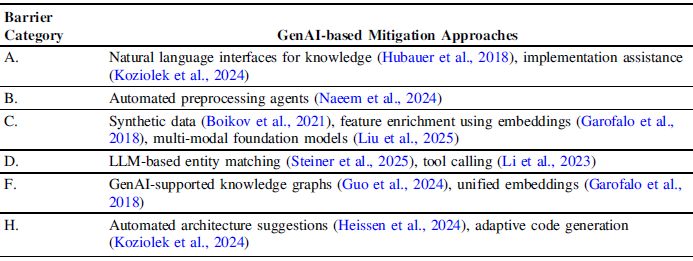
Section 3 showed that technical barriers to smart services are pervasive across the architecture and roles, with a particular concentration in mid to top area of the stack with data management, semantics and integration, and a heavy burden on data-engineering work. RQ3 therefore asks which GenAI building blocks are most promising to mitigate these barriers. Table 2 summarizes representative approaches per barrier category.
Exemplary GenAI-based approaches for mitigating technical barriers for selected categories

A first cluster of approaches targets data and semantics–related barriers (B, D, F). Ontology-based databases and knowledge graphs have been proposed to structure heterogeneous lifecycle data (Reference Hubauer, Lamparter, Haase and HerzigHubauer et al., 2018). Typical sources include time-series sensor data, PLC/event logs, maintenance tickets, FMEAs and BOM/CAD exports, which are mapped into a common ontology describing machines, components, failure modes and operation conditions (Reference Hubauer, Lamparter, Haase and HerzigHubauer et al., 2018). Combining these heterogeneous data sources often involves manual modelling and population and limited their adoption (Reference Guo, Li, Yan, Lu and ShenGuo et al., 2024). GenAI can partially alleviate this by using LLM-based entity matching and document understanding to populate and maintain knowledge graphs, and by linking heterogeneous sources via unified embeddings (Reference Garofalo, Pellegrino, Altabba and CochezGarofalo et al., 2018; Reference Guo, Li, Yan, Lu and ShenGuo et al., 2024; Reference Liao, Chen, Wang, Liu, Wang and ChengLiao et al., 2025; Reference Steiner, Peeters and BizerSteiner et al., 2025). In practice, this can be implemented as a combination of a structured knowledge graph and an embedding index: LLM-based extractors add entities and relations to the graph, while embeddings support similarity search over documents and machine states. Natural-language interfaces on top of these graphs reduce the technical know-how needed to access context information (Reference Hubauer, Lamparter, Haase and HerzigHubauer et al., 2018; Reference Li, Zhao, Yu, Song, Li, Yu, Li, Huang and LiLi et al., 2023), which directly addresses the semantic bottlenecks observed in Section 3.
A second cluster addresses engineering methods, tooling and architecture (A, H, partly E). LLM-based assistants can support requirements refinement and implementation tasks (Reference Hubauer, Lamparter, Haase and HerzigHubauer et al., 2018; Reference Koziolek, Grüner, Hark, Ashiwal, Linsbauer and EskandaniKoziolek et al., 2024), while architecture-suggestion systems and adaptive code-generation agents help to maintain modular architecture models and generate standardized integration and optimization code (Reference Heissen, Hanke, Mpidi Bita, Hovemann and DumitrescuHeissen et al., 2024; Reference Koziolek, Grüner, Hark, Ashiwal, Linsbauer and EskandaniKoziolek et al., 2024; Reference Li, Zhao, Yu, Song, Li, Yu, Li, Huang and LiLi et al., 2023). Combined with tool-calling agents that interact with version control, CI/CD pipelines and external APIs, these techniques have the potential to reduce the coordination overhead identified for Analytics Architects and Domain Experts.
A third cluster targets analytics and runtime constraints (C, G). Synthetic data generation, feature enrichment with contextual embeddings and pre-trained multi-modal foundation models promise improved accuracy and robustness under diverse operating conditions (Reference Boikov, Payor, Savelev and KolesnikovBoikov et al., 2021; Reference Garofalo, Pellegrino, Altabba and CochezGarofalo et al., 2018; Reference Liu, Xu, Miao, Yang, Zhang, Long, Li and ZhaoLiu et al., 2025). Concretely, generative models such as variational autoencoders or diffusion models can be used to augment rare fault patterns, while time-series transformers and multi-modal encoders combine sensor trajectories with symbolic context from the knowledge graph (Reference Fan, Zhang and GaoFan et al., 2020; Reference Klein, Malburg and BergmannKlein et al., 2025; Reference Liu, Xu, Miao, Yang, Zhang, Long, Li and ZhaoLiu et al., 2025). Agent-based preprocessing pipelines can continuously clean and transform incoming data streams, mitigating some of the scalability and data-quality problems faced by Data Engineers (Reference Naeem, Ahmad, Eltabakh, Ouzzani and TangNaeem et al., 2024).
However, employing GenAI also introduces new challenges. LLMs can hallucinate, leading to incorrect code, incorrect entities in knowledge graphs or misleading analytical interpretations, which is problematic in safety-critical industrial contexts. End-users, including machine operators at customer sites, need guidance on how to interpret and validate GenAI outputs (Reference Huang, Yu, Ma, Zhong, Feng, Wang, Chen, Peng, Feng and QinHuang et al., 2025). Moreover, many high-performing models are closed-source or resource-intensive, raising concerns about data privacy, intellectual property and dependency on external providers.
Overall, the evidence suggests that GenAI can help to reduce several types of barriers, but its benefits depend on robust semantics, governance and verification. This leads to three research directions: (1) design smart-service architectures that treat knowledge-graph/embedding layers and GenAI agents as core components; (2) develop assurance methods so GenAI outputs are traceable and auditable; and (3) empirically test whether GenAI reduces data-engineering effort and improves explainable, context-aware analytics. However, GenAI cannot remove structural barriers such as security/privacy/governance and infrastructure constraints, which require investments in robust systems and compliance. Modularity and process design also still rely on human expertise. Future work should therefore combine GenAI building blocks with non-GenAI improvements in infrastructure, processes, and governance.
5. Conclusion and outlook
This systematic review has provided an overview of technical barriers that stall smart service adoption in OEMs. Eight barrier categories were identified and synthesized across 20 primary studies, then mapped onto a smart-service architecture and core analytics roles. This mapping highlights that barriers concentrate in the mid to top-stack layers of data management, semantics and integration, and that data-engineering-centric work carries a disproportionate share of the burden, while governance and modularity issues propagate across all layers and stakeholders.
Building on these findings, we discussed how emerging GenAI approaches can aid in data preparation, semantic enrichment, integration and analytics design. Modular knowledge graphs, combined with GenAI building blocks (e.g., LLM agents, RAG, and embeddings), can help structure heterogeneous lifecycle knowledge and enable more capable and explainable analytics.
Future work could pursue two complementary directions. First, the review could be extended by broadening the literature base (e.g., additional databases and grey literature), by validating/refining the barrier categories through empirical studies, as well as interviews with OEMs to strengthen the evidence for the research agenda. Additionally, a systematic literature review of GenAI-based improvements could further structure solution patterns. Second, researchers and practitioners should design and evaluate modular frameworks that integrate knowledge-graphs, embedding layers and GenAI components with non-GenAI improvements in infrastructure, processes, and governance to test their improvement in task-specific metrics as well as the reduction of development time.
Acknowledgement
This research was partially funded by the German Federal Ministry of Education and Research (BMBF) in the project VIP4PAPS, grant number 03VP10031. The contents of this publication are the sole responsibility of the authors.

 Open access

