





1. Introduction
Radio telescopes measure the properties of the incoming electromagnetic radiation using feeds sensitive to two orthogonal polarization states. This makes radio interferometers inherently suitable for polarimetric observations, by measuring the full Stokes parameters (I, Q, U, V) that completely characterise the polarization state of the radiation (Thompson et al. Reference Thompson, Moran and Swenson2017).
The response of a radio telescope to incoming radiation can be elegantly described using the Jones matrix formalism (Hamaker et al. Reference Hamaker, Bregman and Sault1996; Sault et al. Reference Sault, Hamaker and Bregman1996; Smirnov Reference Smirnov2011). The electric field of an incoming electromagnetic wave can be represented as a two-component complex vector $\mathbf{e}$
. The measured voltage
$\mathbf{e}$
. The measured voltage $\mathbf{v}$
at the output of a feed is related to the true sky electric field through a
$\mathbf{v}$
at the output of a feed is related to the true sky electric field through a $2 \times 2$
complex Jones matrix
$2 \times 2$
complex Jones matrix $\mathbf{J}$
:
$\mathbf{J}$
:
 \begin{equation}\mathbf{v} = \mathbf{J} \mathbf{e}\end{equation}
The total Jones matrix of an antenna can be decomposed into a product of matrices, each representing a distinct instrumental or propagation effect. For an interferometer baseline formed between antennas i and j, the measured visibility matrix $\mathbf{V}_{\textrm{ij}}^{\textrm{obs}}$
is related to the true sky coherency matrix
$\mathbf{V}_{\textrm{ij}}^{\textrm{obs}}$
is related to the true sky coherency matrix $\mathbf{V}_{\textrm{ij}}^{\textrm{sky}}$
by:
$\mathbf{V}_{\textrm{ij}}^{\textrm{sky}}$
by:
 \begin{equation}\mathbf{V}_{\textrm{ij}}^{\textrm{obs}} = \mathbf{J}_i \mathbf{V}_{\textrm{ij}}^{\textrm{sky}} \mathbf{J}_j^{\dagger}\end{equation}
where the dagger denotes the conjugate transpose.
Block diagram of the uGMRT dual-channel RF signal chain for a single antenna. CH1 and CH2 are the polarization inputs from the feed. The system is divided into three sections: Hood (polariser and LNA), Front-End Box (switched filter bank, band-pass filter, RF on/off, post-amplifier with phase switch, and noise source with calibration), and Common Box (band selectors, solar attenuators, channel swap, broadband amplifier, and combined power monitor). The Front-End and Common Box are located at the antenna turret just behind the feeds.

Figure 1. Long description
A block diagram of the uGMRT dual-channel RF signal chain for a single antenna. The diagram is divided into three sections: Hood, Front-End Box, and Common Box. The Hood section includes a polarizer and a low-noise amplifier (LNA) for channels CH1 and CH2. The Front-End Box contains a switched filter bank, a band-pass filter (BPF), an RF on/off switch, a post-amplifier with a phase switch, and a noise source with calibration. The Common Box includes band selectors, solar attenuators, a channel swap, a broadband amplifier, and a combined power monitor. The signal flow starts from the polarizer in the Hood, passes through various components in the Front-End Box, and finally reaches the Common Box where it is processed and monitored.
The calibration of a radio interferometer involves solving these Jones matrices that describe the instrumental response by observing appropriate calibrator sources. The standard calibration chain includes residual delay calibration, time and frequency dependent gain corrections using known calibrator sources. These steps primarily address the parallel-hand correlations and assume that the Jones matrix is approximately diagonal, which is generally sufficient for total intensity observations. For full polarization calibration, additional steps are required to determine the off-diagonal elements of the Jones matrix. These steps include estimating the instrumental leakage terms by observing an unpolarised source, or a source with known polarization properties, or a polarised source over a wide range of parallactic angles (Hamaker et al. Reference Hamaker, Bregman and Sault1996; Sault et al. Reference Sault, Hamaker and Bregman1996; Robishaw & Heiles Reference Robishaw, Heiles and Wolszczan2021). Another step corrects the differential delay between the two polarization channels, which introduces a linear phase slope across frequency in the cross-hand correlations (Sault et al. Reference Sault, Hamaker and Bregman1996; Robishaw & Heiles Reference Robishaw, Heiles and Wolszczan2021). This delay is measured using a polarised calibrator. The final step calibrates the absolute polarization angle using a source with a well-determined polarization orientation (Sault et al. Reference Sault, Hamaker and Bregman1996; Robishaw & Heiles Reference Robishaw, Heiles and Wolszczan2021). This final step is crucial for circular feeds, which do not have a fixed absolute EVPA reference on the sky. For linear feeds, however, the absolute EVPA can be set using the known orientation of the reference antenna’s feed. The calibration procedure relies on the principle that the instrumental response remains stable between calibrator and target observations or varies smoothly enough to be reliably interpolated.
The upgraded Giant Metrewave Radio Telescope (uGMRT) is a 30-element interferometer array with 45-meter dishes, operating across four frequency bands from 120 to 1 460 MHz (Gupta et al. Reference Gupta2017). Band 4 of the uGMRT covers from 550 to 950 MHz. uGMRT is the most sensitive radio interferometer in the Northern hemisphere to be operated at these frequencies. Sub-GHz polarimetry provides unique insights into Faraday rotation (Burn Reference Burn1966; Brentjens & de Bruyn Reference Brentjens and de Bruyn2005), depolarization mechanisms (Sokoloff et al. Reference Sokoloff, Bykov, Shukurov, Berkhuijsen, Beck and Poezd1998), and the large-scale magnetic Universe (Beck Reference Beck2015). Nevertheless, achieving reliable polarization calibration at these frequencies has long been a significant challenge.
During regular polarimetric observations with uGMRT Band 4, we encountered a systematic issue that hindered accurate polarization calibration. The calibrated data exhibited persistent phase ramps in the cross-hand visibilities, which could not be corrected using standard polarization calibration procedures, including leakage correction, cross-hand delay estimation, and polarization angle calibration. The cross-hand phase (RL/LR) displayed a non-linear response, and residual phase ramps persisted regardless of the choice of calibrator sources. An engineering experiment by Rai et al. (Reference Rai, Irappa and Ganla2024) revealed that the uGMRT signal chain introduces a variable cross-phase response depending on the fractional polarization. This behaviour undermines the usual assumption that calibration can be transferred between sources, leading to significant inaccuracies in the polarization calibration.
These instabilities are particularly problematic because they mimic astrophysical effects such as Faraday rotation and depolarization, making it difficult to disentangle true source polarization from instrumental artifacts. In this paper, we present a systematic investigation of this polarization calibration problem and demonstrate that the Quadrature Hybrid (QH) polariser in the uGMRT Band 4 signal chain is the primary source of the instability. We describe a controlled experiment in which the QH polariser was bypassed in a subset of antennas, converting them from circular to linear polarization feeds, and show that this modification results in stable cross-hand phases, dramatically reduced leakage amplitudes, and accurate recovery of polarization angles and rotation measures.
The paper is structured as follows. Section 2 presents the architecture of the uGMRT signal chain. Section 3 discusses the polarization calibration challenges encountered with the standard system and details the engineering investigations that identified the QH polariser as the source of the problem. Section 4 describes a controlled astronomical experiment conducted with bypassed polarisers. Section 5 outlines the data analysis methodology applied to both circular and linear feed configurations. Section 6 reports the comparative results obtained from the two systems. Section 7 presents a recent, simplified noise-source experiment comparing the same systems. Finally, Section 8 summarises our conclusions and provides recommendations for achieving reliable sub-GHz polarimetry with the uGMRT.
2. uGMRT signal chain
The uGMRT signal chain begins at the prime focus of each 45-meter antenna, where wideband feeds capture radiation across four frequency bands: Band 2 (120–250 MHz), Band 3 (250–500 MHz), Band 4 (550–950 MHz), and Band 5 (1 000–1 460 MHz) (Gupta et al. Reference Gupta2017). For Bands 2–4, the linear polarization signals from the feeds are converted to circular polarization using a QH (Figure 1) polariser before reaching the low-noise amplifiers (LNAs), while Band 5 maintains linear polarization throughout the signal chain. Each polarization channel has a dedicated LNA with noise injection capabilities (Figure 1, at four selectable power levels for system temperature measurements. The amplified signals from both polarizations pass to a common box mounted on the feed turret, where the desired frequency band is selected for transmission. The common box also provides solar attenuator options (0, 14, 30, or 44 dB), Walsh modulation control, and the ability to swap polarization channels. From the common box, the RF signals travel directly to the antenna base.
In the upgraded system, high dynamic range optical fibres transmit the unmodified RF signals from the antenna base to the Central Electronics Building (CEB), with fibre lengths ranging from approximately 600 m for the central square antennas to 21 km for the outermost arm antennas (Sureshkumar Reference Sureshkumar2014). At the CEB, the GMRT Analogue Backend (GAB) receives and processes the RF signals. The GAB down-converts the selected RF band to baseband, with bandwidth options of 100, 200, or 400 MHz. This frequency conversion employs independently configurable local oscillators for each antenna and polarization, with frequency settings available across 100–1 700 MHz in 10 kHz steps. The GAB also includes variable attenuators for power equalization across the array.
The baseband signals are digitised and fed to the GMRT Wideband Backend (GWB, Reddy et al. Reference Reddy2017), which implements an FX correlator architecture for interferometric processing. The GWB digitises the full 400 MHz bandwidth from both polarizations for all 30 antennas, channelises the data into up to 16 384 spectral channels, and computes the full polarization correlation products for all antenna pairs. The GWB can simultaneously form up to four independent beams (incoherent array, phased array, or coherently de-dispersed modes) with independently selectable antenna subsets for each beam. The final correlation products or beam-formed data are time-averaged according to the observing requirements and recorded for subsequent analysis.
3. The uGMRT Band 4 circular feed and polarization experiments
The uGMRT Band 4 system operates with natively linear feeds with a polariser which converts them to circularly polarised signals. The choice of converting the native linear feeds to circular feeds has both historical origins and apparent practical advantages in some scenarios. In circular feeds, the instrumental leakages appear in the first or higher order, while in linear feeds the cross-polarization corruptions appear in the zeroth order. This makes the calibration of linear feeds an inherently iterative process. The differential Faraday rotation of the ionosphere is imprinted as a change in phase for circular feeds, while it manifests as amplitude decorrelation in linear feeds. Traditionally, in beam-formed applications such as pulsar observations, only phases were applied, but with linear feeds one must also compensate for amplitudes to achieve coherent addition of antenna signals. Another aspect is calibration errors, which are quite common in radio astronomy. These largely manifest in the polarization state of the feed. Owing to the nature of the feed, circular feeds are more prone to producing errors in the measurement of circular polarization, and similarly linear feeds can introduce errors in the measurement of linear polarization. However, in most interferometric studies, measurements of linear polarization are generally more in demand than those of circular polarization. Historically, considering these trade-offs, telescopes were built with either native circular feeds or linear feeds with a converter. At uGMRT frequencies, the size of a native circular feed and its inherent inability to support a broadband response required the use of a linear feed with a converter to produce circularly polarised signals. In these polarisers, typically one channel is delayed by $\lambda/4$
and then the two channels are added or subtracted to produce the circular signals. This approach works well for narrow bandwidths, but polarisers cannot perform this operation coherently across a large bandwidth as the delays are tuned to a specific wavelength. Historically, radio telescopes operated with small bandwidths, but the demand of large instantaneous bandwidths in current and upcoming wideband interferometers called this design choice into question.
$\lambda/4$
and then the two channels are added or subtracted to produce the circular signals. This approach works well for narrow bandwidths, but polarisers cannot perform this operation coherently across a large bandwidth as the delays are tuned to a specific wavelength. Historically, radio telescopes operated with small bandwidths, but the demand of large instantaneous bandwidths in current and upcoming wideband interferometers called this design choice into question.
During regular science observation sessions, we identified persistent phase ramps in the cross-hand (RL) visibilities that remained uncorrected even after applying the full polarization calibration chain, including leakage correction, cross-hand delay estimation, and polarization angle calibration. Such residual phase slopes could arise from uncorrected ionospheric Faraday rotation, instrumental delays not captured by the calibration process, or inaccuracies in the calibration solutions themselves. A similar systematic behaviour was also observed in beam-formed data (credits: Dipanjan Mitra), indicating that the effect was not specific to the interferometric correlator mode. Furthermore, the residual phase ramps persisted even when different calibrators were used, suggesting that the origin of the issue is likely intrinsic to the system or propagation effects rather than related to a particular calibration source.
The observed cross-hand phase behaviour necessitated a systematic investigation of the signal chain. At sub-GHz frequencies, the sky contains relatively few bright polarised sources suitable for calibration, which makes diagnosing instrumental effects using astronomical observations alone challenging. Therefore, we chose to first test the signal chain using engineering equipment before proceeding to verification with astronomical observations.
Ganla (Reference Ganla2025) designed a two-channel correlated noise source with three inputs and two outputs. By adjusting the relative weights of the three input noise sources, this device produces a correlated noise signal that mimics a polarised astronomical signal with controllable fractional polarisation. The varying correlation level serves as a proxy for changing the degree of polarisation, allowing systematic testing of the instrumental response across a range of polarisation states.
The uGMRT signal chain can be divided into five principal blocks: the feed, the frontend system (including the QH polariser and LNAs), the optical fibre link (OFC), the analogue backend (GAB), and the digital correlator (GWB). Rai et al. (Reference Rai, Irappa and Ganla2024) injected the correlated noise source at the input of each successive block and compared the measured correlations at the correlator output against the expected values. The results demonstrated that the signal path from the OFC onwards is well-behaved, producing negligible leakage and stable cross-phase response with the change of the fractional correlation of the noise source. However, when the noise source was injected at the input of the frontend system, the output exhibited substantial corruption with a variable phase slope that depended on the correlation level of the input signal. Since the cable lengths remained fixed and only the input correlation was varied, the observed slope variation could not be attributed to differential delays. This experiment isolated the problem to the frontend system.
Cross-correlation characteristics for two correlation levels (5% and 10%) over the 550–750 MHz. The left panel illustrates the cross-correlation amplitude as a function of frequency, indicating variations in signal magnitude for the two correlations. The right presents the corresponding phase response, showing the phase evolution. In every case, the top is the response of the system with the QH in place and the bottom is when the QH is bypassed. The figure is adapted from (Rai et al. Reference Rai, Irappa and Ganla2024).

With the frontend system identified as the source of the instability, Rai et al. (Reference Rai, Irappa and Ganla2024) proceeded to test individual components within it. The frontend system architecture is described in detail in Rai et al. (Reference Rai, Irappa and Ganla2024). Rai et al. (Reference Rai, Irappa and Ganla2024) conducted an engineering test in which a correlated noise source (Ganla Reference Ganla2025) was connected directly to the frontend inputs, bypassing the feed, while keeping the remainder of the system unchanged. The experiment was performed in two configurations: first with the quadrature hybrid (QH) in place, and then with the QH bypassed. The results (Figure 2) showed that, in the presence of the QH, the system exhibited non-linear delays that varied with the strength of polarisation or correlation of the injected noise signal. In contrast, when the QH was bypassed, the system behaved as expected, showing a stable response that was independent of the input polarisation state. Also, in the amplitude, the with QH system showed oscillating structures while the without QH system correctly showed a flatter profile, showing more stable response. These findings indicated that the observed issue originated from the quadrature hybrid polariser.
4. A controlled experiment
The engineering tests identified the QH polariser as the source of the instability, but astronomical observations were required to verify this finding under realistic observing conditions. We designed a controlled experiment in which the QH polariser was bypassed in a subset of antennas, converting them from circular to linear polarisation feeds while keeping all other components unchanged.
Based on the engineering analysis, the polarisation corruptions in the uGMRT Band 4 system originate primarily from the feed and the frontend electronics, with the QH polariser responsible for the dominant contribution to the cross-coupling in the frontend system. With the QH removed, only the feed can produce dominant cross-coupling. To establish a baseline for comparison, we first observed a set of calibrator sources over two days with the standard system configuration. These observations provided a template of the instrumental response under normal operating conditions. Following this, the QH polarisers were bypassed in seven antennas using direct couplers, with no other modifications to the signal chain (Figure 3). We then repeated the observations on the same sources with identical observing settings.
Zoomed in version of the uGMRT band 4 feed electronics. The first panel shows, from top to bottom, the QH polariser, the DC coupler and LNA for 2 of the polarisation channels. The second panels shows the exact same thing but the QH being removed and again a direct coupler is used to connect to the linear feeds. The third panel shows the regular electronics with QH, coupler and the LNA with all the connections inside the hood. The last panel shows the same thing but the QH being removed.

We typically observed standard unpolarised and polarised calibrator sources like 3C147, 3C286, DA240 and a variety of pulsars with different RM and fractional polarization, for the interferometric analysis, we are going to present only the analysis of interferometric calibrators such as 3C147 (unpolarised), 3C286 (2–5% fractional polarization strength) and DA240 (25–30% fractional polarization strength).
The seven antennas selected for the bypass experiment were C04, C08, C09, and C12 from the central square, and W01, E02, and S01, one from each arm of the Y-shaped array. This selection was driven by two considerations. First, the short baselines among these antennas provide adequate sensitivity for point source observations while maintaining a reasonably Gaussian synthesised beam, which is sufficient for our diagnostic purposes since the calibrators are unresolved. Second, the central square antennas are logistically accessible, which was an important practical constraint. The uGMRT feeds are weatherproofed and sealed, so the bypass procedure required removing each feed assembly, transporting it to the laboratory for modification, and reinstalling it on the antenna. Each antenna required multiple operations with the cherry-picker vehicle used for feed access. Concentrating the modifications on nearby antennas minimised the logistical burden on the engineering team.
After the bypass, observations were carried out in both beam-formed and interferometric modes using the standard uGMRT full-polarization setup. In this paper, we focus exclusively on the interferometric visibility analysis, which allows for detailed examination of antenna-based instrumental effects. In both cases, the data were recorded with 2 048 spectral channels across a 200 MHz bandwidth (550–750 MHz) and a time integration of 5.3 s. The same command files were executed for both sets of observations, with only the starting dates adjusted to ensure that the with QH and without QH runs were as closely matched as possible. The with QH data were collected on 31 March 2025, while the without QH data were taken on 10 April 2025.
5. Data analysis methodology
All observed sources are unresolved point sources on our baseline scales, which simplifies the calibration procedure. We describe below the calibration methodology for both datasets: the circular polarisation (RL) data from the standard system and the linear polarisation (XY) data from the QH-bypassed antennas. All data reduction was performed using the Common Astronomy Software Applications package (CASA 6.5; CASA Team et al. Reference Team2022).
5.1. Calibration of circular polarisation data (with QH)
For the standard circular feed configuration, 3C147 and 3C286 served as the primary calibrators for gain, delay, and bandpass estimation. The calibration proceeded as follows. First, obviously corrupted data were flagged manually, followed by automated flagging using the CASA task flagdata in tfcrop mode with conservative thresholds of $6\sigma$
in both time and frequency to remove outliers.
$6\sigma$
in both time and frequency to remove outliers.
Initial gain phases were estimated from the full scans of 3C147 and 3C286. Using these initial solutions, parallel-hand residual delays were determined across the full bandwidth using the CASA task gaincal with gaintype=‘K’. The bandpass response was then computed from both calibrator scans using the CASA task bandpass. With the bandpass applied, refined gain amplitudes and phases were estimated using gaincal with gaintype=‘G’ and calmode=‘ap’.
For polarisation calibration, we note that the uGMRT Band 4 system produces a flipped handedness due to reflection by the parabolic reflector (Das et al. Reference Das, Kudale, Chandra, Bhattacharya, Roy and Gupta2020). To correct for this, we implemented a header swap, manually reconfiguring the Stokes keywords from RR, RL, LR, LL to LL, LR, RL, RR before proceeding with polarisation calibration.
Cross-hand delays were estimated using the CASA task gaincal with gaintype=‘kcross’ on the 3C286 scan. Instrumental polarisation leakage was determined from the 3C147 scan, assuming it to be unpolarised in the 550–750 MHz range, using the CASA task polcal with poltype=‘Df’. Finally, the cross-hand phase corrections were computed on 3C286 using polcal with poltype=‘Xf’, assuming a full polarisation model for 3C286. We note that extrapolation of higher frequency ( $\gt$
1 GHz) polarisation measurements to sub-GHz frequencies does not accurately capture the polarisation properties of 3C286, hence an updated model for these frequencies have been supplied for calibration (personal communications with Preshanth Jagannathan, Ben Hugo Hugo & Perley Reference Hugo and Perley2024 and Perley et al. Reference Perley, Butler, Greisen, Hugo, Tremou and Willis2026).
$\gt$
1 GHz) polarisation measurements to sub-GHz frequencies does not accurately capture the polarisation properties of 3C286, hence an updated model for these frequencies have been supplied for calibration (personal communications with Preshanth Jagannathan, Ben Hugo Hugo & Perley Reference Hugo and Perley2024 and Perley et al. Reference Perley, Butler, Greisen, Hugo, Tremou and Willis2026).
5.2. Calibration of linear polarisation data (QH bypassed)
For the QH-bypassed data recorded in linear (XY) polarisation basis, the calibration procedure differs in several important respects. In the XY basis, the parallactic angle rotation couples the gains and leakage terms, requiring an iterative approach to obtain accurate solutions.
The variation of the raw cross-hand (RL and XY) phase with frequency. The upper panel shows the phases for 3 sources with different polarisation properties, unpolarised (3C147), weakly polarised (3C286) and strongly polarised (DA240). The exact same is shown in lower panel but with QH bypass in the GMRT signal chain. For all of the panels, the y-axis varies from $-180$
to 180 degrees and the x-axis has limits from 550 to 750 MHz.
$-180$
to 180 degrees and the x-axis has limits from 550 to 750 MHz.

Figure 4. Long description
The image contains six line graphs arranged in two rows and three columns. Each graph shows the variation of the raw cross-hand phase with frequency for different sources. The x-axis represents the average frequency in GHz, ranging from 0.55 to 0.75. The y-axis represents the phase in degrees, ranging from -180 to 180. The sources include unpolarized (3C147), weakly polarized (3C286), and strongly polarized (DA240). The upper row of graphs shows the phases for these sources without QH bypass in the GMRT signal chain. The lower row of graphs shows the same phases with QH bypass in the GMRT signal chain. Each graph displays distinct trends and patterns in the phase variation across the frequency range.
Initial bandpass and gain estimates were derived from the 3C147 scan. With these applied, the instrumental leakage terms were estimated. A full polarisation model for 3C286 was then imported, and gains for 3C286 along with cross-hand phase corruptions were computed. To resolve the $\pi$
ambiguity inherent in cross-hand phase calibration for linear feeds, the CASA task xyamb was employed. For proper gain calibration in the XY basis, we used gaintype=‘T’ to preserve the relative power levels between the XX and YY correlations, which is essential for accurate Stokes parameter reconstruction in linear polarisation systems.
$\pi$
ambiguity inherent in cross-hand phase calibration for linear feeds, the CASA task xyamb was employed. For proper gain calibration in the XY basis, we used gaintype=‘T’ to preserve the relative power levels between the XX and YY correlations, which is essential for accurate Stokes parameter reconstruction in linear polarisation systems.
All calibration solutions were applied to the complete dataset for subsequent analysis. In both the cases, C04 was used as a reference antenna.
6. Results of the experiment
We compare the raw and calibrated data from the with QH and QH-bypassed configurations.
6.1. Raw data comparison
Figure 4 shows the raw cross-hand phases (RL for circular feeds, XY for linear feeds) for the average of the baselines to C04 as a function of frequency for three sources with different polarisation properties at our observing frequencies: 3C147 (unpolarised), 3C286 (weakly polarised, $\sim$
2–5%), and DA240 (strongly polarised,
$\sim$
2–5%), and DA240 (strongly polarised, $\sim$
20–30%). The upper panels show the standard system with QH, and the lower panels show the QH-bypassed configuration.
$\sim$
20–30%). The upper panels show the standard system with QH, and the lower panels show the QH-bypassed configuration.
The difference between the two configurations is striking. In the with QH system, the cross-hand phase varies dramatically with the polarisation strength of the observed source. The phase structure is non-linear across frequency, inconsistent with a simple differential delay. This behaviour has severe implications for polarisation calibration. Leakage calibration typically employs an unpolarised source, but the phase response of the QH depends on the polarisation state of the input signal. Although a polarised calibrator is subsequently used to determine the absolute cross-hand phase, the source-dependent response means that corrections derived from one calibrator cannot be reliably transferred to a target source with different fractional polarisation.
The middle column shows 3C286, the most widely used polarisation calibrator at low frequencies. With the QH in place, the cross-hand phase spectrum is non-linear and cannot be adequately described by a simple delay. This also validates the discrepancy observed in our diagnostic experiment (Section 3). 3C286 and DA240 have different fractional polarisations and therefore produce different instrumental responses. When calibration solutions from one source are applied to the other, the residual phase errors corrupt the target data. This limitation implies that with the standard with QH system, accurate polarisation calibration is only achievable when the calibrator and target have comparable fractional polarisation. It is worth noting that for a higher fractional polarisation, the cross-phase shows a linear behaviour (Figure 4, DA240 panel).
In contrast, the QH-bypassed system exhibits completely stable cross-hand phases. The observations span 7 h, with 3C147 observed at the beginning and DA240 at the end of the session. Throughout this period, the cross-hand phase remains constant and independent of the source polarisation. This behaviour conforms to the standard assumptions of radio interferometric calibration, that corrections derived on a calibrator can be transferred to any target source regardless of its polarisation properties.
Leakage amplitude comparisons are shown for the cases with the QH and with the QH bypassed. The Y-axis represents the relative leakage in fractional units, and the X-axis shows frequencies from 550 to 750 MHz. The same set of antennas, C04, C08, C12, E02, S01, and W01, is shown in separate panels. The black and red colours indicate the polarisation products: RL/LR and XY/YX, corresponding to the respective panels.

6.2. Difference in cross-coupling
Figure 5 compares the leakage amplitudes for the with QH and QH bypassed configurations. The difference is substantial. In the standard system, the QH polariser introduces significant cross-coupling between the polarisation channels, resulting in average leakage amplitudes of 10–15%. In the bypassed configuration, where the only source of polarisation mixing is the feed itself, the leakages are reduced to 2–5%. A leakage amplitude that is flat across frequency is indicative of a geometric misorientation between the two dipole feeds rather than a frequency-dependent instrumental effect. This is because a physical misalignment of the dipoles is an achromatic property – the angle between the feeds does not change with frequency – and therefore its contribution to the cross-hand signal appears as a constant offset across the band.
To see this formally, consider two nominally orthogonal dipoles where one is rotated by a small angle $\varepsilon$
from its ideal orientation. The resulting Jones matrix takes the form of a rotation matrix:
$\varepsilon$
from its ideal orientation. The resulting Jones matrix takes the form of a rotation matrix:
 \begin{equation} J = \begin{pmatrix} \cos\varepsilon & \sin\varepsilon \\ -\sin\varepsilon & \cos\varepsilon \end{pmatrix}\end{equation}
Comparing the off-diagonal terms with the standard D-term representation of the Jones matrix, where the leakage terms appear as $D_X = \sin\varepsilon$
and
$D_X = \sin\varepsilon$
and $D_Y = -\sin\varepsilon$
, it follows directly that
$D_Y = -\sin\varepsilon$
, it follows directly that $|D| = \sin\varepsilon$
and therefore
$|D| = \sin\varepsilon$
and therefore $\varepsilon = \arcsin\!(|D|)$
. Using the observed leakage value of 2% (
$\varepsilon = \arcsin\!(|D|)$
. Using the observed leakage value of 2% ( $|D| = 0.02$
), the implied misorientation angle is
$|D| = 0.02$
), the implied misorientation angle is $\varepsilon = \arcsin\!(0.02) \approx 1.15^{\circ}$
.
$\varepsilon = \arcsin\!(0.02) \approx 1.15^{\circ}$
.
This is a small but non-negligible misalignment. It should be noted that this estimate assumes the D-terms are dominated purely by a geometric rotation of the feeds.
Beyond the amplitude difference, the spectral characteristics of the leakage also differ markedly. With the QH in place, the leakage spectra exhibit strong modulations across frequency, and the response varies considerably from antenna to antenna. This resembles the finding of Rai et al. (Reference Rai, Irappa and Ganla2024). In contrast, the QH-bypassed system produces leakage spectra that are largely flat across the bandwidth. An increase in leakage amplitude is observed above 700 MHz in the bypassed case, which can be most likely attributed to the feed response itself. Nevertheless, the fundamental improvement in stability and reduced leakage amplitude is evident. The remaining calibration tables (gains, bandpass, delays) do not show diagnostic differences between the two configurations and are therefore not discussed further.
6.3 Difference in calibrated data
Following the full polarisation calibration procedure described in Section 5, we compare the calibrated data from the two configurations. The differences are consistent with expectations based on the raw data analysis.
We begin with the unpolarised source 3C147, for which perfect calibration should yield zero Stokes Q and U. Figure 6 (top row) shows that in the standard QH system, the residual Stokes Q and U amplitudes are of order $\pm 0.4$
Jy with oscillatory spectral structure. In contrast, the QH-bypassed data show residual amplitudes of approximately 0.1 Jy at the low-frequency end of the band with no oscillatory behaviour. These residuals correspond to leakage levels of
$\pm 0.4$
Jy with oscillatory spectral structure. In contrast, the QH-bypassed data show residual amplitudes of approximately 0.1 Jy at the low-frequency end of the band with no oscillatory behaviour. These residuals correspond to leakage levels of $\sim$
0.5% for the standard system and
$\sim$
0.5% for the standard system and $\lt$
0.2% for the bypassed configuration, indicating the improved calibration accuracy achievable without the QH polariser.
$\lt$
0.2% for the bypassed configuration, indicating the improved calibration accuracy achievable without the QH polariser.
The illustration shows the Stokes Q and U spectra for three different sources: 3C147 (top), 3C286 (middle), and DA240 (bottom). In all cases, Stokes Q and U are shown in violet and orange, respectively. For each source, the left panel corresponds to the case with QH, while the right panel corresponds to the case without QH.

Figure 6. Long description
The image contains six scatter plots depicting the Stokes Q and U spectra for three different sources: 3C147, 3C286, and DA240. Each source has two scatter plots, one with QH and one without QH. The x-axis represents frequency in GHz, and the y-axis represents flux density in Jy. Stokes Q is shown in violet, and Stokes U is shown in orange. Panel A: Stokes Parameters: 3C147 - RL (with QH). The scatter plot shows the flux density versus frequency for Stokes Q and U with QH. Panel B: Stokes Parameters: 3C147 - XY (QH bypassed). The scatter plot shows the flux density versus frequency for Stokes Q and U without QH. Panel C: Stokes Parameters: 3C286 - RL (with QH). The scatter plot shows the flux density versus frequency for Stokes Q and U with QH. Panel D: Stokes Parameters: 3C286 - XY (QH bypassed). The scatter plot shows the flux density versus frequency for Stokes Q and U without QH. Panel E: Stokes Parameters: DA240 - RL (with QH). The scatter plot shows the flux density versus frequency for Stokes Q and U with QH. Panel F: Stokes Parameters: DA240 - XY (QH bypassed). The scatter plot shows the flux density versus frequency for Stokes Q and U without QH.
For the polarisation calibrator 3C286 (Figure 6, middle row), the standard system exhibits residual spectral artefacts even though 3C286 was used to derive the polarisation calibration solutions. These artefacts are absent in the QH-bypassed data, where the corrected Stokes Q and U spectra match the expected model. This behaviour is explained by the source-dependent response of the QH. The leakage solutions derived from the unpolarised source 3C147 do not accurately describe the instrumental response when applied to the polarised source 3C286, resulting in residual spectral structure.
The most significant differences appear in the science target DA240 (Figure 6, bottom row). The standard system again produces oscillatory residuals in the Stokes Q and U spectra, while the QH-bypassed data are smooth. Figure 7 compares the fractional polarisation and polarisation angle spectra for both configurations. The fractional polarisation is consistent between the two systems and constant across the band. However, the polarisation angle behaviour differs dramatically. In the standard system, the polarisation angle spectrum is irregular and does not show the expected Faraday rotation signature. In the QH-bypassed system, the polarisation angle exhibits a smooth linear slope across the band. DA240 has a rotation measure of 3.3 rad m $^{-2}$
(Brentjens Reference Brentjens2008), which corresponds to a polarisation angle rotation of approximately 25
$^{-2}$
(Brentjens Reference Brentjens2008), which corresponds to a polarisation angle rotation of approximately 25 $^\circ$
across the 550–750 MHz band. This expected rotation is accurately recovered in the bypassed configuration.
$^\circ$
across the 550–750 MHz band. This expected rotation is accurately recovered in the bypassed configuration.
The top panels show the fractional polarisation and polarisation angle spectra for DA240 with QH (left) and without QH (right). In both cases, the fractional polarisation is shown in green, while the polarisation angle is shown in violet. The bottom panels display the Stokes I, Q, U, and V spectra for DA240, shown in blue, green, magenta, and orange, respectively, with the left panel corresponding to the case with QH and the right panel to the case without QH.

The Stokes I and V spectra are comparable between the two systems, with Stokes V consistent with zero as expected for these sources. The critical difference lies in the Stokes Q and U recovery. These results demonstrate that the standard QH system can measure fractional polarisation with residual leakage contamination at the $\sim$
0.5% level, but cannot reliably determine polarisation angles or rotation measures. The QH-bypassed system achieves residual leakage below 0.2% and accurately recovers both the fractional polarisation and the Faraday rotation signature.
$\sim$
0.5% level, but cannot reliably determine polarisation angles or rotation measures. The QH-bypassed system achieves residual leakage below 0.2% and accurately recovers both the fractional polarisation and the Faraday rotation signature.
6.4. Expected implications for Stokes I sensitivity
Although the primary focus of this work is on polarimetric fidelity, the reduced leakage and stable cross-hand phase in the QH-bypassed system are also expected to improve total intensity (Stokes I) performance. We outline the relevant algebra below, following from the measurement equation framework already presented in Section 2 (Hamaker et al. Reference Hamaker, Bregman and Sault1996; Sault et al. Reference Sault, Hamaker and Bregman1996; Smirnov Reference Smirnov2011).
The Jones matrix for antenna i can be written as:
 \begin{equation}\mathbf{J}_i = \mathbf{G}_i \mathbf{D}_i =\begin{pmatrix} g_{\textrm{ip}} & 0 \\ 0 & g_{\textrm{iq}} \end{pmatrix}\begin{pmatrix} 1 & d_{\textrm{ip}} \\ d_{\textrm{iq}} & 1 \end{pmatrix},\end{equation}
where $g_{\textrm{ip}}$
,
$g_{\textrm{ip}}$
, $g_{\textrm{iq}}$
are the complex gains and
$g_{\textrm{iq}}$
are the complex gains and $d_{\textrm{ip}}$
,
$d_{\textrm{ip}}$
, $d_{\textrm{iq}}$
are the leakage terms for the two polarisation channels p and q.
$d_{\textrm{iq}}$
are the leakage terms for the two polarisation channels p and q.
Consider an unpolarised point source with flux density S, for which the sky coherency matrix is $\mathbf{V}_{\textrm{ij}}^{\textrm{sky}} =\frac{S}{2}\begin{pmatrix} 1 & 0 \\ 0 & 1 \end{pmatrix}$
. From Equation (2), expanding the observed parallel-hand visibility
$\mathbf{V}_{\textrm{ij}}^{\textrm{sky}} =\frac{S}{2}\begin{pmatrix} 1 & 0 \\ 0 & 1 \end{pmatrix}$
. From Equation (2), expanding the observed parallel-hand visibility $V_{\textrm{ij}}^{\textrm{pp}}$
and retaining terms to second order in the leakage:
$V_{\textrm{ij}}^{\textrm{pp}}$
and retaining terms to second order in the leakage:
 \begin{equation}V_{\textrm{ij}}^{\textrm{pp}} = g_{\textrm{ip}}\, g_{\textrm{jp}}^{*}\, \frac{S}{2}\big(1 + d_{\textrm{ip}}\, d_{\textrm{jp}}^{*}\big).\end{equation}
The Stokes I visibility is estimated from the sum of the two parallel-hand correlations. After perfect gain calibration, the fractional error in the Stokes I estimate due to uncorrected leakage is:
 \begin{equation}\frac{\delta I}{I} = \frac{1}{2}\,\textrm{Re}\big(d_{\textrm{ip}}\, d_{\textrm{jp}}^{*} + d_{\textrm{iq}}\, d_{\textrm{jq}}^{*}\big).\end{equation}
This is a second-order term, but it is not negligible for the with-QH system where $|d| \sim 0.1$
–
$|d| \sim 0.1$
– $0.15$
(Section 6), corresponding to a per-baseline bias of up to
$0.15$
(Section 6), corresponding to a per-baseline bias of up to $\sim$
1–2%. Crucially, when the leakage spectra exhibit the strong frequency-dependent modulations seen in the with-QH configuration (Figure 5), these errors do not average out over frequency and introduce spectral artefacts into the Stokes I image.
$\sim$
1–2%. Crucially, when the leakage spectra exhibit the strong frequency-dependent modulations seen in the with-QH configuration (Figure 5), these errors do not average out over frequency and introduce spectral artefacts into the Stokes I image.
A separate but equally important effect arises from the cross-hand phase instability. Standard self-calibration solves for antenna-based gains assuming a diagonal Jones matrix, i.e. $d_{\textrm{ip}} = d_{\textrm{iq}} = 0$
. When the true off-diagonal terms are large and frequency-dependent, the gain solver partially absorbs the leakage into the diagonal solutions. As shown by Bhatnagar & Nityananda (Reference Bhatnagar and Nityananda2001), polarisation leakage introduces closure errors in the co-polar visibilities that cannot be removed by diagonal gain calibration alone. These closure errors manifest as artefacts in the Stokes I image, reducing the achievable dynamic range.
$d_{\textrm{ip}} = d_{\textrm{iq}} = 0$
. When the true off-diagonal terms are large and frequency-dependent, the gain solver partially absorbs the leakage into the diagonal solutions. As shown by Bhatnagar & Nityananda (Reference Bhatnagar and Nityananda2001), polarisation leakage introduces closure errors in the co-polar visibilities that cannot be removed by diagonal gain calibration alone. These closure errors manifest as artefacts in the Stokes I image, reducing the achievable dynamic range.
The situation is further compounded when the cross-hand phase varies with the polarisation state of the observed source (Section 3). In this case, the effective leakage terms are themselves source-dependent, meaning that the closure errors change between the calibrator and the target. Self-calibration solutions derived on a calibrator then carry systematic biases when transferred to the target field, producing direction-dependent errors in the final image.
Cross-correlation characteristics for different correlation levels over the 550–750 MHz. The left panel illustrates the cross-correlation amplitude as a function of frequency, indicating variations in signal magnitude for the two correlations. The right presents the corresponding phase response, showing the phase evolution. In every case, the top is the response of the system with the QH in place and the bottom is when the QH is bypassed.

Figure 8. Long description
The image contains four line graphs. Panel A and B on the left side show cross-correlation amplitude versus frequency, while Panel A and B on the right side show cross-correlation phase versus frequency. Each panel compares data with and without QH. Panel A on the left shows the cross-correlation amplitude with QH on 25 March 2026, with the x-axis labeled Frequency (MHz) ranging from 550 to 750 and the y-axis labeled RL Cross-correlation Amplitude. Different lines represent various correlation levels from 1 percent to 100 percent. Panel B on the left shows the cross-correlation amplitude without QH on 18 March 2026, with the same axes and correlation levels. Panel A on the right shows the cross-correlation phase with QH on 25 March 2026, with the x-axis labeled Frequency (MHz) ranging from 550 to 750 and the y-axis labeled RL Phase degrees. Different lines represent various correlation levels from 1 percent to 100 percent. Panel B on the right shows the cross-correlation phase without QH on 18 March 2026, with the same axes and correlation levels.
For the QH-bypassed system, with leakage amplitudes of 2–5% and spectrally flat response (Figure 5), the second-order bias (Equation 6) is reduced to below $\sim$
0.1%. The stable cross-hand phase ensures that the leakage terms do not vary with source properties, so that self-calibration solutions transfer reliably between calibrator and target. Both effects are expected to yield improved Stokes I sensitivity and imaging dynamic range. A detailed quantitative analysis using matched observations will be presented in a forthcoming paper (Pal et al. in preparation).
$\sim$
0.1%. The stable cross-hand phase ensures that the leakage terms do not vary with source properties, so that self-calibration solutions transfer reliably between calibrator and target. Both effects are expected to yield improved Stokes I sensitivity and imaging dynamic range. A detailed quantitative analysis using matched observations will be presented in a forthcoming paper (Pal et al. in preparation).
7. More simplified noise-source experiment
Recently, we conducted a simplified test using an updated correlated noise source based on the design of Ganla (Reference Ganla2025). The noise source was connected in the receiver room, and a randomly selected frontend box was used for testing. The signal from the noise source was first passed through the frontend box and common box and then connected directly to the GWB backend. The test was repeated both with and without the QH in the frontend system. While these measurements do not fully replicate real observations, as cable delays and OFC systems are absent, they allow the direct assessment of the QH’s effect.
The results (Figure 8) show that without the QH, the system maintains stable amplitudes across all correlation strengths. With the QH, the system is more stable than in previous measurements but still exhibits greater amplitude oscillations compared to the without-QH configuration. Cross-phase analysis further highlights the differences. The with-QH system displays nonlinear, variable phase slopes at low correlations, which become linear at higher correlations. In contrast, the without-QH system behaves like an ideal radio interferometer frontend, with all cross-phases aligned. This demonstrates that the without-QH system can be calibrated reliably, whereas the with-QH system requires careful matching of the linear polarisation strength between the calibrator and the target source.
8. Discussion and conclusions
The uGMRT is currently one of only two instruments (along with MeerKAT) capable of studying the universe at sub-GHz frequencies with sensitivities at the level of tens of $\unicode{x03BC}$
Jy. Among these, the uGMRT offers the highest angular resolution at these frequencies. Even with the advent of the Square Kilometre Array (Diamond Reference Diamond2024), the uGMRT will remain the most sensitive sub-GHz radio telescope in the Northern hemisphere. This capability is essential for probing the magnetised universe through Faraday rotation and depolarisation studies, phenomena that are uniquely accessible at these wavelengths (Beck Reference Beck2015; Brentjens & de Bruyn Reference Brentjens and de Bruyn2005). However, realising the full scientific potential of these observations demands a signal chain whose polarimetric response is stable and well-characterised.
$\unicode{x03BC}$
Jy. Among these, the uGMRT offers the highest angular resolution at these frequencies. Even with the advent of the Square Kilometre Array (Diamond Reference Diamond2024), the uGMRT will remain the most sensitive sub-GHz radio telescope in the Northern hemisphere. This capability is essential for probing the magnetised universe through Faraday rotation and depolarisation studies, phenomena that are uniquely accessible at these wavelengths (Beck Reference Beck2015; Brentjens & de Bruyn Reference Brentjens and de Bruyn2005). However, realising the full scientific potential of these observations demands a signal chain whose polarimetric response is stable and well-characterised.
Our investigation has demonstrated that the Quadrature Hybrid polariser in the uGMRT Band 4 frontend introduces a systematic, source-dependent instrumental response that fundamentally undermines the standard assumption of calibration transferability. This finding has broad implications, both for the interpretation of existing data and for the design of future observing strategies.
The source-dependent behaviour of the QH polariser was not previously reported in the existing studies. This is likely because other systematic effects, incorrect calibrator models, uncorrected handedness (Das et al. Reference Das, Kudale, Chandra, Bhattacharya, Roy and Gupta2020; Chandra et al. Reference Chandra, Kumar, Kudale, Kansabanik, Das, Kharb, Silpa and Sebastian2023), and ionospheric Faraday rotation, dominated the error budget, or because existing studies focused on highly polarised sources such as pulsars, for which the QH response is more stable (as demonstrated in Figures 4 and 8).
Linear polarisation studies with the uGMRT at these frequencies have been quite limited. In imaging-mode measurements, 3C286 is typically used as the polarisation calibrator, whose model has recently been refined and must be supplied correctly (Hugo & Perley Reference Hugo and Perley2024). From our experiments, the fractional polarisation can be accurately recovered for sources with linear polarisation strengths of a few percent, but the polarisation angle remains unreliable, especially for weakly polarised or depolarised sources with polarisation fractions below $\sim$
10%, which covers the majority of imaging science targets. The source linear polarisation is not known a priori, and even if it were, it would be impractical to find a calibrator matching the target’s polarisation strength.
$\sim$
10%, which covers the majority of imaging science targets. The source linear polarisation is not known a priori, and even if it were, it would be impractical to find a calibrator matching the target’s polarisation strength.
Time-series measurements follow a different path, typically using pulsars that exhibit high linear polarisation. As we have shown from the noise source measurements (Figure 8) and the DA240 data (Figure 4, last column), the QH produces a delay slope whose nonlinearity diminishes with increasing fractional polarisation strength. At fractional polarisations exceeding $\sim$
25%, the delay slopes change less abruptly and can potentially be calibrated if both the source and the calibrator pulsar have comparably high degrees of linear polarisation. Nevertheless, this imposes a restrictive requirement that may not be generally satisfied.
$\sim$
25%, the delay slopes change less abruptly and can potentially be calibrated if both the source and the calibrator pulsar have comparably high degrees of linear polarisation. Nevertheless, this imposes a restrictive requirement that may not be generally satisfied.
The conversion from circular to linear feeds by bypassing the QH involves practical tradeoffs that merit discussion. The historical preference for circular feeds at sub-GHz frequencies was motivated by simpler ionospheric corrections, first-order leakage behaviour, and the convenience of phase-only beamforming for pulsar observations (Section 3). However, these advantages must now be weighed against the demonstrated instability of the QH polariser over wide bandwidths. In the linear feed configuration, the parallactic angle rotation couples the gain and leakage terms, requiring an iterative calibration approach (Sault et al. Reference Sault, Hamaker and Bregman1996; Smirnov Reference Smirnov2011). Ionospheric Faraday rotation manifests as amplitude decorrelation rather than a simple phase rotation, requiring amplitude corrections for coherent beamforming. These additional calibration requirements are well understood and routinely handled by modern software packages such as CASA (CASA Team et al. Reference Team2022). The critical advantage of the linear feed configuration is that the instrumental response does not depend on the polarisation state of the observed source, enabling reliable transfer of calibration solutions from any calibrator to any target.
An alternative to physically bypassing the QH would be to develop a calibration framework that models the source-dependent instrumental response. In principle, if the QH’s transfer function can be characterised as a function of the input polarisation state, one could iteratively solve for both the true source polarisation and the instrumental response. Such an approach would require a detailed electromagnetic model of the QH polariser, validated against laboratory measurements, and its incorporation into a direction-dependent calibration framework (Smirnov Reference Smirnov2011). While conceptually feasible, this strategy would impose significant computational overhead and introduce additional free parameters whose degeneracies with astrophysical signals (e.g. Faraday rotation, depolarisation) could be difficult to break. We therefore consider the QH bypass to be the more practical and robust solution for the foreseeable future. In the case where the software pipeline requires circular-basis data, one can convert the calibrated linear-feed visibilities to a circular basis (Perley & Greisen Reference Perley and Greisen2024), provided the linear data are properly amplitude and phase balanced beforehand, and use it for subsequent rounds of self-calibration.
We can attempt to explain the fractional polarisation-dependent response of the QH analytically within the Jones matrix framework established in Section 2. For a source with fractional polarisation $f_p$
, the source coherency matrix decomposes exactly into a fully polarised component and an unpolarised component weighted by
$f_p$
, the source coherency matrix decomposes exactly into a fully polarised component and an unpolarised component weighted by $f_p$
(Appendix A). Propagating this decomposition through the full system Jones matrix
$f_p$
(Appendix A). Propagating this decomposition through the full system Jones matrix $\mathbf{M}(\,f) = \mathbf{M}_\textrm{QH}(\,f)\,\mathbf{J}(\,f)$
, the cross-correlation between the synthesised circular outputs L and R separates into two terms
$\mathbf{M}(\,f) = \mathbf{M}_\textrm{QH}(\,f)\,\mathbf{J}(\,f)$
, the cross-correlation between the synthesised circular outputs L and R separates into two terms
 \begin{equation} \phi_\textrm{obs}(\,f,\,f_p) = \arg\!\left[\,f_p\,\mathcal{S}_\textrm{direct}(\,f) + (1-f_p)\,\mathcal{S}_\textrm{leak}(\,f)\right] \end{equation}
where $\mathcal{S}_\textrm{direct}$
carries the cross-coherency of the direct polarised signal path and
$\mathcal{S}_\textrm{direct}$
carries the cross-coherency of the direct polarised signal path and $\mathcal{S}_\textrm{leak}$
carries the cross-coherency of the leakage path. In the ideal case
$\mathcal{S}_\textrm{leak}$
carries the cross-coherency of the leakage path. In the ideal case $\mathcal{S}_\textrm{leak}$
vanishes identically and the cross-phase is independent of
$\mathcal{S}_\textrm{leak}$
vanishes identically and the cross-phase is independent of $f_p$
.
$f_p$
.
In the real system, however, there exists a frequency-dependent differential gain between the two feed channels, $|G_x(\,f)| \neq |G_y(\,f)|$
, which was established independently at the
$|G_x(\,f)| \neq |G_y(\,f)|$
, which was established independently at the $\sim$
10% level from the bandpass solutions of the linear feed data and is not constant across the band. This frequency-dependent gain mismatch directly populates
$\sim$
10% level from the bandpass solutions of the linear feed data and is not constant across the band. This frequency-dependent gain mismatch directly populates $\mathcal{S}_\textrm{leak}$
with a non-zero contribution whose phase varies with frequency, as do the non-zero feed leakage terms
$\mathcal{S}_\textrm{leak}$
with a non-zero contribution whose phase varies with frequency, as do the non-zero feed leakage terms $d_x(\,f)$
,
$d_x(\,f)$
, $d_y(\,f)$
measured in Section 6. Since
$d_y(\,f)$
measured in Section 6. Since $\mathcal{S}_\textrm{direct}$
and
$\mathcal{S}_\textrm{direct}$
and $\mathcal{S}_\textrm{leak}$
are complex quantities pointing in different directions in the complex plane, the observed cross-phase rotates continuously with
$\mathcal{S}_\textrm{leak}$
are complex quantities pointing in different directions in the complex plane, the observed cross-phase rotates continuously with $f_p$
as the weighted vector sum of these two phasors shifts direction. At high
$f_p$
as the weighted vector sum of these two phasors shifts direction. At high $f_p$
the direct signal term dominates and the cross-phase is stable and well-behaved. As
$f_p$
the direct signal term dominates and the cross-phase is stable and well-behaved. As $f_p$
decreases the leakage term progressively takes over and the cross-phase diverges, driven by the frequency-dependent gain mismatch and feed leakage. This is precisely the behaviour observed in Figures 4 and 8, where the cross-phase stabilises above
$f_p$
decreases the leakage term progressively takes over and the cross-phase diverges, driven by the frequency-dependent gain mismatch and feed leakage. This is precisely the behaviour observed in Figures 4 and 8, where the cross-phase stabilises above $f_p \sim 50\%$
and becomes increasingly unstable at lower correlation levels.
$f_p \sim 50\%$
and becomes increasingly unstable at lower correlation levels.
Designing a better QH is also a possibility and out of scope of this investigation, but, Srikanth & Kerr (Reference Srikanth and Kerr2001) explicitly caution that maintaining amplitude and phase balance across wide bandwidths is extremely demanding for these QH devices. Even a carefully optimised six-branch waveguide hybrid achieves amplitude imbalance $\leq 1$
dB and phase imbalance
$\leq 1$
dB and phase imbalance $\leq 1^\circ$
only over a bandwidth ratio of
$\leq 1^\circ$
only over a bandwidth ratio of $\sim$
1.43:1, and tighter balance of
$\sim$
1.43:1, and tighter balance of $\leq$ $0.5$
dB only over 1.29:1. To achieve even this, three separate hybrid designs with overlapping bands were required rather than a single broadband solution, underscoring how sensitive the balance is to frequency. The uGMRT Band 4 spans 550–750 MHz, a ratio of 1.36:1, placing it directly within the same bandwidth regime. The degradation of amplitude and phase balance of the QH across the band therefore compounds the existing frequency-dependent gain mismatch of the feeds, and together these effects produce the systematic fractional polarisation-dependent cross-phase instability reported here. To our knowledge this effect has not previously been reported for any instrument employing a quadrature hybrid feed. Modern instruments such as the EVLA also employ quadrature hybrids in their signal chains, yet no published results demonstrate a fractional polarisation-dependent cross-phase response of the kind reported here. This is likely because the EVLA operates with physical sub-banding, where each band is divided into narrower sub-bands that individually satisfy the bandwidth constraints identified by Srikanth & Kerr (Reference Srikanth and Kerr2001) more comfortably, alongside better gain matching between the two feed outputs achieved through tighter manufacturing tolerances and cryogenic cooling of the frontend electronics, which reduces both thermal noise and gain fluctuations across the band. Since the fractional polarisation-dependent response is driven by the frequency-dependent gain mismatch
$0.5$
dB only over 1.29:1. To achieve even this, three separate hybrid designs with overlapping bands were required rather than a single broadband solution, underscoring how sensitive the balance is to frequency. The uGMRT Band 4 spans 550–750 MHz, a ratio of 1.36:1, placing it directly within the same bandwidth regime. The degradation of amplitude and phase balance of the QH across the band therefore compounds the existing frequency-dependent gain mismatch of the feeds, and together these effects produce the systematic fractional polarisation-dependent cross-phase instability reported here. To our knowledge this effect has not previously been reported for any instrument employing a quadrature hybrid feed. Modern instruments such as the EVLA also employ quadrature hybrids in their signal chains, yet no published results demonstrate a fractional polarisation-dependent cross-phase response of the kind reported here. This is likely because the EVLA operates with physical sub-banding, where each band is divided into narrower sub-bands that individually satisfy the bandwidth constraints identified by Srikanth & Kerr (Reference Srikanth and Kerr2001) more comfortably, alongside better gain matching between the two feed outputs achieved through tighter manufacturing tolerances and cryogenic cooling of the frontend electronics, which reduces both thermal noise and gain fluctuations across the band. Since the fractional polarisation-dependent response is driven by the frequency-dependent gain mismatch $|G_x(\,f)| \neq |G_y(\,f)|$
and the phase error
$|G_x(\,f)| \neq |G_y(\,f)|$
and the phase error $\delta(\,f)$
of the hybrid, any system that reduces these two quantities, whether through a narrower instantaneous bandwidth, better gain matching, or a more thermally stable frontend, will exhibit a weaker and more stable cross-phase response.
$\delta(\,f)$
of the hybrid, any system that reduces these two quantities, whether through a narrower instantaneous bandwidth, better gain matching, or a more thermally stable frontend, will exhibit a weaker and more stable cross-phase response.
The lessons from this study also extend beyond the uGMRT. Many current and upcoming radio telescopes employ wideband receivers at sub-GHz frequencies. Our findings underscore the importance of end-to-end verification of polarimetric response across the full bandwidth, particularly when wideband polarisers are employed. The diagnostic methodology presented here provides a template for such verification at other facilities.
The key findings of this study are as follows:
-
1. The QH polariser produces a cross-hand phase response that varies with the fractional polarisation of the input signal. This source-dependent behaviour means that calibration solutions derived from one source cannot be reliably applied to another source with different polarisation properties. In the with-QH uGMRT Band 4 system, accurate polarization calibration is only achievable when the calibrator and target have similar fractional polarizations, preferably exceeding 25%.
-
2. The QH introduces substantial instrumental leakage (10–15%) with strong spectral modulations and significant antenna-to-antenna variations. With the QH bypassed, the leakage originates solely from the feed and is reduced to 2–5%, with a flat spectral response and consistent behaviour across antennas.
-
3. With the standard QH system, residual leakage after calibration is approximately 0.5%, and the polarization angle spectrum does not reflect the true Faraday rotation of the source. The QH-bypassed system achieves residual leakage below 0.2% and accurately recovers the expected polarization angle rotation. For DA 240, with a rotation measure of 3.3 rad m $^{-2}$
(Brentjens Reference Brentjens2008), the bypassed system correctly measures the
$\sim 25^\circ$
rotation across the 550–750 MHz band.
$^{-2}$
(Brentjens Reference Brentjens2008), the bypassed system correctly measures the
$\sim 25^\circ$
rotation across the 550–750 MHz band.


From a practical standpoint, our results demonstrate that reliable sub-GHz polarimetry with uGMRT Band 4 requires either bypassing the QH polariser or implementing a more sophisticated calibration strategy that accounts for the source-dependent instrumental response, assuming the response can be modelled. The QH-bypassed configuration converts the system to linear polarization feeds, which requires a modified calibration procedure but yields substantially improved polarimetric accuracy. For science cases that require accurate polarization angle measurements or rotation measure determinations, the linear feed configuration is strongly preferred. We note that the engineering modifications required to bypass the QH are straightforward.
This work emphasises to look into instrumental problem more closely from both engineering and astronomical perspectives and pave the way for the future accurate polarimetric measurements with the uGMRT.
Acknowledgements
We thank Dipanjan Mitra for conceiving and designing the initial experiment to debug the signal chain. He first identified the issue in pulsar experiments, which subsequently guided the visibility-based investigation presented here. His guidance was essential throughout the execution and exploration of this work, and the entire author team expresses their sincere gratitude to him. A.P. sincerely appreciates the discussions with him about calibration and test designing. We thank Atul Ganla and Ajith Kumar for designing the correlated noise source used in the engineering tests. A.P. has been involved in the sub-GHz polarization project for the past two years and thanks Preshanth Jagannathan for the initial confirmation of the 3C286 polarization models from MeerKAT. A.P. is also grateful to Preshanth Jagannathan, Shrikrishna Shekhar, and Sanjay Bhatnagar for their feedback and discussions at various stages of this project. We thank Yashwant Gupta and Sureshkumar S., and the other members of the Receiver Chain Issues group, for their valuable feedback and continued support. A.P. acknowledges the uGMRT technical staff who performed the QH bypass in the intense heat of March at Khodad and appreciates being allowed to observe the process firsthand from the cherry picker. A.P. personally thanks all the staff from the Frontend, Backend, Servo, Electrical, and Operations groups who helped facilitate these experiments. The authors acknowledge the use of ChatGPT (OpenAI) to assist in improving the clarity and readability of the manuscript. We thank the staff of the GMRT that made these observations possible. GMRT is run by the National Centre for Radio Astrophysics of the Tata Institute of Fundamental Research. This research has made use of NASA’s Astrophysics Data System Bibliographic Services. This research has made use of the NASA/IPAC Extragalactic Database (NED), which is operated by the Jet Propulsion Laboratory, California Institute of Technology, under contract with the National Aeronautics and Space Administration.
Data availability
None.
Appendix A. Derivation of the fractional polarisation- dependent cross-phase
We derive analytically the expression for the observed cross-phase between the synthesised circular outputs L and R as a function of fractional polarisation $f_p$
, using the Jones matrix formalism introduced in Section 2. For a source with total intensity I, fractional polarisation
$f_p$
, using the Jones matrix formalism introduced in Section 2. For a source with total intensity I, fractional polarisation $f_p$
and electric vector position angle
$f_p$
and electric vector position angle $\chi$
, the Stokes parameters are
$\chi$
, the Stokes parameters are $Q = f_p I\cos 2\chi$
,
$Q = f_p I\cos 2\chi$
, $U = f_p I\sin 2\chi$
and
$U = f_p I\sin 2\chi$
and $V = 0$
for a linearly polarised source. The source coherency matrix is therefore
$V = 0$
for a linearly polarised source. The source coherency matrix is therefore
 \begin{equation} \mathbf{C}_\textrm{src} = \frac{I}{2} \begin{pmatrix} 1 + f_p\cos 2\chi & f_p\sin 2\chi \\ f_p\sin 2\chi & 1 - f_p\cos 2\chi \end{pmatrix}\end{equation}
Applying the identities $1 + \cos 2\chi = 2\cos^2\chi$
,
$1 + \cos 2\chi = 2\cos^2\chi$
, $1 - \cos 2\chi = 2\sin^2\chi$
and
$1 - \cos 2\chi = 2\sin^2\chi$
and $\sin 2\chi = 2\sin\chi\cos\chi$
to each element, this separates exactly into
$\sin 2\chi = 2\sin\chi\cos\chi$
to each element, this separates exactly into
 \begin{equation} \mathbf{C}_\textrm{src} = f_p\,\mathbf{C}_\textrm{pol} + (1-f_p)\,\mathbf{C}_\textrm{noise} \end{equation}
where $\mathbf{e} = (\!\cos\chi,\;\sin\chi)^T$
and
$\mathbf{e} = (\!\cos\chi,\;\sin\chi)^T$
and
 \begin{equation} \mathbf{C}_\textrm{pol} = I\,\mathbf{e}\,\mathbf{e}^\dagger = I\begin{pmatrix} \cos^2\chi & \sin\chi\cos\chi \\ \sin\chi\cos\chi & \sin^2\chi \end{pmatrix}\end{equation}
 \begin{equation} \mathbf{C}_\textrm{noise} = \frac{I}{2} \begin{pmatrix} 1 & 0 \\ 0 & 1 \end{pmatrix}\end{equation} $\mathbf{C}_\textrm{pol}$
has rank 1 and zero determinant, which is the mathematical statement that the wave is fully coherent.
$\mathbf{C}_\textrm{pol}$
has rank 1 and zero determinant, which is the mathematical statement that the wave is fully coherent. $\mathbf{C}_\textrm{noise}$
is proportional to the identity matrix, representing equal power in both channels with no cross-correlation, the mathematical statement of a fully incoherent wave. The decomposition in Equation (A2) is exact and carries no approximation.
$\mathbf{C}_\textrm{noise}$
is proportional to the identity matrix, representing equal power in both channels with no cross-correlation, the mathematical statement of a fully incoherent wave. The decomposition in Equation (A2) is exact and carries no approximation.
The full system Jones matrix is $\mathbf{M}(\,f) = \mathbf{M}_\textrm{QH}(\,f)\,\mathbf{J}(\,f)$
, where the feed Jones matrix follows the notation of Equation (2)
$\mathbf{M}(\,f) = \mathbf{M}_\textrm{QH}(\,f)\,\mathbf{J}(\,f)$
, where the feed Jones matrix follows the notation of Equation (2)
 \begin{equation} \mathbf{J}(\,f) = \begin{pmatrix} G_x(\,f) & d_x(\,f) \\ d_y(\,f) & G_y(\,f) \end{pmatrix}\end{equation}
with $G_x(\,f)$
and
$G_x(\,f)$
and $G_y(\,f)$
the complex gains of the X and Y channels and
$G_y(\,f)$
the complex gains of the X and Y channels and $d_x(\,f)$
,
$d_x(\,f)$
, $d_y(\,f)$
the complex leakage terms, all of which are in general frequency-dependent. Critically, the gain magnitudes
$d_y(\,f)$
the complex leakage terms, all of which are in general frequency-dependent. Critically, the gain magnitudes $|G_x(\,f)|$
and
$|G_x(\,f)|$
and $|G_y(\,f)|$
are not equal and their ratio varies across the band, producing a frequency-dependent power imbalance between the two channels that was established independently from the bandpass solutions of the linear feed data at the
$|G_y(\,f)|$
are not equal and their ratio varies across the band, producing a frequency-dependent power imbalance between the two channels that was established independently from the bandpass solutions of the linear feed data at the $\sim$
10% level. The quadrature hybrid Jones matrix for a branch-line coupler with phase error
$\sim$
10% level. The quadrature hybrid Jones matrix for a branch-line coupler with phase error $\delta(\,f)$
is
$\delta(\,f)$
is
 \begin{equation} \mathbf{M}_\textrm{QH}(\,f) = \frac{1}{\sqrt{2}} \begin{pmatrix} 1 & i\,e^{i\delta(\,f)} \\ 1 & -i\,e^{i\delta(\,f)} \end{pmatrix}\end{equation}
where $\delta(\,f)$
encodes the departure of the hybrid from the ideal
$\delta(\,f)$
encodes the departure of the hybrid from the ideal $90^\circ$
phase condition, which grows as the observing frequency departs from the design frequency
$90^\circ$
phase condition, which grows as the observing frequency departs from the design frequency $f_0$
. The output coherency matrix is
$f_0$
. The output coherency matrix is
 \begin{equation} \mathbf{C}_\textrm{out}(\,f) = \mathbf{M}(\,f)\,\mathbf{C}_\textrm{src}\, \mathbf{M}^\dagger(\,f)\end{equation}
Substituting Equation (A2) and using linearity of matrix multiplication
 \begin{align} \mathbf{C}_\textrm{out}(\,f) &= f_p\,\mathbf{M}(\,f)\, \mathbf{C}_\textrm{pol}\,\mathbf{M}^\dagger(\,f)\nonumber \\ &\quad + (1-f_p)\,\mathbf{M}(\,f)\,\mathbf{C}_\textrm{noise}\, \mathbf{M}^\dagger(\,f) \end{align}
We now evaluate the two terms separately. Since $\mathbf{C}_\textrm{pol} = I\,\mathbf{e}\,\mathbf{e}^\dagger$
, the first term becomes
$\mathbf{C}_\textrm{pol} = I\,\mathbf{e}\,\mathbf{e}^\dagger$
, the first term becomes $I\,(\mathbf{M}\mathbf{e})(\mathbf{M}\mathbf{e})^\dagger$
. Computing
$I\,(\mathbf{M}\mathbf{e})(\mathbf{M}\mathbf{e})^\dagger$
. Computing $\mathbf{J}(\,f)\,\mathbf{e}$
explicitly
$\mathbf{J}(\,f)\,\mathbf{e}$
explicitly
 \begin{equation} \mathbf{J}(\,f)\,\mathbf{e} = \begin{pmatrix} G_x\cos\chi + d_x\sin\chi \\ d_y\cos\chi + G_y\sin\chi \end{pmatrix}\end{equation}
The upper component is the direct response of the X channel to the incident polarised signal plus the leakage of the Y channel into X, and the lower component is the leakage of the X channel into Y plus the direct response of the Y channel. Applying $\mathbf{M}_\textrm{QH}$
and denoting the two output components as
$\mathbf{M}_\textrm{QH}$
and denoting the two output components as $\alpha(\,f)$
and
$\alpha(\,f)$
and $\beta(\,f)$
 \begin{equation}\begin{split} \alpha(\,f) = \frac{1}{\sqrt{2}}\big[&(G_x\cos\chi + d_x\sin\chi) \\ +\;& i\,e^{i\delta(\,f)}(d_y\cos\chi + G_y\sin\chi)\big]\end{split}\end{equation}
 \begin{equation}\begin{split} \beta(\,f) = \frac{1}{\sqrt{2}}\big[&(G_x\cos\chi + d_x\sin\chi) \\ -\;& i\,e^{i\delta(\,f)}(d_y\cos\chi + G_y\sin\chi)\big]\end{split}\end{equation}
The off-diagonal element of $I(\mathbf{M}\mathbf{e})(\mathbf{M}\mathbf{e})^\dagger$
gives the direct signal cross-coherency
$I(\mathbf{M}\mathbf{e})(\mathbf{M}\mathbf{e})^\dagger$
gives the direct signal cross-coherency
 \begin{align} \mathcal{S}_\textrm{direct}(\,f) &= I\,\alpha(\,f)\,\beta^*(\,f) \nonumber \\ & = \frac{I}{2}\big[(G_x\cos\chi + d_x\sin\chi)^2\nonumber \\ &\quad + e^{2i\delta(\,f)}(d_y\cos\chi + G_y\sin\chi)^2\big] \end{align}
For the second term, since $\mathbf{C}_\textrm{noise} = \frac{I}{2}\mathbf{I}$
, we have
$\mathbf{C}_\textrm{noise} = \frac{I}{2}\mathbf{I}$
, we have $\frac{I}{2}\,\mathbf{M}(\,f)\,\mathbf{M}^\dagger(\,f)$
. Computing
$\frac{I}{2}\,\mathbf{M}(\,f)\,\mathbf{M}^\dagger(\,f)$
. Computing $\mathbf{M}\,\mathbf{M}^\dagger = \mathbf{M}_\textrm{QH}\,\mathbf{J}\,\mathbf{J}^\dagger\,\mathbf{M}_\textrm{QH}^\dagger$
and extracting the off-diagonal element gives the leakage cross-coherency
$\mathbf{M}\,\mathbf{M}^\dagger = \mathbf{M}_\textrm{QH}\,\mathbf{J}\,\mathbf{J}^\dagger\,\mathbf{M}_\textrm{QH}^\dagger$
and extracting the off-diagonal element gives the leakage cross-coherency
 \begin{equation}\begin{split} \mathcal{S}_\textrm{leak}(\,f) = \frac{I}{4}\big[& \left(|G_x|^2 + |d_x|^2\right) - \left(|d_y|^2 + |G_y|^2\right) \\ -\;& 2i\,e^{i\delta(\,f)}\,\textrm{Re}\big[G_x d_y^* + d_x G_y^*\big]\big] \end{split}\end{equation}
Equation (A13) makes the physical origin of the leakage cross-coherency explicit. The first bracket, $(|G_x(\,f)|^2 + |d_x(\,f)|^2) - (|d_y(\,f)|^2 + |G_y(\,f)|^2)$
, is the frequency-dependent power imbalance between the two channels. This term is non-zero whenever the total power in the X channel differs from that in the Y channel, and since
$(|G_x(\,f)|^2 + |d_x(\,f)|^2) - (|d_y(\,f)|^2 + |G_y(\,f)|^2)$
, is the frequency-dependent power imbalance between the two channels. This term is non-zero whenever the total power in the X channel differs from that in the Y channel, and since $|G_x(\,f)|$
and
$|G_x(\,f)|$
and $|G_y(\,f)|$
vary differently across the band, this imbalance has a non-trivial spectral structure even in the complete absence of any geometric feed leakage. The second bracket,
$|G_y(\,f)|$
vary differently across the band, this imbalance has a non-trivial spectral structure even in the complete absence of any geometric feed leakage. The second bracket, $\textrm{Re}[G_x(\,f)\,d_y^*(\,f) + d_x(\,f)\,G_y^*(\,f)]$
, is non-zero whenever the leakage terms
$\textrm{Re}[G_x(\,f)\,d_y^*(\,f) + d_x(\,f)\,G_y^*(\,f)]$
, is non-zero whenever the leakage terms $d_x(\,f)$
,
$d_x(\,f)$
, $d_y(\,f)$
are non-zero, that is whenever there is any cross-coupling between the two polarisation channels in the feed. In the ideal case
$d_y(\,f)$
are non-zero, that is whenever there is any cross-coupling between the two polarisation channels in the feed. In the ideal case $d_x = d_y = 0$
and
$d_x = d_y = 0$
and $|G_x(\,f)| = |G_y(\,f)|$
for all f, both brackets vanish identically and
$|G_x(\,f)| = |G_y(\,f)|$
for all f, both brackets vanish identically and $\mathcal{S}_\textrm{leak} = 0$
exactly. In the real system both conditions are violated across the observing band. The cross-correlation between L and R is the off-diagonal element of
$\mathcal{S}_\textrm{leak} = 0$
exactly. In the real system both conditions are violated across the observing band. The cross-correlation between L and R is the off-diagonal element of $\mathbf{C}_\textrm{out}$
 \begin{equation} \langle LR^*\rangle = f_p\,\mathcal{S}_\textrm{direct}(\,f) + (1-f_p)\,\mathcal{S}_\textrm{leak}(\,f)\end{equation}
and the observed cross-phase is therefore
 \begin{equation} \phi_\textrm{obs}(\,f,\,f_p) = \arg\!\left[\,f_p\, \mathcal{S}_\textrm{direct}(\,f) + (1-f_p)\,\mathcal{S}_\textrm{leak}(\,f) \right] \end{equation}
Since $\mathcal{S}_\textrm{direct}$
and
$\mathcal{S}_\textrm{direct}$
and $\mathcal{S}_\textrm{leak}$
are in general complex quantities with different phases, the argument of their weighted sum rotates continuously as
$\mathcal{S}_\textrm{leak}$
are in general complex quantities with different phases, the argument of their weighted sum rotates continuously as $f_p$
changes, producing a cross-phase that depends systematically on the fractional polarisation of the observed source. The magnitude of this dependence is set by the angle between
$f_p$
changes, producing a cross-phase that depends systematically on the fractional polarisation of the observed source. The magnitude of this dependence is set by the angle between $\mathcal{S}_\textrm{direct}$
and
$\mathcal{S}_\textrm{direct}$
and $\mathcal{S}_\textrm{leak}$
in the complex plane, which is determined by the frequency-dependent gain mismatch
$\mathcal{S}_\textrm{leak}$
in the complex plane, which is determined by the frequency-dependent gain mismatch $|G_x(\,f)|/|G_y(\,f)|$
, the feed leakage amplitudes
$|G_x(\,f)|/|G_y(\,f)|$
, the feed leakage amplitudes $|d_x(\,f)|$
,
$|d_x(\,f)|$
, $|d_y(\,f)|$
, and the hybrid phase error
$|d_y(\,f)|$
, and the hybrid phase error $\delta(\,f)$
. All three of these quantities are non-negligible in the uGMRT Band 4 system across the 550–750 MHz observing band, which is why the effect is clearly observable in the data presented in this paper.
$\delta(\,f)$
. All three of these quantities are non-negligible in the uGMRT Band 4 system across the 550–750 MHz observing band, which is why the effect is clearly observable in the data presented in this paper.
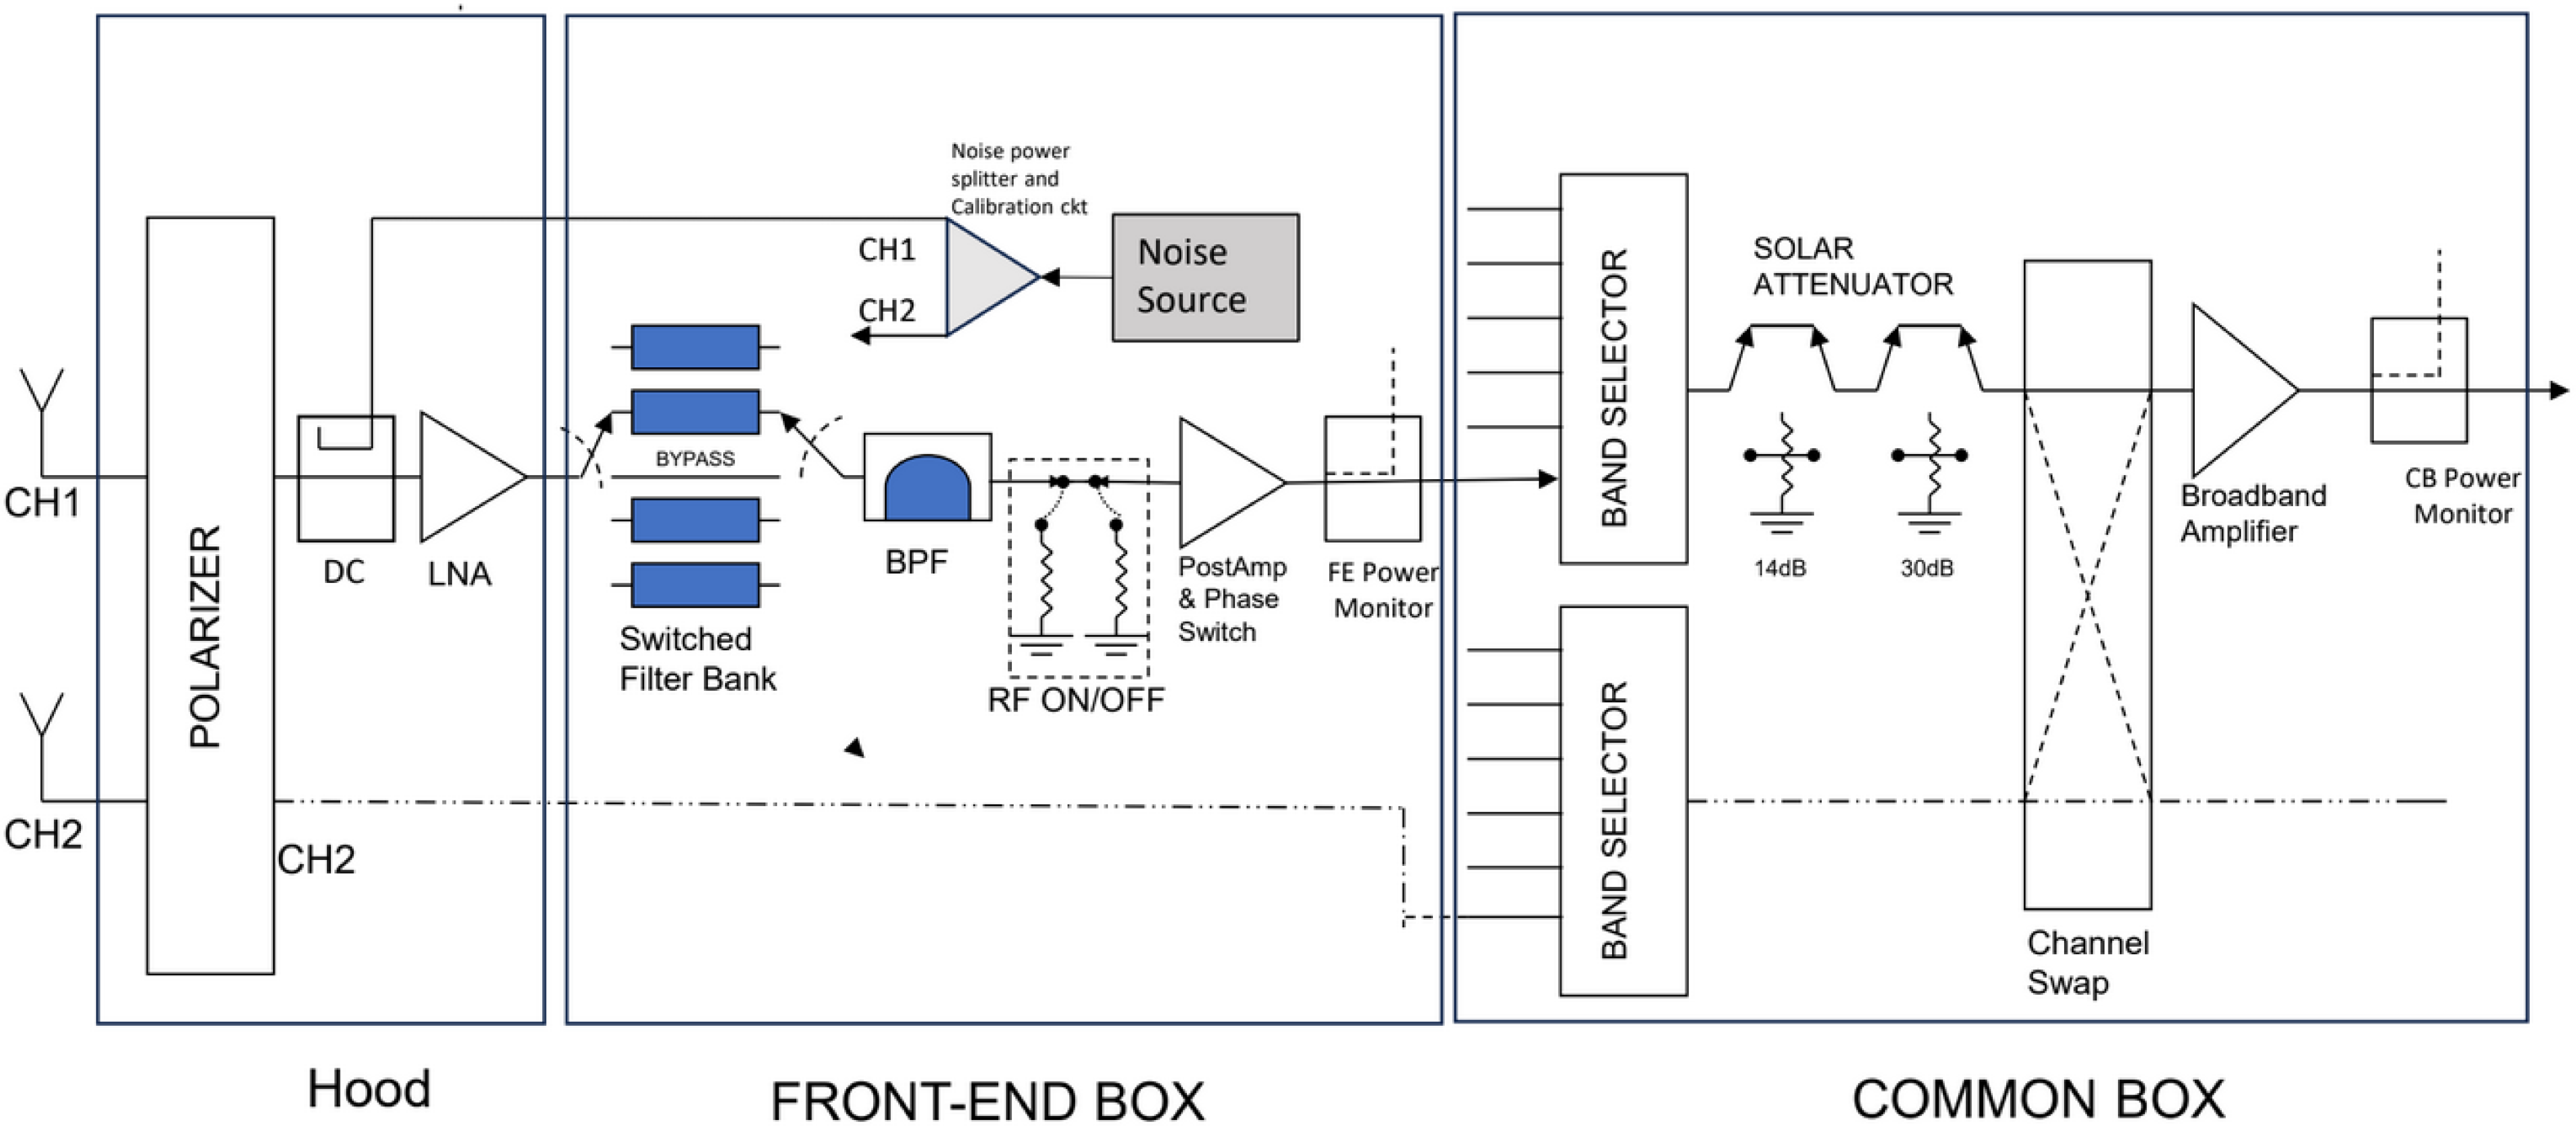
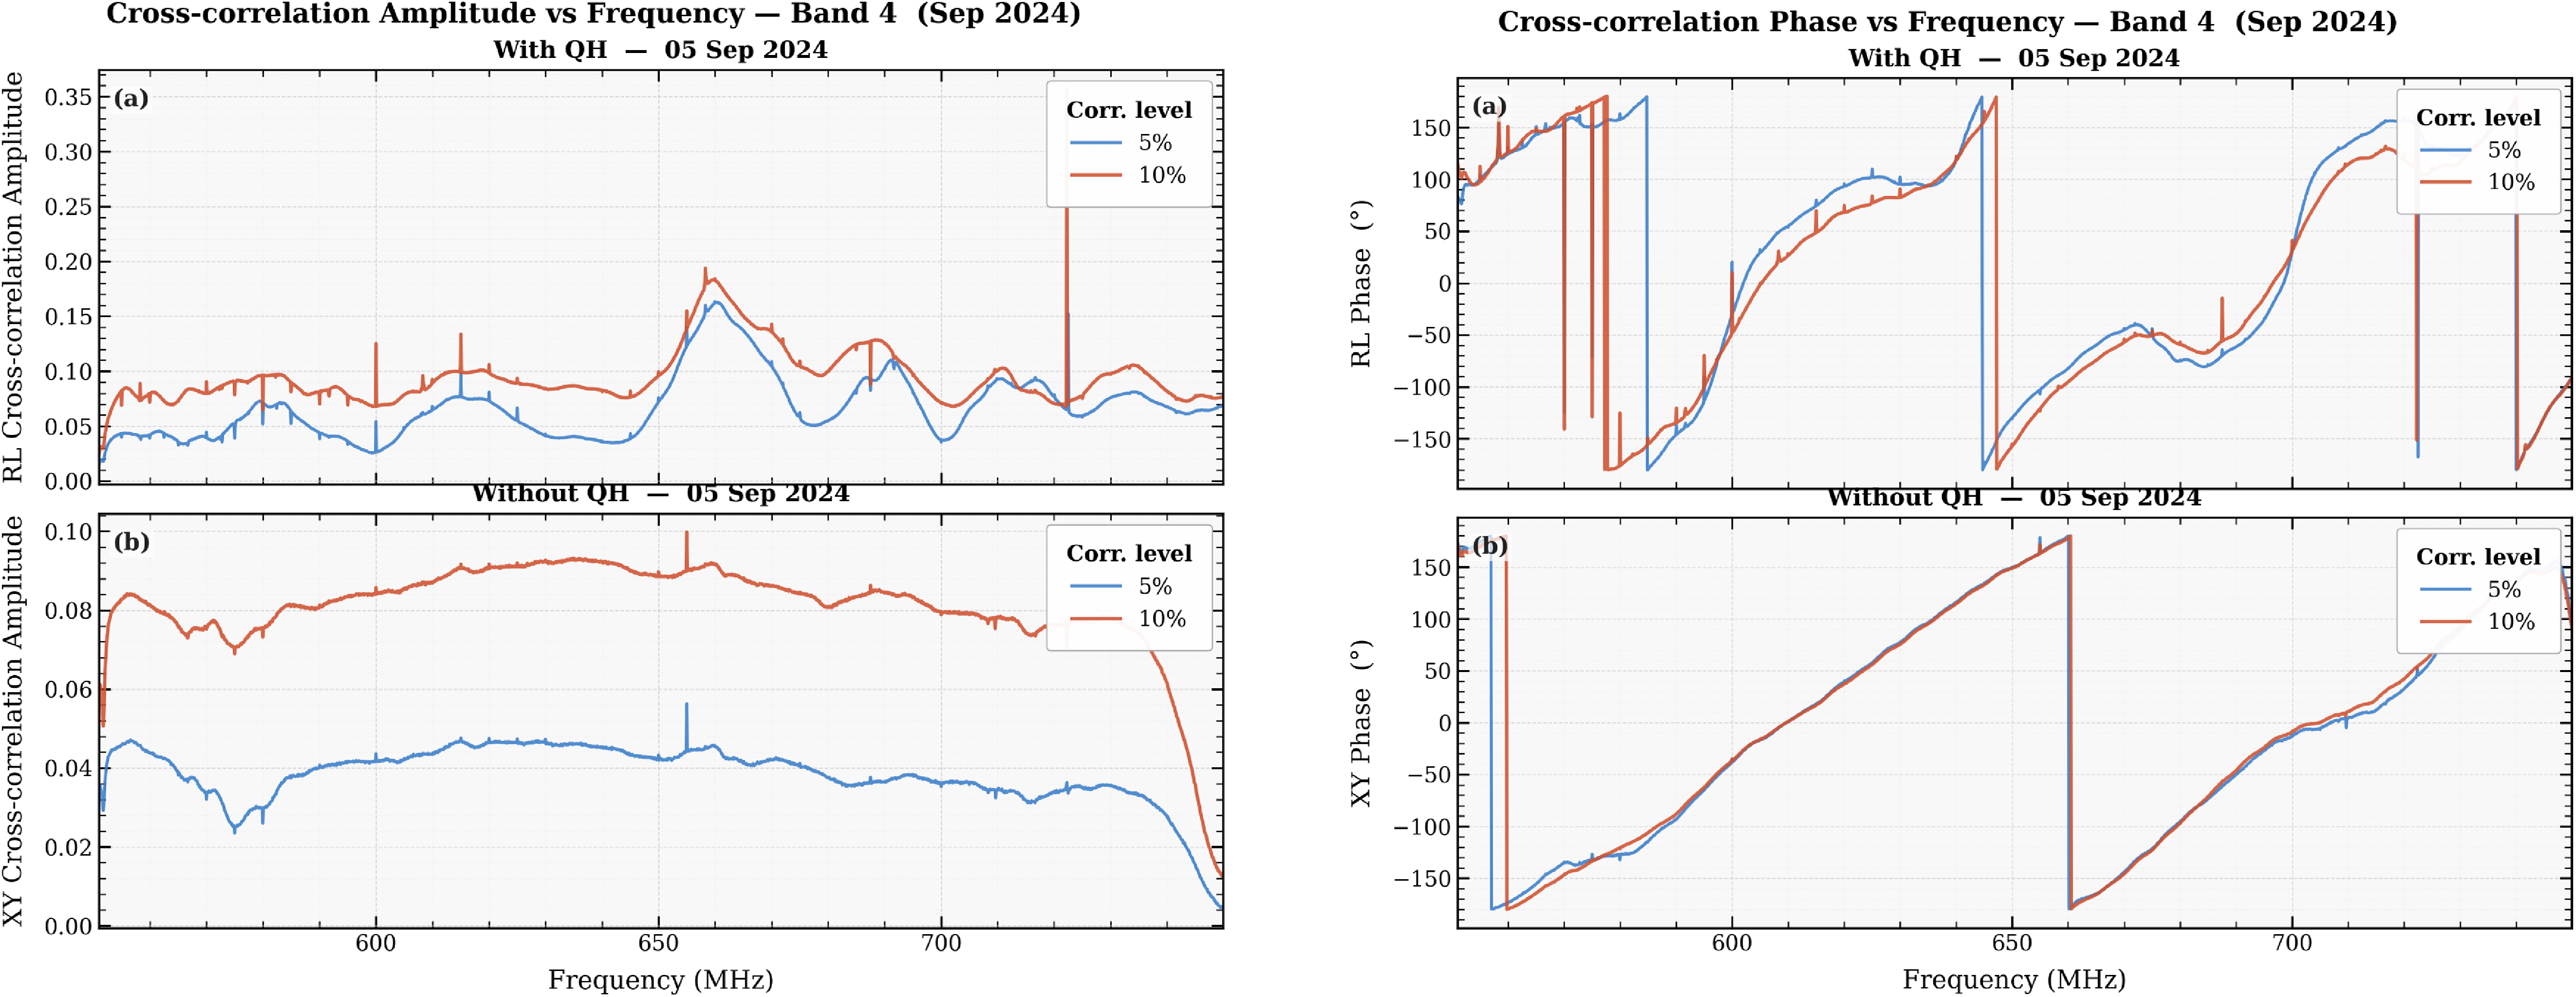
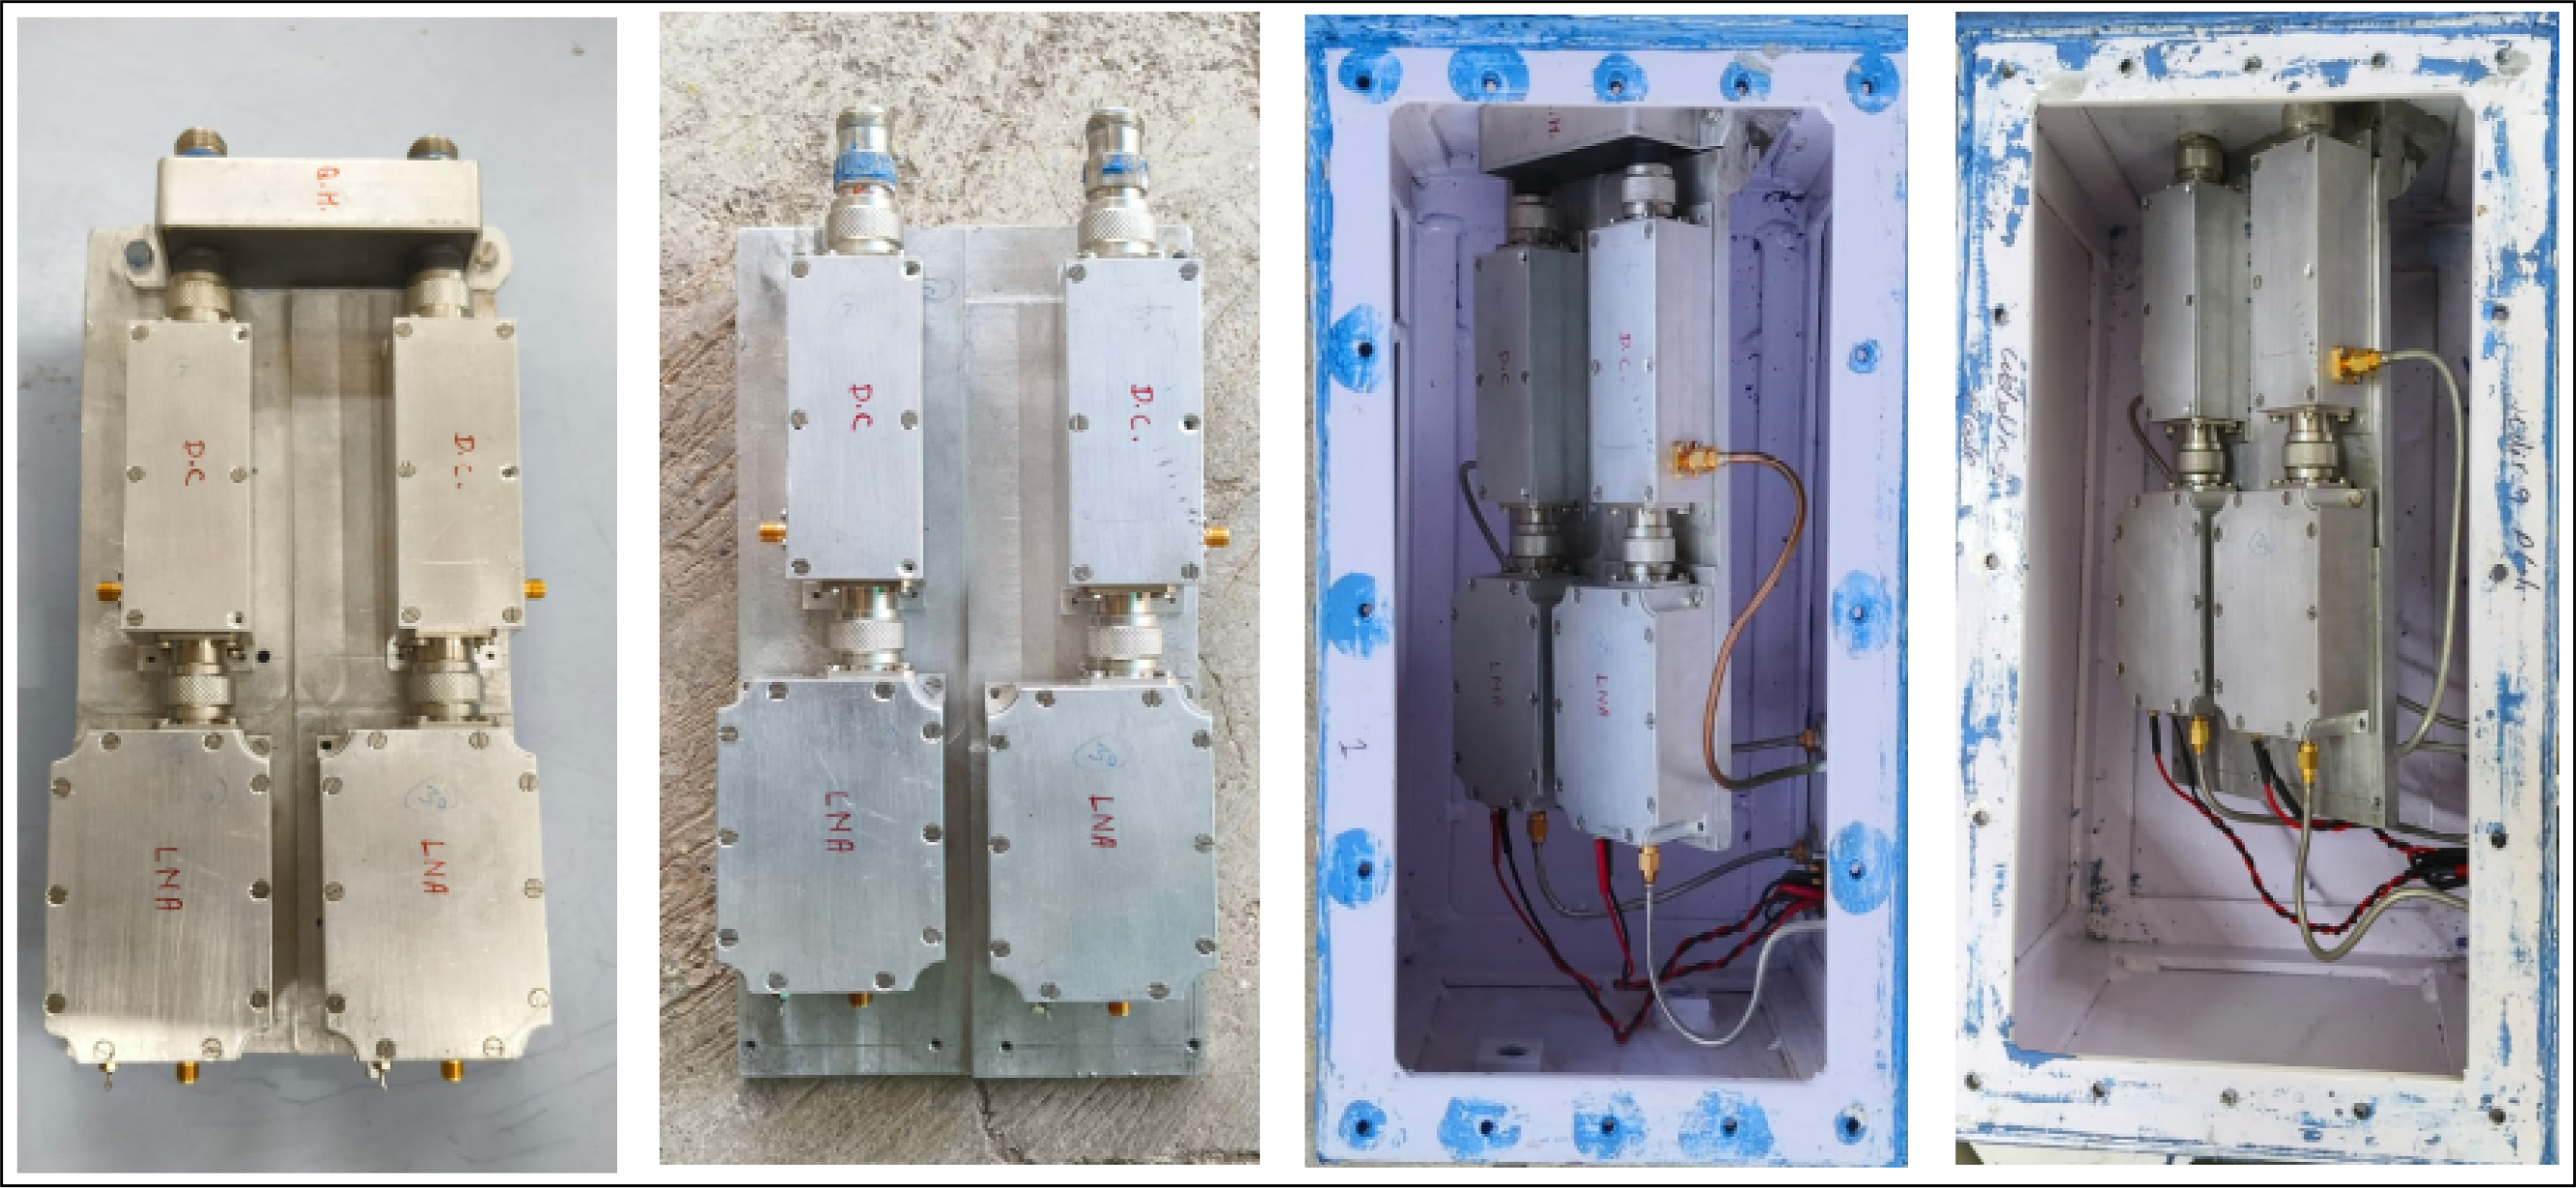
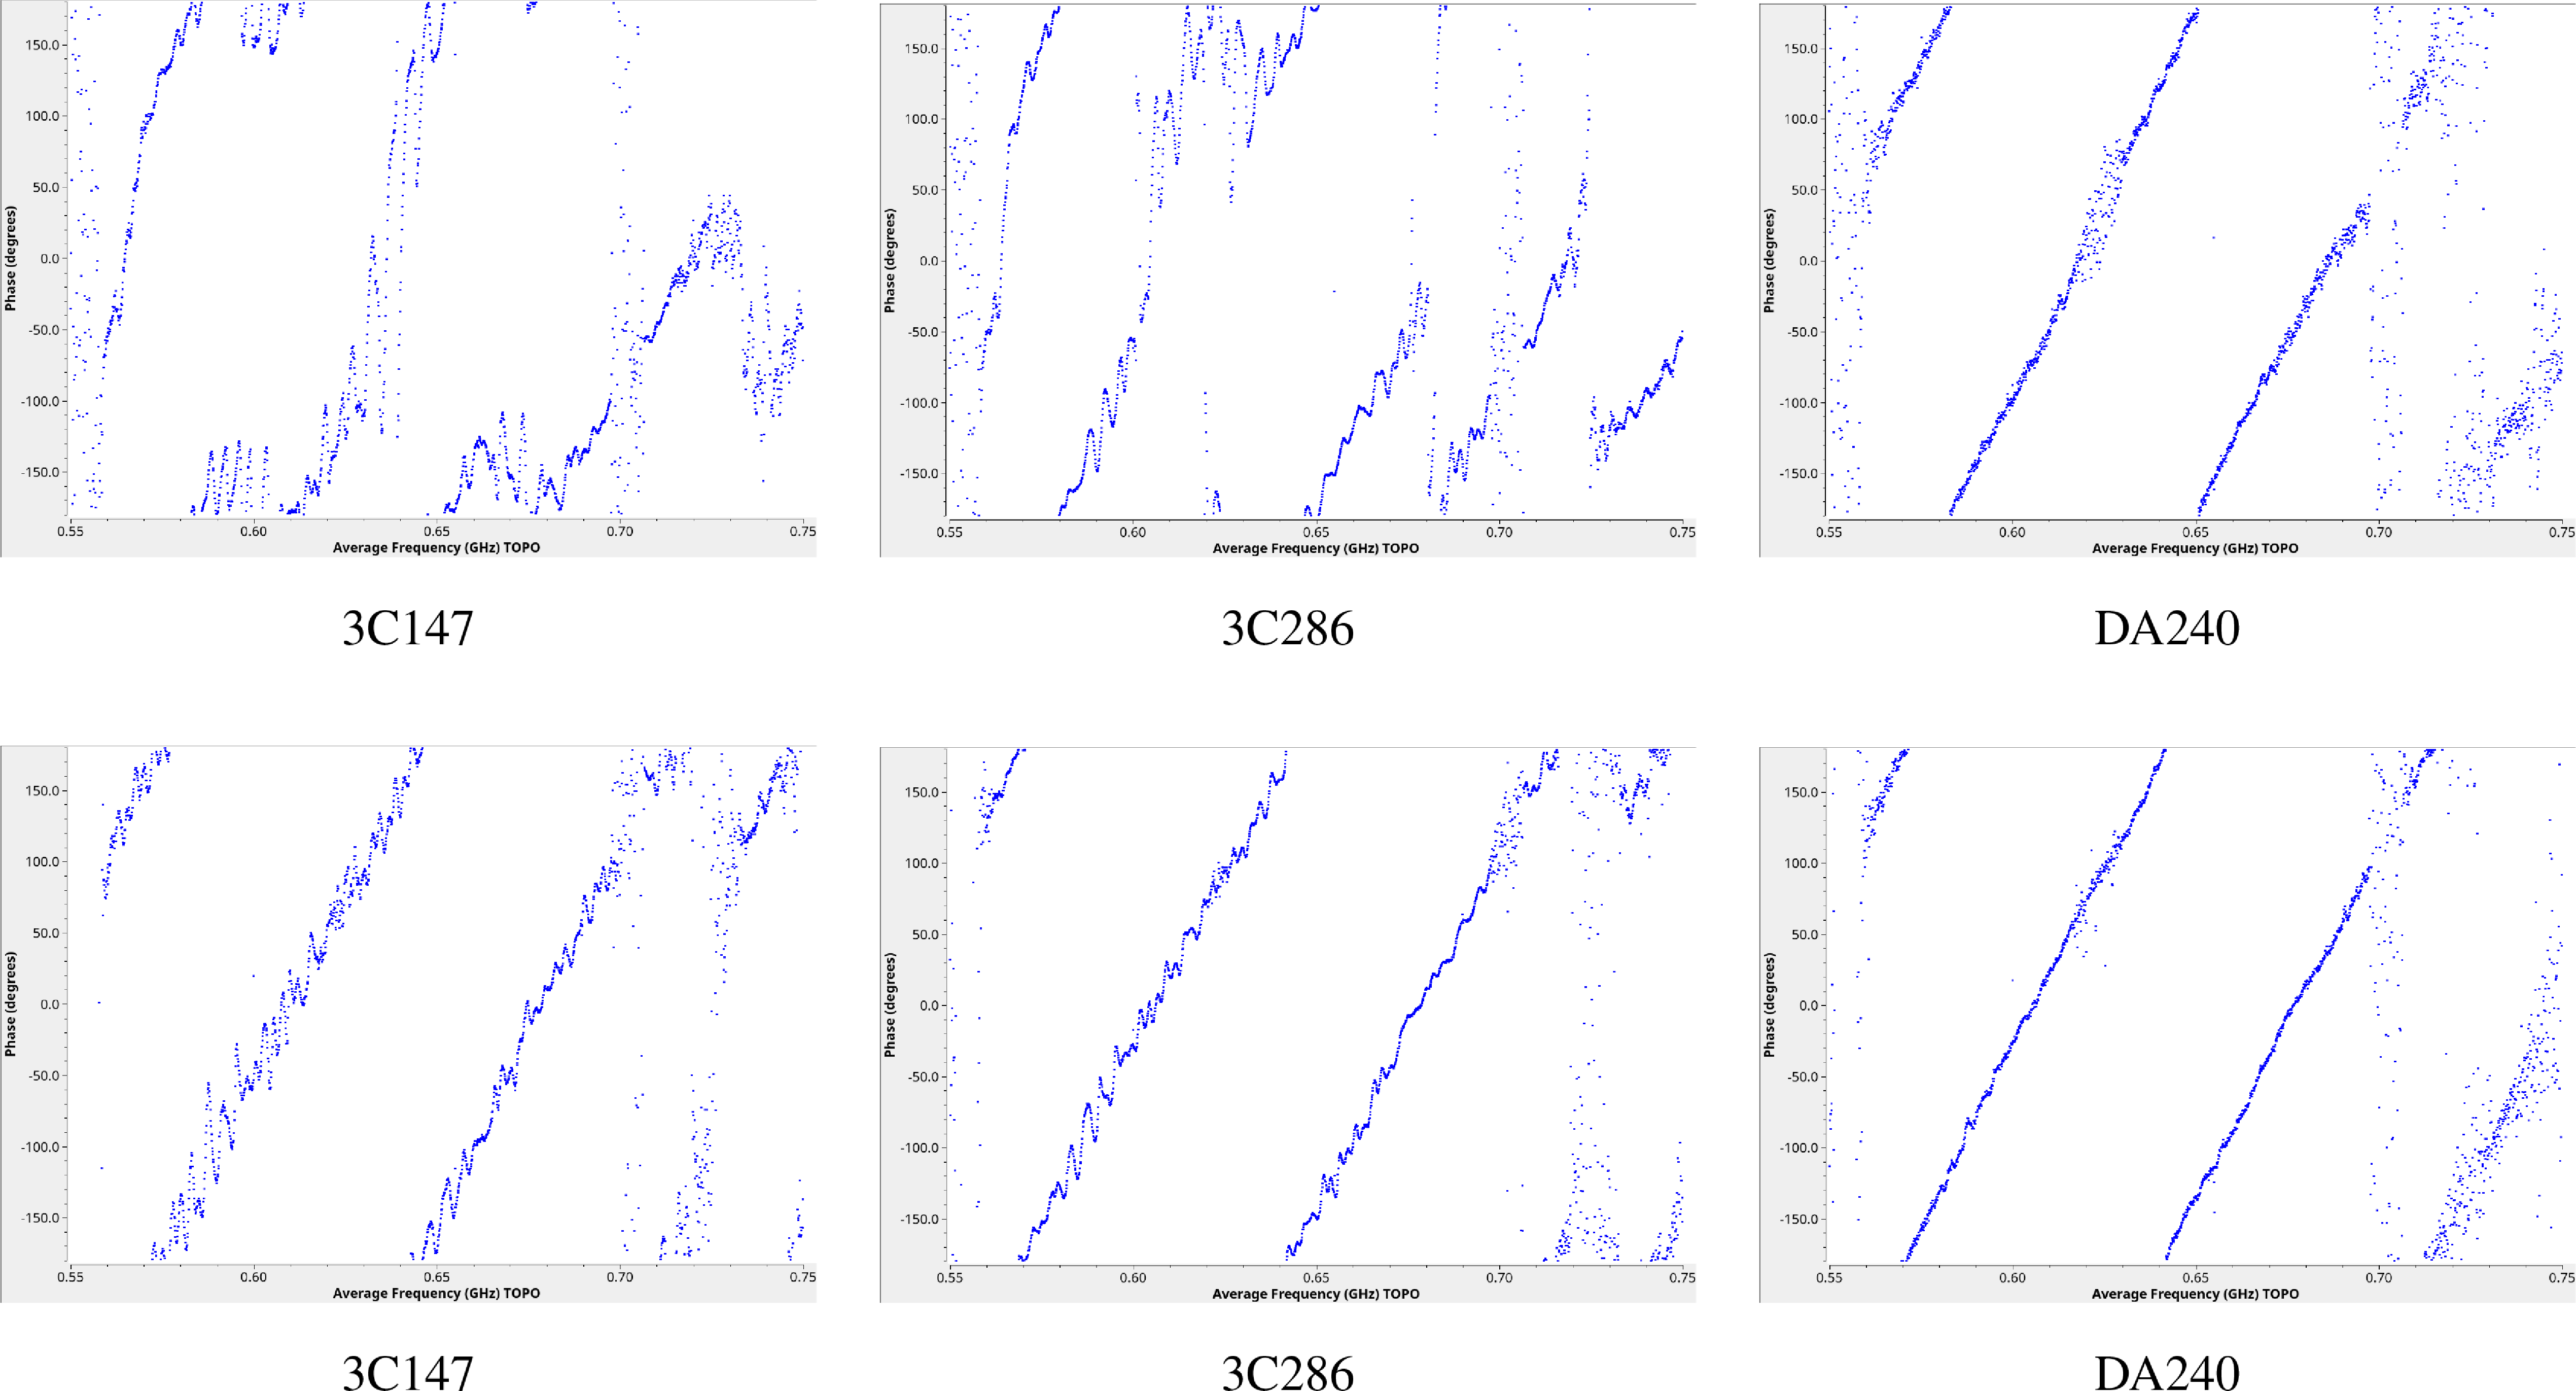
 −180
−180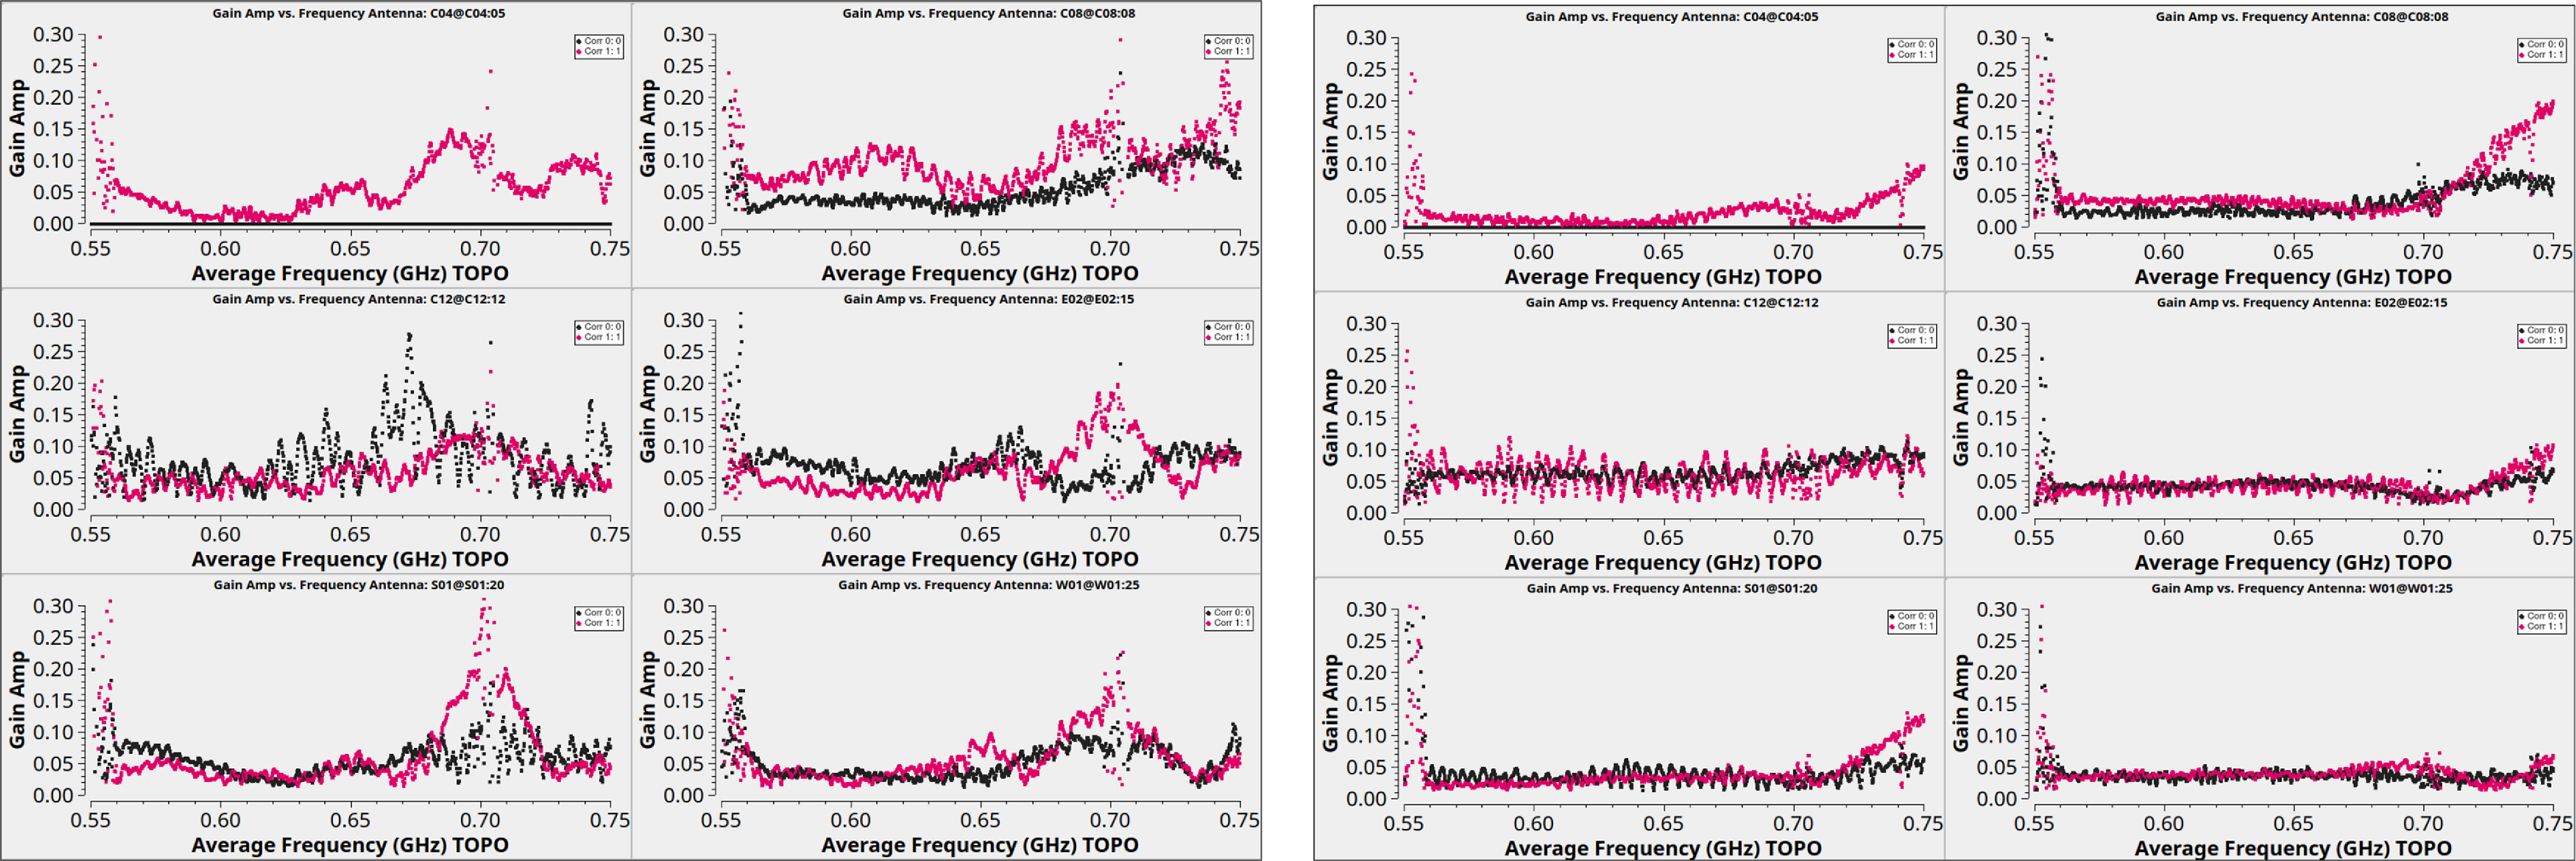
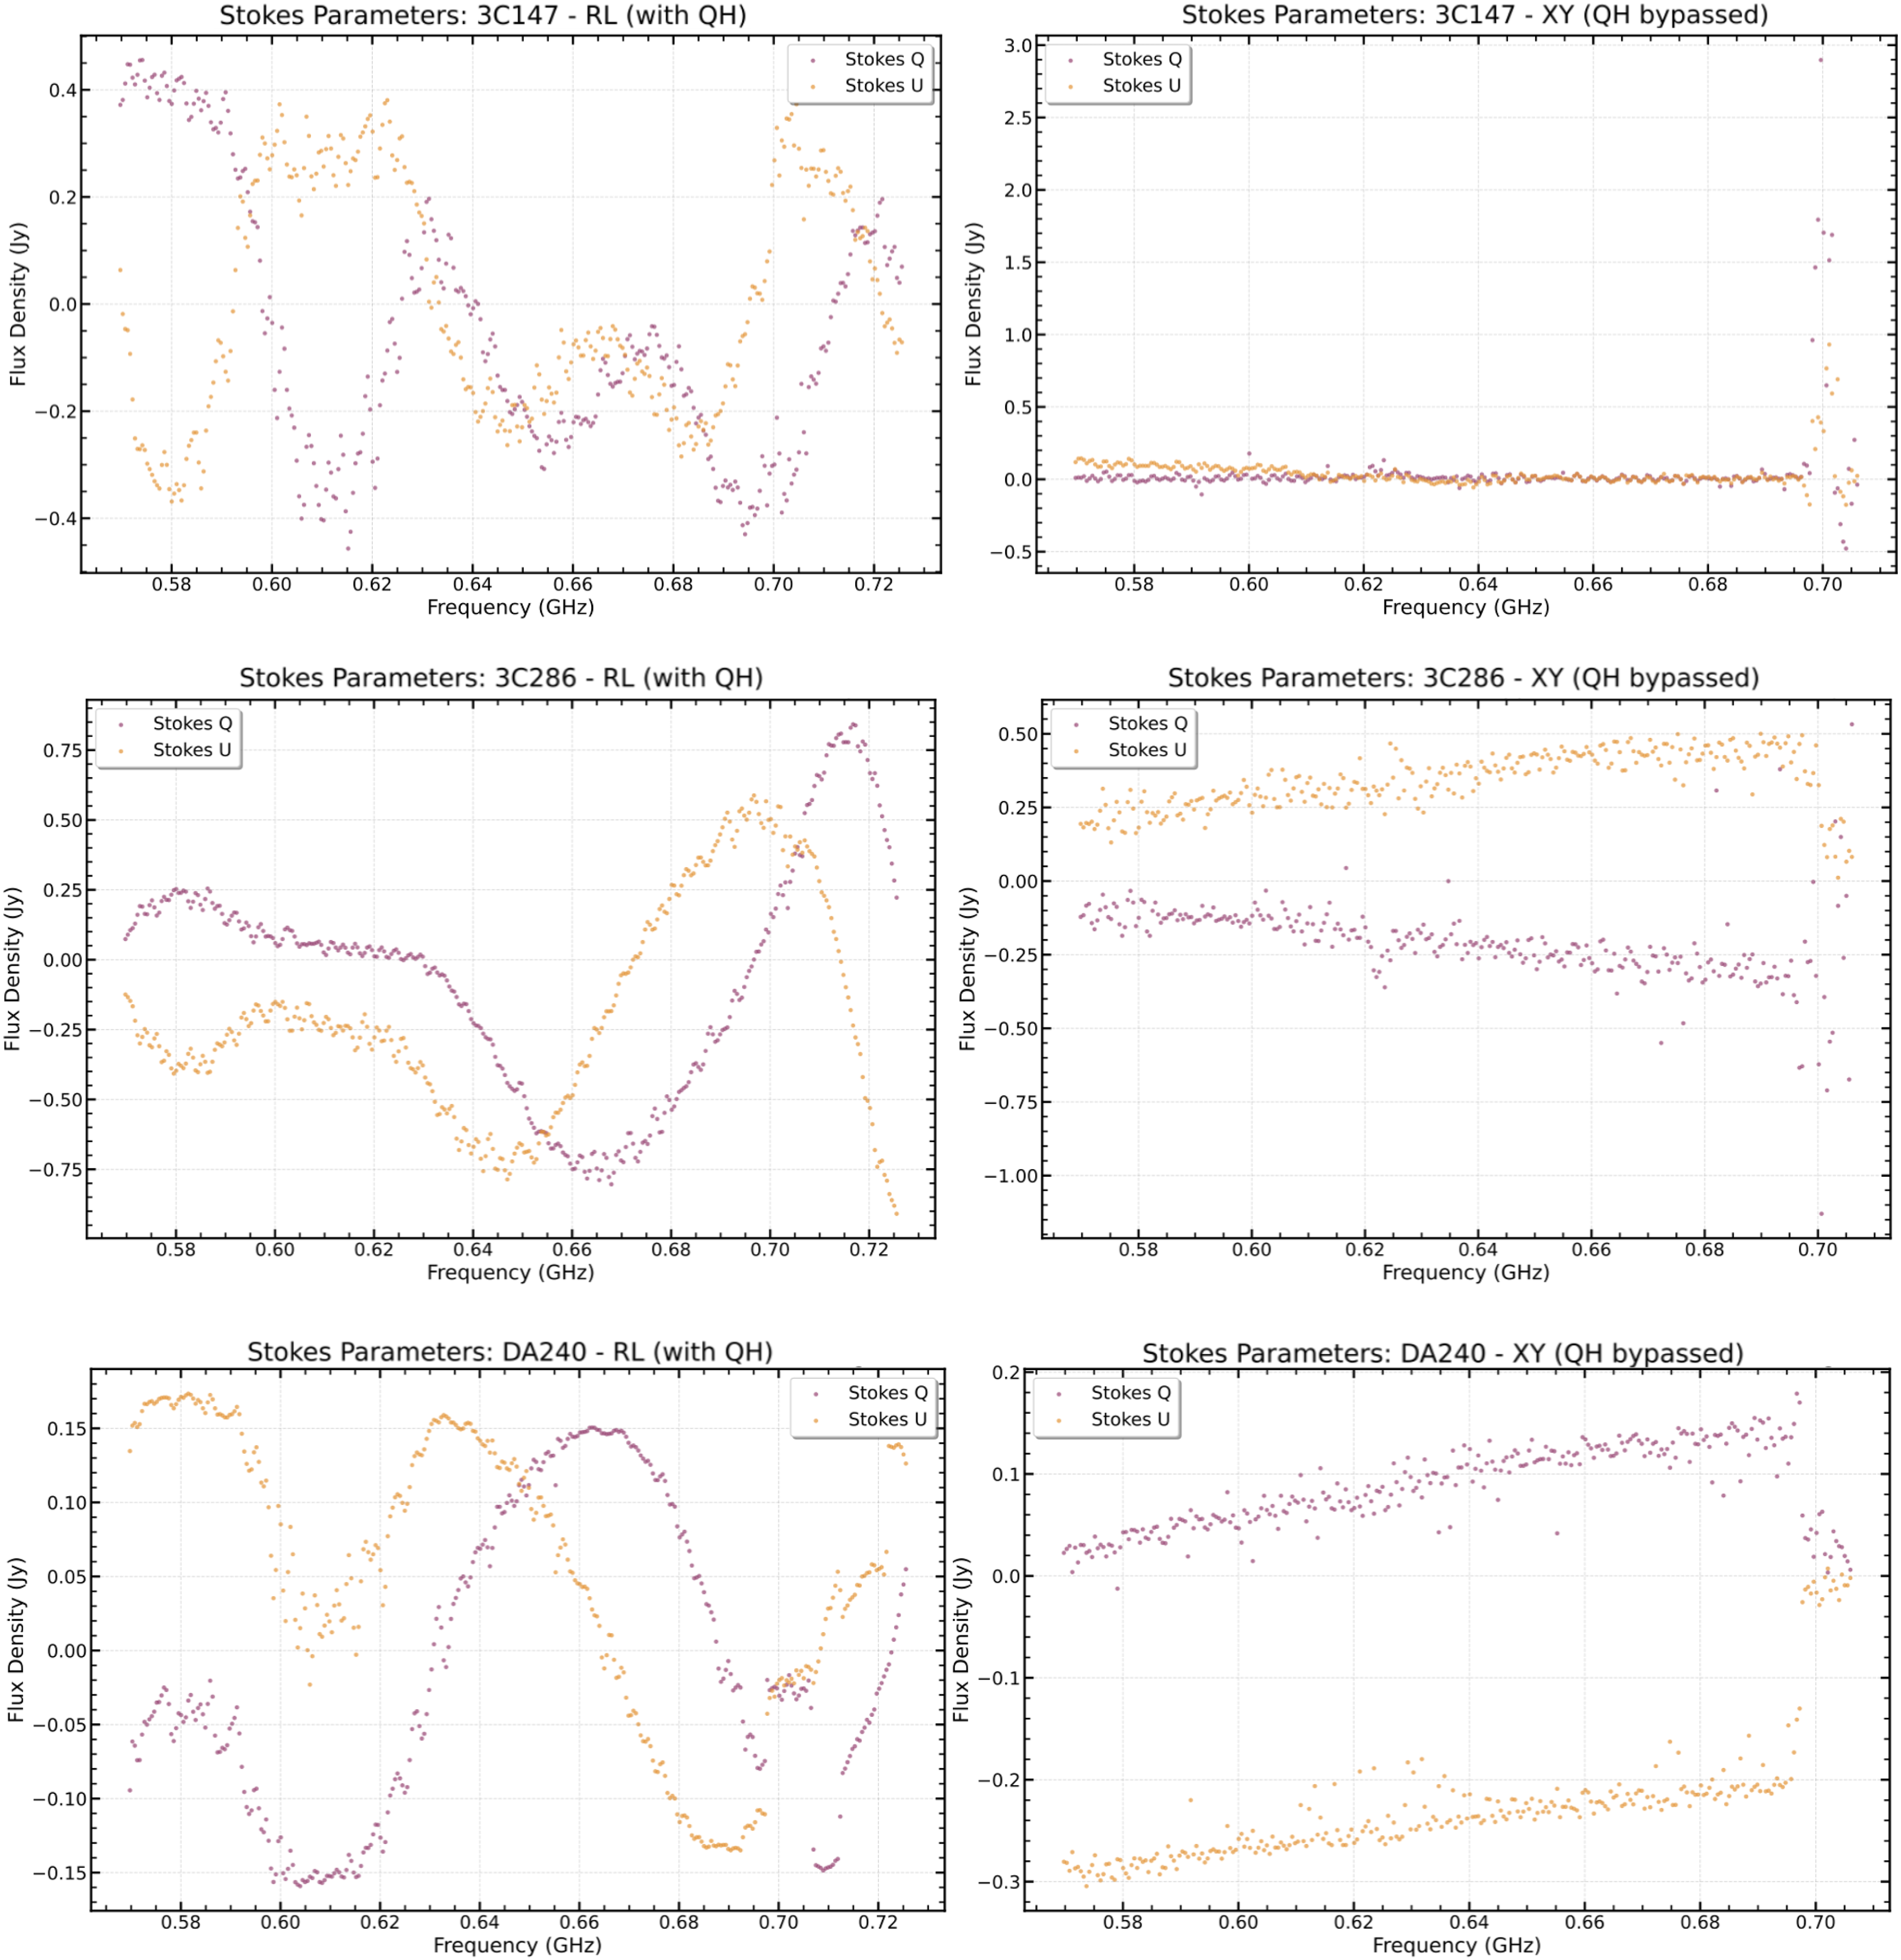
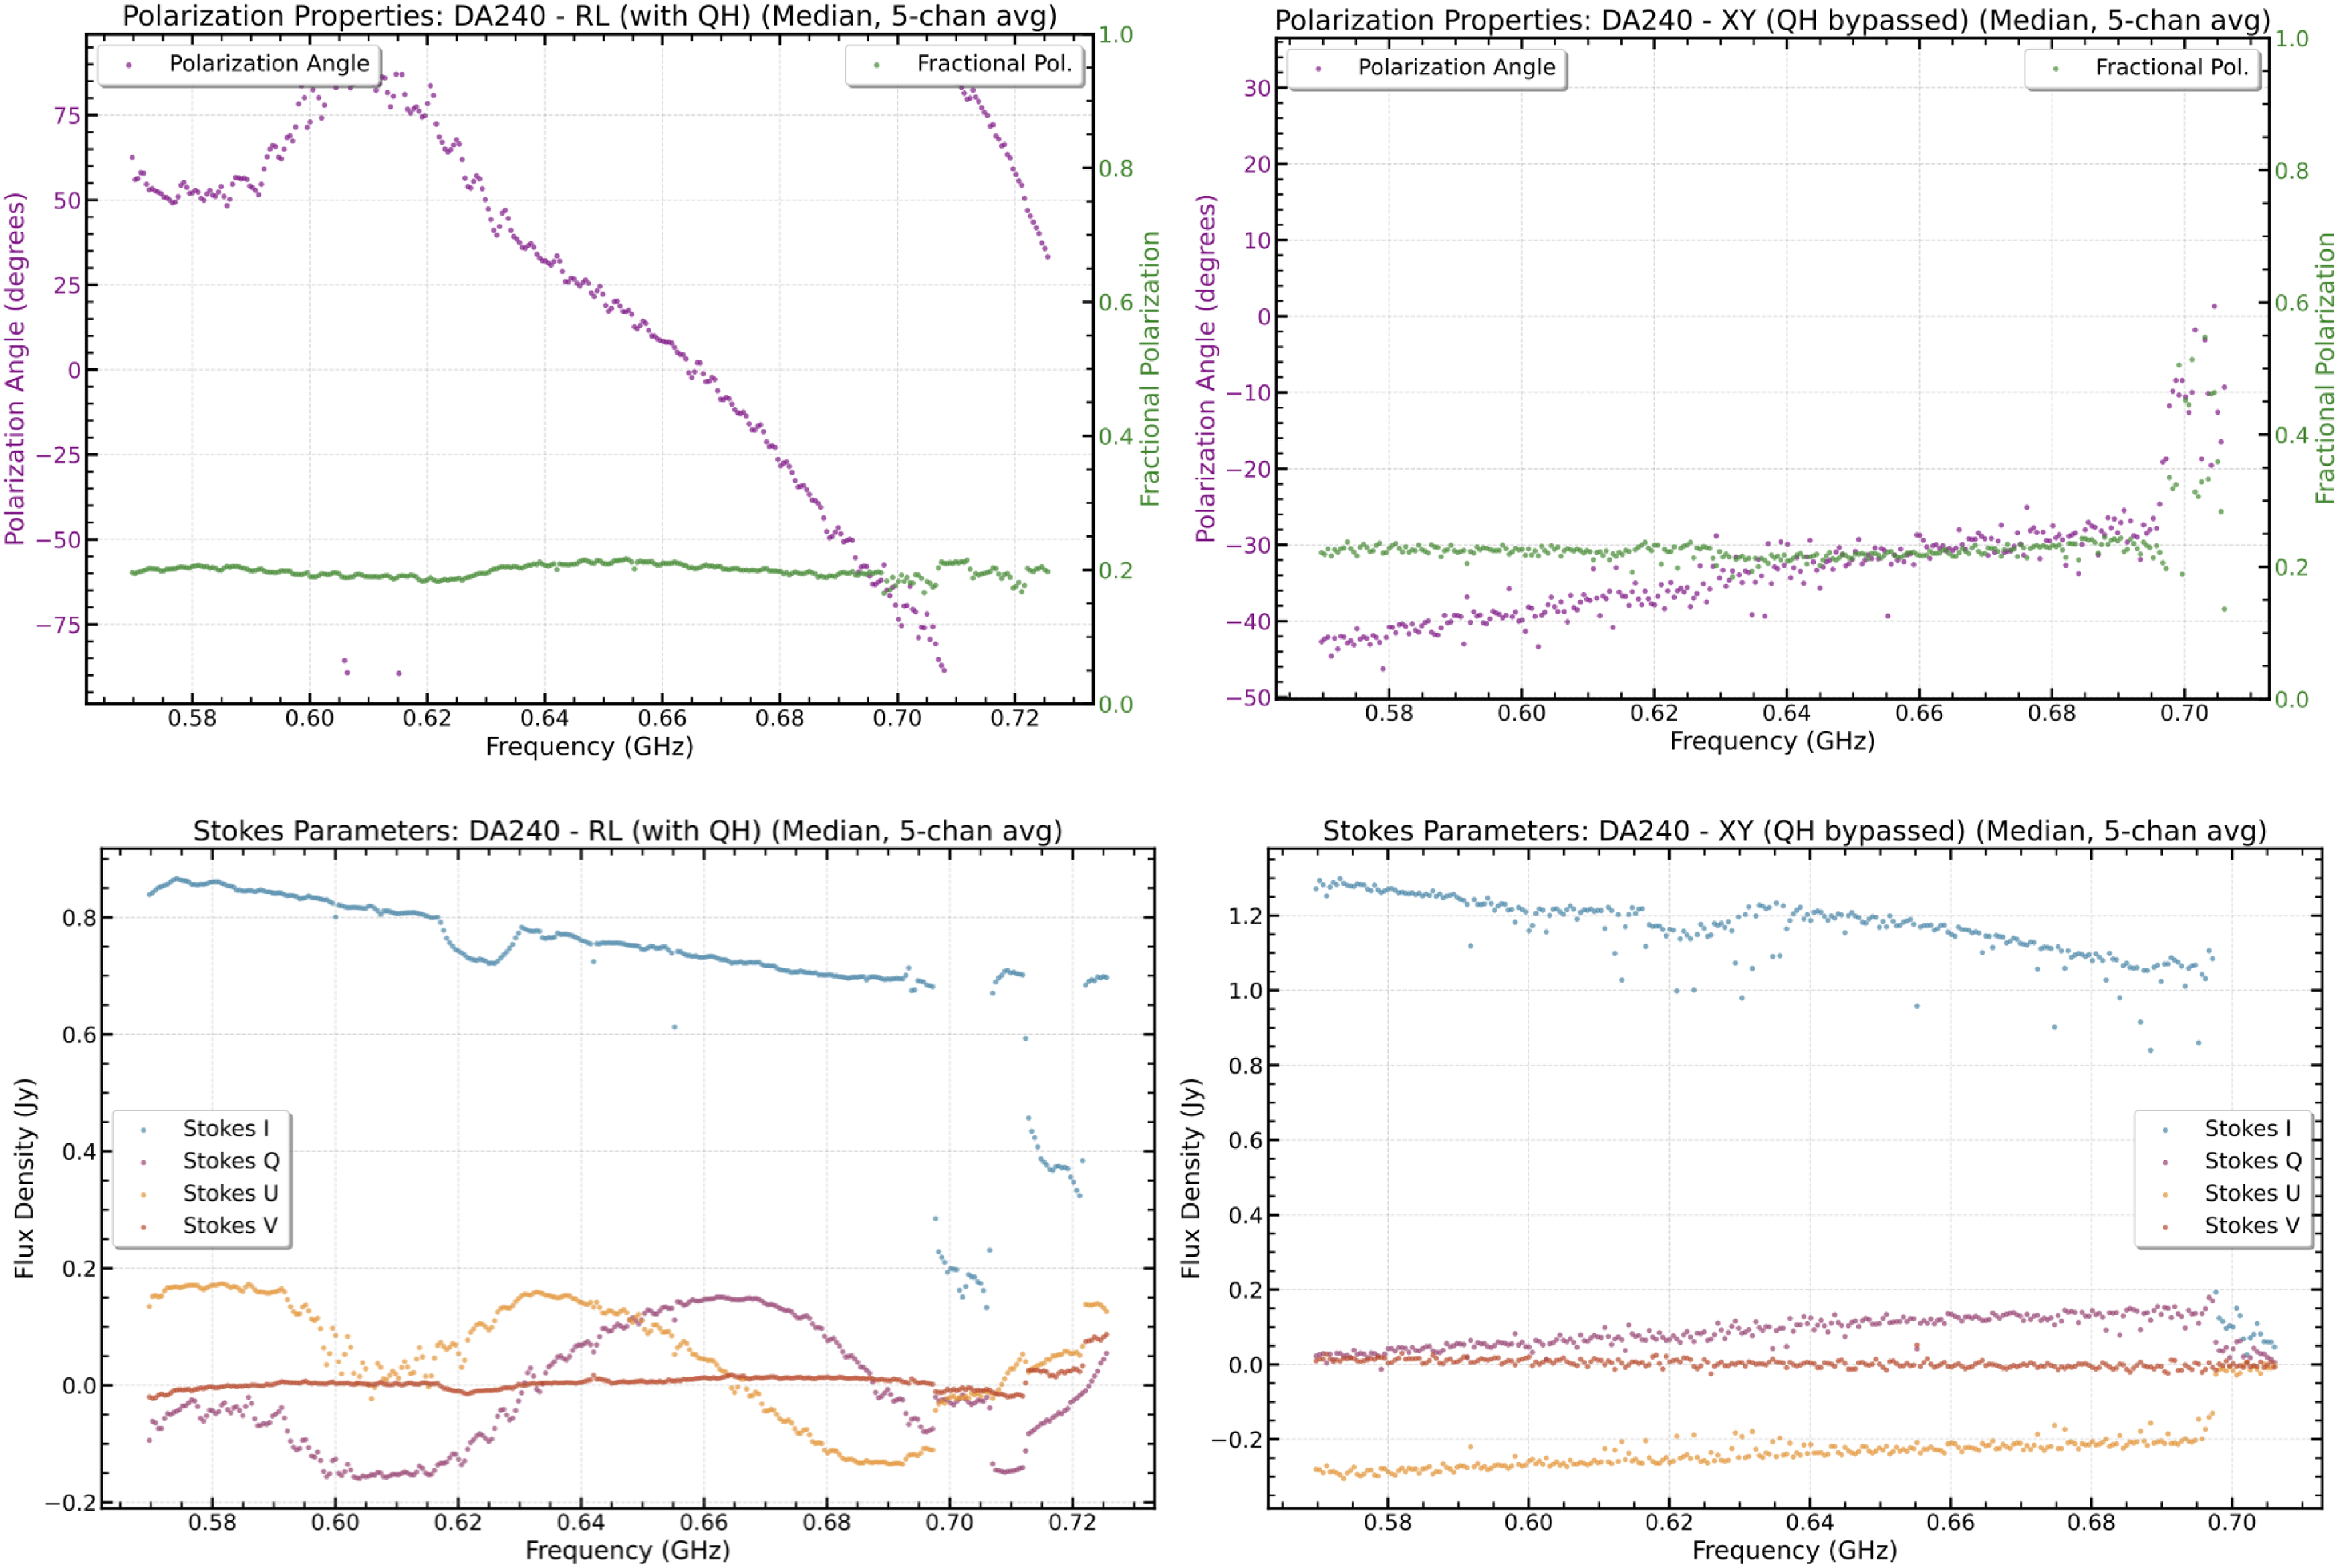
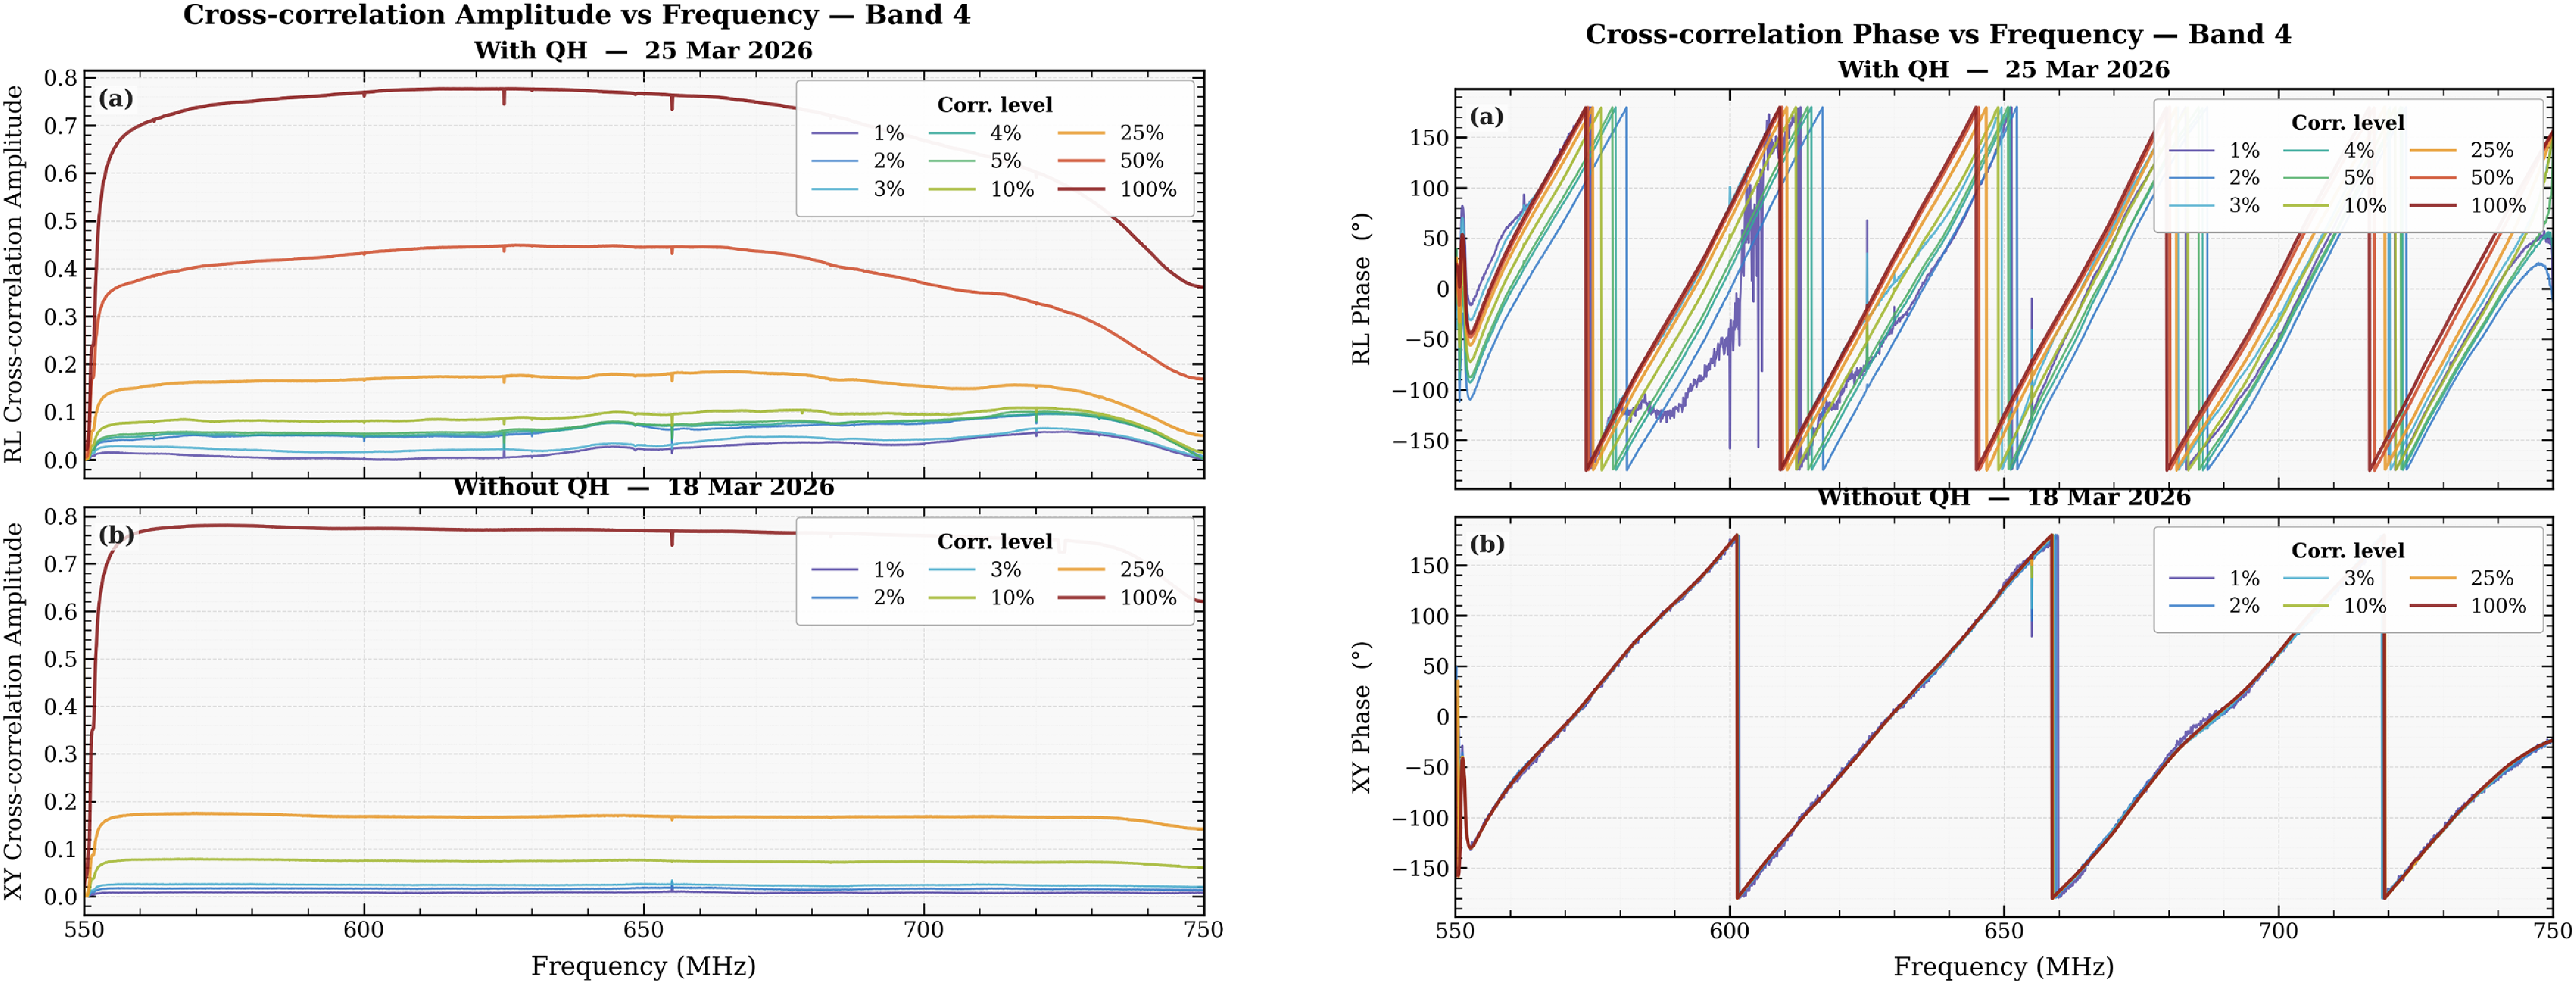

 Open access

