


Introduction
Acute respiratory infections (ARI) and acute gastroenteritis (AGE) are the most common childhood infections and transmission of these infections not only occurs in the community, but also in households [Reference Tsang1]. Adults in households with children are at high risk to acquire these infections from their children [Reference Sacri2], resulting in a substantial burden of disease, including work absenteeism [Reference Sacri2, Reference Neuzil, Hohlbein and Zhu3]. Still, temporary linked symptomatic infections in the households might not result from transmissions within households, but can be independently acquired in the community. While not a decisive proof, identification of the same pathogen in temporary linked infections would support the hypothesis of transmission. Therefore, in order to estimate the extent of within-household transmission at population level, studies collecting biologic samples are necessary, allowing the identification of pathogens. Earlier studies addressing within-household transmission used the household cohort design, for example, the Seattle Virus Watch study [Reference Fox, Cooney and Hall4] or the Tecumseh study of illness [Reference Monto, Koopman and Longini5]. But more recently, mainly with a focus on influenza, so-called household transmission studies were applied (review by Tsang et al. [Reference Tsang1]). These studies start from an index case fulfilling a specific case definition and thus have a more efficient design for assessing transmission probability of specific pathogens [Reference Klick, Leung and Cowling6, Reference Klick7]. However, in order to estimate the overall proportion of household transmission within families, we applied the household cohort design. High costs and difficult logistics have been a likely hindrance for a broader use of this study design including biologic sample collection. At the same time, recent studies have demonstrated that participants are able to reliably collect nasal swabs for the analysis of respiratory viruses on their own or from their children [Reference Plymoth8–Reference Byington10]. Taking advantage of self-collected swabs, we aimed to estimate, which proportion of ARI and AGE is introduced and transmitted by children in German households with children attending child care.
Materials and methods
Recruitment and study population
From November 2014 to March 2015, we conducted a prospective cohort study over a study period of 4 months and recruited families in 75 of 151 day care centres (DCCs) in Braunschweig, Lower Saxony, Germany. A subsample of the study population (n = 95 households) focused on the transmission of respiratory and gastrointestinal infections within families. In this prospective subsample, the participants (typically one of the parents) kept a daily diary of infection episodes for all household members and nasal swabs were collected in case of respiratory infection symptoms. The study protocol was approved by the Ethics Committee of Hannover Medical School (No. 2380-2014) and reviewed by the Federal Commissioner for Data Protection and Freedom of Information. Written informed consent was obtained from the children's parents, acting as their legal guardians.
Procedures: capturing of infection episodes and identification of pathogens
Definitions of infection episodes were provided for participants at the start of the study. ARI required either one of the symptoms of category ‘A’ (fever, wheezing, cough with sputum, medically diagnosed otitis media or pneumonia) and/or at least two (or more) symptoms of category ‘B’ (e.g. sore throat; see Supplementary Material 1 for details) [Reference Lambert11, Reference Lambert12]. AGE was defined as at least three-time liquid/pasty stool and/or at least one time vomiting per day (see Supplementary Material 1) [13]. Based on the health diary, the beginning and end of an infection episode for every household member as well as transmission of infection within the household was assessed. Demographic data on household members (sex, age) were collected on the first page of the health diary. Participants were reminded twice to send back the study materials (questionnaires, health diaries). In case of respiratory infections, a self-administered nasal swab should be taken on the first day with symptoms of a new infection episode. An infection episode was considered as new if there were at least 3 consecutive days without symptoms since the preceding episode. Participants received materials for obtaining nasal swabs, a description how to use them and reply-paid envelopes. All nasal swabs were tested for six viruses (influenza A and B viruses, human metapneumovirus, respiratory syncytial virus, adenovirus and picornaviruses (including rhino- and enteroviruses)) in the laboratory of the Governmental Institute of Public Health of Lower Saxony, using a TaqMan polymerase chain reaction (PCR) and cell cultures.
Statistical analysis
First, we calculated overall and age-specific incidence rates for ARI and AGE. Second, we analysed the probability of transmission of infections within households based on symptoms only. For the base case analysis, we assumed a transmission when two individuals in the household showed symptoms in overlapping intervals, but episodes of infection starting on the same day in two family members were not considered as transmission.
For the identification of transmission events on pathogen level, we additionally used results from the laboratory testing in case of ARI. If more than one swab per episode was sent or more than one pathogen was detected per swab, we considered all results. For AGE, transmission was solely assessed on the symptom level, because no biologic samples were collected.
In sensitivity analyses, if the participant entered the cohort while having symptoms, we removed the corresponding days so that every individual started the observation with a healthy day. This procedure was considered necessary based on observations from previous studies that participants are more likely to join a study on infections if they currently have an infection [Reference Bayer14]. In addition, we studied further scenarios for ARI, with a varying assumed duration of infectiousness, which were based on the incubation period and the duration of diseases for common respiratory pathogens (see Supplementary Material 2, [Reference Heymann15, Reference Lessler16]). For AGE, similar sensitivity analyses were conducted (see Supplementary Material 3, [Reference Heymann15, Reference Lee17, Reference Payne18]).
We used tabulation to describe the study population and χ 2 test as well as Wilcoxon rank-sum test to assess differences between the main study group and the subsample, which is analysed in this manuscript (P-value<0.05). From the fitted model, we obtained the estimates of incidence rates using a generalised linear model with a quasi-Poisson distribution, as well as the 95% confidence intervals (CIs) around the estimates. Similarly, age group-specific incidence rates were calculated. Differences between preschool children (⩽6 years) and older children/adults (>6 years) were tested, and the incidence rate ratios (IRR) were reported. Differences in the duration of episodes were examined using Kruskal–Wallis test with subsequent post-hoc analysis using Dunn's test.
Transmission analysis was performed by identifying primary cases in households and then following all household members over the duration of infectiousness for the primary case, in order to identify potential secondary cases.
In the transmission analysis for ARI, the secondary household attack proportion was calculated as the proportion of household members who acquired the infection by within-household transmission averaged across primary cases [Reference McCaw19].
All analyses were performed using the Stata version 12 (StataCorp, College Station, TX, USA) and R version 3.3.2.
Results
Study population
Health diaries were returned from 77 out of 95 households (81%), including 282 persons, who in total provided 32 739 days of observation out of 32 798 maximal possible days. More than half of the study participants were 7 years or older; our study population was highly educated, with 77% of households with at least one parent with university degree (Table 1).
Description of the study population (n = 77 households; 282 persons)
a Median household size (interquartile range (IQR)): 4 (3; 4).
ARI and AGE episodes
At least one ARI episode was reported in 75 (97%) of all households; for AGE this percentage was lower (73%).
At individual level, there were 4383 days with ARI, corresponding to 608 episodes with a mean duration of 7.3 days. The overall incidence rate of ARI was 18.6 (95% CI (16.2–21.3)) per 1000 person days. Age-specific incidence rates were 25.0 (95% CI (21.2–29.5)) per 1000 person days for preschool children (0–6 years) and 14.7 (95% CI (12.6–17.2)) per 1000 person days for older children/adults (IRR 1.70; 95% CI (1.36–2.14), P ⩽ 0.001).
For AGE, there were a total of 319 sick days in 146 episodes with a mean duration of 2.3 days per episode. The incidence rate of AGE was 4.5 (95% CI (3.7–5.4)) per 1000 person days over all age groups, 5.7 (95% CI (4.6–7.2)) per 1000 person days for preschool children, and 3.7 (95% CI (2.9–4.8)) per 1000 person days for older children/adults (IRR 1.5; CI (1.1–2.2), P = 0.013).
Identification of ARI pathogens
In total, 353 nasal swabs were sent for pathogen identification. The median duration between household members taking the swab and laboratory analysis was 5 days (interquartile range (IQR) 4; 6). Twenty-nine of the swabs could not be assigned to disease episodes, because health diaries of these families (n = 10) were not returned, and for further 31 swabs no episode was listed in the health diary. Of those 31 swabs, picornavirus was identified in seven swabs, adenovirus in one swab and no virus was detected in the remaining 23 swabs. All other 293 nasal swabs could be uniquely assigned to ARI episodes reported in the health diaries. Among these, in 176 swabs (60%), no virus could be detected. In the remaining 117 swabs, picornavirus was the most commonly detected pathogen (see Supplementary Material 4). Identification of more than one pathogen per swab occurred in 16 swabs. In 315 (52%) of 608 ARI episodes, no swab was sent.
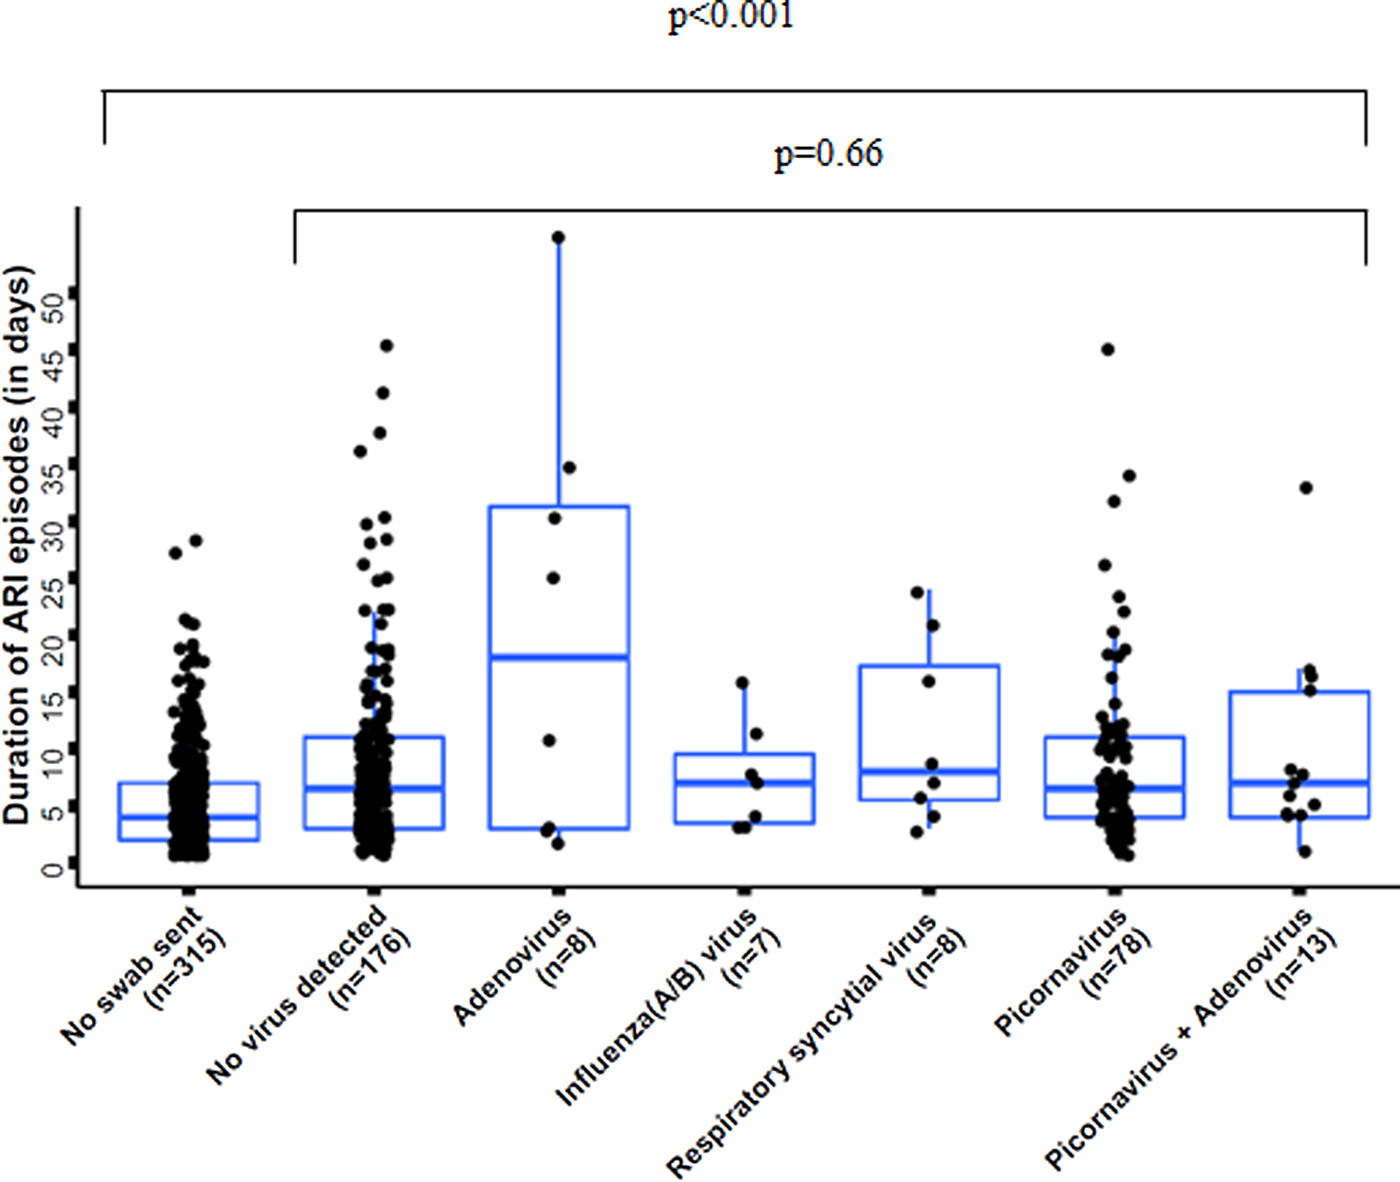
ARI episodes had a significantly shorter duration in cases when no swab was sent (median 4 days; IQR 2; 7), compared with when a swab was sent (median 7 days; IQR 4; 11; P < 0.001) (Fig. 1, see Supplementary Material 5). The duration of ARI episodes did not significantly differ across pathogens in cases when pathogens were identified (P = 0.66) (Fig. 1). Also when comparing any virus detection with no virus identification, the duration of ARI episodes did not differ significantly (P = 0.28).
Duration of acute respiratory infection (ARI) episodes by pathogen, n = 605 (three pathogen combinations, detected in only one sample each, were excluded); boxes indicate 25–75% of the data, whiskers indicate the 95% confidence intervals (CIs).
Transmission of ARI and AGE
There were 396 initial ARI episodes, of which 142 (36%) resulted in transmission according to our baseline definition, while 254 did not lead to a secondary case in the household. Since infectious persons could be involved in more than one transmission event and could possibly initiate transmission chains, there were 277 transmission events in total. In 120 of those, swabs were available for both involved persons: in 37 events no pathogen was detected in both involved persons, and for 57 events, a pathogen could only be identified in one of the involved persons. Among those 26 transmission events, in which a pathogen was identified in both swabs, in 17 cases the same pathogen was identified in both involved persons, whereas in the other nine events different pathogens were identified in both involved persons. Thus, when considering only concordant and discordant findings, in 65% (95% CI (44–83%); 17 out of 26 events) the assumption of transmission was supported and in 35% (95% CI (17–56%); nine out of 26 events) this was not supported.
The secondary household attack proportion was 0.20 (195/969) on the symptomatic level. When only focussing on primary episodes with a detected virus, the secondary household attack proportion was 0.27 (54/199).
When considering results from the sensitivity analyses, the number of observed transmission events varied by the factor 2.4 across the different scenarios (see Supplementary Material 2). Results on pathogen level were robust and ranged from 62 to 67% matching pathogens for the transmission events (see Supplementary Material 6, which provides the extension of Table in Supplementary Material 2).
For AGE, only 10% of the initially infected cases were followed by secondary cases within the household, corresponding to 23 transmission events. In the sensitivity analyses, the number of transmission events also varied strongly (by a factor of 3.7) with the definitions applied (see Supplementary Material 3).
Risk of within-household transmission by age of primary case
Most of the episodes of ARI (63%) and AGE (53%) were introduced into the household by preschool children (0–6 years). From the 396 primary cases of ARI, 142 (36%) resulted in transmission; for AGE – 10% (12 out of 126). For both, ARI and AGE, most of the transmissions were from preschool children to older children/adults (>6 years; ARI: 46%, AGE: 48%; Table 2). The risk of transmission from preschool children to older children/adults was more than twice the risk of transmission from older children/adults to preschool children or of transmission among older children/adults for both ARI and AGE (Table 2).
Transmission events for acute respiratory infections (ARI) and acute gastroenteritis (AGE), by age groups (preschool children: ⩽6 years; older children/adults: >6 years)
a Age group: 0–6 years.
b Age group: 6 years and older.
*Households, where the mentioned constellation of household members existed and where at least one infectious episode occurred, #Confidence intervals (CIs) in brackets.
Discussion
In a household cohort study on transmission of infections in households with young children, 36% of ARI and only 10% of AGE have been followed by secondary cases in the household. Based on temporary linked symptoms, the risk of transmission was almost two times higher when the primary case was a preschool child than when it was from another age group. In 65% of transmissions assumed for ARI on symptom level, the same pathogens were identified in primary and secondary cases.
For AGE, Sacri et al. [Reference Sacri2] reported a higher transmission rate from children to their adults than we found in our study. The importance of collecting biologic samples and identification of pathogens was stressed in former publications [Reference Sacri2, Reference McCaw19]. While the naive expectation is that symptoms in close time sequence are caused by the same pathogen, in 1/3 of transmission events this was not the case. Similarly, also MacIntyre et al. [Reference MacIntyre20] reported only in 55% matching pathogens between children, who presented with influenza-like illnesses in a hospital but were not admitted, and symptomatic adult family members within a follow-up period of 1 week.
Despite our substantial efforts, only in 9% of all observed transmission events, a complete analysis was possible, while in other cases, either for the primary or for the secondary or both cases, no biologic sample was available or no pathogen was detected. Reasons for lack of detection of pathogens in nasal swabs from symptomatic patients can be various. First, swabs in our study have been tested for the six most common pathogens, but also other viruses might be the causative agent and were consequently not detected. Second, virus detection in a swab is dependent on the time between taking the swab and analysing the biologic sample. However, the positivity rate of viruses has been reported to be 72% for 3 or more days delay between taking the swab and analysis [Reference Lambert, Allen and Nolan21]. Third, the episodes without pathogen detection may have been mild infections, where the viral load was low, and hence not detected. However, the duration of symptoms was not significantly shorter compared with episodes with virus detection. Fourth, there can be individual differences with regarding to shedding of viral particles. Finally, the identification of the same pathogen in persons with symptoms linked in time is not a proof of within-household transmission, as the potential secondary case can also have obtained the pathogens from other sources.
A further issue is the question whether the identified pathogens were responsible for the observed infections. Studies indicated that e.g. picornaviruses can be identified in asymptomatic children [Reference Nokso-Koivisto22] and even more often in asymptomatic adults [Reference Peltola23]. But when the results of the pathogen analysis were linked with interview information, most children in the study by Nokso-Koivisto et al. [Reference Nokso-Koivisto22] showed symptoms in the time between 4 weeks prior to and 2 weeks after the swab was taken. Only in 5% of picornavirus-positive swabs, no symptoms were reported in this time frame [Reference Nokso-Koivisto22]. In our study, for 4 swabs with virus detection (out of 8), which could not be assigned to a disease episode at the day the swab was taken, an episode was listed in the health diary within 2 days before or after the day the swab was taken. In addition, another study described that the presence of rhinovirus RNA in young children was only rarely detected later than 30 days after an infection [Reference Loeffelholz24].
The strengths of our study were the prospective approach, which excluded the risk of recall bias and the design of a household cohort study, ensuring that the index case and subsequent cases were identified in the same way. Aside from that the detection rate of viruses through self-swabbing in our study resulted in comparable results as the ARE-Surveillance in Lower Saxony, in which swabs are taken in outpatient clinics [25]. Still, our study was subject to some limitations: biologic samples were only collected for ARI and not for AGE. Additionally, while compared with previous studies the study size was substantial, it did not allow for detailed analysis of single pathogens with respect to their transmission risk. Furthermore, we did not investigate the genotype of the viruses. Therefore, it cannot be excluded that in some of the transmission events based on the same virus type, in fact different genotypes were present in primary and secondary cases.
Conclusion
Our findings confirm that children play an important role in the introduction and further transmission of ARI and AGE into and within households. Symptomatic infections in household members, apparently linked in time, are in 2/3 associated with the same and in 1/3 with different pathogens. These estimates can be further improved in future studies with a larger study population, more complete collection of swabs, testing for more pathogens and employing genetic analyses.
Supplementary material
The supplementary material for this article can be found at https://doi.org/10.1017/S0950268818000316
Acknowledgements
The authors thank all participants in the study for their commitment. Furthermore, they thank all cooperating DCCs in Braunschweig for the opportunity of recruitment.
Declaration of interest
The authors declare that they have no conflict of interest.
Ethical standards
The authors assert that all procedures contributing to this work comply with the ethical standards of the relevant national and institutional committees on human experimentation and with the Helsinki Declaration of 1975, as revised in 2008. The study was approved by the Ethics Committee of Hannover Medical School (No. 2380–2014). Written informed consent was obtained from all individual participants included in the study.


