


1 Introduction
One of the most important remaining global challenges facing professionals in the water, sanitation, and hygiene (WASH) sector is how to end the practice of open defecation in South Asia and sub-Saharan Africa. While there is universal agreement that open defecation is a serious problem, governments have limited policy options for addressing it. The most common approach has been to subsidize construction of improved pit latrines, but having a latrine does not ensure that a household will use it. The economist’s standard prescription of a tax or fine on the negative externalityFootnote 1 resulting from poor disposal of feces is common throughout high-income countries, but is typically judged to be politically infeasible in low-income countries (Braütigam et al., Reference Braütigam, Fjeldstad and Moore2008). Health education interventions have met with limited success (Garn et al., Reference Garn, Sclar, Freeman, Penakalapati, Alexander, Brooks, Rehfuess, Boisson, Medlicott and Clasen2017).
The WASH community was thus understandably excited at the beginning of the 21st century when a new and promising approach – “community-led total sanitation” (CLTS) – was added to its arsenal of tools to end open defecation. This community-level behavioral change technique was developed by Dr. Kamal Kar and rolled out in Bangladesh beginning two decades ago (Kar & Chambers, Reference Kar and Chambers2008). CLTS has since been promoted by most major donors working in the WASH sector, including the World Bank, UNICEF, and the Water Supply and Sanitation Collaborative Council’s Global Sanitation Fund. CLTS interventions have now been implemented in approximately 60 countries, and today the approach is mentioned in the official rural sanitation policies of about 30 countries (USAID, 2018).
CLTS takes a very different approach from other health education interventions. Instead of teaching people about the health benefits that households can obtain from improved sanitation, CLTS facilitators conduct community participatory exercises that aim to “trigger” behavioral change by engendering a sense of shame and disgust among village residents who engage in open defecation, leading to a community rather than just an individual or household response. The CLTS approach has offered WASH practitioners hope that there is a practical, low-cost way to end open defecation practices in situations where other policy instruments have failed.
The recent popularity of CLTS has generated a large body of research designed to estimate its impacts. Over the past decade, numerous randomized controlled trials and field studies have been conducted to estimate the effects of CLTS on a range of outcomes, such as reduction in open defecation, increase in latrine ownership, and reduction in diarrhea prevalence (Pattanayak et al., Reference Pattanayak, Yang, Dickinson, Poulos, Patil, Mallick, Blitstein and Praharaj2009; Elbers et al., Reference Elbers, Godfrey, Gunning, Velden and Vigh2012; Cameron et al., Reference Cameron, Shah and Olivia2013; Patil et al., Reference Patil, Arnold, Salvatore, Briceno, Ganguly, Colford and Gertler2014; Guiteras et al., Reference Guiteras, Levinsohn and Mobarak2015; Pickering et al., Reference Pickering, Djebbari, Lopez, Coulibaly and Alzua2015; BDS-Center for Development Research, 2016; Hammer & Spears, Reference Hammer and Spears2016; Makotsi et al., Reference Makotsi, Kaseje, Mumma, Opiyo and Lukorito2016; Crocker et al., Reference Crocker, Abodoo, Asamani, Domapielle, Gyapong and Bartram2016a, Reference Crocker, Geremew, Atalie, Yetie and Bartram b; Crocker et al., Reference Crocker, Saywell and Bartram2017a; Briceño et al., Reference Briceño, Coville, Gertler and Martinez2017; Orgill-Meyer et al., Reference Orgill-Meyer, Pattanayak, Chindarkar, Dickinson, Panda, Rai, Sahoo, Singha and Jeuland2019). However, no benefit–cost analyses (BCAs) of CLTS interventions have incorporated the body of new evidence emerging from these studies. The purpose of this paper is to fill this gap in the literature.
The second section of the paper describes both the methodological approaches and findings of the limited number of benefit–cost studies that have been conducted on sanitation interventions (including CLTS) in low- and middle-income countries. The third section then presents an overview of the benefit–cost model that we use to compare the benefits and costs of a representative CLTS campaign rolled out in a hypothetical region in sub-Saharan Africa covering 200 villages. The fourth section summarizes the assumptions made for the parameters in this model, including new evidence from recent studies regarding the effectiveness of CLTS and the potential positive externality from improved sanitation. The fifth section presents the results of the benefit–cost calculations, including sensitivity analyses, and the sixth section concludes.
2 Review of previous BCAs of sanitation interventions (including CLTS) in low- and middle-income countries
We identified and reviewed 14 previous studies that compared the costs and benefits of sanitation interventions in low- and middle-income countries (Table 1). Only three of these studies were published in peer-reviewed journals (Hutton et al., Reference Hutton, Haller and Bartram2007; Whittington et al., Reference Whittington, Hanemann, Sadoff and Jeuland2009; Whittington et al., Reference Whittington, Jeuland, Barker and Yuen2012). Most of the studies were commissioned by the Copenhagen Consensus Center as part of their global and regional priority setting activities (Whittington et al., Reference Whittington, Hanemann, Sadoff and Jeuland2009; Rijsberman & Zwane, Reference Rijsberman and Zwane2012; Hutton, Reference Hutton2015; Larsen, Reference Larsen2016; Sklar, Reference Sklar2017; Whittington et al., Reference Whittington, Jeuland and Radin2017; Larsen, Reference Larsen2018a; Larsen, Reference Larsen2018b). The World Health Organization sponsored two early studies (Hutton & Haller, Reference Hutton and Haller2004; Hutton et al., Reference Hutton, Haller and Bartram2007). Two studies were conducted as part of the World Bank’s “Economics of Sanitation Initiative” (Heng et al., Reference Heng, Hutton, Kongchen, Poch and Phyrum2012; Winara et al., Reference Winara, Hutton, Purnomo, Hadiwardoyo, Merdykasari, Nurmadi, Bruinsma, Gunawan, Fadilah and Albrecht2011). Hutton (Reference Hutton2018) is the most recent study included in this review, and it was sponsored by UNICEF to assess the benefits and costs of a national sanitation program in India.
Summary of prior sanitation intervention benefit–cost analyses.

Abbreviations: CTLS, community-led total sanitation; MDG, millennium development goal.
These BCAs of sanitation interventions have a number of common features. First, all include the economic benefits of reduced mortality and morbidity from sanitation-related diseases, and most include the time savings from no longer walking to a place to defecate away from home. The authors of these studies also identify numerous other possible benefits, such as improved privacy, aesthetics, safety, dignity, and convenience. However, only the studies from the Economics of Sanitation Initiative and Hutton (Reference Hutton2018) included any information on preferences for nonhealth and nontime benefits. These studies presented findings from surveys that included questions that asked households, businesses, and tourists about how satisfied they were with sanitation conditions and environmental quality in potential intervention communities. However, these data on satisfaction were not monetized and were therefore ultimately not included in the BCA calculations. Both Whittington et al. (Reference Whittington, Jeuland, Barker and Yuen2012) and Larsen (Reference Larsen2018a, b) mention the possibility of a disamenity associated with ending open defecation, but only Larsen (Reference Larsen2018a, b) attempted to assign a monetary value to this disamenity.Footnote 2
Second, most studies use the household as the unit of analysis. In contrast, the CLTS approach considers open defecation to be a community problem. Third, all 14 existing BCAs use the benefit transfer approach, taking findings from other studies to both measure and value the health impacts of the sanitation intervention. The BCAs rely on systematic literature reviews, meta-analyses, or other studies to estimate reductions in disease, most often reductions in diarrheal morbidity and mortality. All the BCAs then use benefit transfer techniques to assign monetary values to these sanitation-related health outcomes, instead of estimating such values using primary data collection and nonmarket valuation techniques applied within the study sites.
Fourth, only one of the 14 studies attempted to include the benefits from a positive externality from improved sanitation; all others only estimated diarrhea reductions among households adopting a latrine. Hutton (Reference Hutton2018) instead estimated diarrhea reductions at the community level, which includes households that use a latrine and households that do not. Hutton (Reference Hutton2018) transferred a functional relationship between community diarrhea risk reduction and community latrine coverage estimated by Andres et al. (Reference Andres, Briceño, Chase and Echenique2017) using survey data from India. Andres et al. (Reference Andres, Briceño, Chase and Echenique2017) found that latrines have only a small effect on diarrhea risk when fewer than 20 % of the households in a community have a latrine. After community latrine coverage reaches 20 %, diarrhea risk reduction appears to increase linearly with community latrine coverage. Beyond a coverage level of 75 %, risk reduction increases faster and nonlinearly in community latrine coverage.
In their BCA, Hutton (Reference Hutton2018) also relied on the analysis of a household survey that found that only 85 % of people in households with latrines constructed due to the intervention in rural India reported using a latrine. The authors assumed this 85 % was representative for all households and applied the model from Andres et al. (Reference Andres, Briceño, Chase and Echenique2017) to estimate a 34 % diarrhea reduction for each household adopting a latrine due to the intervention. Since the BCA only estimated impacts among households newly adopting a latrine, they did not value the benefits accruing to households that already had a latrine before the intervention but experienced a further reduction in diarrhea due to externalities.Footnote 3
Despite these similarities, existing BCAs of sanitation interventions also have several important differences. First, some of the early studies of the economic costs and benefits of improved sanitation did not attempt to evaluate real-world sanitation interventions and their associated outcomes. Instead, authors asked a hypothetical question: “What would the costs and benefits be if there were an ‘ideal intervention’ that could eliminate open defecation and the use of substandard sanitation infrastructure?” The costs of this intervention were assumed to be the infrastructure costs of installing improved sanitation facilities for everyone currently without coverage, and the benefits were assumed to be a complete (100 %) reduction of all current (status quo) losses from poor sanitation.
Alternatively, the intervention could be assumed to achieve a specified improved sanitation coverage target. For example, Hutton and Haller (Reference Hutton and Haller2004) and others (Hutton et al., Reference Hutton, Haller and Bartram2007; Hutton, Reference Hutton2015; Larsen, Reference Larsen2016) attempted to estimate the costs and benefits of an intervention that would achieve the millennium development goal (MDG) of universal coverage. These studies implicitly assumed that all households would use the sanitation facilities once they were built. The authors of these studies uniformly argued that sanitation investments easily passed a benefit–cost test, and that investments in sanitation infrastructure should therefore be increased. However, neither of these two approaches – based on “ideal” interventions or on the achievement of a specified target – accounted for all of the noninfrastructure-related costs of achieving complete behavior change, especially the costs of reaching households that do not readily adopt new sanitation technologies.
In contrast, the majority of previous economic analyses tried to evaluate actual sanitation interventions, using field evidence about their uptake and effectiveness (Whittington et al., Reference Whittington, Hanemann, Sadoff and Jeuland2009; Winara et al., Reference Winara, Hutton, Purnomo, Hadiwardoyo, Merdykasari, Nurmadi, Bruinsma, Gunawan, Fadilah and Albrecht2011; Heng et al., Reference Heng, Hutton, Kongchen, Poch and Phyrum2012; Rijsberman & Zwane, Reference Rijsberman and Zwane2012; Whittington et al., Reference Whittington, Jeuland, Barker and Yuen2012; Sklar, Reference Sklar2017; Whittington et al., Reference Whittington, Jeuland and Radin2017; Hutton, Reference Hutton2018; Larsen, Reference Larsen2018a, Reference Larsen b). These studies accounted for household responses to sanitation interventions in terms of uptake of improved sanitation technology, and then estimated the economic benefits that would result from those adoption rates. Although most of these studies suggested that the benefits of interventions would exceed their costs, the benefit–cost ratios (BCRs)Footnote 4 were unsurprisingly much lower than those that postulated an ideal intervention (see Table 1).
A second major difference among these 14 analyses is how the authors included the costs of the software components of the sanitation interventions.Footnote 5 Most studies included hardware costs, which include the cost of the improved infrastructure, and some software costs, such as the costs of education or behavior change activities. However, it is unclear in many of the studies whether these program costs included administrative effort, facilitator time, training costs, and community members’ time spent on CLTS activities. Given the very low program costs commonly assumed in the BCAs, it seems likely that these costs have been systematically underestimated in most of the prior literature.
For example, Hutton and Haller (Reference Hutton and Haller2004), Hutton et al. (Reference Hutton, Haller and Bartram2007), Rijsberman and Zwane (Reference Rijsberman and Zwane2012), Hutton (Reference Hutton2015), Larsen (Reference Larsen2016), Hutton (Reference Hutton2018), and Larsen (Reference Larsen2018a, Reference Larsen b), all assumed that per household software costs were only 5 % of the capital costs of a latrine. On the other hand, Heng et al. (Reference Heng, Hutton, Kongchen, Poch and Phyrum2012) collected primary data and found that the software costs for CLTS were actually higher than the costs of latrine construction on a per household basis (US$54 vs. US$20 per household). Whittington et al. (Reference Whittington, Hanemann, Sadoff and Jeuland2009), Whittington et al. (Reference Whittington, Jeuland, Barker and Yuen2012), and Whittington et al. (Reference Whittington, Jeuland and Radin2017) included software/program costs that were between two and six times larger than the capital costs of the latrines.Footnote 6 Of course, not all sanitation interventions have the same software costs as CLTS. Certain interventions such as direct hardware provision or subsidies may require less software cost in absolute amounts and in proportion to total program costs. However, future BCAs of sanitation interventions should incorporate the full set of administrative, organizational, or other training costs.
Additionally, most studies calculated total costs by aggregating the per-household cost – including both software and hardware costs – among households that were assumed to construct a latrine. On the other hand, in order to account for the community-level nature of the CLTS intervention, Whittington et al. (Reference Whittington, Hanemann, Sadoff and Jeuland2009, Reference Whittington, Jeuland, Barker and Yuen2012, Reference Whittington, Jeuland and Radin2017) included software costs for all households in a target community (i.e., all households “treated” by the behavior change element of the CLTS campaign), and not just for those that built a latrine.
Third, authors of these prior studies made very different assumptions about how to value time savings from reducing travel to and from open defecation sites. As a result, time savings as a percentage of total benefits have varied from 15 to 80 %. Moreover, none of the studies used estimates of the value of time savings that were based on primary data collected in the locations being considered for CLTS intervention. Instead, most valued time savings benefits based on estimates of the value of time spent collecting water (Whittington & Cook, Reference Whittington and Cook2018). Of course, individuals may value the time spent queuing for and carrying water differently from time spent walking to and from an open defecation site.
The objective of this paper is to improve these available estimates of the costs and benefits of CLTS and related sanitation interventions in low- and middle-income countries. The first improvement we make is to incorporate the best available evidence from the recent collection of rigorous field studies (including several randomized controlled trials [RCTs]) of real-world CLTS and related sanitation interventions, especially evidence about increases in latrine ownership, decreases in diarrhea, and software costs. Second, we analyze the impact of a CLTS intervention at a regional rather than household level. This approach will better serve policymakers because CLTS is typically implemented at a regional level. Reporting results at the household level does not provide a transparent framework for incorporating the positive health externality related to reduced open defecation.
Third, we present results at the regional level, and then disaggregate them to the village to illustrate how the benefits and costs vary depending on how households in different communities respond to CLTS interventions. We present benefit–cost results with and without inclusion of a positive sanitation externality to show the importance of this assumption. Unfortunately, as we will discuss further below, only limited data exist on the magnitude of this positive externality, and on how it changes as open defecation is reduced (Andres et al., Reference Andres, Briceño, Chase and Echenique2017; Jung et al., Reference Jung, Lou and Cheng2017). This is in part because most sanitation evaluations are similar to the existing BCAs in that they focus and report on household rather than community outcomes. We explore this uncertainty in our sensitivity analyses, and discuss its policy implications.
3 Benefit–cost model
3.1 Overview
We develop a model for estimating the benefits and costs of implementing a CLTS program in a hypothetical rural district or administrative region of a country in sub-Saharan Africa. For simplicity, this region is assumed to include 200 villages, and each village has 100 households with five members (two adults, two children between 5 and 14 years, and one child under 5), for a total population of 100,000 people. We assume that the CLTS campaign affects villages in the region differently. Specifically, we assume that the CLTS campaign can affect villages in three ways: (i) a large proportion of households in a village will build and use latrines (high-uptake); (ii) a medium proportion of households in a village will build and use latrines (medium-uptake); or (iii) a small proportion of households in a village will build and use latrines (low-uptake).Footnote 7 We make assumptions about the distribution of these three village types in the region based on recent research (Hammer & Spears, Reference Hammer and Spears2013; Boisson et al., Reference Boisson, Sosai, Ray, Routray, Torondel, Schmidt, Bhanja and Clasen2014; Sinha et al., Reference Sinha, Nagel, Schmidt, Torondel, Boisson, Routray and Clasen2017). Benefits and costs are calculated at the household level for each of these three village types, and then aggregated to the village and regional levels. This approach provides a straightforward way to incorporate a positive village-level public health externality (described below).
Incorporating village-level heterogeneity has implications for other benefit–cost calculations as well. For example, program implementation costs are assumed to be independent of whether or not a household constructs a latrine after the CLTS intervention, since these are costs incurred by external agencies attempting to mobilize communities to change their sanitation behaviors. However, we assume that household time costs for participation in CLTS activities vary according to the level of latrine uptake in a village. Specifically, we assume that not every household in a village attends the initial or follow-up CLTS meetings. Households that attend these meetings and build latrines have higher time costs on average than households that do not attend the meetings or do not build latrines. Villages where fewer latrines are built thus incur lower time costs.
The total costs of building latrines in a village also vary depending on the level of uptake. In villages where more people decide to construct latrines costs will be higher. Operations and maintenance costs depend on the extent to which members of households with latrines actually use them, which evidence suggests declines over time. For example, several studies find that a relatively high fraction of households owning latrines have members that do not use them (Barnard et al., Reference Barnard, Routray, Majorin, Peletz, Boisson, Sinha and Clasen2013; Cameron et al., Reference Cameron, Shah and Olivia2013, Orgill-Meyer et al., Reference Orgill-Meyer, Pattanayak, Chindarkar, Dickinson, Panda, Rai, Sahoo, Singha and Jeuland2019). Other studies report an increase over time in open defecation rates (Crocker et al., Reference Crocker, Saywell and Bartram2017a) and latrine abandonment (Orgill-Meyer et al., Reference Orgill-Meyer, Pattanayak, Chindarkar, Dickinson, Panda, Rai, Sahoo, Singha and Jeuland2019). Based on these findings, our analysis assumes that all households that build a latrine use and maintain it for 5 years, and that a fixed percentage of households abandon their latrine in each of the subsequent 5 years.
In the benefit–cost model the time stream of benefits to households in a village depends on whether households construct and use latrines. The estimated diarrhea reduction for households in a village targeted by a CLTS intervention is calculated in two different ways. In the first such calculation, we assume that health benefits are fully private; that is, health benefits to a household accrue only after it has built a latrine. For the second calculation, we include a positive health externality, but assume that this positive externality only “kicks in” once village coverage with improved latrines exceeds a sufficient threshold. In this second calculation, the magnitude of the diarrhea risk reduction is assumed to be different for households that (i) adopt latrines due to the CLTS intervention, (ii) do not adopt latrines, and (iii) already had latrines before the intervention. We discuss the implementation of this threshold approach in the benefit–cost model further below.
The time streams of both benefits and costs extend for 10 years and are discounted using a real (net of inflation) discount rate. All parameters and model results that are expressed in monetary units are reported in 2016 international dollars (Int’l $). Model results are presented in terms of three benefit–cost metrics: (i) present value of net benefits (NPV); (ii) BCR; and (iii) economic internal rate of return (ERR). The detailed equations used for the calculation of benefits and costs are included in the Supplementary Materials. To demonstrate the range of potential benefits and costs and identify which parameters have the largest effect on the results, we also apply Monte Carlo analysis (Johansson & Kriström, Reference Johansson and Kriström2015; Whittington et al., Reference Whittington, Hanemann, Sadoff and Jeuland2009).
Due to challenges with quantifying and valuing such benefits, our benefit–cost model does not include estimates of the benefits from reduced risks of assault, enhanced dignity, and increased privacy, which are especially relevant for women and may result from households switching from open defecation practices to the use of latrines at their homes. Nor does the benefit–cost model include estimates of any disamenities associated with the use of improved latrines, such as the unpleasantness of defecating in foul-smelling latrines or increased exposure to flies and mosquitoes (Coffey et al., Reference Coffey, Gupta, Hathi, Khurana, Spears, Srivastav and Vyas2014).
3.2 Key assumptions and parameter estimates
The benefit–cost model has more than 50 parameters. For our benefit–cost calculations, we select values for these parameters and their ranges that we consider to be typical for many rural regions in sub-Saharan Africa. In the Supplementary Materials, we present a base-case value for each of these parameters, as well as minimum and maximum values. The values of several of the parameters are not independent of one another. For example, if the baseline sanitation coverage is lower, the baseline diarrheal incidence should be higher. We therefore include associations between related parameters in our Monte Carlo analysis. Here, we discuss our assumptions regarding some of the most important model parameters.
3.2.1 Effects of the CLTS intervention
The literature on the impacts of CLTS interventions typically reports changes in three outcome variables: (i) latrine construction or ownership (typically in percentage points), (ii) latrine use or open defecation practice (also in percentage points), and (iii) diarrhea prevalence for children under 5 commonly reported as a percent change. Although this literature often presents results as a difference in means between treatment and untreated comparison villages, we assume as noted in the previous section that village responses to a CLTS intervention vary.
For the first of these outcome parameters (latrine construction or ownership), the RCT literature on the effectiveness of CLTS reports a wide range of increases. Specifically, the increases reported in the literature, for treated villages relative to control villages, range from 0 to 50 percentage points.Footnote 8 Garn et al. (Reference Garn, Sclar, Freeman, Penakalapati, Alexander, Brooks, Rehfuess, Boisson, Medlicott and Clasen2017) conducted a systematic review which included more than 35 studies covering different household sanitation interventions such as CLTS, community mobilization interventions, sanitation marketing, sewerage interventions, latrine subsidies, and a number of other interventions. They found that CLTS-only interventions increased latrine coverage by an estimated 12 percentage points. In contrast, the Government of India’s Total Sanitation Campaign, which included a version of CLTS along with other program elements, increased latrine coverage by an average of 27 percentage points.Footnote 9
Our benefit–cost model assumes that all villages experience a one-time jump in latrine ownership starting from a baseline of 45 %. We assume that high-uptake villages have a 35 percentage point increase in coverage (45 → 80 %). The increases in medium- and low-uptake villages, meanwhile, are assumed to be 15 percentage points (45 → 60 %), and 5 percentage points (45 → 50 %), respectively. We assume in the base case that 20 % of villages are high-uptake, 40 % are medium-uptake, and 40 % are low-uptake. This distribution of village types and effects is consistent with the latrine increase of 15 percentage points that is obtained from averaging across the uptake rates in the 10 recent RCTs that we reviewed.Footnote 10
These assumptions are based on the limited available data about the distribution of latrine uptake across villages. Hammer and Spears (Reference Hammer and Spears2013) present a graph of a potential cumulative distribution of latrine coverage by treated and untreated villages. Additionally, Clasen et al. (Reference Clasen, Boisson, Routray, Torondel, Bell, Cumming, Ensink, Freeman, Jenkins and Odagiri2014) report that 11 of the 50 treatment villages in their experiment achieved total latrine coverage of more than 50 % from a baseline of around 9 %. Pickering et al. (Reference Pickering, Djebbari, Lopez, Coulibaly and Alzua2015) present a scatter plot in their Supplementary Materials showing the change in latrine coverage from baseline to endline across intervention villages. Based on their evidence, we assumed that 20 % of the total sample would be high-uptake villages, while the other 80 % would be split between medium-uptake and low-uptake villages. We then assumed that high-uptake villages would have a 35 percentage point increase in latrine coverage while low-uptake villages would only increase coverage by 5 percentage points. We finally calculated the medium uptake level required to ensure that regional impact would match the overall 15 percentage points mentioned above.
The second relevant parameter related to CLTS intervention effectiveness is the increase in latrine use, or decrease in open defecation. Nine of the 10 CLTS evaluations found statistically significant declines in open defecation. The decreases in the nine studies ranged from four to 25 percentage points. However, as noted above, more limited evidence from this literature also indicates that these changes may decline over time. Our model assumes that 45 % of household members in households with latrines use their latrine at baseline. We estimate that latrine usage for household members in households with latrines increases in all villages after the CLTS intervention, by 35 percentage points in high impact villages (reaching a total of 85 % use), and by 15 and 10 percentage points in medium and low impact villages. We apply the increased usage rates both to households that adopt latrines due to the CLTS intervention and to households already owning latrines prior to it (given that these households are also triggered by the intervention).Footnote 11 We then assume that all households adopting latrines use them for 5 years. We further assume that the abandonment rate of latrines after 5 years is 10 % per year.Footnote 12
The third outcome variable that researchers often report is the impact of CLTS on diarrheal prevalence. To ensure adequate statistical power, this outcome is typically only measured for children under 5 years of age, who have higher prevalence. Seven CLTS RCTs report an outcome for diarrheal risk reduction. While all of these studies found decreases in diarrheal prevalence for children under 5, only two found these reductions to be statistically significant.Footnote 13 In addition, two recent RCTs that evaluated the same non-CLTS sanitation intervention in two different countries obtained conflicting results. One study found a statistically significant 40 % reduction in diarrhea prevalence for children under 5 (Luby et al., Reference Luby, Rahman, Arnold, Unicomb, Ashraf, Winch and Stewart2018), whereas the other found an insignificant 2 % decrease (Null et al., Reference Null, Stewart, Pickering, Dentz, Arnold, Arnold and Benjamin-Chung2018). Overall, when averaging all of the reductions from the RCTs mentioned above (both the studies with statistically significant results and those with statistically insignificant results), we obtain an average decrease in diarrhea of about 20 %.Footnote 14
There are a number of reasons why an RCT might not find evidence for a reduction in diarrheal prevalence from a CLTS intervention. One potential problem could be insufficient sample sizes for detecting small changes in diarrheal prevalence, particularly in locations with low baseline diarrhea rates. This is especially important for RCTs that report changes in latrine coverage and open defecation as primary outcomes, since these RCTs typically focus on locations with low initial levels of sanitation where increases in coverage are unlikely to result in a positive sanitation externality. RCTs are also generally not designed to test for a sanitation externality, which would require a design that systematically induces exogenous variation in the final levels of sanitation coverage across communities. Another issue is measurement error, which can be common for variables such as self-reported diarrheal disease prevalence that require recall over the past 2 days, 7 days, or 2 weeks. Other reasons can include confounding factors such as seasonal trends or different baseline conditions across communities.
Given the inconclusive findings of the RCTs, we also considered the findings from a recent meta-analysis of the impact of a variety of sanitation interventions on childhood diarrhea (Wolf et al., Reference Wolf, Hunter, Freeman, Cumming, Clasen, Bartram, Higgins, Johnston, Medlicott and Boisson2018). This systematic review did not include only CLTS interventions, but was based on 22 observations from 19 different academic studies, including five of the nine CLTS studies reviewed for this paper. Wolf et al. (Reference Wolf, Hunter, Freeman, Cumming, Clasen, Bartram, Higgins, Johnston, Medlicott and Boisson2018) found that nonsewer sanitation interventions decrease diarrhea rates by an average of 16 % across all age cohorts, which is similar to the 20 % reduction obtained from averaging the point estimates reported in the nine sanitation RCTs. Considering these findings and our assessment of the RCT results, in our “no externality scenario,” we assume in the base case that households who build a latrine experience a reduction in diarrhea of 20 % relative to their baseline prevalence rate, in all village types. This 20 % reduction is broadly consistent with (i) the average treatment effect reported in Wolf et al.’s (Reference Wolf, Hunter, Freeman, Cumming, Clasen, Bartram, Higgins, Johnston, Medlicott and Boisson2018) meta-analysis and (ii) the average reduction across the nine CLTS and sanitation-related RCTs that report impacts on diarrhea prevalence (Cameron et al., Reference Cameron, Shah and Olivia2013; Clasen et al., Reference Clasen, Boisson, Routray, Torondel, Bell, Cumming, Ensink, Freeman, Jenkins and Odagiri2014; Patil et al., Reference Patil, Arnold, Salvatore, Briceno, Ganguly, Colford and Gertler2014; Dickinson et al., Reference Dickinson, Patil, Pattanayak, Poulos and Yang2015; Pickering et al., Reference Pickering, Djebbari, Lopez, Coulibaly and Alzua2015; Hammer & Spears, Reference Hammer and Spears2016; Briceño et al., Reference Briceño, Coville, Gertler and Martinez2017; Luby et al., Reference Luby, Rahman, Arnold, Unicomb, Ashraf, Winch and Stewart2018; Null et al., Reference Null, Stewart, Pickering, Dentz, Arnold, Arnold and Benjamin-Chung2018).
3.2.2 Positive sanitation externality
If one ignores the benefits to households who fail to adopt latrines, the health benefits of the CLTS intervention will likely be underestimated due to the positive sanitation externality. Wolf et al. (Reference Wolf, Hunter, Freeman, Cumming, Clasen, Bartram, Higgins, Johnston, Medlicott and Boisson2018) test a model proposed in Andres et al. (Reference Andres, Briceño, Chase and Echenique2017) to see whether interventions, including both piped sewer systems and nonsewer interventions, that achieved community-level coverage of 75 % or more had significantly larger reductions in diarrhea than those that achieved coverage below 75 %. Their analysis found that interventions in rural and urban areas that achieved coverage above this threshold (including sewer interventions) had diarrhea rates that were reduced by 45 %, while those achieving lower levels of latrine coverage only saw reductions of 25 %. Therefore, for our benefits calculation that includes a positive sanitation externality, we assume that once this 75 % threshold level of coverage is exceeded, the risk reduction for households that construct latrines (“new latrine adopters”) increases linearly from the 20 % “no externality” effect among adopters up to a maximum of 35 % at a village coverage level of 100 % (Figure 1a). This maximum reduction is perhaps conservative relative to the higher rate estimated by Andres et al. (Reference Andres, Briceño, Chase and Echenique2017), but nonetheless represents an average from the nine CLTS and sanitation RCTs, plus the interventions included in the Wolf et al.’s (Reference Wolf, Hunter, Freeman, Cumming, Clasen, Bartram, Higgins, Johnston, Medlicott and Boisson2018) meta-analysis having coverage exceeding 75 %. Households in high-uptake villages that do not adopt a latrine are assumed to experience a diarrhea reduction that increases linearly from 0 % to 35 % as coverage increases by 25 percentage points, from the 75 % coverage threshold to 100 % (Figure 1b). Households owning a latrine prior to the intervention are assumed to have already captured the initial 20 % reduction, and receive less additional protection following the CLTS intervention. Thus, for these households, the diarrhea reduction is assumed to increase linearly from 0 to 20 % after coverage exceeds the 75 % threshold (Figure 1c), such that all households in a community with 100 % coverage would experience a 35 % reduction relative to a no-latrine counterfactual.
Assumed diarrhea risk reduction with positive sanitation externality (as a function of community latrine coverage) among (a) new adopters; (b) nonadopters; and (c) preintervention adopters.

3.2.3 Baseline diarrhea incidence
The baseline diarrhea incidence rates are calculated using data from a report by the Global Burden of Disease Collaborative Network (2017) for all countries in sub-Saharan Africa. The Global Burden of Disease Collaborative Network (2017) provides baseline data on diarrhea rates disaggregated by age for people in the following age groups: under 5, 5–14, 15–49, 50–69, 70–74, 75–79, and 80 and older. These estimates were used to estimate the baseline diarrheal incidence rate for children under 5 and children between 5 and 14 years of age. In order to estimate the parameter for the baseline diarrhea incidence for those 15 years and older, we use data from the most recently available Demographic Health Surveys and Malaria Indicator Surveys from a number of sub-Saharan African countries to construct weights based on the proportion of the total population per age group out of the total population that is 15 years and older.Footnote 15 All sub-Saharan African countries exhibited a similar pattern in terms of relative baseline diarrhea incidence rates across age groups. The highest rate of prevalence was for children under 5. Children 5 to 14 had the lowest rate of the three groups, and the rate for people 15 years and older fell between these two younger age cohorts. Based on these sources, we estimate that children under 5 have average 2.4 baseline diarrhea episodes per year, children 5–14 years of age have average 0.5 episodes per year, and individuals 15 years and older have average one episode per year.
We then use these age-cohort averages to calculate estimates of the annual diarrhea incidence for households with and without latrines, prior to the CLTS intervention. We assume that the 45 % of households with latrines before the intervention have already experienced a 20 % decrease in diarrhea rates. We then estimate adjusted diarrhea incidence rates in the two groups such that the weighted average for those with and without latrines equals the average estimate from the Global Burden of Disease Collaborative Network report. For households without latrines, we thus estimate the baseline diarrhea rates to be 2.6 diarrhea episodes per year for children under 5, 0.55 diarrhea episodes per year for children 5–14 years, and 1.1 diarrhea episodes per year for individuals 15 years and older. For households with latrines, the corresponding baseline diarrhea rates are 2.1, 0.44, and 0.88 diarrhea episodes per year for children under 5, children 5–14, and individuals 15 and older, respectively.
3.2.4 Value of statistical life (VSL)
To obtain an economic value for mortality risk reductions, we follow the guidelines proposed by Robinson et al. (Reference Robinson, Hammitt and James2018a). We use a benefit transfer approach and start from a VSL of Int’l $9.4 million in the USA, adjusting this amount according to relative income differences with a number of countries in sub-Saharan Africa.Footnote 16 , Footnote 17 According to the World Bank 2015 World Development Indicators, the USA has a gross national income (GNI) per capita of US$57,878 and our subset of sub-Saharan African countries have a 2016 median GNI per capita of Int’l $2000. Footnote 18 We assume a VSL income elasticity of 1.5 as suggested by Robinson et al. (Reference Robinson, Hammitt and James2018a), which yields a base case VSL of approximately Int’l $60,000. For our sensitivity analysis we use the same approach for calculating our VSL but vary the estimates of the GNI per capita that pertain to our intervention area. We assume the GNI per capita ranges from Int’l $1500 to Int’l $2500, which results in VSL estimates in the initial year with a lower bound close to Int’l $30,000 and an upper bound of approximately Int’l $85,000. We also assume a constant annual rate of growth of 1.5 % in GNI per capita over the 10-year planning horizon in the base case. We allow this 1.5 % annual growth to vary from 0 to 3 % in the sensitivity analyses.
3.2.5 Cost of illness (COI)
The economic value of reductions in morbidity risk is estimated by multiplying the number of nonfatal episodes of diarrhea avoided by an estimate of the social costs of a nonfatal episode of diarrheaFootnote 19 (Robinson et al., Reference Robinson, Hammitt, James and O’Keeffe2018b). The estimate of the social costs of an episode of diarrhea (“costs of illness,” or COI) includes both the direct and indirect cost of treatment (Robinson et al., Reference Robinson, Hammitt, James and O’Keeffe2018b). Direct medical costs include expenses related to medical treatment – such as medical consultations, diagnostic tests, staff time, and medicine – paid by both the households of sick individuals and the health system providing care. Direct nonmedical costs include transportation, lodging, meals, and other treatment-related expenditures. Indirect costs include estimates of the lost productivity due to the illness.
3.2.6 Value of time
Time savings benefits are estimated by multiplying an estimate of the time spent by household members walking to and from an open defecation site who switch to an improved latrine at their home, by an assumed value of travel time (Whittington & Cook, Reference Whittington and Cook2018). Time spent in CLTS activities is also multiplied by the same estimate of the value of time and included in the costs of the intervention. To the best of our knowledge, there are no studies that have attempted to estimate the economic value of time savings from reductions in time to reach open defecation sites. Acknowledging the difficulties associated with this type of benefits transfer, we value time savings by transferring estimates from studies of the value of time saved not having to carry water from outside the home. Carrying water from a source outside the home is hard work, whereas walking to an open defecation site is typically less arduous. On the other hand, an individual walking to defecate may be forced to interrupt planned activities, or may experience safety risks in going to isolated locations (this is a particular concern for young girls and women), in contrast to an individual carrying water who may have more flexibility concerning the timing of the activity.Footnote 20
We assume that the value of time for the working age population, household members 15 years and older, is 50 % of the local unskilled wage.Footnote 21 We conduct sensitivity analysis using a range of 25–75 % of this wage. For school-age children, we value time savings as 25 % of the local wage rate and use a range of 0–50 % in sensitivity analysis. We do not value time savings for children under 5.
3.2.7 Discount and growth rate
We assume a real discount rate for the base case of 3 % for all health and nonhealth costs and benefits in the base case (Wilkinson et al., Reference Wilkinson, Sculpher, Claxton, Revill, Briggs, Cairns and Teerawattananon2016). We use the Ramsey rule to construct a range of discount rates for the sensitivity analysis. To calculate a discount rate requires estimates for the pure rate of time preference, plus the effect of wealth on the marginal utility of consumption (Claxton et al., Reference Claxton, Asaria, Chansa, Jamison, Lomas, Ochalek and Paulden2019).Footnote 22 We use 0 % as the lower bound discount rate, assuming no growth in per capita income and an elasticity of marginal utility with respect to consumption of one. We use an upper bound of 6 %, assuming a per capita growth rate of 3 % and an elasticity of marginal utility with respect to consumption of two.
We also include a parameter in the benefit–cost model to account for real wage growth. We assume an estimated real wage growth of 1.5 % over the 10-year planning horizon (consistent with the above cited data on GNI per capita growth), with a range from 0 to 3 % per year. We apply the same estimated wage growth to the following components of the model: (i) allowing the GNI per capita for the individuals in the intervention area to grow each year, which results in an increasing VSLFootnote 23; (ii) increasing the value of time savings; and (iii) increasing the benefits from fewer lost days of work.
3.3 Sensitivity analyses
We conduct two types of sensitivity analyses. First, we vary the effectiveness of the CLTS intervention. The benefit–cost results are analyzed at the regional level for both a poor effectiveness and an enhanced effectiveness intervention by varying the proportions of low, medium, and high-uptake villages. In the base case we assume that 40 % of the total 200 villages (80 villages) are low-uptake villages, 40 % are medium-uptake villages, and 20 % are high-uptake villages. For a poor effectiveness intervention, we assume that 60 % are low-uptake villages, 30 % are medium-uptake villages, and 10 % are high-uptake villages. For an enhanced effectiveness intervention, we assume that 33 % of the villages are low-uptake villages, 33 % are medium-uptake villages, and 34 % are high-uptake villages.
Second, we perform a Monte Carlo sensitivity analysis – with 10,000 random draws of the simulation parameters – allowing for simultaneous variation in several model parameters. Due to limited knowledge of the distribution of these parameters, we assume that all are uniformly distributed, that is, all values within a parameter’s range have an equal probability of being selected in any given simulation trial. We also allow for correlations between specific variables. For example, areas with higher diarrhea rates are assumed to have lower baseline latrine coverage and latrines usage. We also allow higher diarrhea incidence rates to be associated with higher diarrhea case fatality rates, more seeking of care, and longer time ill per episode. Also, several valuation parameters are positively associated with local wage rates. For example, higher wage rates are correlated with a higher value of a statistical life, age-specific value of time, household and health system medical costs, CLTS training, management, facilitation and local participant costs. We present assumptions about each of the model parameters and assumed associations between them in the Supplementary Materials.
4 Results of benefit–cost calculations
4.1 Summary
In Table 2, we present the number of nonfatal statistical cases of diarrhea avoided, premature deaths averted, and hours saved by age group for each village type, and at the regional level.Footnote 24 Without including the positive sanitation externality, we find that around 50, 155, and 360 nonfatal statistical cases of diarrhea are avoided in each low-, medium-, and high-uptake village over the 10-year period, respectively. With the sanitation externality, additional reductions in diarrhea occur in all high-uptake villages, because coverage in these villages exceeds the threshold level beyond which the externality kicks in, such that 481 nonfatal statistical cases of diarrhea are avoided over the 10-year period in each high-uptake village. Overall, across the region with 100,000 people, we estimate that the intervention leads to a decrease of 28,634 nonfatal statistical diarrhea cases over the 10-year planning horizon when the externality is ignored, and 35,715 when the externality is included.
Estimates of cases of diarrhea avoided, premature deaths averted, and hours saved – from CLTS intervention, totals over 10-year planning horizon.

a We note here that the statistical cases avoided refers to nonfatal diarrhea cases.
Without the sanitation externality, the number of premature deaths averted is 0.025 per low-uptake village, 0.075 per medium-uptake village, and 0.17 per high-uptake village over the 10-year period. With the sanitation externality, the number of premature deaths averted in a high-uptake village is 0.23. Across the region, about 15 premature deaths are averted over the 10-year period from the intervention when the externality is not included and about 17 premature deaths are averted when the externality is included.
The distribution of health benefits across each age cohort is also presented in Table 2. Children under 5 receive most of the health benefits because almost half of the nonfatal cases avoided and two-thirds of the premature deaths averted are in this age cohort. Individuals 15 years and older experience a similar reduction in the number of nonfatal diarrhea cases avoided, while slightly less than one-third of the total premature deaths averted are for individuals 15 years and older. Since we assume that each household has two members between 5 and <15 years and two that are 15 years or older, the number of hours saved are the same for these two groups.
Finally, more than 12,000, 25,000, and 70,000 h of time are saved over the 10-year period in each low, medium, and high-uptake village, respectively. Across the region, more than 6,000,000 h are saved over the 10-year period due to adoption of latrines.
Table 3 presents the benefits, costs, NPV, BCR, and ERR of a CLTS campaign for villages with low, medium, and high-uptake of improved latrines from a CLTS program, and for all villages, with and without a positive sanitation externality. These results assume that all parameter values are set to their base case assumptions. In this hypothetical region with a population of 100,000 people, the present value of the cost of the CLTS rollout is Int’l $1,301,985. If there is no positive sanitation externality, the present value of the benefits is Int’l $2,237,630. If there is a positive sanitation externality, the present value of the benefits is Int’l $2,467,950. The BCRs are 1.7 and 1.9, respectively.
Summary of results of benefit–cost analysis (2016 Int’l $): low-, medium-, and high-uptake villages for three benefit–cost metrics (net present value, benefit–cost ratio, and economic rate of return (with and without positive sanitation externality).

Abbreviations: BC, benefit–cost; ERR, economic internal rate of return; O&M, operation and maintenance.
Benefit–cost results for base, poor effectiveness, and enhanced effectiveness cases at the regional level, for three benefit–cost metrics (net present value, benefit–cost ratio, and economic rate of return (with and without positive sanitation externality).

Abbreviations: BC, benefit–cost; ERR, economic internal rate of return; O&M, operation and maintenance.
Looking at the benefits and costs at the village-level, in villages with high-uptake, the CLTS intervention has a BCR of 3.2 if there is no positive sanitation externality and 3.8 if a positive sanitation externality exists as we have assumed. In medium-uptake villages, the BCR is 1.7 while in low-uptake villages, the BCR is less than one; the sanitation externality is not realized in these villages because the threshold coverage of 75 % is not achieved. Obviously, it would be desirable to focus the CLTS intervention only on high-uptake villages if these villages could be identified ex ante to program implementation, but we know of no evidence that would facilitate such targeting. If such communities have local knowledge about the likelihood of success of a CLTS intervention, then a lack of enthusiasm on the part of people living in low-uptake villages for a CLTS intervention may in fact reflect a realistic assessment of the economic costs and benefits of the intervention.
In this base case, the program costs constitute the majority of total costs (~75 %). In villages with high- and medium-uptake, the next largest cost component is the capital costs of latrine construction ~2 and ~12 % respectively. In villages with low-uptake, the second largest cost component is the time cost for households participating in CLTS activities (~5 %). One of the possible reasons for the extremely high BCRs for sanitation interventions in many previous studies is an underestimate of program costs.
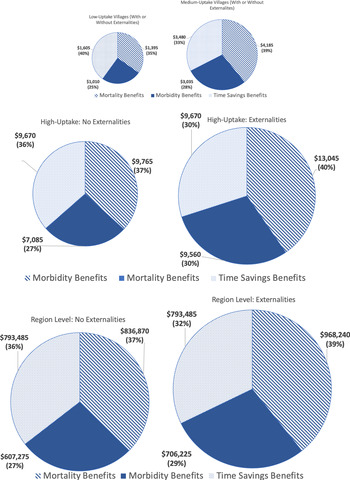
The mortality benefits from avoided premature deaths, the morbidity benefits from avoided nonfatal cases of diarrhea, and the time savings benefits from no longer walking to an open defecation site are shown in Figure 2 with and without a sanitation externality. In the cases with and without externalities, the total health benefits (mortality and morbidity benefits) are larger than the time savings benefits. The mortality benefits are 37 % of the total without externalities and 40 % of the total with externalities. The time savings are 36 % of the total benefits in the case without externalities and 32 % in the case with externalities. The morbidity benefits constitute 27 % of the total benefits without the externality and 29 % with the externality.
Distribution and size of benefits from the CLTS intervention per village types and at the regional level.

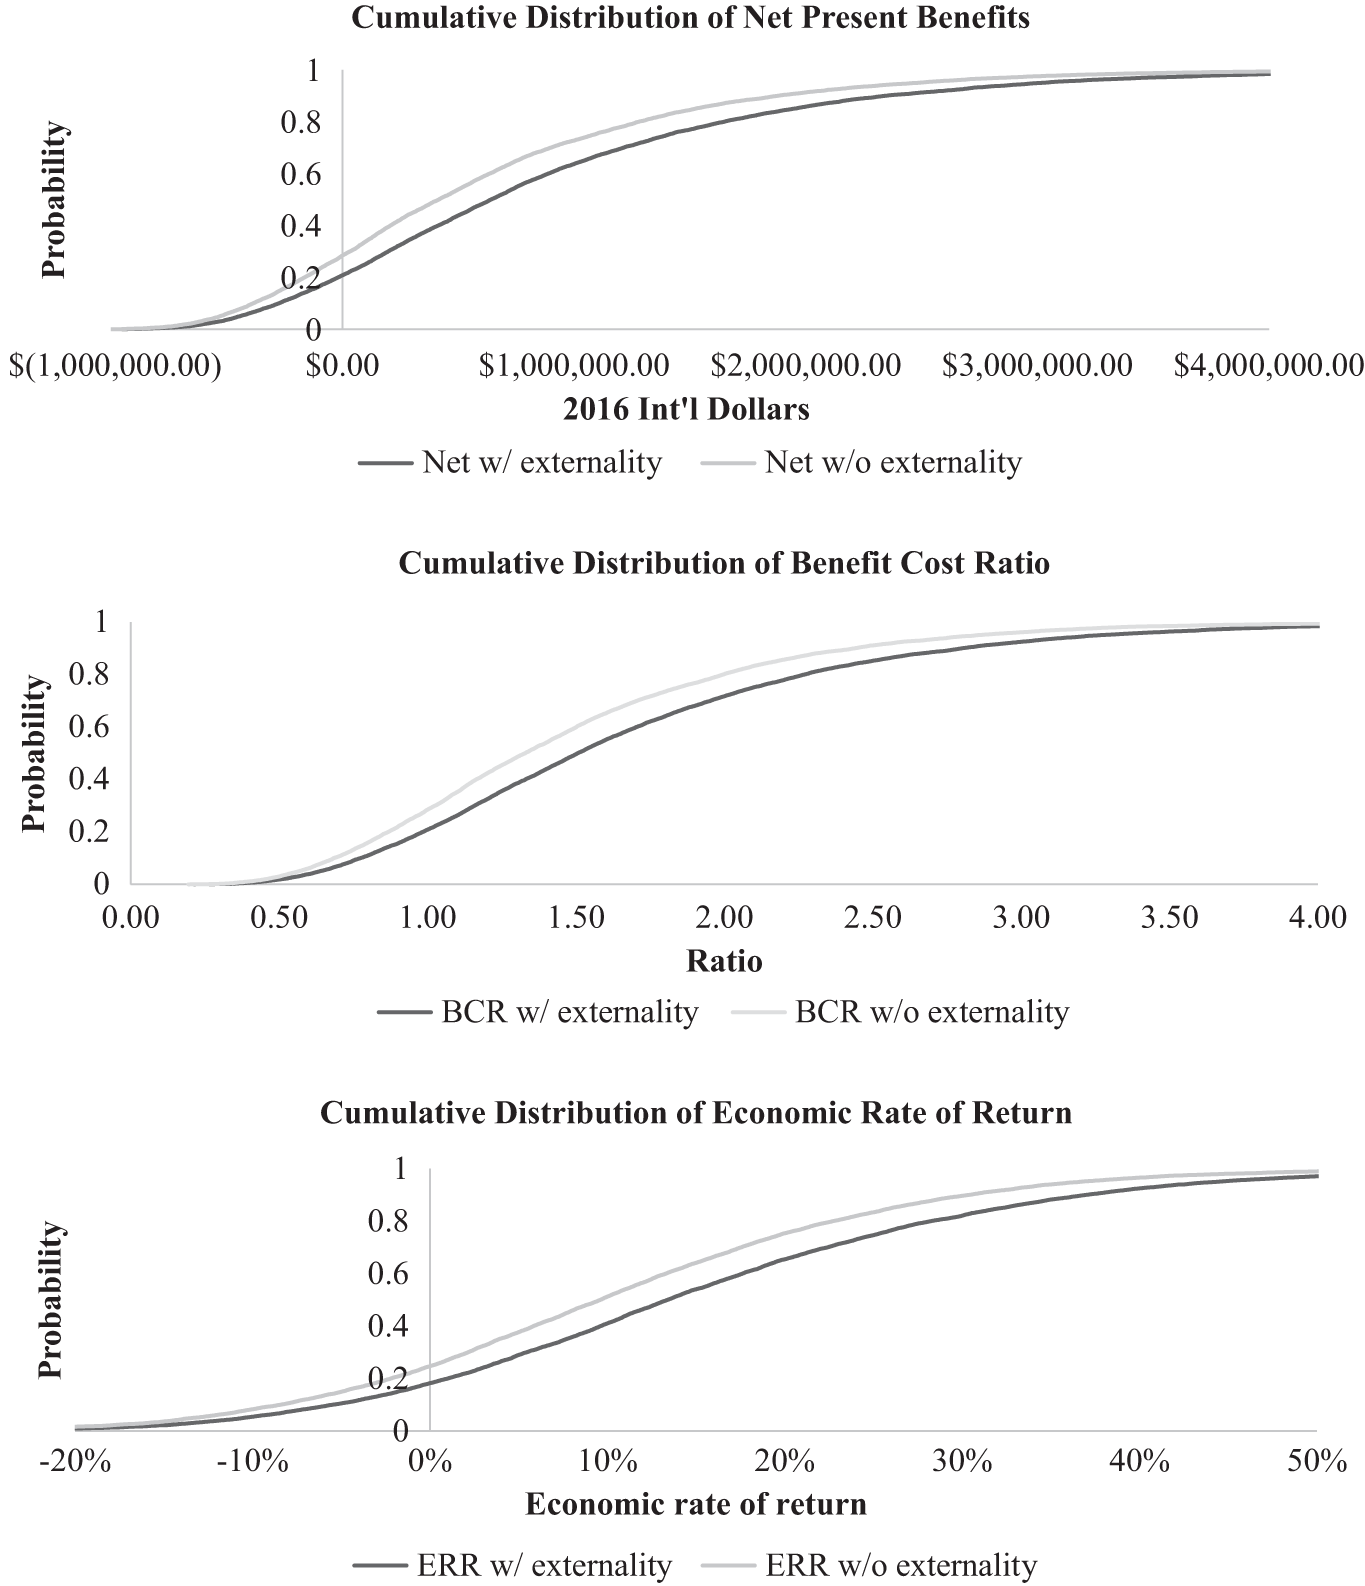
Cumulative distribution of results from Monte Carlo simulation (10,000 draws) of CLTS intervention: net present value (NPV), benefit–cost ratio (BCR), and economic internal rate of return (ERR)
4.2 Results of sensitivity analyses
Table 4 presents the results of the one-way sensitivity analyses of CLTS effectiveness that varies the proportion of high, medium and low impact villages. The present value of the costs of an intervention with low effectiveness is Int’l $1,228,975 while the cost of an intervention with high effectiveness increases to Int’l $1,367,585. The majority of the difference in costs is due to the capital and operations and maintenance costs of the higher number of new latrines constructed in the high effectiveness intervention. Benefits vary more across low and high effectiveness interventions. In a low effectiveness intervention, few villages achieve high enough coverage levels to experience the positive sanitation externality. The total present value of the benefits of a low effectiveness intervention without an externality is Int’l $1,653,600 and is Int’l $21,768,760 when the externality is included. In a high effectiveness intervention, the present value of the benefits is Int’l $2,774,185 without an externality and increases to Int’l $3,165,725 once the externality is included.
The effectiveness of the intervention has a large effect on the overall benefit–cost metrics. The NPV of the intervention on a regional level ranges from a low of Int’l $424,625 to Int’l $1,406,600 without an externality and from Int’l $539,785 to Int’l $1,798,140 with an externality. The BCRs range from around 1.3 in the low effectiveness intervention to 2.0 in the high effectiveness intervention without an externality, and from 1.4 to 2.3 with an externality. The ERR ranges from a low of 8 % in the low effectiveness intervention to 21 % in the high effectiveness intervention without an externality and from 10 to 26 % once the externality is included.
The results of the Monte Carlo analysis show that the potential range for all BCA metrics for a CLTS intervention can be large. Figure 3 present the cumulative density functions (CDF) of the NPVs, BCRs, and the ERRs, without and with a positive sanitation externality, respectively. The 5th percentile of the NPV without externalities is negative Int’l $(530,320) while the 95th percentile reaches Int’l $2,485,645 and with externalities is negative Int’l $(444,075) and Int’l $3,020,775 respectively. The 5th percentile of the BCR without an externality is 0.6 and the 95th percentile is 2.9 and with the externality is 0.6 and 3.3, respectively. The 5th percentile of the ERR without an externality is −13 % and the 95th percentile is 37 % and with an externality is −10 and 44 %, respectively. The NPV was greater than zero in about 75 % of the trials without an externality and in about 80 % of the trials when including an externality. However, the majority of the outcomes have benefit–cost metrics that, while positive, could easily fall below those for attractive interventions in other sectors (Arinaminpathy Reference Arinaminpathy2018a,Reference Arinaminpathy b; Belt et al., Reference Belt, Kashi, Mackinnon and Allien2017; Banik Reference Banik2018). It is thus by no means clear that CLTS interventions would be near the top of an economic ranking of development projects in a specific region; this would very much depend on local, site-specific conditions.
Figure 4 shows the 15 parameters that explain the largest portion of the variance of NPV across the simulations with and without a positive sanitation externality. In both cases the most and second most influential variables are the same: (i) the size of the diarrhea reduction for households adopting latrines when not including the externality and (ii) the per cent of villages with a low-uptake of the CLTS intervention. For the scenario with externalities the next most influential parameter is the size of the latrine increase in the high-uptake villages, which affects the extent to which the benefits from the externality kick in. For the scenario with and without the externalities, the next few most influential parameters are the value of time (including the per cent of the wage rate used to estimate the value of time, the informal wage rate, the total time spent traveling to defecation sites, and the number of trips to a defecation site per day). For the scenario including externalities the latrine increase in high-uptake villages and the externality are also important. For the scenario with externalities the next most influential parameter is the externality threshold. The next group of influential parameters are the VSL and the other health costs (including baseline GNI per capita, case fatality rate, health costs, and per cent of diarrhea cases with people seeking care). Other influential parameters include baseline diarrhea rate, baseline latrine coverage, and the discount rate.
Sensitivity analyses: Effect of selected parameters on Net Present Value (NPV) with and without Externality (holding other parameters at base case values)

5 Discussion
The results from a series of recent evaluations, including several RCTs, suggest that CLTS and similar sanitation interventions may be less effective in ending open defecation than CLTS proponents had hoped. In this paper, we have incorporated these findings along with the findings from other sanitation-related studies into an economic model designed to compare the benefits and costs of CLTS interventions at the regional level in a sub-Saharan Africa context. There are five key messages from our benefit–cost calculations.
First, after incorporating the results from these new sanitation evaluations, we still find that a CLTS intervention would pass a benefit–cost test in many plausible situations. However, the benefit–cost metrics (NPV, BCR, and ERR) are lower than those reported in the prior benefit–cost literature of CLTS interventions. It is quite possible that other WASH or non-WASH investments could be more economically attractive than CLTS interventions. Furthermore, the sensitivity analysis shows that while CLTS effectiveness has a major effect on net benefits, other contextual factors that may be outside of the control of those designing CLTS interventions are also important. Model parameters that describe baseline conditions – the assumed informal wage rate, the assumed GNI per capita, the VSL, the time spent walking to and from open defecation sites, the proportion of people with diarrhea seeking medical care, diarrhea case fatality rate, and the local baseline diarrhea incidence – all have large effects on the benefits of the intervention at the regional level. From our perspective, too much attention has been placed on improving estimates of the effectiveness of the CLTS intervention compared to obtaining better information on these other parameters (Whittington et al., Reference Whittington, Mark and Marc2020).
Second, the size of the diarrhea reduction for households adopting a latrine, the life of the latrine, and the nature of the externality relationship are influential variables in the benefit–cost model. It is somewhat ironic that despite all of the effort and expensive RCTs deployed to improve estimates of the effectiveness of CLTS, there remains such large uncertainty about the extent to which these interventions reduce diarrheal disease rates. As discussed in Section 3, there are many reasons for these inconclusive and variable results, but a key conclusion of our analysis is that improved point estimates of the average diarrhea reduction are not sufficient for careful economic analysis of CLTS interventions. A better understanding of what drives heterogeneity in outcomes (i.e., smaller and larger diarrhea reductions), including the shape and scope of the sanitation externality, is sorely needed.
Third, and building on this previous point, the importance of the positive sanitation externality remains unclear. Based on our calculations, and if the relationships proposed by Andres et al.’s (Reference Andres, Briceño, Chase and Echenique2017) analysis are accurate, the presence of a positive sanitation externality has only a modest effect on benefit–cost outcomes, and may not be the game changer that many people in the public health community seem to assume. Even more important than the externality relationship itself is the extent to which high uptake of latrines can be achieved using CLTS, because this determines whether or not the positive externality kicks in.
Fourth, since CLTS is not a household-level intervention, the results of a BCA of a CLTS intervention should be reported at a community or regional level. Recent CLTS and sanitation studies mostly report differences in means of their outcome variables at a relatively small (experimental) scale. In order to better analyze the impact of CLTS and other sanitation interventions, the authors of RCT evaluations should provide policy analysts more information about the entire distribution of outcome variables in treatment villages.
Fifth, we believe that there is little more to be learned from global “desk-top” benefit–cost calculations of sanitation interventions. The results of such calculations yield a wide range of outcomes that are dependent on local conditions, or model assumptions about them. Transferring benefit estimates from one study to the regional, national, or global level might make sense if the results showed that CLTS interventions were economically attractive under all plausible assumptions about crucial parameters, but this is not the case. Analysts need to do the hard work required to identify localities where the benefits of CLTS interventions will most likely exceed the costs by a large margin. This will require primary data collection to estimate the most important parameters in the analyst’s benefit–cost model, such as the income level and corresponding value of a statistical life, the baseline latrine coverage rates, the value of time, the time spent walking to open defecation sites, the diarrhea incidence, the diarrhea case fatality rate, and several parameters related to the cost of illness.
Supplementary Materials
To view supplementary material for this article, please visit http://dx.doi.org/10.1017/bca.2020.6.
Acknowledgments
This article builds on a working paper drafted to support the creation of guidance on conducting BCA, focusing on health and development policies implemented in low- and middle-income countries. The project was funded by the Bill and Melinda Gates Foundation, “Benefit–Cost Analysis Reference Case: Principles, Methods, and Standards” [OPP1160057]. More information is available on the project website: https://sites.sph.harvard.edu/bcaguidelines/. We would like to thank the following individuals for their comments on previous drafts of this paper: Clarissa Brocklehurst, Joe Brown, Anil Deolakikar, Ariel Dinar, Dustin Garrick, James Hammitt, W. Michael Hanemann, Dean Jamison, Subhrendu Pattanayak, Lisa Robinson, Kurt Schwabe, V. Kerry Smith, Brad Wong, and Mike D. Young, as well as seminar participants at Arizona State University, University of California at Riverside, University of Manchester, and University of Oxford, and two anonymous referees.


 Open access