


1. Introduction
Human factors (HF) aims to capture aspects of human psychology and physiology to interpret how users interact with interfaces (Thales Group, 2023). In recent years, the role of data and quantitative research within this field has begun to shift (Reference Holman, Walker, Bedinger, Visser-Quinn, McClymont, Beevers and LansdownHolman et al., 2021). Quantitative research methods traditionally employed in the design cycle, often yield generalized metrics that provide limited granularity. However, the advent of human digital modelling (Reference Wolf, Miehling and WartzackWolf et al., 2020) and the development of real-time, robust sensing technologies (Biometrics, 2024; Reference Uhlrich, Falisse, Kidziński, Muccini, Ko, Chaudhari, Hicks and DelpUhlrich et al., 2022) present a significant opportunity to enhance the design process with novel quantitative techniques, driving better product development. In order to best implement this within design research, an understanding of how to implement these emerging quantitative methods could complement established methodologies within ergonomics and human factors is needed (Reference Lin, Chen, Ali, Nugent, Cleland, Li, Ding and NingLin et al., 2024). Here in lies an opportunity to develop and explore how a mixed-method approach could provide more nuanced and personalised insights within the design cycle.
Traditionally, HF and ergonomics practice has shirked sensor usage to quantify human experience (Reference KanisKanis, 1998). Typically explored quantitative methods, in the form of surveys and anthropometric measurements do not provide sufficient granularity, whilst simulation tools often require bespoke solutions leading to long development times. This has led to the adoption and preference for qualitative methods (e.g. cognitive walk-throughs, focus groups, simulated use) within the HF community (ISO 13485:2016). During the maturing of these practices, advancements in machine vision, compute power and robust on-body and sensorised products have provided opportunities for real-time data display on individual user performance. This could provide in-situ interpretations of product usage, allowing for greater insights within qualitative workflows. By adopting a mixed-methods approach when utilising these new technologies, the rich contextual understanding of users from qualitative methods along with method familiarity is combined with the scalability and precision available from these more novel quantitative methods (Reference Teddlie and TashakkoriTeddlie & Tashakkori, 2009). This triangulation would result in greater validity and reliability with the human-centered design process, leading to better product outcomes (Reference Abowitz and TooleAbowitz & Toole, 2010).
Mixed methods is often a recommended approach when discussing human behaviour, thus making it widely relevant to the study of HF and ergonomics (Reference CashCash, 2020). However, it’s implementation presents significant challenges. To achieve sufficient triangulation, robust data capture systems must be ensured to provide accuracy and reliability. Additionally, interpretation of these sources must be done in a timely manner, and an understanding of what information is useful for design outcomes must be understood (Reference Fontes, Carpentras and MahajanFontes et al., 2024). Investigating how and when quantitative and qualitative methods are mixed, provides opportunities to explore the potential influence and role of data within user studies outcomes.
This moment represents a significant opportunity. While the primary focus of these technological developments has been on improving accuracy and accelerating data capture, there is still limited exploration of how these tools can be effectively integrated into existing HF methodologies (Reference BertoniBertoni, 2020; Reference Briard, Jean, Aoussat and VéronBriard et al., 2023). Understanding their practical application within these established frameworks remains an open and crucial area for investigation with important implications within the design community (Reference Gomez Ortega, Van Kollenburg, Shen, Murray-Rust, Nedić, Jimenez, Meijer, Chaudhary and BourgeoisGomez Ortega et al., 2022).
In this paper, a pilot study was conducted to explore the usage of quantitative data dashboards to facilitate a qualitative analysis of ergonomic actions. By looking at potential currently available technologies with low barriers to implementation, a review of current HF technologies and mixed-method design research, data dashboards were built comprising of personalised insights used to stimulate further insights within a semi-structured interview. The contributions of this paper are:
-
Investigate how integrating novel quantitative measures into qualitative HF workflows can enrich and validate ergonomic insights.
-
Examine the effect that having quantitative data dashboards on participants’ responses has, and draw on the trends that emerge to inform future larger scale studies
2. Literature review
Within this section, the available tools that could be utilised to provide useful personalised insights within the design cycle are explored. A review of current quantitative and qualitative research practices is then laid out, to understand current opportunities for implementations of these technologies. Finally mixed-methods study design fundamentals are explored, to understand how best to apply these within a design context. In sections 2.1 and 2.2, data capture methods are discussed.
2.1. Personalised data capture
To design products well, integration and understanding of user behaviours within the environment of user is vital (Reference GiacominGiacomin, 2015). Building an understanding of user behaviour often comes from working directly with the intended user populations, through ethnographic research, focus groups and interviews to build contextual understanding of the user’s beliefs, cognitive state and abilities (Reference FletcherFletcher, 2023). In (Reference HignettHignett, 2001), a human interactions model is defined, stating the different human facets that must be considered within ergonomics, emotional, social, cognitive, philosophical, physiological & biomechanical and anatomical & anthropometrical). When looking to enhance the qualitative exploration of these elements, these insights, along with inclusive design principles can help us determine what data could be used to greater inform ergonomics. This is summarised in (Inclusive Design Toolkit, 2023), as capabilities pertinent to perceiving stimuli, processing information and utilising motor skills. In the context of design research, recognising these aspects on an individual basis is vital to adding value into the design process.
In recent years, vast advancements have been made in machine vision capability, opening up new possibilities when at providing quantitative methods to assess user ability. The development of open-source pose and hand tracking algorithms allows for 3D pose tracking in a variety of scenarios, making their application in real-world scenarios feasible (Reference Cao, Hidalgo, Simon, Wei and SheikhCao et al., 2021; Kiselov, 2021/Reference Kiselov2024; Wang et al., Reference Wang, Sun, Cheng, Jiang, Deng, Zhao, Liu, Mu, Tan, Wang, Liu and Xiao2020), but requiring a high level of expertise needed to contribute and utilise these. Now, the development of simple interfaces, such as webcam-inference models and web-apps are being developed, increasing the accessibility of such tools. OpenCap (Reference Uhlrich, Falisse, Kidziński, Muccini, Ko, Chaudhari, Hicks and DelpUhlrich et al., 2022), utilises HRNet to build musculoskeletal models of people through a webapp interface, producing individualised skeletal movement. This system boots practical utility, along with state-of-the-art results. These more accessible machine vision tools present many opportunities for the design community, however, there is little guidance on how to translate this back into information that supports human centred design decisions. Implementation within this field requires knowledge of what other useful quantifiable information can complement these tools, along with what qualitative methods should be used to interpret results ensuring timely insights, good interoperability of data and robust data collection.
2.2. Human factors methodologies
Quantitative methods - Typically, HF incorporates quantitative data to produce quick and objective interpretations of general trends. In industrial ergonomics, this often is assessed through surveys, such as RULA (Rapid upper limb assessment), utilising anthropomorphic measurements (Reference Whitefield, Wilson and DowellWhitefield et al., 1991), or existing sources and databases for past similar products and systems. The usage of these tools is useful when giving overviews of risk, however when used in isolation, tend towards oversimplification. In addition to this, while these techniques call for objectivity, it’s been found that in many cases, surveys produce widely different results even on the same task (Reference Joshi and DeshpandeJoshi & Deshpande, 2019). While some more complex measurement tools are used, such as digital human modelling tools (Reference Wolf, Miehling and WartzackWolf et al., 2020) and ergo-simulation tools (Reference BlanchonetteBlanchonette, 2010), the majority of these have a large setup associated, requiring visual markers on participants within a controlled environment. Without a deeper understanding of the operators, their usage in a more realistic environment and the lack of interdisciplinary teams that can interpret this reduces their overall usefulness.
Qualitative methods - Qualitative tools in HF and ergonomics lend themselves to producing a more holistic interpretation of the product interaction at hand (MHRA, 2021) (Reference Hignett and McDermottHignett & McDermott, 2015). To ensure systematic exploration of user needs, industry specific frameworks have been created, applying different techniques throughout the design process, such as semi-structured interviews, task analysis and think-aloud activities (FDA, 2016). Similarly to DHM tools, the setup for qualitative studies is labour intensive, particularly in the synthesis of tangible and actionable outcomes to provide changes in system design, lengthening the product design cycle. Consequently, these methods create deep and rich insights at the sacrifice of time consuming corroboration, as summarised in (Reference Ormerod, Dybvik, Fraser and SniderOrmerod et al., 2024). The utilisation of truly objective measurement alongside qualitative practices may lead to more direct questioning and tangible outcomes, reducing the work needed to synthesize necessary design changes.
2.3. Mixed-methods
Within the context of implementing new technologies within ergonomic analysis, there are 2 main aspects to consider within a mixed-methodology design (Reference Schoonenboom and JohnsonSchoonenboom & Johnson, 2017). Firstly, timing must be considered i.e. when qualitative and quantitative studies take place. The cyclic process of design research naturally lends itself towards sequential studies, or more specifically, conversion studies, where qualitative and quantitative steps are iterated upon, where both are used to inform one another, and analysed in both qualitative and quantitative aspects in order to answer the same research question (Reference Teddlie and TashakkoriTeddlie & Tashakkori, 2009). Secondly, the point of integration must be considered, in which when data mixing occurs whether that be in conceptualisation, experimentation, analytics or inference. Within this, the way in which how data is mixed should be considered. This may look like merging datasets, connecting analysis from dataset to the next, of embedding one form of data within a larger design procedure (Reference GuestGuest, 2013). Within the context of product design, maximum interoperability and timely outcomes are essential. Embedding quantitative data collection into already defined qualitative HF procedures is likely to result in the more recognisable impacts within the design cycle.
2.4. Reflection
Literature shows that it is feasible to provide data-driven, personalised data capture within user studies, showcasing factors pertinent to product interaction. To present this effectively alongside holistic insights, we must first understand how to embed these technologies and investigate the effect of including quantitative data in existing qualitative workflows. Within this work, we will utilise new machine vision-based tools and utilise the information generated to provide useful personalised insights through personalised data dashboards. Within this we explore how this could be applied in a mixed-methods approach and how implementation may affect study outcomes in a comparative study between two approaches.
3. Pilot study
In this study, personalised data dashboards were designed and created based off participants movements during a simple activity. The created dashboards were used to drive and prompt conversation within follow-up interviews, with one group (data-first) shown data at the very beginning of the interview and another (data-second) shown data halfway through the interview. The interview content was then analysed qualitatively to determine the overall attitudes to the dashboards and the affect of differing points of integration within this mixed-method approach. The full process flow for data collection and analysis is displayed in Figure 1.
Experiment data collection and analysis flowchart

3.1. Participant study
10 able-bodied participants (8 Male and 2 Female) were recruited, all of whom were engineering researchers. They were asked to complete an example ergonomic activity, comparable to tasks that may be completed by operators within a factory environment. To leverage the potential insights of utilising skeletal tracking, the effects of this needed to be isolated, focusing on tasks that are easily repeatable, with an efficient setup, not overly reliant on participant understanding. The designed task comprised of two handle turning activities.
A simple jig was devised, consisting of an interchangeable handle on a lever arm, one with a long radius (400mm) and one with a short radius (100mm) as shown in Figure 2a). A 2.5kg counterweight was placed on the back of the flywheel offset from the crank’s centre, to provide resistance and inconsistency of motion. Participants were asked to turn the handle in 1-minute intervals, repeating 5 times for each task, with the aim of turning the handle and smoothly and consistently as possible. The setup comprised of a plain background to increase the likelihood of good pose estimation, and participants were asked to wear, plain contrasting clothes as shown in Figure 2a) and 3a). Participants completed the task with their right arm.
a) Experiment area, featuring apparatus with interchangeable handle b) Birdseye view of experiment area with camera views

Technical pipeline of dashboard development, a more detailed view of dashboard is available in Figure 4

3.1.1. Experimental setup
During the participant study, quantitative data was collected, looking at participant muscle activation and body positioning. Muscle activation data was collected using EMG sensors (Biometrics, 2024), placed on the bicep and posterior deltoid (shoulder) muscles, which were both found to achieve significant muscle activation during the task during initial development phases. The collected signals were filtered in accordance with best practice (Reference Raez, Hussain and Mohd-YasinRaez et al., 2006), although data remained non-normalised since the data was presented on the per-participant basis.
To achieve accurate pose tracking, OpenCap was utilised to achieve a 3D representation of the musculoskeletal movements of participants (Reference Uhlrich, Falisse, Kidziński, Muccini, Ko, Chaudhari, Hicks and DelpUhlrich et al., 2022). This utilises 2 or more iOS devices, calibrated through the use of a checkboard, implementing HRNet to obtain 3D pose landmarks (Reference Wang, Sun, Cheng, Jiang, Deng, Zhao, Liu, Mu, Tan, Wang, Liu and XiaoWang et al., 2020). The generated 3D landmarks are inputted into OpenSim’s inverse kinematics regime to produce the 3D skeletal models, allowing tracking of further body landmarks and joint angles (OpenSim, 2024). In our setup, 3 devices were placed around the participant - each needing a full body view of the participant for skeletal scaling step as shown in Figure 2b). A grey backdrop was placed around the experiment area making contrast with the ground and background greater and increase tracking accuracy. Participants were asked to wear dark trousers and a vest to ensure good adhesion of EMG sensors, and aid pose tracking further. The produced skeletal model was scaled to the participant’s height and weight during a calibration phase, allowing for movement to be relative to the participant. The body tracking was completed over OpenCap’s cloud server, generating joint angle positions for a participant within around 15 minutes. It was found that the highest root-mean-square-error in the inverse kinematics from the pose tracking was found to be 7.7cm, in the right shoulder.
3.1.2. Data collection and dashboard creation
Dashboards were created, containing insights collected from both EMG and skeletal tracking data as shown in Figure 3 and 4. Two movement-based graphs were displayed, with specific contents selected on a per-participant basis, to draw out the most interesting differences between the participant’s technique in both scenarios as shown. These typically looked at the right knee angle, pelvic lateral movement about the vertical axis, lumbar bending, and right arm adduction. Since the aim was for maximum smoothness and consistency of motion, a movement consistency measurement was calculated, utilising the right wrist marker tracking data in x,y,z, coordinates, calculating the coefficient of variance of the velocity magnitude.
Example dashboard insights for a participant

3.1.3. Follow up interview
Within the semi-structured interview, the researchers aimed to target to what extent the dashboard reflected participant experience. The line of questioning focused on physical activities as these were most pertinent within this investigation. In order to investigate the effect of data presentation, common experiential questions were featured for both data-first and data-second participants, based around NASA-TLX (NASA-TLX Guidelines, 2024), replicating a scenario where data or no data was present within the interviews as shown in Figure 5.
Interview question and dashboard presentation order for data-first & data-second groups

3.1.4. Qualitative analysis
The interview transcripts were transcribed with descriptions and then coded per question in NVivo. Through this, the contents of the interviews was sorted through open-coding of responses, providing low-level coding of the interview. Open-coding of responses occurred per sentence (i.e. multiple mentions in a similar manner in one sentence would count towards one coded segment), which were then organised and adjusted into larger holistic themes. To corroborate further thematic analysis, two researchers reviewed assignation of the open-coding of responses to each larger theme to resolve conflicts and ambiguity (Reference Hignett and McDermottHignett & McDermott, 2015), of which none-were found. Here, overall themes emerged as well as more specific comparative themes between the data-first and data-second groups.
4. Results and findings
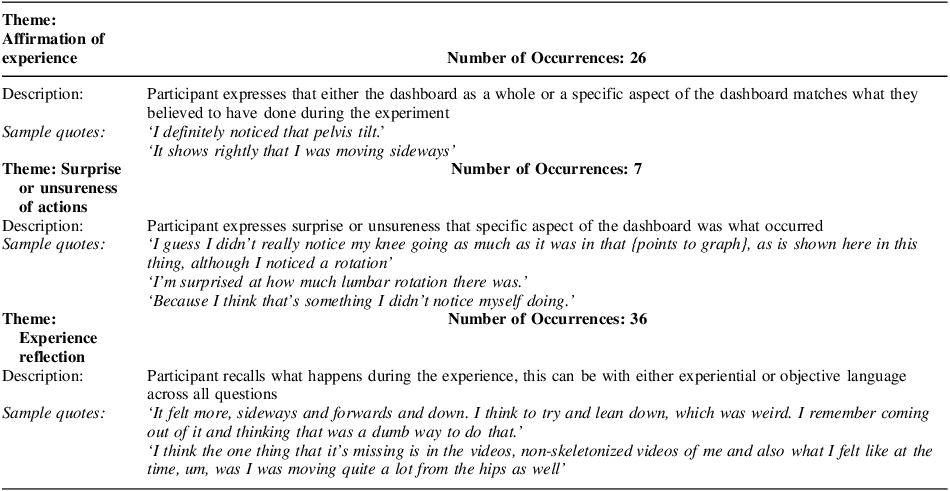
Upon reviewing the text, a thematic analysis was undertaken to investigate the overarching attitudes towards the dashboards and investigate differences between data-first and data-second groups, informing our understanding of how and when quantitative data might best be introduced in a qualitative context. Within the initial open coding scheme, 3 overarching themes emerged, shown in Table 1, showcasing the total number of occurrences across the whole participant pool.
Main themes that were present over all interviews and questions

All participants vocalised that the data presented was representative. Minor disagreements were found over specific data presentations such as specific movements or muscle fatigue presented, with 1 participant reflecting the skeletal movement graphs presented didn’t reflect their most noted motion difference between both scenarios. Additionally, 2 participants felt the data didn’t completely reflect their performance in the motion consistency measurement. In these cases, reference to the graphs and videos prompted experience reflection helping participants to further elaborate why or why not this was the case. Furthermore, the personalisation of this information allowed participants to see themselves and their actions in the data, which regardless to the degree in which they felt they experienced what was shown, allowed for participants to parse further insight on during the interviews.
4.1. Comparative insights
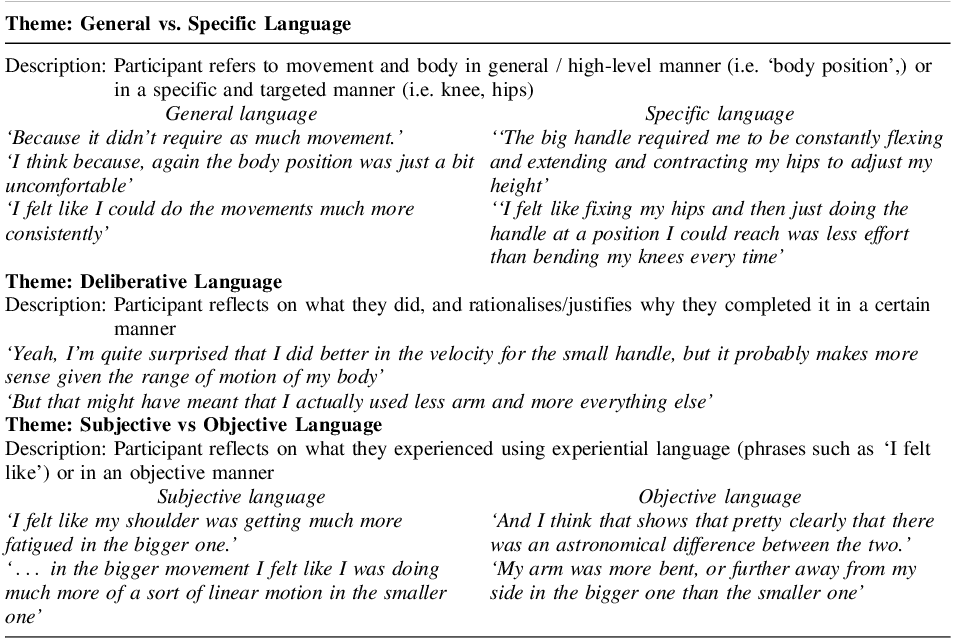
Responses were directly compared between the data-first and data-second groups, to determine the impact that presentation of data had on responses. Only insights from the common questions between each group were used, (Question 2 for data-first and Question 1 for data-second). Themes identified centered on degree of specificity in participant responses, and the form of reflection that they employed. Between the data-first and data-second groups, 3 key comparisons emerged as summarised in Table 2. The data-first group contained 66 coded segments, and the data-second contained 80. The comparisons are normalised against this and are presented as both number and percentage of coded segments.
Table to show comparative between data-first and data-second groups

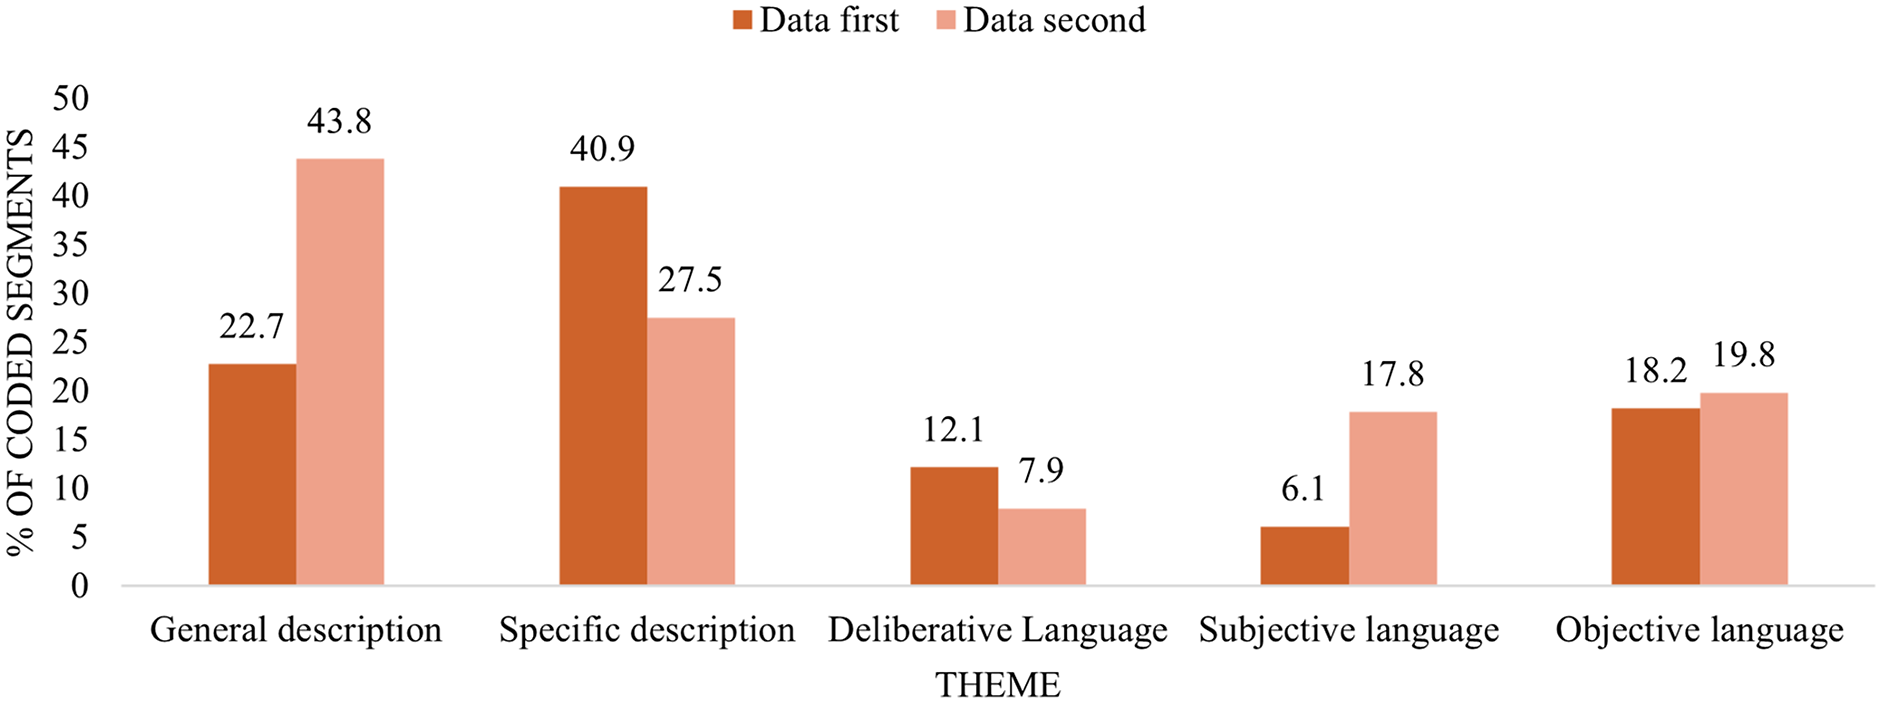
As shown in the table and graph in Figure 6, it was found that within the interviews across the whole participant pool there was:
% of coded-segments between comparative themes for data-first and data-second groups

-
More instances of deliberative language when shown the data first (+4, +4.20% coded segments)
-
Less instances of subjective language when using the data first (-5, -11.8% coded segments)
-
Similar instances of objective language between both cases (+2, -1.6% coded segments)
-
Less instances of general descriptions when shown the data first (-5, -13.4% coded segments)
-
More instances of specific descriptions when shown the data first (+20, +21.0% coded segments)
These findings suggest that the point of integration of the study has impact on the language that participants use to describe their experience. With reference to objective data, participants decreased the amount of subjective language used substantially, while references using objective language stayed largely the same. For data-first participants, having this information during more experiential questions, caused greater recalls of what occurred for them. In addition to this, the reference to specific joints and muscles within the dashboard provided context as to what was of interest within the study, allowing participants to deliberate in more detail whether these specific details on the dashboard were true or not, as demonstrated by the increase in usage of specific body parts and actions within the interviews. The presence of these trends during a small-scale study shows these are potential avenues of exploration in larger scale experimentation.
5. Influence of data presentation on user interpretation
The aim of this study was to utilise personalised data capture to facilitate a mixed-methods approach to analyse ergonomics. This was achieved by embedding the reflection of quantitative information into semi-structured interviews, investigating the effect within qualitative interpretations of user’s ergonomic experience. Our results show that these dashboards provided meaningful, participant-specific reflections of physical effort and movement, which was recognised by participants consistently. In addition to this, the order of data presentation impacted the way in which participants communicated their experience. Presenting the dashboards earlier made language less subjective and specific and resulting in more experience deliberation. In contrast, withholding data until later preserved more experiential language. Thus, the trends found within this pilot can inform future larger scale mixed-method HF research.
It’s important to note that this study consisted of a constrained setup, requiring clear line-of-sight for skeletal tracking calibration and with plain clothes and backgrounds. However, as sensing technologies become more robust and adaptable, their use in more complex real-world scenarios is likely to become more feasible. This pilot focused on physical effort and musculoskeletal movement, however there are many applicable technologies that may inform other facets of HF such as, attention span, stress or cognitive load. If applied thoughtfully, these methods may offer new ways to quickly validate participant feedback, reduce researcher bias, and inform iterative design decisions. However, careful consideration is needed to avoid narrowing participants’ attention only to the variables represented in the dashboards, at the expense of broader experiential factors.
6. Prospects and challenges
In the following section, key prospects for integrating personalized quantitative feedback into HF methodologies are discussed, along with the technical, practical, and interpretive challenges that lie ahead. While this study focused on physical movement and effort within product interaction, there are lots of other important facets that will drive product interaction, of which some are measurable in similar capacities displayed in this work. The use of eye tracking (Reference Steichen, Carenini and ConatiSteichen et al., 2013), EEG (Electroencephalography) and fNIRs (Functional Near Infrared Spectroscopy) have all been shown to correlate brain activity to stimuli presence and the associated cognitive load, which could lead to indications of intuitiveness of product interaction (Reference Dybvik, Erichsen and SteinertDybvik et al., 2021). However, the ease of interpretation of these data sources by researchers and participants must be considered. The level of interoperability between different data sources, what can objectively be confirmed by the data displayed without leading participants to conclusions is of upmost importance.
With this, it is recognised that the technical setup and skill-set required to complete mixed-methods research is demanding. However, utilising mixed methods within a more cyclical nature would significantly reduce the overheads associated with technical development. For example, once qualitative information draws out either correctly intuited points of interest or introduces new ones, automated dashboard display tools could be utilised (Tableau, 2024). This could drastically reduce the time in between data-collection and follow-up interviews, allowing for fresher recall. Whilst skeletal tracking requires processing time, there are many 2D pose tracking algorithms that can provide real-time feedback. Using these tools to tailor participant performance in-situ is an exciting potential opportunity.
This leads onto the role of participants as stakeholders within this work. Within this study, the usage of participants actively involved in research with engineering backgrounds leads them to be data literate and relatively invested in the outcomes and investigation occurring. However, this may not always be the case in user studies and the active involvement of participants, and the outcomes will have significant impact in their interpretation. Assuming or assessing the data literacy amongst participants, the larger effects of dashboard design on interpretation and the level of personalisation that is appropriate in a context should all be considered. This provides opportunities for applications where personalisation is key to successful product interaction, data literacy is high, such as in sports performance and equipment design, or specific occupational health industries such as surgical equipment design.
7. Conclusions
This study highlights the potential of a mixed-method approach to ergonomic analysis, integrating personalized data dashboards with qualitative and quantitative methodologies. By leveraging skeletal tracking and muscle sensing, it was demonstrated that for this simple ergonomic task, quantitative data has the potential to enrich qualitative feedback, affirming participant experiences and encouraging detailed, less subjective reflections. It was found that the timing of integration affected participant responses, with earlier data presentation encouraging deliberation and specificity of language. In future work participant data literacy, the role of participants as stakeholders in their ergonomic performance and the degree to which personalisation if important should be considered in its application. This research provides a foundation for utilizing new forms of personalized data in human-centered design, enhancing qualitative procedures to provide further user-centeredness in future ergonomic evaluations.


 Open access