





1. Introduction
Over the past five years, multiple laws and regulations have been introduced that protect and empower health care consumers. The No Surprises Act, implemented in 2022, prohibits out-of-network providers from billing patients for the amount not reimbursed by insurance (i.e., ‘balance billing’) in situations where patients cannot reasonably shop for care (e.g., emergency services, radiology, pathology, air ambulance services, etc.). To regulate out-of-network reimbursements for these services, the No Surprises Act established a final-offer independent dispute resolution (IDR) system. At the time of its passage, the No Surprises Act was expected to lower out-of-network reimbursements (and potentially in-network reimbursements) through its reliance on median in-network prices as a benchmark in the IDR system (Congressional Budget Office, 2021). The No Surprises Act was part of the Consolidated Appropriations Act of 2021, which contained additional health care consumer protections (e.g., prohibition of gag clauses, disclosure of broker compensation for employer-sponsored health plans). Also in 2022, the Transparency in Coverage final rule was implemented, which requires health plans to publicly disclose the rates they have negotiated with health care providers.
These federal regulations largely replaced, or augmented, a patchwork of federal and state laws that were ambiguous or only applicable to the subset of health plans under state jurisdiction, health plans that are fully-insured (i.e., where the health insurance company bears all risk). State-level health care consumer protections, where they existed, did not apply to patients in self-funded health plans, where the sponsoring employer or union bears all risk. These universal federal regulations were also introduced in a period of rapid change in the physician marketplace. From January 2019 to January 2024, the percentage of U.S. physicians employed by hospitals, health insurers, or physician staffing companies increased from 62 percent to 78 percent (Avalere Health, 2024).
Little is known about the cumulative effect of these changes on health care prices and patient cost-sharing. We use a large multi-payer database of health insurance claims for employer-sponsored health plans to describe the trajectory of prices and patient cost-sharing for clinicians who are likely most affected by these changes: emergency physicians, radiologists, pathologists, and neonatologists. Prior to the No Surprises Act, a substantial percentage of these specialists were out-of-network with commercial health plans ((Sun et al., Reference Sun, Mello, Moshfegh and Baker2019), (Cooper et al., Reference Cooper, Morton and Shekita2020)) and used the threat of out-of-network balance billing when negotiating in-network contracts with commercial health plans (Rasmussen et al., Reference Rasmussen, Duffy, Yardi, Fronstin, Hall and Trish2025). The No Surprises Act removed this bargaining threat and regulated out-of-network reimbursements with its IDR system. Thus, the effects of the No Surprises Act on in-network and out-of-network reimbursements are most likely to be felt in these specialties.
We separately estimate in-network and out-of-network prices and cost-sharing for fully-insured and self-funded health plans, measuring price changes prior to and after the recent regulations were implemented. Given the simultaneous implementation of the No Surprises Act and Transparency in Coverage regulations, and their universal application to all states and across all health care providers, standard causal inference techniques are not feasible. States with a prior balance billing law varied their methods of application, regulation, and enforcement in a manner that is difficult to measure and compare with the No Surprises Act (Garmon et al., Reference Garmon, Li, Retchin and Xu2024a; Garmon et al., Reference Garmon, Li, Retchin and Xu2024b), so they would serve as poor controls and the relative exposure to the No Surprises Act would be difficult to quantify. For this reason, we focus on simply describing and characterising the trajectory of in-network and out-of-network prices and cost-sharing. Still, these state laws only applied to fully-insured health plans, so we separately estimate fully-insured and self-funded prices and cost-sharing.
We find that in-network prices and cost-sharing generally increased for all four specialties and both fully-insured and self-funded plans between 2012 and 2022. However, we observe periods of decline in out-of-network prices and cost-sharing and different price trajectories across self-funded and fully-insured plans. Although we cannot isolate the causal impact of any law or regulation, our results suggest that out-of-network prices and cost-sharing decreased over time, particularly for self-funded health plans, with a pronounced decrease in 2022.
Below, we provide additional background, including descriptions of the No Surprises Act, Consolidated Appropriations Act of 2021, and Transparency in Coverage regulations. Section 3 describes our data and methods. Our results are described in Section 4 and we conclude in Section 5 with a discussion of the implications and limitations of our analysis.
2. Background
In the U.S., of those with health insurance, 53 percent receive it as an employment benefit (i.e., Employer-Sponsored Insurance) (KFF, 2025a). There are two types of employer-sponsored insurance: fully-insured and self-funded. Fully-insured health plans involve the employer or union purchasing an insurance product (with premiums usually split between the employer and employee) in which the insurer bears all risk for the health care claims of the employees. In self-funded health plans, the employer provides the health plan directly to employees and bears all risk for employee health care claims, paying these claims directly to health care providers. Usually, employers with self-funded plans contract with third party administrators or health insurers (using an Administrative Services Only contract) to manage the self-funded health plan, negotiate provider contracts, and process claims, even though the employer is ultimately responsible for all employee health care spending.
The two types of health plans are subject to different regulatory systems. As an insurance product, fully-insured plans are subject to state and local insurance regulations. However, self-funded plans are regulated by the federal Employee Retirement Income Security Act (ERISA). Most state and local insurance regulations do not apply to these plans (which is often described as the ‘ERISA Preemption’). For example, state laws that prohibit balance bills by out-of-network clinicians practicing in in-network facilities and regulate out-of-network reimbursement in these situations do not apply to self-funded plans. In addition, state laws that require health plans to ‘assign benefits’ to out-of-network providers (i.e., pay out-of-network providers directly) do not apply to self-funded plans (AHIP, 2019).
Fully-insured and self-funded health plan markets have evolved differently, in part due to these regulatory differences. Large, multi-state employers tend to use self-funded plans because they can spread risk over a large employee base and they can design uniform plan benefits for employees in different states without adjusting the plans to comply with state and local regulations. Smaller employers, especially those with employees in few states, tend to use fully-insured plans to avoid the health spending risk of a catastrophic illness to one of their employees. Among firms with at least 50 employees, 65 percent of those enrolled in health insurance are in self-funded plans. For firms with fewer than 50 employees, only 15 percent of enrollees are in self-funded plans (KFF, 2025b).
Prior research has found that self-funded plans pay higher prices to providers than fully-insured plans (Craig et al., Reference Craig, Ericson and Starc2021; Pelech and Stockley, Reference Pelech and Stockley2022). Some have speculated that this was because employers with self-funded plans were unable to observe granular prices from the information provided by their third party administrators and through Administrative Services Only arrangements with insurers (Pelech and Stockley, Reference Pelech and Stockley2022). Prior qualitative research found that, for out-of-network reimbursements prior to the No Surprises Act, self-funded health plans paid more than fully-insured plans to protect employees from balance bills (Rasmussen et al., Reference Rasmussen, Duffy, Yardi, Fronstin, Hall and Trish2025). However, most quantitative research on self-funded vs. fully-insured price differences has focused on hospital prices. There are few studies of the difference between self-funded and fully-insured prices for professional services.
Recent legal developments may have affected the market dynamics that determine prices and cost-sharing for both types of plans, but these changes may have impacted self-funded plans more directly. Arguably, the most important recent development is the No Surprises Act, part of the Consolidated Appropriations Act of 2021, implemented on January 1, 2022. The No Surprises Act prohibits out-of-network emergency and air ambulance balance billing and balance billing by out-of-network professionals in in-network facilities without prior consent. Ancillary out-of-network clinicians (such as anaesthesiologists, radiologists, and pathologists) cannot balance bill regardless of prior consent. These balance billing protections do not apply to ground ambulance services.
The No Surprises Act also established a federal IDR system to adjudicate payment disputes between out-of-network providers and health plans. Health plans are required to send an initial payment to the out-of-network provider. If the out-of-network provider finds the payment insufficient, the provider can initiate the IDR process. The No Surprises Act’s IDR system uses final-offer (i.e., ‘baseball-style’) arbitration, in which each side submits their best and final offer and the arbiter picks one of the two offers as the prevailing reimbursement. According to the No Surprises Act and subsequent guidance and judicial decisions, the arbiter may consider many factors. One explicit monetary factor the arbiter can consider is the Qualified Payment Amount (QPA), which is the median in-network rate for the service in the relevant area in 2019 inflated forward. The QPA is calculated by the health plan, is the basis for patient cost-sharing, and is reported along with the health plan’s initial payment to the out-of-network provider. It is also reported to the arbiter if the provider initiates the IDR process.
Prior to the No Surprises Act, out-of-network prices were regulated by a patchwork of federal and state laws with limited effectiveness. The Patient Protection and Affordable Care Act (ACA) of 2010 included a clause that required out-of-network patient cost-sharing to be the same as in-network cost-sharing, but only for emergency services. The ACA did not outlaw balance billing by out-of-network emergency providers. Instead, the agencies tasked with implementing this ACA provision created a reimbursement floor for out-of-network emergency providers to discourage balance billing. This reimbursement floor was commonly referred to as the Greatest of Three (GOT) rule because it required health plans to pay out-of-network emergency providers the greatest of the median in-network rate, the Medicare rate, or ‘the amount for the emergency service calculated using the same method the plan generally uses to determine payments for out-of-network services (such as the usual, customary, and reasonable charges) but substituting the in-network cost-sharing provisions for the out-of-network cost-sharing provisions’ (Department of Health and Human Services et al., 2010). The American College of Emergency Physicians objected to the ambiguity of the third prong of the GOT rule and filed suit against the implementing federal agencies. This lawsuit was not completely resolved until 2018, when the GOT rule was finalised (Keith, Reference Keith2018). Some evidence suggests that health plans increased their use of median in-network rates for out-of-network reimbursement throughout the 2010s, despite the fact that median in-network rates are usually less than usual, customary, and reasonable charges (Garmon et al., Reference Garmon, Li, Retchin and Xu2024a). During this time period, numerous states passed laws protecting patients from out-of-network balance billing by emergency providers and out-of-network ancillary clinicians practising in in-network facilities. These laws only applied to fully-insured health plans, not self-funded plans, and they had disparate impacts on prices and network participation due to differences in reimbursement regulation, scope, and enforcement (Garmon et al., Reference Garmon, Li, Retchin and Xu2024a, Reference Garmon, Li, Retchin and Xu2024b).
In anticipation of the No Surprises Act, many expected it to lead to lower in-network and out-of-network prices, primarily from the focal benchmark of the QPA. (Congressional Budget Office 2021) Post-implementation qualitative research (Rasmussen et al., Reference Rasmussen, Duffy, Yardi, Fronstin, Hall and Trish2025) reported that out-of-network providers were receiving lower prices, primarily from the initial payments under the No Surprises Act, and some in-network providers were receiving lower prices due to the reduced leverage in negotiations with health plans caused by the inability to threaten balance billing without a contract. Because self-funded out-of-network prices were higher than fully-insured out-of-network prices prior to the No Surprises Act, in part to protect employees from balance billing, it is reasonable to expect that self-funded and fully-insured out-of-network prices would converge, with self-funded prices falling more than fully-insured prices, after the implementation of the No Surprises Act. However, data from completed IDR disputes in 2023–2024 show providers winning the vast majority of disputes, with winning amounts that are substantially higher than the QPA (Duffy et al., Reference Duffy, Garmon, Adler, Biener and Trish2024). This could lead to higher out-of-network reimbursements, as health plans try to avoid the IDR system, and higher in-network reimbursements due to the increased negotiating leverage of providers with health plans, due to arbiters favouring providers. This uncertainty about the potential deflationary or inflationary effects of the No Surprises Act motivates our study.
Apart from the No Surprises Act, other provisions of the Consolidated Appropriations Act of 2021 may also impact prices. The Consolidated Appropriations Act of 2021 banned gag clauses in contracts between insurers or third party administrators and providers, so that disaggregated price, cost, and quality information could be shared with patients and employers (CMS, 2024). This could give self-funded plans more information about their reimbursements to health care providers, leading to more price sensitivity from employer-sponsors of health plans. The Consolidated Appropriations Act of 2021 also requires insurance brokers to disclose any commissions they earn from health insurers or third party administrators.
At the same time that the No Surprises Act was implemented, the health plan Transparency in Coverage Final Rule was implemented (CMS 2020). The Transparency in Coverage Final Rule mandates that all self-funded and fully-insured health plans publicly disclose (in monthly machine-readable files) all negotiated rates with in-network providers and all payments to and charges from out-of-network providers. Public disclosure of negotiated in-network rates and out-of-network payments could affect prices by allowing health plans to observe competitors’ prices and allowing providers to observe competitors’ reimbursements. A reasonable expectation is that this would lead to less price dispersion, but its net effect on prices is unclear.
3. Data and methods
Commercial health insurance claims from the Health Care Cost Institute (HCCI) were analysed for this study. The analytic sample comprises professional claims for services performed in both inpatient and outpatient settings from the years 2012 through 2022 with Current Procedural Terminology (CPT) codes indicating emergency medicine, neonatology, radiology, and pathology services. These commercial claims are from a consistent set of data contributors – multiple large insurers – for all years of the study. Additional details on the analytic sample construction are provided in the technical appendix.
Within each specialty, we assessed trends in allowed amounts and cost-sharing obligations (sum of deductible, coinsurance, and copayment) over time using a series of multivariate linear regression models. Seven stratifications are analysed in order to explore heterogeneity in payment trends by plan funding and network status, as these two attributes directly impact the policy and economic circumstances of claims. The seven stratifications are: (1) all claims, (2) all self-funded claims, (3) in-network self-funded claims, (4) out-of-network self-funded claims, (5) all fully-insured claims, (6) in-network fully-insured claims, and (7) out-of-network fully-insured claims.
We used the ratios of nominal allowed amounts and cost-sharing to Medicare fee-for-service allowed amounts to account for the geographic variation and the variation in service intensity across services, as captured in Medicare allowed amount methodology. Thus, the dependent variables in the regression analyses were ratios between commercial allowed amounts or cost-sharing amounts and the Medicare allowed amount for the same service paid to providers in the same zip code. As a sensitivity analysis, we repeated these regression analyses without the states that have a surprise billing law.Footnote 1
As a robustness check, we also calculated the mean inflation-adjusted allowed amount in each year for the most common procedure in each specialty.Footnote 2 Allowed amounts are converted to 2012 dollars using the Consumer Price Index for all urban consumers, not seasonally adjusted, for this robustness check. We present these results as line graphs disaggregated by plan funding and network status.
Indicators for the year of service were the independent variables of interest in our assessment of changes in payment over time, using the earliest year observed (2012) as the base year. We included covariates for insurance product type (HMO, PPO, POS, EPO, other), CPT code, funding type (fully-insured, self-funded), and network status (in network, out of network).Footnote 3 We also included clinician fixed effects using the clinician’s NPI and only NPIs with at least ten claims in each year of the study period, 2012 through 2022, were included in the regression analysis. Given our particular interest in payment changes from 2021 to 2022, coinciding with No Surprises Act and Transparency in Coverage implementation, we conducted post hoc testing to assess the statistical significance of differences in the magnitudes of effect between those two years. These multivariate fixed-effects regression models employed robust standard errors clustered at the NPI level.
Data processing was conducted in SAS and regression analyses were conducted in STATA version 19. P-values of 0.05 were considered the threshold for statistical significance.
4. Results
Table 1 describes the analytic sample for each specialty, comprising 34 million emergency medicine services, 81 million radiology services, 47 million pathology services, and 3 million neonatology claims. Across the four specialties, the claims are predominantly in-network (87–96 per cent) and from self-funded plans (69–71 per cent). Product types represented in the sample are approximately two-thirds PPO plans, one-quarter POS plans, and a small share of HMO, EPO, and other plans.
Sample characteristics

* Others include indemnity and unknown plan types.
Table 2 lists the coefficient estimates for the model of the allowed-to-Medicare ratio for emergency professional services. Prior to 2022, the trajectories of fully-insured and self-funded prices differed substantially, particularly for out-of-network allowed amounts. (Table 2, Figure 1) Self-funded out-of-network prices increased through 2017 before a slow decline through 2021. Fully-insured out-of-network prices increased more gradually through 2017 before turning sharply lower than 2012 prices in 2018. Fully-insured out-of-network prices declined from 2021 to 2022, but the decline was not statistically significant (p = 0.225). However, the decline in self-funded out-of-network prices from 2021 to 2022 was more dramatic, from 0.265 above the 2012 baseline to 0.727 below the baseline (p < 0.001). Similar patterns occur with patient cost-sharing for out-of-network emergency professional services (Table 3, Figure 2). In contrast, fully-insured and self-funded in-network emergency allowed amounts increased gradually throughout the entire 2012–2022 period, except for a decline in self-funded in-network allowed amounts from 2021 to 2022 that is less pronounced than the out-of-network decline. The mean allowed amounts for the most common emergency procedure display similar patterns. (Appendix Figure 9)
Commercial allowed amount to Medicare allowed amount ratio for emergency medicine services by network status and plan funding type.

Cost sharing to Medicare allowed amount ratio for emergency medicine services by network status and plan funding type.

Emergency medicine allowed amount to medicare ratios

Standard errors in parentheses; ***p < 0.01, **p < 0.05, *p < 0.1; Reference year is 2012.
Emergency medicine cost sharing to medicare ratios
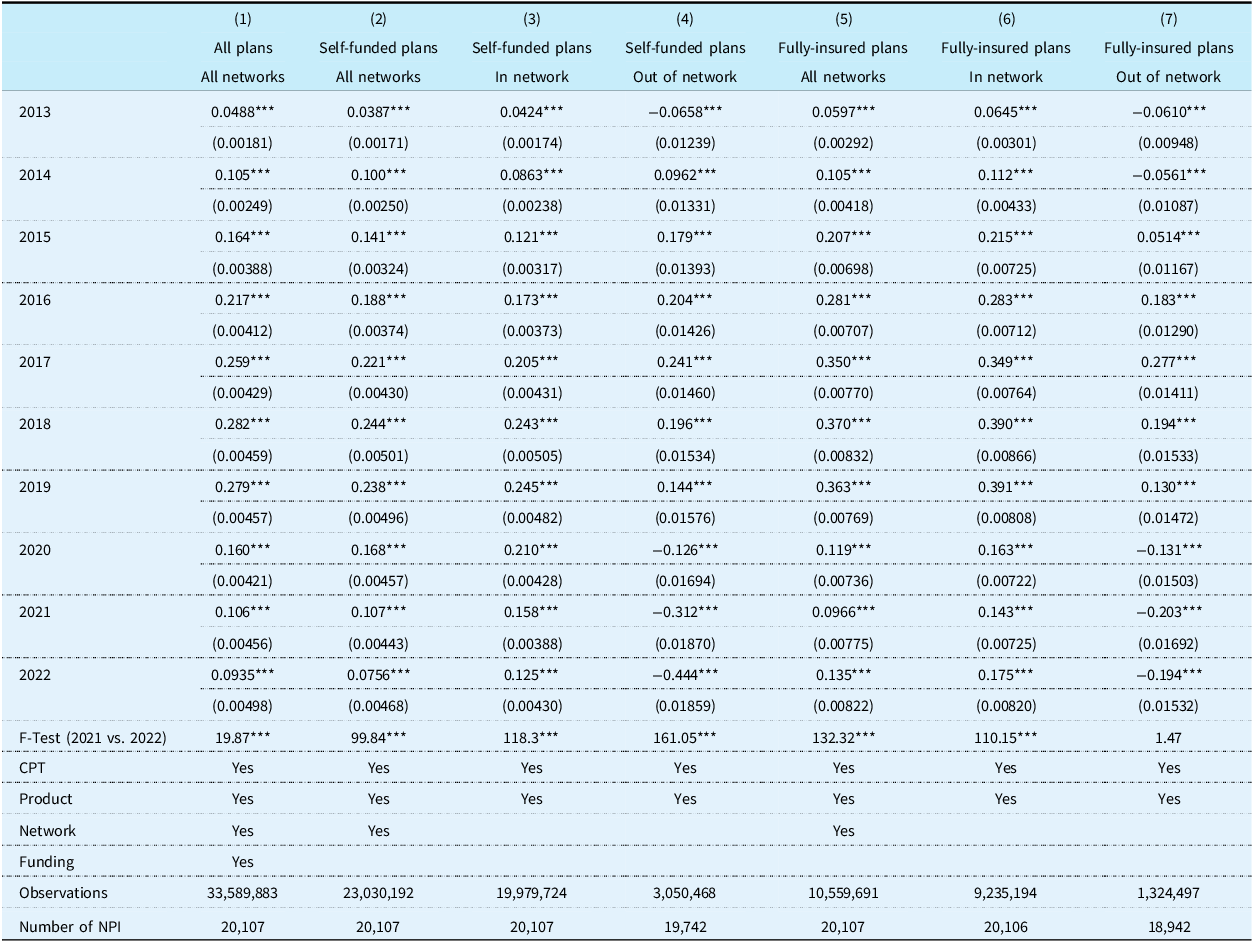
Standard errors in parentheses; ***p < 0.01, **p < 0.05, *p < 0.1; Reference year is 2012.
Roughly similar patterns emerge in the allowed amounts and cost-sharing for radiology and pathology professional services (Tables 4–7, Figures 3–6). For both radiology and pathology fully-insured out-of-network allowed amounts, there is a gradual decline in reimbursements and cost-sharing, starting earlier than emergency services, in 2013. Self-funded out-of-network allowed amounts for radiology and pathology started a slow decline in 2018, before a large drop from 2021 to 2022 (p < 0.001 for both specialties). The large drop from 2021 to 2022 can also be seen in self-funded out-of-network cost-sharing for radiology and pathology (p < 0.001 for both specialties). Like emergency services, fully-insured and self-funded in-network allowed amounts relative to Medicare generally increase throughout the 2012–2022 period. The mean out-of-network allowed amounts for the most common radiology and pathology procedures follow a similar pattern to the out-of-network allowed-to-Medicare ratios. However, the mean inflation-adjusted in-network allowed amounts for the most common radiology and pathology procedures are roughly constant over time. (Appendix Figures 10 and 11)
Commercial allowed amount to Medicare allowed amount ratio for radiology services by network status and plan funding type.

Cost sharing to Medicare allowed amount ratio for radiology services by network status and plan funding type.

Commercial allowed amount to Medicare allowed amount ratio for pathology services by network status and plan funding type.

Cost sharing to Medicare allowed amount ratio for pathology services by network status and plan funding type.

Radiology allowed amount to medicare ratios

Standard errors in parentheses; ***p < 0.01, **p < 0.05, *p < 0.1; Reference year is 2012.
Radiology cost sharing to medicare ratios
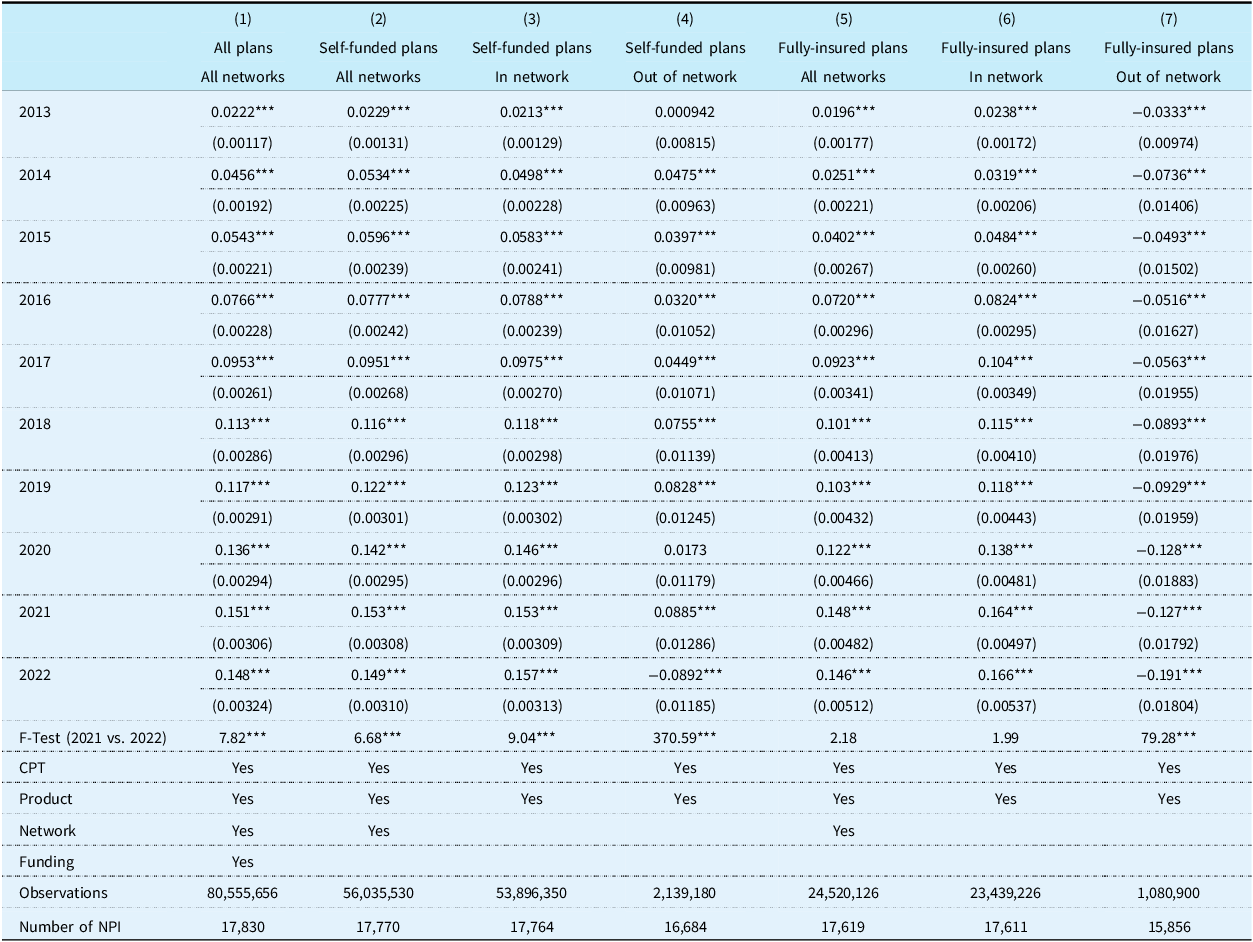
Standard errors in parentheses; ***p < 0.01, **p < 0.05, *p < 0.1; Reference year is 2012.
Pathology allowed amount to medicare ratios

Standard errors in parentheses; ***p < 0.01, **p < 0.05, *p < 0.1; Reference year is 2012.
Pathology cost sharing to medicare ratios

Standard errors in parentheses; ***p < 0.01, **p < 0.05, *p < 0.1; Reference year is 2012.
Unlike emergency services, radiology, and pathology, the trajectories of neonatal professional service out-of-network allowed amounts exhibit a general decline throughout the entire 2012–2022 period, for both fully-insured and self-funded plans (Table 8, Figure 7). In contrast, neonatal in-network allowed amounts relative to Medicare for both fully-insured and self-funded plans increased gradually throughout the decade. Patterns are similar for neonatal cost-sharing (Table 9, Figure 8), except that there is a pronounced reduction in both fully-insured and self-funded out-of-network cost-sharing from 2021 to 2022. (Only the self-funded decline is statistically significant (p < 0.001). Despite a large reduction in fully-insured out-of-network cost-sharing between 2021 and 2022, it is not statistically significant (p = 0.099), likely due to the relatively small number of fully-insured out-of-network neonatology claims.) The in-network and out-of-network mean inflation-adjusted allowed amounts for the most common neonatology procedure exhibit a general decline throughout the 2012 to 2022 period. (Appendix Figure 12) The results of our primary regression analyses excluding the states with surprise billing laws were consistent with the main results of the study, as shown in Appendix Tables 1–8 and Appendix Figures 1–8.
Commercial allowed amount to Medicare allowed amount ratio for neonatology services by network status and plan funding type.

Cost sharing to Medicare allowed amount ratio for neonatology services by network status and plan funding type.

Neonatology allowed amount to medicare ratios

Standard errors in parentheses; ***p < 0.01, **p < 0.05, *p < 0.1; Reference year is 2012.
Neonatology medicine cost sharing to medicare ratios
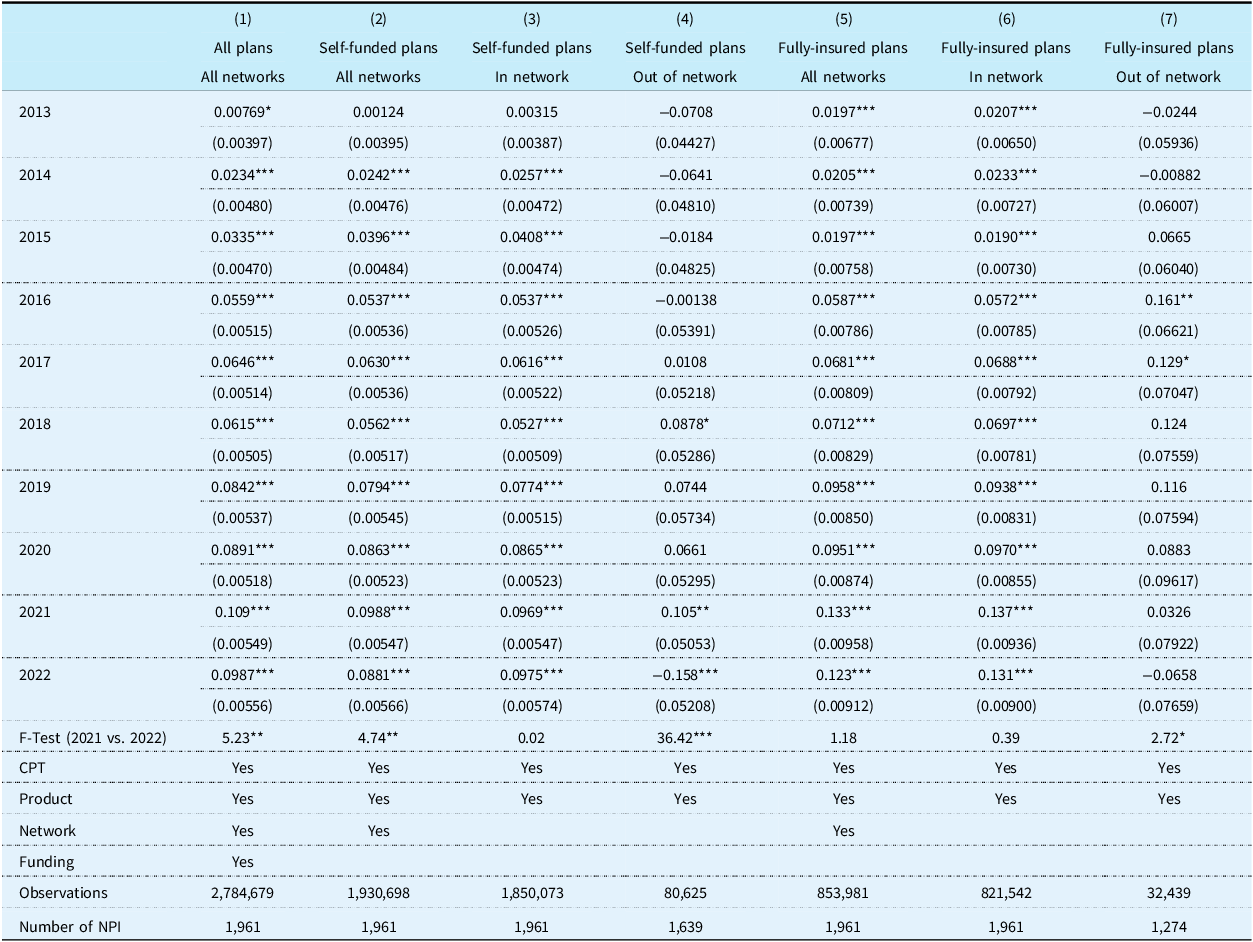
Standard errors in parentheses; ***p < 0.01, **p < 0.05, *p < 0.1; Reference year is 2012.
5. Discussion
This longitudinal study of commercial claims for emergency and hospital-based professional services demonstrates heterogeneity in payment trends by plan funding and network status, coinciding with a series of changes in the policy and market environment. The contrast is most apparent between in-network and out-of-network payment trends. In-network allowed amounts and patient cost-sharing generally grew throughout the last decade across both fully-insured and self-funded plans. However, across all four specialties, there were periods of decline in out-of-network payment amounts. For emergency services, the decline began in 2018 for both fully-insured and self-funded plans. This could be driven by the final implementation of the ACA’s GOT rule in 2018 or it could reflect other policy and market changes. For instance, the larger reduction of fully-insured out-of-network emergency prices in 2018 than self-funded out-of-network emergency prices could, in part, be caused by the passage of state laws regulating out-of-network payments that only applied to fully-insured plans.
Those explanations are less likely to apply to the three non-emergency specialties, where the ACA’s GOT rule did not apply. Radiology, pathology, and neonatology saw declines in out-of-network allowed amounts throughout the past decade. Past research (Garmon et al., Reference Garmon, Li, Retchin and Xu2024b; Xu et al., Reference Xu, Garmon, Retchin and Li2026) found that the effects of state balance billing protections for pathology, radiology, and neonatology were, on balance, inflationary for out-of-network payments. In addition, these state laws are less likely to impact prices in self-funded plans. The general decline of out-of-network payments in pathology, radiology, and neonatology is puzzling, but may simply reflect changing market forces. For instance, there could be a shift from out-of-network to in-network reimbursements in these specialties, as more clinicians are employed by hospital systems and physician staffing companies.
More dramatic than the general decline in out-of-network payments throughout the study period was the sharp decline in out-of-network allowed amounts from 2021 to 2022, particularly for self-funded plan payments to emergency and radiology professionals. This could reflect the implementation of the No Surprises Act and the impact of the QPA on initial payments from health plans to out-of-network clinicians starting in 2022. It could also reflect other changes in 2022, such as the increased transparency in payments from the Transparency in Coverage rule and gag clause elimination, giving employers offering self-funded plans more visibility into their health care costs. More research is needed to see if these payment declines persist past 2022. The relative initial success of providers in the No Surprises Act’s IDR system and the high volume of submitted disputes may indicate that the market has not yet reached equilibrium. Furthermore, the No Surprises Act IDR outcomes were not public until 2024, so additional adjustments in IDR offers and initial insurer payments may occur over time, as providers and insurers incorporate this information. The potential impacts of the Transparency in Coverage rule may also be slow to fully manifest because the machine-readable files are massive and difficult to process and analyse.
Mirroring this decline in allowed amounts was a sharp decline in self-funded plan out-of-network cost sharing from 2021 to 2022. This decline in out-of-network cost-sharing is apparent across all four specialties and is likely associated with the No Surprises Act, in which out-of-network cost-sharing is based on the patient’s in-network share of the QPA for services regulated by the No Surprises Act. Furthermore, this may be a conservative estimate of the real savings to patients because it does not include the direct savings from the elimination of balance bills for No Surprises Act-regulated services.
This study has limitations. First, the data contributors to HCCI may not be representative of all commercial issuers in the U.S. Additionally, there are no claims from the individual market (e.g., ACA Exchanges) in HCCI, so we cannot observe if the trends among the fully-insured plans in our analytic sample are generalisable to trends among plans offered on or off the Exchanges. Second, we can only observe the adjudicated insurance claims, not balance bills or IDR cases. This prohibits us from more comprehensively evaluating the effects of payment disputes and patient out-of-pocket liability within our analytic sample, though prior studies do elucidate these aspects of the market (Biener et al., Reference Biener, Chartock, Garmon and Trish2021; Duffy et al., Reference Duffy, Garmon, Adler, Biener and Trish2024). Notably, IDR cases represent a very small share of 2022 claims, given the scale of IDR use relative to the millions of observations included in our analytic sample. Third, this is a descriptive longitudinal study, not a causal analysis of the impacts of a specific policy. Finally, we observe only the first year of the No Surprises Act’s implementation, and it will be important to continue tracking these trends with additional data, as they become available, in order to monitor the post-No Surprises Act market dynamics.
Supplementary material
The supplementary material for this article can be found at https://doi.org/10.1017/S1744133126100565.
Acknowledgements
The author(s) acknowledge the assistance of the Health Care Cost Institute (HCCI) and its data contributors in providing the claims data analysed in this study. This research was supported by a grant from Arnold Ventures.
Financial support
Dr Duffy and Ms Ly received funding from Arnold Ventures for the submitted work.
Disclosures
Dr Garmon reported receiving personal fees from Compass Lexecon and Econic Partners outside the submitted work. Dr Duffy reported receiving grant funding from the California Health Care Foundation and Gates Ventures and personal fees from Cornerstone Research outside the submitted work.


 Open access

