


1. Introduction
In the U.S., cities sit at the bottom of a tiered federal system. Although municipal governments provide key frontline services ranging from public health and education to public safety and trash collection, they face substantial challenges in their ability to raise the revenue necessary to fund these operations. Local officials must contend with state laws that restrict their taxing power and often face unfunded mandates from both the state and federal government. When cities do raise taxes, they risk alienating the upper and middle-class voters and businesses that comprise the tax base, which can lead to capital flight and competition across jurisdictions (Tiebout, Reference Tiebout1956; Peterson, Reference Peterson1981). Finally, local officials also may fear electoral backlash for tax increases, which further constrains their ability to generate new revenue.
Standard accounts of economic voting posit that voters will punish elected leaders for policies that impose economic costs (Lewis-Beck, Reference Lewis-Beck1985; MacKuen et al., Reference MacKuen, Erikson and Stimson1992; Peltzman, Reference Peltzman1992), and a robust body of literature demonstrates that voters punish (and reward) incumbents based on the strength of the economy (Alesina and Rosenthal, Reference Alesina and Howard1995; Lewis-Beck and Paldam, Reference Lewis-Beck and Paldam2000; Duch and Stevenson, Reference Duch and Stevenson2008; Healy et al., Reference Healy, Persson and Snowberg2017; de Benedictis-Kessner and Warshaw, Reference de Benedictis-Kessner and Warshaw2020). One strand of this research focuses on the effects of tax increases. Politicians themselves often claim that tax policies affect their electoral fortunes (Berry and Berry, Reference Berry and Berry1992), and some empirical work in this area concludes that higher taxes trigger electoral punishment (Niemi et al., Reference Niemi, Stanley and Vogel1995; Lowry et al., Reference Lowry, Alt and Ferree1998; Vermeir and Heyndels, Reference Vermeir and Heyndels2006).
However, identifying the effects of tax increases is challenging because incumbents can strategically adapt their policies to try to mitigate any negative effects of the increase (Poterba, Reference Poterba1996; Drazen and Eslava, Reference Drazen and Eslava2010). They can improve service quality or try to shift blame to other levels of government. Tax increases are also endogenous to the existing political and economic environment, and politicians may only authorize new taxes if they are sufficiently popular or neighboring jurisdictions are also doing so (Besley and Case, Reference Besley and Case1995). Drawing valid inferences about the effects of economic policy on voter behavior may be even more difficult in the local context, where information is often scarce, and turnout is typically low.
To study the relationship between local tax increases and economic voting, we exploit the fact that in California, proposed tax measures must be put on the ballot and approved by voters in local elections. These tax increases are thus sometimes approved or rejected by very narrow margins. Assuming that cities cannot perfectly manipulate whether the measure passes and that relevant city characteristics are continuous around the passage threshold, cities that narrowly reject the tax increase should be similar to those that pass the measure in expectation. We use a regression discontinuity design to identify the effects of these tax hikes on incumbent performance in subsequent elections.
Studying the effects of tax increases on incumbent support is made challenging by the fact that incumbents might correctly predict punishment at the polls and therefore not run again. However, we find that the probability that incumbents seek re-election is identical across cities that pass versus do not pass tax increases, suggesting that strategic exit is likely not a serious concern. Challengers are also no more likely to enter the next race following the passage of the new tax. Another concern involves the potential ability of incumbents to exert additional effort campaigning for measures that they believe are likely to be close, which might change the election result. We present various checks to validate the RD design, including the sorting tests proposed by McCrary (Reference McCrary2008) and Cattaneo et al. (Reference Cattaneo, Jansson and Xinwei2018), and find that city demographic covariates are continuous across the passage cutoff.
In general, we find that incumbents experience only modest decreases in vote share in the cities that narrowly raise taxes compared to those that do not. One notable exception, however, involves business taxes. In cities that narrowly pass new business taxes, incumbents can expect to lose anywhere from 14 to 30 percent of their vote share depending on the model specification. We show that these results are not sensitive to bandwidth selection and do not appear at random placebo cutoffs.
We examine several possible mechanisms to explain these results. Notably, we draw from theoretical intuition provided by scholars, including Anzia (Reference Anzia2022) and Hertel-Fernandez (Reference Hertel-Fernandez2017), to study whether business leaders appear to be mobilizing in response to the tax increases. If local business owners are particularly attentive to local tax rates, it makes sense that they might respond to an increase in their tax burden by turning against incumbent city council members and working to galvanize voters against these politicians. We find several pieces of suggestive evidence consistent with this idea. First, we find that electoral punishment is concentrated in cities with organized business communities, which we measure by hand-collecting data on local chambers of commerce. Next, drawing from data on the occupations of city council candidates, we uncover some weak evidence that business leaders are more likely to run as candidates in subsequent elections in places that narrowly pass business taxes. Finally, we also find that the total number of votes cast in subsequent city council elections is substantially higher in places that adopt new taxes targeting businesses.
This paper contributes to several research agendas. Literature on local political economy often emphasizes that cities are constrained in their ability to raise revenue by virtue of their position within our federal system. However, this paper employs a credible research design to show that most tax increases do not lead to electoral punishment—at least when voters have a say in whether the tax increase passes.
This paper also contributes to a growing body of research that studies economic voting and taxes in a decentralized context. The complexity of the U.S. system includes frequent elections and tax policies set by multiple levels of government. Recent work suggests that voters sometimes make “attribution errors” in this setting (Sances, Reference Sances2017), punishing the wrong level of government for tax increases, while other research uncovers mixed evidence of accountability at the local level (Bosch and Solé-Ollé, Reference Bosch and Solé-Ollé2007; Hansen et al., Reference Hansen, Eskaf and Mullin2022). The findings in this paper suggest that whether or not voters react to local tax hikes is conditioned by how much these changes lead to interest group mobilization. While business taxes are less likely to directly affect the pocketbooks of ordinary voters in the way that property or sales taxes do, we observe these taxes leading to the greatest backlash.
2. Theoretical background and institutional context
In the 1970s, discontent over rising property taxes led to “taxpayer revolts” across the country and ushered in a variety of state policies designed to limit local tax and expenditure authority. During this period, 14 state legislatures enacted laws that restricted local spending and property tax increases, and several states also passed citizen initiatives designed to hamstring local governments. California’s Proposition 13 was one such measure. Passed by voters in 1978, Prop 13 caps property taxes at 1% and also requires any new local tax increases to be approved by voters in local elections. This law applies to all local governments, including counties, cities, and school districts.
Tax increases are widely assumed to be unpopular and are sometimes called the “third rail” of local politics (Hinze and Judd, Reference Hinze and Judd2018). And yet, existing empirical work on the political consequences of raising taxes uncovers mixed results. Bosch and Solé-Ollé (Reference Bosch and Solé-Ollé2007) finds that the mayor’s party loses votes following tax increases in Spanish municipalities, although this result depends on the policies enacted by neighboring jurisdictions. But Hansen et al. (Reference Hansen, Eskaf and Mullin2022) uncover little evidence of punishment in city council elections following water fee increases in North Carolina. Sances (Reference Sances2017) finds an electoral penalty following property tax increases in Massachusetts—but at the wrong level of government. After voters approve local tax increases, the incumbent party loses votes in the next presidential election, which the author takes as evidence that voters may struggle to correctly attribute blame in multilevel government.
Theoretically, it is unclear exactly how voters should respond to local tax increases. On one hand, if politicians are able to effectively use the influx of revenue to pursue policies that voters want, we might observe no negative effects or even an electoral bonus following the tax hike. In states like California that require voters to approve the new tax before it goes into effect, voters might be less likely to attribute the increase to incumbent politicians, which should also preclude punishment. However, if voters are unaware that the tax hike was passed by initiative, blame incumbent politicians for the tax hike, are unhappy with how politicians spend the newly generated revenue, or if the tax increase negatively affects their pocketbooks, they may be less likely to support their incumbents in the next election. Of course, how voters respond will also likely be conditioned by the interest groups that are active in local politics and an important source of information and mobilization for ordinary citizens.
We assume that city council members propose taxes strategically when they believe the expected benefits, such as new revenue to fund city services, will outweigh the potential electoral costs. We assume that voters employ a similar calculus and support the tax measure if they expect the improvement in services to compensate for the hit to their pocketbooks.Footnote 1 Identifying the effects of tax increases on incumbent reelection is challenging precisely because both politicians and voters are almost certainly acting strategically. However, our research design allows us to identify the local effect of a new tax by comparing places that have similar levels of economic need, public service provision, and voter support for taxes. At the same time, as with any local treatment effect, the findings speak most directly to the behavior of voters and politicians in the specific context of tightly contested tax referenda and may not generalize to elections where the margin of support is wide or where the strategic dynamics of tax proposals differ substantially. The goal of this paper is to generate credible causal estimates of the effects of different types of tax increases in order to theorize productively about the likely mechanisms at work.
3. Data and research design
The main sources of municipal revenue for California cities include property taxes, sales taxes, utility taxes, hotel or “transient occupancy” taxes, and business taxes. When city leaders want to increase tax rates, they create local ballot measures that must be approved by more than 50% of voters (in the case of general taxes) or more than 66% of voters (for special taxes including property taxes). We collected data on every proposed municipal tax increase in the state from 2000 to 2022 from the California Election Data Archive. Of California’s 482 cities and towns, 448 held at least one election to consider a local tax increase during this period. On average, cities held four elections where local tax increases appeared on the ballot, and San Francisco offered residents 34 opportunities to vote on new tax policies.
Figure 1 shows the total number of local tax proposals by type over the course of the panel. Sales tax measures were the most common, followed by transient occupancy or hotel taxes. These taxes are popular in part because they often target people who do not live within a city’s boundaries and thus do not vote in local elections. In total, 1,772 tax increases were put forward to voters during this time, and 1,245 of these measures passed (70%). This high passage rate suggests that politicians may be strategic about introducing tax increases and do so only when they are already popular. However, our research design accounts for this issue by focusing on tax measures that pass or fail by narrow, quasi-random margins.
Histogram of proposed local tax measures.

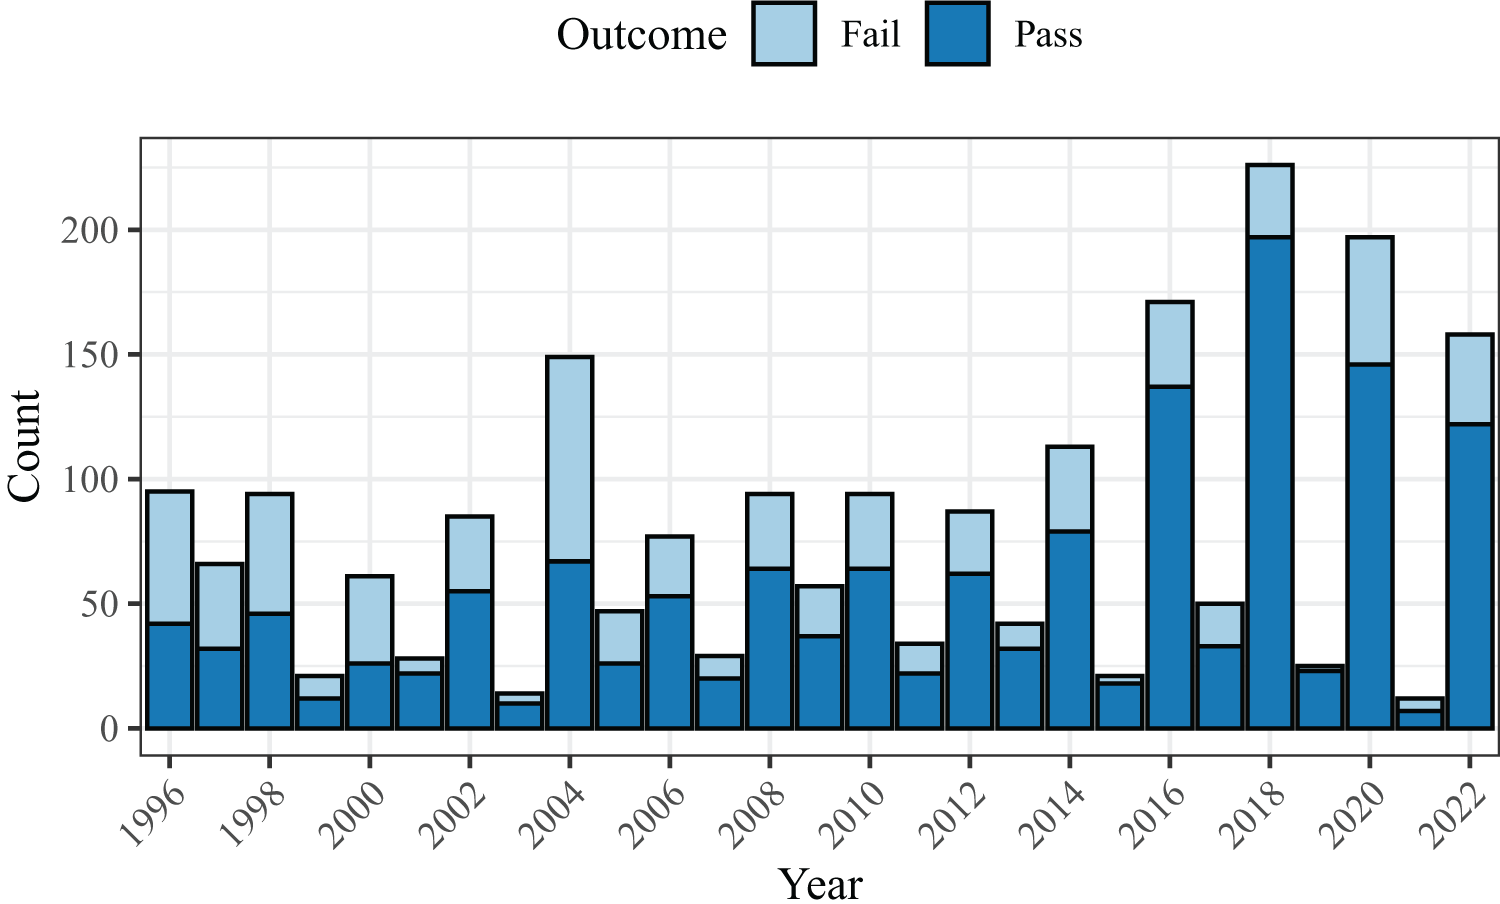
Figure 2 depicts the total number of tax measures on city ballots each year broken down by outcome. When local officials request voter authorization for tax increases, those appeals are usually successful. This might reflect the fact that local officials often exert effort to publicize the need for such measures or could indicate that California voters are aware of the fiscal stress faced by many cities. With the exception of property tax increases, the majority of tax measures (1,360 or nearly 75%) required only a simple majority to pass.
Tax measure passage by year.

Before estimating the effect of a tax increase on incumbent electoral performance, we conduct one last descriptive analysis to examine whether and how these tax initiatives affect local revenue generation. To document the fiscal impact of these tax measures, we collect data on city finances from the State Controller’s Office. These data are digitized for the period from 2003 to 2020 and include detailed reports of city revenues and expenditures for each year, and we were able to manually extract several additional years of data going back to 1999 by scraping the original PDF reports. In Table A.2 of the online appendix, we look at the within-city effect of a new tax passing on the revenue generated from that source over the following four years. Models with city and year fixed effects show that cities consistently experience a revenue boost following a new tax authorization with the exception of transient occupancy taxes. This result might be explained by visitors and tourists adjusting their behavior in response to new hotel taxes.
We now turn to our main analysis. One of the key assumptions for the RD design is that the vote share near the cutoff required for passage is random and that supporters or opponents of the measure are not able to perfectly coordinate campaigning efforts to ensure a particular outcome. To probe the likelihood of this assumption, we examine the density of the vote share variable at the passage cutoff using the sorting tests proposed by McCrary (Reference McCrary2008) and Cattaneo et al. (Reference Cattaneo, Jansson and Xinwei2018). If voters and those campaigning on behalf of the tax increase are unable to precisely manipulate the vote share, there should be a similar number of measures that narrowly pass versus narrowly fail. Figure 3 shows both of these tests. Measures pass more frequently than they fail, and the McCrary (Reference McCrary2008) test suggests a bit of a jump at the 50% threshold that determines passage. But the more recent approach suggested by Cattaneo et al. (Reference Cattaneo, Jansson and Xinwei2018) that relies on a local-polynomial density estimator and does not require the data to be prebinned shows little evidence of bunching around the cutpoint.
Sorting tests by measure type. (a) McCrary sorting test. (b) Cattaneo et al. sorting test.

In the online appendix, we show that the densities of each individual tax measure are also evenly distributed on either side of the passage threshold (Figure A.3). This will be important later when we examine the effects of individual types of tax measures on incumbent performance. Next, we examine the distribution of observable city demographic covariates in cities that narrowly pass versus reject their proposed tax increases. We find almost no significant differences across treated and control cities in terms of population, racial composition, economic conditions, or finances (Table A.4 of the online appendix).Footnote 2
4. Tax increases and electoral performance
To study the political impacts of local tax increases, we focus on how incumbent city council members and mayors fare in the next election after the tax increase was authorized. City councils in California range in size from 5 to 15 members with an average size of 7 members. Mayors are generally not elected separately and instead rotate among city council members; however, some cities hold separate elections for the mayoral position, and we include these races as well to maximize statistical power. However, after introducing the main findings, we also demonstrate that the results remain consistent subsetting to each individual office type. Term limits are rare in California, and the results are also robust to dropping the handful of cities that do enforce term limits.
The main outcome of interest is the average incumbent vote share in the election following a vote on a tax measure. Data for city council election outcomes come from the California Election Data Archive. Elections are staggered, and around 3 city council seats are typically up for election in any given contest. The proportion of incumbents running for re-election in a city varies from 0 to 1 with an average of 0.65. These incumbents typically face 1 or 2 challengers per each seat available. Incumbents win re-election at high rates, or just over 75% of the time. Because these are not typically two-candidate races, vote shares for any individual candidate are often quite low and depend on the total number of seats (in at-large elections) and the total number of candidates running.
To account for the fact that multiple incumbents can run for office at any given time, measures of incumbent vote share are averaged across all city council and mayoral incumbents running in a particular city in a particular election. Our main RDD analysis includes 2,656 unique contests collapsed into 1,532 city-year observations. Of the 2,656 contests, 424 are contests for mayor and 2,232 are contests for city council members. We discuss the construction of the dependent variable and provide additional details and descriptive information in the online appendix Section A.2.
California local elections are non-partisan. Therefore, rather than focusing on incumbent party vote share, we look directly at the electoral performance of the incumbents who actually run for re-election. This would pose problems if incumbents strategically retire and challengers strategically enter city council races depending on how they think they will fare. For example, incumbents might simply choose not to run for re-election if they believe a recent tax increase would hurt their chances of retaining their seat. We begin by looking at the change in the proportion of incumbents running for office before and after a city passes a tax increase. Figure 4a plots the change in the proportion of incumbents running from the previous election to the next election after the tax increase against the vote share margin for the tax proposal. Incumbents are equally likely to seek re-election whether the tax increase passes or fails. Figure 4b similarly shows that challengers are no more likely to enter city council races following a tax increase, with no change in the number of challengers per seat. These results are shown in tabular form in the online appendix (Table A.5).
Tax increases do not change electoral competition. (a) Incumbents no less likely to run. (b) Challengers no more likely to enter.

Having established that electoral dynamics appear similar in subsequent elections in terms of candidate entry, we turn to the question of whether voters punish incumbents for tax increases. We estimate equations of the form
 \begin{equation*}Y_{it+1} = \alpha +\beta_1 Pass_{it} + f(Vote Margin_{it}) + \epsilon_{it},\end{equation*}
 where  $Y_{it+1}$ is either the average incumbent vote share or the proportion of incumbents winning re-election in the next election after the tax increase in city $i$. The variable $Pass_{it}$ indicates if a city passed a new tax measure or not, and $f(Vote Margin_{it})$ assumes a flexible functional form that models the running variable with different polynomial specifications normalized to a cut point of 0 where the tax measures passes if the vote margin exceeds this threshold.Footnote 3
Table 1 shows estimates generated via the rdrobust package in R (Calonico et al., Reference Calonico, Cattaneo and Titiunik2015). Optimal bandwidths were selected via the data-driven procedure outlined in Calonico et al. (Reference Calonico, Cattaneo and Titiunik2014), and bias-corrected estimates are shown across various polynomial specifications. When a tax increase narrowly passes in a city, incumbents experience a modest decrease in vote share of around 2 to 3 percentage points (Columns 1–3). They also may experience a slightly lower rate of winning re-election (Columns 4–6), although all of the estimates are imprecise and shrink to zero as the order of the polynomial increases.
Minimal electoral punishment for incumbents after tax increase

Notes: Bias-corrected RD estimates with robust variance estimator (Calonico et al. 2014). Outcome is average incumbent vote share (columns 1–3) or the proportion of incumbents winning re-election (columns 4–6) in the next election after the tax increase. Mean of the outcome is shown for the pre-period. Standard errors clustered by city.
Overall, incumbents do not appear to suffer a large electoral penalty after their cities enact new tax increases. This counters conventional wisdom that local tax increases incite backlash. Voters may not attribute the tax hike to the incumbent given that voters themselves previously approved the increase, or incumbent politicians may be strategically adapting their other tax and expenditure policies to mitigate potential voter dissatisfaction with the new tax. Next, we examine whether incumbent performance varies by the type of tax increase passed. Figure 5 shows these bias-corrected estimated effects from specifications with a first-order polynomial again generated via rdrobust.
Effect of tax increases on incumbent vote share.

The most striking result in Figure 5 is the fact that new business taxes appear to lead to substantially lower incumbent support in the next election. Although the estimate is a bit noisy, it is substantively large and distinguishable from zero. In Table A.6, we present the estimates from Figure 5 in tabular format and show that the effect of new business taxes remains significant after adjusting the p-values to account for multiple hypothesis testing using the Benjamini and Hochberg (Reference Benjamini and Hochberg1995) correction. Zooming in on the effects of business tax increases, Table 2 shows estimates across various polynomial specifications for both incumbent vote share and the proportion of incumbents winning re-election. The coefficients are consistently negative and large, although the small number of effective units within the optimal bandwidths means these results should be interpreted with a bit of caution. In Table A.7, we show the balance on pre-treatment covariates for the cities that narrowly pass or reject new business taxes. Interestingly, cities that adopt new business taxes are larger in terms of population, although the difference is not statistically significant. The main results remain robust if we adjust for population in the RD setup (Table A.8).
Incumbents are punished for business tax increases

Notes: Bias-corrected RD estimates with robust variance estimator (Calonico et al, 2014). Outcome is average incumbent vote share (columns 1–3) or the proportion of incumbents winning re-election (columns 4–6) in the next election after the tax increase. Mean of the outcome is shown for the pre-period. Standard errors clustered by city.
To probe the sensitivity of these results, we conduct several additional tests. First, we demonstrate that these effects are not driven by cannabis taxes, which comprise one of the most common types of business taxes in California in recent years (Table A.9). The results are also robust to dropping the small number of cities that enforced term limits throughout the sample (Table A.10).
Next, we examine how the effects of business tax increases change across different bandwidths. We re-run the model specified in Column 3 of Table 2 while varying the bandwidth and plot the resulting estimates in Figure 6a. The results show a consistent negative pattern albeit with a bit of noise, likely due to the slightly underpowered design.
Robustness checks for the effect of business taxes on incumbent vote share. (a) Effect of business tax increase across bandwidths. (b) Effect of business tax increase at random cut-offs.

We next look for effects at random passage thresholds. This serves as a placebo test: if average incumbent vote share simply jumps around a lot from election to election, the detected effect at the true cutoff might simply be an artifact of a noisy data generating process. The results from this test are depicted in Figure 6b. While there are some jumps in the data, they are generally not statistically distinguishable from zero, and the large electoral penalty uncovered at the true cutoff is the most negative estimate.
We also examine the timing of the negative electoral effects of new business taxes. To do this, we repeat the RD analysis but look at electoral performance in the election immediately before or concurrent with the business tax increase. If voters are punishing incumbents prior to knowing whether the proposed business tax passed, this would call into question whether the new tax was responsible for the punishment observed in the subsequent election. Table A.13 of the online appendix shows the results. If anything, incumbents tended to perform slightly better in the cities that go on to pass business taxes (although this effect is not statistically distinguishable from zero). But in the next election after a new business tax passes, incumbents experience a dramatic negative shock to their vote share.
Finally, we examine the within-city effects of each type of tax increase using a two-way fixed effects approach. These results are largely descriptive because of the non-random adoption of new taxes, which is why we prefer the RD approach. But reassuringly, we observe a very similar pattern of results when employing this alternative method. In models with city and year fixed effects, business taxes continue to be associated with the largest reduction in incumbent vote share in the next election relative to other types of tax increases. These results are shown in Table A.14.
Why do politicians not correctly anticipate backlash from business taxes? There are several possible reasons. First, our design identifies a local treatment effect: comparing cities that are very similar except that some narrowly adopt a tax and others narrowly reject it. In this narrow window, we find that incumbents face electoral costs. However, the data also show that voters do not systematically punish incumbents when business taxes pass with overwhelming support (online appendix Figure A.4). In those cases, business leaders likely have less leverage to mobilize opposition or shift public opinion. Moreover, local elections are often low-information contests, making it plausible that incumbents occasionally misjudge the depth of voter support for new taxes. Thus, our findings highlight that business taxes can trigger electoral backlash in closely contested contexts, a result that is consistent with existing research on local interest group influence, which we discuss in the next section. In general equilibrium, however, we may or may not expect the same electoral penalties to arise outside these narrow settings.
5. Exploring mechanisms
In the previous section, we introduced evidence that voters do not generally punish incumbent city council incumbents for local tax increases with the notable exception of new business taxes. When business tax measures are enacted, incumbents can expect to lose substantial vote share in the next election and win re-election at lower rates. Why do we observe electoral punishment for certain tax hikes but not others? One answer is offered by Anzia (Reference Anzia2022). Her policy-focused approach emphasizes the importance of local interest groups in city politics. We have ample evidence that businesses are key players in local politics. They endorse local candidates and make campaign contributions, and Anzia (Reference Anzia2022) finds that chambers of commerce are the single most active interest group in most cities. More broadly, businesses can act as political machines, mobilizing their employees to support political causes that business leaders care about (Hertel-Fernandez, Reference Hertel-Fernandez2017).
Business leaders are almost certainly aware of local tax policies that affect them and united in their opposition to new taxes. If the business community responds to tax hikes by mobilizing voters to turn against the incumbent city council members, then this would offer one possible explanation for our main results. Anecdotally, business backlash is common following local policy changes. One tax measure that appeared in our sample was Mountain View Measure P, which proposed an annual per-employee business license tax of between $8 and $149 per employee depending on company size. This proposal was essentially targeting Google, the largest company headquartered in the city. While the measure passed decisively with 71% of the vote, the Mountain View Chamber of Commerce was vigorously opposed, and Google poured money into the race while withholding contributions from city councilmember Lenny Siegel, who was a vocal supporter of the measure and ultimately lost his re-election bid.Footnote 4
Two proposed tax measures in San Francisco provide another illustrative example of the business community mobilizing opposition to business tax measures. Measures C and D were both business taxes on gross receipts, but Measure D required a two-thirds majority for approval because it targeted commercial leases. While the business community and San Francisco Chamber of Commerce were opposed to both taxes, they poured their energy into defeating Measure C because of the lower vote threshold necessary for passage. Major corporate leaders within the city created a PAC opaquely named the Committee for an Affordable SF, and the organization spent over $1 million to defeat both proposals. But the committee strategically focused on Measure C through a media blitz that included dozens of TV and digital ads as well as mailers. Measure C narrowly passed with 51% of the vote, and the Howard Jarvis Taxpayers Association and California Business Roundtable subsequently sued the city, claiming that this measure should have required a two-thirds supermajority to pass.
Why are businesses not able to prevent these tax initiatives from being placed on the ballot in the first place, or at least able to convince voters not to adopt them? In fact, we assume that the business taxes we observe are already an unrepresentative subset of all the proposals incumbents might otherwise prefer to enact. If businesses are exerting influence behind the scenes, the initiatives that do reach the ballot are precisely those that survive that initial opposition. But among this subset of proposals, the regression discontinuity design still gives us some random variation in which cities actually experience the tax increase. If the tax fails, business leaders have fewer incentives and less ability to mobilize voters in the next election, since they cannot point to realized economic harm or unintended consequences of a tax increase.
To examine whether business mobilization can help explain our main results more systematically, we uncover several pieces of suggestive evidence in our data. First, if incumbent punishment is driven by the efforts of local businesses, we would expect the effects to be strongest in the places where the business community is more organized. To proxy for business strength, we hand-collected data on the local chambers of commerce for every city in our sample. Among cities in California, 69% enjoy their own established chamber of commerce, 25% participate in a coalitional chamber along with other neighboring cities, and 6% do not have a local chamber of commerce. Unsurprisingly, the presence of a dedicated city chamber of commerce correlates with city size. However, several large cities like Sacramento and Long Beach share a chamber of commerce with the surrounding metro area or county, and the difference in city size between cities that narrowly pass or reject new business taxes is not statistically significant (see Table A.7).
When we split the sample into places with their own dedicated chamber of commerce and places without a city-specific chamber and re-run the main analyses, we find that punishment is concentrated in the cities with a dedicated chamber. These results are shown in Table 3. While a city-specific chamber of commerce is not a perfect measure of local business strength, this was one of the few feasible proxies that we could construct for the hundreds of cities in our sample. The fact that we observe backlash almost exclusively in cities with their own chamber of commerce supports the idea that incumbent punishment is likely driven by organized business mobilization.Footnote 5
Effect of business tax punishment by chamber of commerce presence

Notes: Bias-corrected RD estimates with robust variance estimator (Calonico et al, 2014). Outcome is average incumbent vote share (columns 1–3) or the proportion of incumbents winning re-election (columns 4–6) in the next election after the tax increase. Mean of the outcome is shown for the pre-period. Standard errors clustered by city.
Next, we examine how the candidate pool changes after business taxes are passed. One way in which businesses might respond to unfavorable tax policy would be to encourage more pro-business candidates to consider running for office or even for business leaders to run themselves. For example, after Mountain View passed Measure P—the business license tax targeting Google—an engineer from the Google-owned company Waymo joined the race for city council in the next election. While we could not find a proxy for the pro-business orientation of the 30,000 candidates that appear in our data, we were able to obtain data on the occupational backgrounds of these city council candidates by relying on data from Straus (Reference Straus2025). Using job titles that appear on sample ballots, Straus classified California city council candidate backgrounds into 11 occupational categories, including business owners. Using the same RD design that generated the results introduced in the previous section, we examine how different types of tax increases affect the number of business owners running for office. The effects are displayed in Figure 7 and shown formally in Table A.15.
Effect of tax increases on business leaders running for office.

Interestingly, business owners are more likely to run for office in the next election in cities that levy either new property taxes or new business taxes. In fact, some property taxes do target commercial properties. Of course, this result cannot tell us why business taxes lead to electoral punishment and property taxes do not. Property taxes must pass by a much higher super majority margin of 66% in order to be adopted, so it is possible that any adopted property taxes are so popular that business leaders are not able to generate subsequent opposition. This “just-so” story is purely speculation; however, these results do suggest mobilization on behalf of the business community following tax increases that affect them.
Finally, we examine the total number of votes cast in the next election following different types of tax increases. Assuming random assignment at the approval threshold, the cities treated by a tax increase should be observationally equivalent to those not treated on dimensions including population and voter registration. Therefore, the total votes cast can serve as a proxy for voter turnout. These results are again largely speculative, but they suggest voter turnout increases in the next election after a business tax passes. We show these results graphically in Figure A.5 and in tabular form across different polynomial specifications in Table A.16.
While none of these analyses alone proves conclusively why business taxes lead to electoral punishment, together they paint a consistent portrait. We have strong theoretical reasons to believe that the business community will mobilize against the city council when new taxes are adopted that target them. Business leaders are among the most active local interest groups. They care about local taxes and should respond negatively to tax increases. They have myriad tools at their disposal to shape local elections by mobilizing their workers, shifting their campaign contribution activity, and endorsing or withholding endorsement from candidates. Unfortunately, attempting to collect more systematic data on local contributions or endorsement activity proved not to be feasible for this project. Most cities do not require disclosure of local campaign contributions, and voter information guides with endorsements are not available for city candidates going back in time. However, we encourage such research efforts in the future.
6. Discussion
Do voters punish elected officials for tax increases? Answering this question is challenging because incumbents do not levy new taxes randomly. Identifying the political effects of tax increases is further complicated by the federal system of government in the U.S., where voters may or may not correctly attribute policy outcomes to the correct level of government. However, studying this question in the local context introduces a unique opportunity to leverage the close passage of tax measures in states that require voters to approve local tax increases.
We draw on data from California to demonstrate that most local tax increases do not generate substantial voter backlash. But business taxes are different, and city council members consistently perform worse in the election following the enactment of a new city business tax. One explanation for these results is that business leaders are among the most powerful organized interest groups at the local level and may be particularly likely to mobilize in response to tax hikes. We offer some suggestive, indirect evidence supporting this idea: Business leaders are more likely to run for office following a business tax increase, and voter turnout is higher in the next election in these cities.
Our results so far are drawn from a single state. But dozens of states require local voters to approve tax increases. Unfortunately, data on local ballot measures is not usually available in a centralized format in other states, so collecting information on tax passage rates and mapping them to city council election results would require substantial effort. But a clear next step for this research agenda would be to collect such data for other states, likely by requesting the relevant information from individual cities.
While we uncover some suggestive evidence of a theoretically plausible mechanism linking business taxes to electoral punishment, future work should seek to further clarify how local businesses respond to tax increases and to identify the conditions under which new taxes lead to mobilized backlash. More broadly, the credible main effects we estimate in this paper contribute to our understanding of economic voting in the local context. The results in this paper are encouraging for local leaders aiming to increase their tax base insofar as they show that there are many types of taxes that officials can successfully levy to generate revenue and provide public services without fear of electoral punishment.
Supplementary material
The supplementary material for this article can be found at https://doi.org/10.1017/psrm.2025.10078.
Acknowledgements
For helpful feedback, we thank Jeff Clemens and participants of the Hoover Institution Campbell Visiting Fellows program, the Berkeley Research Workshop in American Politics, and attendees of the 2025 UC Irvine PIPE conference.
Competing interests
The authors declare none.


 Open access