


Introduction
Throughout the late 1990s and early 2000s – as the field of user-interface design was rapidly emerging – researchers and practitioners embraced the phrase ‘everyone interfaces’.Footnote 1 This deliberate double meaning captured both a prediction and a prescription. First, it forecast that user interfaces would become ubiquitous: they were to be ‘built into the walls, incorporated into our working environments, carried and even worn by us, and used as an integral part of our daily activities’.Footnote 2 In this future, ‘everyone interfaces’ because accessing public and private services would inevitably mean navigating a user interface. Second, the phrase articulated a design imperative: if interfaces were to become so central to modern life, they must be accessible to all. These ‘everyone interfaces’ would need to have a kind of common-denominator design, providing the broadest possible access to services, accommodating users regardless of digital literacy, disability, or other potential barriers.Footnote 3
The prediction is now reflected across public services. As socio-legal work has already begun to explore, the front line of the welfare state (and other public services) is increasingly being transformed as governments become reliant on interfaces to manage interactions between the state and its citizens, and between one part of the state and another.Footnote 4 Although much current scholarship focuses on the increasing use of automated decision-making, this long-standing shift to user interfaces across welfare states – characterised as an ‘interface-first’ or ‘digital-first’ approach – is as significant a feature of the digitalisation of public services.Footnote 5 Almost all interactions with the state now either start from, finish, or include a user interface.Footnote 6 Indeed, in the UK, the flagship working-age benefit, Universal Credit (UC) (to which this paper returns in far more detail below) is ‘synonymous with its digital interface’.Footnote 7
Yet the prescription that ‘everyone interfaces’ should be accessible to all has not been fully realised. Designing for a universal ‘common denominator’ gateway to services has often meant designing for an imagined, average user – someone who is digitally literate and with straightforward circumstances. For those who fall outside this profile, accessibility challenges remain acute, constraining access to social entitlement. In this sense, ‘everyone interfaces’ can end up working for no one.
To explore this core part of the ‘digital architecture’Footnote 8 of the welfare state this paper draws on an analysis of the repositories hosted on the Department for Work and Pensions’ (DWP) GitHub account.Footnote 9 In common with other digital teams across government, civil servants in the DWP Digital team use GitHub to manage their code, test prototypes, and iterate their designs, in turn creating a public record of how interfaces are built and modified. As their GitHub account’s description puts it, the page is a ‘public repository for tools and technologies developed within the DWP’.Footnote 10 The 572 repositories currently listed on the account reflect a huge range of applications, from new application processes, staff-facing interfaces for managing decisions and appeals, packages to support specific kinds of functionality (such as uploading evidence onto an online system), and the look-and-feel of services (such as standard design templates for web-forms).
By downloading, rendering and analysing the code repositories on the account, this paper undertakes an ‘interface led’ analysis of this changing front line of the welfare state.Footnote 11 The analysis identifies three key design patterns. First, the importance of so-called ‘happy path processing’, where interfaces are designed first with standard, uncomplicated cases in mind, before being refined for complexity and exceptions. Secondly, the use of ‘prompting and priming’ techniques to guide user behaviour and responses, both for claimants and staff. Thirdly, the use of interfaces to manage staff activities and decision-making, distributing case management responsibilities across the front line. By foregrounding the design of interfaces themselves, the paper seeks to demonstrate how their design is far from neutral or, as Adelmant and Raso put it, ‘merely technical’.Footnote 12 Instead, they now constitute a core component of the digital architecture of the welfare state which has the potential to improve or impede access to legal entitlement.
The broader agenda of this paper is to demonstrate how law and policy within the welfare state (and, by extension, in other digitalised public services) are increasingly refracted through a heavily under-explored community of civil servants. As Yeung characterises it, delegating ‘techno-operational choices’ to developers can undermine the normative choices about what ‘good administration’ otherwise looks like in a bureaucracy, such as those reflected in the influential models of bureaucratic justice identified by Mashaw.Footnote 13 The civil servants in the DWP tasked with designing interfaces have their own practices and processes, rooted in principles of user-experience and human-computer interaction – a logic tied to the development of interface infrastructure. Their approach – reflected in the design patterns I explore below – has a significant bearing on the design of public services and therefore the experiences and entitlements of those accessing them. To put this argument, I first outline the role of interfaces and their designers in the digital welfare state before turning to the method used to analyse the GitHub dataset. I then examine each of the three design patterns in turn.
1. Interfaces, prototypes and the digital welfare state
Before turning to the analysis of repositories on the DWP’s GitHub account, it is necessary to first interrogate the role of interfaces in the modern welfare state more generally and the associated implications for socio-legal studies. Concepts like ‘interface governance’ or ‘interface-first bureaucracy’ capture the increasing dependence on interfaces to either arbitrate access to human officials, or to capture and process data on their behalf.Footnote 14 Even where face-to-face or telephony interactions persist, an interface is now almost always involved at some point of a claimant’s journey – whether to input data, confirm eligibility, accept conditions, or manage follow-up communications from officials. Indeed, a face-to-face meeting or phone call is often spent discussing a prior or future ‘screen based communication’.Footnote 15 As the use of automated and AI-enabled technology continues to proliferate, these technologies are often rooted in interfaces, either as the original data input, to communicate with a claimant, or – as technologies continue to develop – as the site of automation itself (such as interfaces that respond in real-time to predicted user behaviour).Footnote 16 When Garsten and Jacobsson set out their arguments on the importance of the ‘interface zone’ – the point at which citizens come into contact with the state – they were referring more broadly to interactions of all kinds with street-level bureaucrats.Footnote 17 However, as the welfare state has increasingly digitalised, this ‘interface zone’ has taken on a more literal meaning: user interfaces are increasingly the primary mechanism for interacting with the state.
There is often a ‘single-interface rhetoric’ tied to these digitalisation processes, where governments (and sometimes researchers) characterise this move as one towards more streamlined, single point of access platforms.Footnote 18 The characterisation of UC as a kind of ‘one-stop shop’ for means-tested benefit support is perhaps the best example.Footnote 19 However, as Bennett points out, the reality is quite different. Citizens often navigate multiple interfaces to access services, each with varying levels of accessibility and human input or assistance, leading to a ‘multi-level maze’ of digitalised platforms mediating access to support.Footnote 20 Perceived simplicity from the outside may in reality shift burdens and complexities further ‘out of sight and onto the shoulders of claimants themselves’.Footnote 21 This in turn increases the potential for the malfunctions and ‘glitches’ that Raso critiques, while also compounding the inequalities of access that can result from these digital administrative burdens.Footnote 22 Fragmented and multi-faceted systems make digital exclusion worse, lead to confusion on behalf of claimants, and make access to justice (whether to establish entitlement, contact officials, challenge decisions, and so on) more difficult.
This proliferation leads to a second issue: these interfaces not only increasingly mediate interactions between the state and its citizens, but also from one part of the state to another. This interoperability – the ability of bureaucracies to exchange information between themselves as well as with others – is a ‘key enabler of digitalisation’ that is built into interface designs.Footnote 23 In UC, this interoperability cuts across a range of actors involved in inputting data into the ‘decision chains’ built into the platform, from other government departments (such as His Majesty’s Revenue and Customs) through to other private actors (such as a UC claimant’s employer).Footnote 24 Likewise, interfaces can manage interactions between officials that remain closed to public view, particularly the allocation of work or review and audit of completed tasks.Footnote 25 Interfaces therefore mediate interactions vertically (between a claimant and the state) and horizontally (between the state and other public or private stakeholders).
Adelmant and Raso’s pathbreaking work on ‘decision chains’ demonstrates the implications of this extent of interoperability built into modern digital welfare systems.Footnote 26 Interfaces (in this case for UC) can diffuse chains of decisions not just across different public bodies, but across private actors – such as employers or landlords inputting information about claimants’ wages or rent into the system.Footnote 27 This can make individual decisions, at least in a traditional public law sense of the term, difficult to identify and challenge. However, this is a problem for officials too. Each actor in these decision chains may have ‘only a partial view of the chain and the data flowing through it’, with this ‘segmentation’ leading to key decision-makers not always having access to the full circumstances of a given case.Footnote 28 The complex decision chains and distributed responsibilities across digital welfare systems only exacerbate these interoperability issues.
Thirdly, developers of user interfaces in public services take a number of distinct design decisions that can have a significant impact on the delivery of services. There has rightly been an increased focus on the use of algorithmic processing in public services. This is sometimes characterised as a shift from ‘street-level’ bureaucracy (focusing on face-to-face or telephone interactions and processing of documents), to ‘screen-level’ bureaucracy (focusing on online interfaces and computer-based interaction), and now to an increasing dependence on ‘system-level’ bureaucracy (where decisions are increasingly made by algorithms and automated processes).Footnote 29 However, these levels, although characterised as an ‘evolution’, bleed into one another.Footnote 30 Even as the use of automation in public services continues to increase, these user interface and ‘screen-level’ design choices will remain or even become more prominent. Citizens will still need to communicate with officials (whether human or artificial) or input data, and staff will need to communicate with one another and manage workflows. Interfaces of all kinds remain a key input and output of any ‘system-level’ automated processing. This means that the design choices by user-interface developers warrant dedicated attention alongside that placed on the design and operation of algorithms or AI-enabled technologies. The functionality of user interface elements goes far beyond the paper, telephone and face-to-face processes they now augment or replace, covering audio-visual elements, choice architectures, branching logics, prompts and primes, manipulations, and alerts, to name but a few.Footnote 31 Indeed, the functionality that interfaces could provide will only increase as AI-based tools proliferate, providing opportunities to shape more personalised interface designs in response to user behaviour.Footnote 32
How these elements are designed and operationalised can not only determine a user’s experience and access to a public service, but also their substantive outcomes from it. If algorithms may increasingly reflect a ‘black box society’, where the technology is not ‘transparent, decipherable, or knowable’, interfaces are readily available to analyse.Footnote 33 Much in the same spirit as the ‘form-led approach’ to analysing digital form-based processes advanced by Brown, sustained, detailed analysis of interfaces can reveal key patterns that feature in their design.Footnote 34 It is to this end that this paper now turns.
2. Method: the DWP’s GitHub account
The rest of this paper draws on interfaces downloaded from the DWP’s account on GitHub, billed in its accompanying account description as a ‘public repository for tools and technologies developed within the DWP’.Footnote 35 GitHub is a code repository hosting service for software development projects. Anyone – including individuals, private companies and public bodies – can store, manage, and share computer code publicly or privately on a GitHub account. The platform’s name derives from a version control system known as ‘Git’, which tracks changes to files over time, allowing developers to see what modifications were made, when they were made, and by whom.
GitHub is widely used by software developers, with over 100 million publicly available repositories.Footnote 36 Indeed, Eghbal has argued that we are now firmly in the ‘GitHub Generation’ of open source software development, with the platform serving an important social function in the software development community.Footnote 37 As she puts it, ‘just as there are Instagram influencers and Twitch streamers, there are GitHub developers’.Footnote 38 This popularity extends to developers working in governments at all levels, from nation states to regional and local authorities. Government agencies and institutions across the world – from Argentina (the ‘Official Repository of the Government of the Argentine Republic’) to Venezuela (the ‘Operating system for the Venezuelan National Public Administration’) – publish repositories on GitHub to improve transparency on (some areas) of their software development and to manage collaboration between the civil servants and sometimes private operators working on the code bases.Footnote 39 In the UK, in addition to the DWP’s account, repositories are published on accounts held by the Cabinet Office, His Majesty’s Revenue and Customs, the Department for Environment, Food & Rural Affairs, the Foreign Office, the Scottish Government and a smorgasbord of other public institutions.Footnote 40
This ease of access and widespread use make GitHub an alluring resource for researchers. Academic research on software development routinely draws on data mined from GitHub. Indeed, there is a whole field dedicated to ‘Mining Software Repositories’ (MSR) that seeks to refine this technique, with a particular focus on software development practices in open source software (such as approaches to testing) and project features (such as the popularity of specific code bases/libraries).Footnote 41 However, GitHub is rarely used as a dataset outside of these fields, including in socio-legal research or work on the digital welfare state more broadly.Footnote 42
This paper does not seek to identify trends across multiple GitHub accounts but instead focuses on the repositories made available by one user: the DWP.Footnote 43 The analysis that follows is drawn from a sample of repositories on this account that detail interfaces in varying stages of testing, development or live service. Between 17 May and 21 June 2025 the author downloaded the repository, installed the necessary dependencies (such as other systems required to run the interface), and ran the code base locally on their machine. This process was completed for the most recent 100 repositories on the account, filtered by the time of the last update on 17 May 2025. These repositories therefore represent a ‘frozen’ snapshot of repositories on the account across this period and do not reflect a full picture of the activity or materials on the GitHub account. The excerpts below are all taken from these locally run code bases, reproduced here under the ‘MIT Licence’ attributed to these repositories (named after the Massachusetts Institute of Technology from which it derives and ‘by far the most popular licence’ on GitHub).Footnote 44
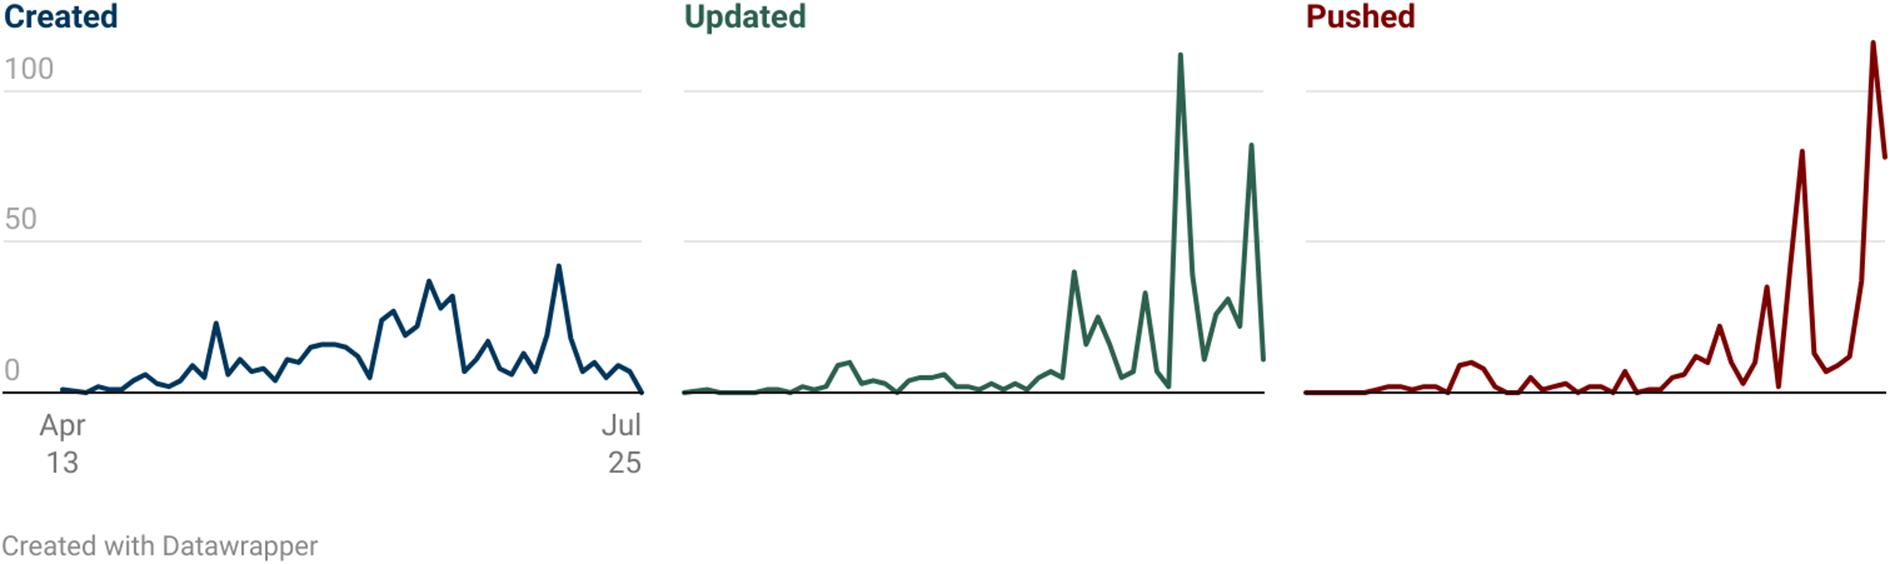
Before turning to these excerpts, it is important to provide some context on the activity on the DWP’s GitHub account itself. There are two elements to highlight. The first is the volume of activity across the users on the account since it was created in 2013. Figure 1 below shows the numbers of repositories ‘created’ (where new code bases are added for the first time), ‘updated’ (where edits to repositories are made directly via the GitHub platform) and ‘pushed’ (where changes to repositories are uploaded from developers’ own computers).
DWP GitHub repository activity: creation, updates, and pushes by quarter (2013–2025) (available at https://www.datawrapper.de/_/qIwbX/).

Looking at the DWP GitHub data from 2013–2025, three clear phases emerge. First, there was an initial period (2013–2017) with a low level of activity on the account. Secondly, a major expansion phase occurred around 2020–2021, when dozens of new repositories appeared on the account, aligning with the significant expansion in the ‘type, quality and uptake of digital services’ catalysed by the COVID-19 pandemic.Footnote 45 Thirdly, recent years show a significant change in activity. While new repository creation has slowed, actual development work on the account has increased markedly. In 2025, developers are pushing code 116 times per quarter and updating repository information 82 times. This points to a slowing down of the development of new repositories and more extensive refinement of existing code bases on the account.
The second trend to point to is the programming language distribution across the repositories. This again shows a shift over time. Programming languages that tend to be used for the design of user interfaces – HTML, JavaScript, and CSS, the so-called ‘holy trinity of front-end development’Footnote 46 – account for a greater share of the repositories on the account over time, from 44% of new repositories across 2013 to 2021 to 79% between 2022 and 2025. Indeed, in 2024–2025, 100% of new repositories are written in HTML, Javascript or CSS. These programming languages all serve functions in the design of user interfaces: HTML provides the ‘scaffolding’, CSS ‘styles those elements’ and Javascript (among a whole host of other possible functions) ‘makes then dynamic’.Footnote 47 This suggests that the focus of the work on the GitHub account has become more focused on the design and refinement of public or official-facing user interfaces over time.
Before turning to the analysis, it is important to acknowledge a few key limitations of drawing on this GitHub dataset. First, repositories on the account represent only a fraction of the DWP’s digital infrastructure; they are likely to be selectively published based on security considerations (eg whether doing so could facilitate fraud) and simply due to the internal policies, practices and preferences of individual teams within the DWP. Second, running interfaces locally removes them from their production context, including connections to backend databases, authentication systems, and third-party services. To navigate the full extent of some interfaces in the sample, a civil servant login to DWP systems was required – as a result, I was unable to access all elements of the interfaces explored across this paper. Despite these constraints, the publicly available repositories provides a window into the ‘digital architecture’ of the welfare state across a far broader range of interface prototypes than has been accessed in research to date. I now turn to the three key design patterns in the analysis of the sample.
3. Design pattern one: prompting and priming
Prompts and primes are part of the technical toolkit available to interface developers. Their use is bread-and-butter across almost all platforms, including interstitial and modal dialogs (overlays onto a screen that disappear only when clicked, such as the familiar ‘accept cookies’ modals across Europe), placeholder text (displaying inside input fields showing example answers), tooltips (contextual help that appears when a mouse hovers over it), reminders (such as pop-up boxes or alerts or SMS messages) and progressive disclosures (stacked sections that expand/collapse to show hidden content when clicked).Footnote 48 Prompts and primes seek to nudge and shape the behaviour of a user, not design it out completely. Rooted in choice-based architecture, these tools are designed to ‘help people make better choices’ in a digital environment, whether it is posting less abusive content on a social network or buying more of a product on an online shop.Footnote 49
Prompts and primes appear across digital public services. Sela’s work on user interface choice architecture in online court and tribunal processes shows how seemingly small shifts in designs can influence the behaviour of users that ‘steer’ them to particular outcomes.Footnote 50 The UC interface features a range of such prompts and primes, with a particular reliance on text and email alerts to nudge users to log into their journal when they have received a new message or an action is required from them.Footnote 51 These tools affect all users of these interfaces, including officials. For instance Vistintin et al’s field experiment with bureaucrats in Switzerland found that incorporating a prompt – what they characterise as a ‘thought-provoking nudge’ – in the course of a decision about disability benefits increased the officials’ ‘humanisation’ (namely, the extent to which they perceive and treat welfare beneficiaries as ‘full human beings’ rather than as abstract cases or files).Footnote 52
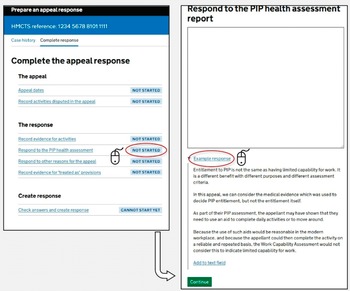
Within the GitHub sample, the ‘Appeal Response Prototype’ repository is an example of prompting and priming within a staff-facing interface. The interface creates decision-maker responses to appeals against benefit decisions based on Work Capability Assessment (WCA) outcomes – an assessment that determines eligibility for Employment and Support Allowance and the extent of in-work conditionality and payment rate a claimant receives in UC.Footnote 53 The interface walks the decision-maker through the requirements of a response: providing reasons for an appeal, the law on which it was based, relevant documents, and so on.Footnote 54 It starts by identifying what decision is being appealed, automatically identifying relevant medical evidence, and includes relevant documents. However, most interesting for our purposes is how it prepares the response to the claimant’s grounds of appeal.
The interface in Figure 2 deals with an appeal where the claimant relies in part on the outcomes from their health assessment for another benefit: Personal Independence Payment (PIP). This involves (for the time being)Footnote 55 a separate health assessment for non-means-tested disability benefits that runs alongside the WCA. Here, the interface provides the decision-maker with an open text box to enter their response to this claim. However, beneath this box is a prompt in the form of a down-pointing triangle (▼), that when clicked details an ‘example response’. This displays a block of template text that can be automatically entered in the open text box by clicking the hyperlinked text ‘add to text field’.
Screen from the Appeal Response Prototype responding to ‘PIP health assessment’ appeal grounds.

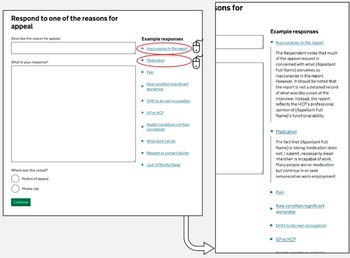
This prompt – with a one-click function to copy-and-paste into an appeal response – does not automatically populate the appeal response with this text, but instead provides a default starting point for the decision-maker (one which rejects the appeal), regardless of the contents of the PIP health assessment itself. This kind of ‘prompt and prime’ functionality can be seen across the Appeal Response Prototype as a whole. For instance, Figure 3 details the interface for staff to respond to other reasons in the appeal.
Screen from the Appeal Response Prototype responding to other ‘reasons for appeal’.

Again, the interface couples open text boxes with prompts, including sample text. The response screen provides a free-text box where the official can enter the reason for an appeal from the claimant, type a response, and confirm how it was raised (namely via phone call or in the notice of appeal itself). Next to this box, the menu on the right-hand side lists ten common reasons why an adverse Limited Capability for Work decision based on a WCA is challenged, each of which reveals a sample response when a down-pointing triangle is clicked. For instance, when a claimant raises their use of particular medication in an appeal, the sample response offers a generic dismissal that could apply to virtually any claimant, regardless of their specific circumstances or the severity of their condition:
The fact that [Appellant Full Name] is taking medication does not, I submit, necessarily mean <he/she> is incapable of work. Many people are on medication but continue in or seek remunerative work employment.
Template responses are nothing new in welfare administration; they are long-standing coping mechanisms to provide uniformity and efficiencies in the face of the demands of ‘mass processing’ and can be used to ‘bullet-proof’ decisions against legal challenges.Footnote 56 Structured template responses can be codified easily into any digital interface workflows (on which more below), where staff simply enter responses to predefined questions that in turn generate a response.Footnote 57 Exactly this kind of interface design has led to errors creeping into the ‘Judicial Case Manager’ in HM Courts and Tribunals Service, where users can add in ‘Core Case Data’ to generate decision notices (such as the number of pages in the bundle, the legal point at issue, the parties’ names, etc).Footnote 58 However, that is not what is happening in the Appeal Prototype interface. Instead, this prototype demonstrates how interface design elements that fall short of ‘structuring’ and ‘sorting’ can still serve to embed standardised template responses through ‘prompting’ and ‘priming’. The availability of these design elements – the modal dialogs, caret icons, tooltips boxes, and so on – are a unique features of interfaces which aim to shape the behaviour of individuals acting on the platform, rather than constrain them. This is important for at least two key reasons.
First, even though they may often be functionally equivalent, ‘prompts’ and ‘primes’ are less likely to fall foul of administrative law constraints on decision-makers than more rigid ‘structuring’ and ‘sorting’ designs. For instance, an interface that structures an official’s decision through the use of closed tick boxes, drop-down menus, and radio-buttons and so on, could in some contexts unlawfully fetter the exercise of their discretion.Footnote 59 Where they have been conferred a discretion, their exercise of it must ‘not be so rigid’ that it amounts to a decision in advance, but should instead be capable of some ad hoc exemptions.Footnote 60 A prompt and prime approach is closer to what Perry characterises as ‘rules of thumb’, as opposed to a pre-determined decision that prevents the proper exercise of an administrative discretion.Footnote 61 Given their impact can be similar in shaping user behaviour, they warrant similar interrogation and critique.
Secondly, the literature on ‘screen level’ and ‘systems level’ bureaucracy has often criticised a reduction in the ‘scope of administrative discretion’ because decisions are increasingly ‘programmed’ into the ‘design of the software’.Footnote 62 The argument goes that this translation of ‘the legislation into software’ both draws away discretionary power completely (by automating large swathes of prior human decision-making) and structures what remains (by determining which cases are subject to human review).Footnote 63 However, even where a decision-maker faces a blank open text box where they are free to write unstructured responses, prompts and primes such as those seen in the Appeal Prototype interface can play as key a role. Interrogation of case management systems, software and other digital tools should therefore not only focus on what is codified into the design, but also the prompts and primes that are presented to officials and other users as they navigate it.
4. Design pattern two: ‘happy path’ processing
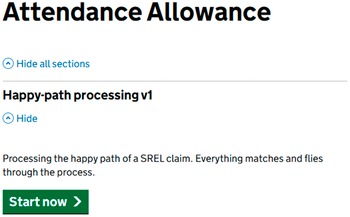
The ‘happy path’ is a key concept referred to routinely across the sample. This is a long-standing term of art in user-interface development, particularly for the majority of developers rooted in agile methods. The ‘happy path’ refers to simple, straightforward user journeys through a system ‘without exceptional’ events or ‘error conditions’ and where there are no ‘changes of plans’.Footnote 64 As the designer puts it in the Attendance Allowance Agent prototype in Figure 4, a ‘happy path’ is one where ‘everything matches’ and the claimant ‘flies through the process’. Sometimes referred to as a ‘sunny day scenario’,Footnote 65 the term captures those ‘relatively straightforward’ interactions with the system that avoid problematic or irrational behaviour by users, or difficult edge cases which require deviation from a kind of common-denominator interface that would work for a majority of users.Footnote 66
Screen from the Attendance Allowance Agent view prototype.

This is part and parcel of a broader technique used within interface design of ‘story tests’: the process whereby prototypes are designed and tested against hypothetical users with a particular story behind their engagement with the system (the oft-used ‘John Doe’ moniker is employed throughout the interfaces on the DWP GitHub account to serve this purpose). Where there are ‘happy paths’, there must be ‘sad paths’. Their associated story tests – referred to in the user-interface literature as ‘Sad-Path Workflow Story-tests’Footnote 67 – deal with complex cases, unpredicted behaviour, errors, or a lack of required inputs (for instance, lacking the necessary evidence, or where information in one system, such as one’s birthdate or National Insurance number, does not match that in another system). Sometimes referred to as ‘behaviour-driven development’ or other similar terms, this ‘story testing’ approach is fundamental to the agile software development approach widely adopted in the interface design community.Footnote 68 Developers start not only with a pre-determined set of deliverables (translate these benefit criteria into a form) but are also equipped with user-stories to shape their design and testing of the system (John Doe is applying for Attendance Allowance on behalf of their mother who has significant mobility problems).Footnote 69
There are two things worth noting about ‘happy paths’ in the context of user interface development in the DWP. First, they apply both to frontline staff and to claimants or other users (such as their relatives or advisors). The example in Figure 4 above is a claimant-facing story test – the interface deals with an application from an individual for Attendance Allowance. However, Figure 5 below shows an agent-facing story test in the DWP’s prototype ‘Later Life’ service: a user interface that allows staff to manage entitlement for the State Pension and Pension Credit. Here, deviations from the ‘happy path’ include scenarios where records from across systems (the ‘citizen search’ aspect of the interface) do not match.
Screen from the Later Life application prototype.

Secondly, user interface developers often start by implementing the ‘happy path’ first before moving on to ‘sad paths’. In the literature on user-interface development, this is characterised as allowing the ‘plumbing to be put in place’ using the ‘path of least resistance first’.Footnote 70 Of course, once you encounter ‘real users you’ll stray from the happy path quickly’ but, the agile approach is to ‘not worry about real life yet’.Footnote 71 This allows development to continue at pace, but also comes with considerable risks. Designing systems with a ‘happy path’ first approach has been identified as a key driver of risk in other public service contexts. For instance, research commissioned by the US Department of Defense has identified how ‘happy-path testing’ has led to how systems handle errors and user failures being neglected.Footnote 72 Testing is a time-consuming manual activity, and there is a risk that an emphasis on the ‘happy path’ prioritises the ‘typical way’ of engaging with a user interface, while ‘neglecting the alternative ways’ of doing so.Footnote 73
Having set out the importance of ‘happy path’ processing, the section now turns to its manifestation in two forms in the GitHub sample: ‘structuring’ content and then ‘sorting’ it.
(a) Structuring content: shaping users towards the ‘happy path’
The DWP’s prototype interfaces are constructed to steer as many users as possible towards these ‘happy paths’. An example of this can be seen in the ‘Attendance Allowance Prototype’, a digital version of what is currently a PDF-based application form.Footnote 74 Attendance Allowance is ripe for digitalisation. Although it is the key form of disability benefit for pension-age households, it remains significantly underclaimed, with as many as 1.1 million households with unfilled eligibility, amounting to as much as £5.2 billion of unclaimed support per year.Footnote 75 The application process is infamously burdensome, being regarded as ‘by far the most challenging of the pension-age entitlements’ to apply for.Footnote 76 An Independent Age study of claimants described the process as ‘long-winded’, ‘complicated’, ‘overwhelming’ and a ‘nightmare’.Footnote 77 It is perhaps unsurprising, therefore, that a key pillar of the DWP’s ‘Service Modernisation’ plans is to introduce an online digital claim process for the benefit.Footnote 78
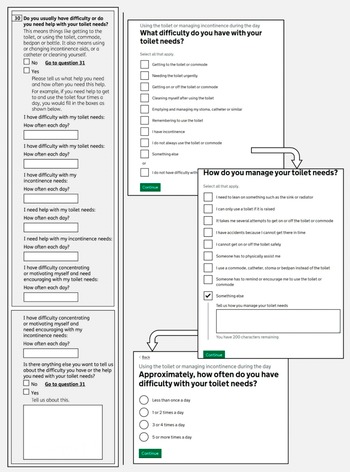
Figure 6 below sets out a side-by-side comparison between the current PDF application form and the interfaces in the DWP’s GitHub repository for one component of the application: a claimant’s toilet needs. Attendance Allowance is a benefit designed ‘primarily with intimate self-care needs in mind’Footnote 79 – translating these needs into the boxes and spaces on forms is challenging, with ‘toilet needs’ being among the most difficult and contested.Footnote 80
Attendance Allowance online claim prototype alongside the current PDF application form.

The redesign in the Attendance Allowance prototype is a significant change to the current application process. It relies far more on identifying and classifying a claimant into pre-determined categories. The PDF’s six separate frequency fields are replaced with standardised radio buttons (‘less than once a day’, ‘1 or 2 times a day’ etc). The progression from ‘what difficulty do you have with your toilet needs?’ through to ‘how do you manage your toilet needs?’ is designed to minimise deviation, with each screen limiting the user to specific, pre-coded responses, with the ‘something else’ option serving as a catch-all for experiences that do not fit the happy path.
This same optimisation towards a ‘happy path’ can be seen in staff-facing interfaces. For instance, the ‘Health Quality Review’ prototype is an example of an interface built around closed multiple-choice questions. The interface manages the reports and reviews of Health Care Professionals (HCP) – the assessors who conduct assessments for PIP disability benefits. These assessments are pivotal to PIP claims and have been criticised, not least regarding their accuracy.Footnote 81 This interface prototype handles the input and auditing of these assessments, in line with the extensive guidance provided by the DWP.Footnote 82 Figure 7 below details how a member of staff navigates to an individual claimant’s account and undertakes a ‘HCP review’, where the health assessors’ reports are judged against quality criteria so they can be audited.
The process for reviewing HCP reports for PIP in the Health Quality Review staff-facing prototype.

Here, the interface designers include a letter-based grading system for HCP reports, built into a fixed set of radio buttons. These range from ‘A’ (everything is justified) to ‘U’ (the evidence suggests a different award should be made). The DWP guidance provides such a letter rating system for reviews of case routing decisions (whether an assessment is conducted face-to-face, online etc) but not for the reviews of HCP reports tackled in this interface.Footnote 83 Instead, the interface design appears to have distilled the complex criteria for HCP reviews into the package of finite gradings currently used for reviews of case routing.
Using the interface to structure HCP report reviews in this way – limiting the staff member to a set of finite options, each tied to a pre-determined outcome – significantly streamlines and simplifies the process. However, this skews the review process towards a ‘happy path’. The guidance sets out a broad range of review criteria, structured into four main areas (opinion, information gathering, further evidence and process), each with their own additional measures (such as descriptor choice, justification, usability and so on) totalling 14 complex attributes.Footnote 84 Instead, the interface has collapsed this multi-dimensional evaluation into a single radio button choice, with options that focus on incomplete criteria. The multifaceted quality review envisioned in the guidance has been compressed into a streamlined ‘happy path’ that assumes each activity can be adequately reviewed through radio buttons on the interface.
Sorting content: ‘identify, match and refer’
Sorting claimants into categories is central to the functioning of the modern welfare state. Existing research already identifies how this happens informally – when street-level bureaucrats use their own internalised labels and categories to sort claimants, such as using their demeanour and appearance to sort claimants into categories of ‘job-readiness’Footnote 85 – and formally – where categories are built into the benefits system, such as the sorting of claimants by their capability to work.Footnote 86
‘Service encounters’, where claimants interact with the welfare state through engagement with staff, are an ‘important domain’ for both.Footnote 87 Interfaces play a role here. They not only structure the input of content, they also sort existing data about claimants into constructs built into the interface. Data may be structured and shaped into the ‘happy path’, but it still needs to be sorted by decision-makers into units or classifications, so they can navigate through claims and take decisions about claimants. Likewise, interfaces facilitate claimants to do their own self-sorting, where existing data about themselves (such as their relationships or health) can be classified into existing constructs within the platform.
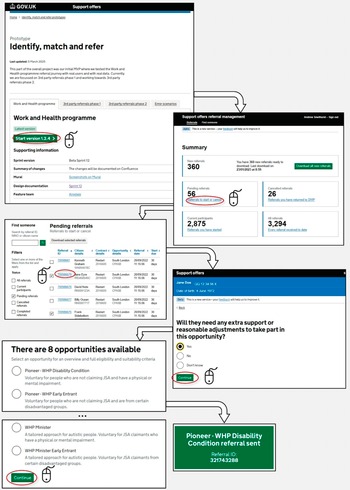
Within the GitHub sample, there are two constructs in particular that are examples of this kind of interface-led sorting: ‘referrals’ and ‘relationships’. Figure 8 details the staff-facing interface pathway for a Referral Management Prototype – the interface tied to the ‘Restart Scheme’, that mandated those who had been on UC and in the ‘Intensive Work Search’ regime for between 12 and 18 months to be referred to dedicated personalised support to ‘help them to find and maintain sustainable employment’.Footnote 88 Here, existing data about claimants already inputted into the system needs to be sorted to create matched referrals for available personalised support – a process billed on the interface landing screen as ‘identify, match and refer’.Footnote 89
Abridged excerpt of the Referral Management Prototype.

Here, the interface takes existing data available in the system and sorts it into a list of ‘pending referrals’, each tied to an individual claimant that fits the eligibility criteria for the scheme. The official clicks on the pending referral, answers questions about the individual (such as whether they require reasonable adjustments), and is then presented with a list of ‘opportunities’ (albeit, mandatory ones) to be matched against that claimant. Each opportunity has explanatory text to help inform the official’s decision. Once the official chooses an opportunity to match against the claimant, the referral is automatically sent across the system to other officials and the claimant themselves.
This process demonstrates how interfaces codify the categorisation processes at play in welfare-to-work schemes.Footnote 90 Indeed, processes of ‘frontline categorisation’ are core to these kinds of activation programmes, in terms of selecting individual claimants for participation, matching them to individual schemes, and monitoring the outcomes of their participation.Footnote 91 Where claimants have disabilities – as is the case for some claimants in the Restart Scheme – these classification processes can be particularly acute. As Grover and Piggott argue, the process of claiming Employment and Support Allowance (and working-age disability support more generally) is rooted in ‘classify[ing] people so that they can be treated differently from one another’.Footnote 92 Claimants are in turn sorted into further sub-categories of claimants, where the outcomes of these classifications can have ‘important impacts on those being classified’.Footnote 93
These sorting exercises are often analysed as a feature of automated decision-making, where sorting takes place behind the scenes based on the automated processing of data (sometimes even by third-party providers).Footnote 94 However, interfaces often do this sorting work independently of any existence of automated decision-making. As Ustek-Spilda and Alastalo put it, these classification processes are often being made at the ‘moment of data entry’ rather than at a subsequent point where the ‘data is analysed’.Footnote 95 This kind of ‘software sorting’ can lead ‘seemingly apolitical software infrastructures’ embedding administrative categories into the decision work-flows of officials in a way that is as powerful as if they were coded into automated processes.Footnote 96
The ‘Referral Management Prototype’ illustrates how officials’ use of these sorting interfaces is shaped by the ‘happy path’ structuring processes outlined above. For instance, an official is prompted to decide whether the claimant requires ‘extra support’ for their referral, their answer in turn shaping the ‘opportunities’ presented on the screen that follows. The opportunities themselves for claimants to be matched to each have their own prompt and priming text to shape the exercise of the discretion of the official. This is itself subject to the ‘happy path’ design pattern: the predefined ‘opportunities’ available for matching presume standard circumstances and straightforward support needs, while claimants with complex situations (such as those with multiple barriers to employment or requiring accommodations not captured in the system’s categories) risk being sorted into ill-fitting referrals.
This prototype illustrates how this kind of ‘identify, match and refer’ sorting is a key component of staff-facing interfaces, especially for labour market activation programmes. However, the ‘DWP Relationship Prototype’ showcases another kind of sorting exercise, where claimants self-sort their personal circumstances into constructs built into the platform. An excerpt of this interface is detailed in Figure 9.
Abridged excerpt of the DWP Relationships prototype.

This interface is designed to ‘create’ a relationship on the DWP system, to – as the front-screen suggests – ‘make things easier for when you talk to us’ by helping to ‘make sure information about your partner is correct’. Systems sorting families into readable relationship patterns are nothing new in the social security system or the welfare state more broadly. Categorisation and inscription of families has a long pedigree in the UK in particular, with the ‘ambitious’ ContactPoint system – a project to create a database containing the personal information of all children under 18 living in England – perhaps being the best-known illustration.Footnote 97
However, the ‘DWP Relationship Prototype’ is an interesting example of this kind of interface sorting because the burden falls on the claimant themselves to ‘create’ their relationship on the DWP platform. It is therefore a kind of ‘self-service’ portal adopted across welfare states.Footnote 98 Instead of a staff-facing interface where officials do the sorting based on an interaction with the claimant, the claimant self-sorts through their responses to series of closed questions. In common with the other interfaces in this section, this assumes a ‘happy path’ response from the claimant, with no room for deviation or contextual information to be provided across the interface. For instance, the screens ask for the name, address, marriage dates and other personal information of the partner. Names change – especially, as pointed out by Matthews et al, in LGBT+ households.Footnote 99 Even in a simple design, the interface embeds a normative relationship model (with fixed radio buttons assuming a marriage/civil partnership, cohabitation, and availability of documentary evidence) as the ‘happy path’. LGBT+ groups in particular face the challenge of ‘not fitting into the boxes’ of DWP systems, especially in the context of relationship statuses within systems, and it is not clear from the claimant’s standpoint, when interacting with this interface, how this relationship information will inform future decisions about the claimant, or future interactions with officials.Footnote 100
This self-sorting imposes burdens on claimants in other ways. Claimants, rather than officials, bear the consequences of the kind of ‘glitches’ that Raso identifies.Footnote 101 If a name or address is unrecognised within the system (an interoperability problem that is not hard to envisage for those with experience of similar public systems), this could lead to errors within their claim or prevent progression through to the end of the interface. Even without glitches, the interface introduces a new system for claimants to know about and navigate in order to, as the interface itself suggests, ‘make things easier for you when you talk to us’. In the social security system, interfaces ‘rely heavily on the labour of data providers’, including claimants themselves.Footnote 102 Claimants themselves need to know that the service exists and that they should create the relationship, find and access the interface, have the relevant documentation to hand (marriage/civil partnership certificate and personal information about their partner or ex-partner), and not require support.Footnote 103
Indeed, a key feature of ‘happy path’ processing is this disproportionate impact on users when things go wrong. As in the example in Figure 4, the ‘happy path’ is where ‘everything matches and flies through the process’; where things do not match, citizens seeking support themselves face the kind of burdens and frictions that have long been critiqued in studies of administrative justice and public administration. These burdens constitute what Madsen, Mikkelsen and Moynihan characterise as ‘frictions’ – administrative obstacles that increase the time, psychological, and learning costs for claimants navigating public services.Footnote 104 As is so often the case in social security, this is felt most keenly by groups with ‘complex’ circumstances (such as households with shared care arrangements for children, with fluctuating disabilities or gig economy work) who disproportionately face the burdens and frictions of having to navigate around limitations in these ‘happy path’ interfaces.Footnote 105
5. Design pattern three: managing officials’ workflows
Interfaces not only play a central role in the structuring and sorting of data about claimants, but also of data about officials too. Frontline officials’ work being increasingly structured through interfaces provides opportunities to manage and monitor their performance in new ways when compared to analogue systems, either by other officials, or through incentives built into the interface itself. Interfaces can track, record and display service statistics and individual team member performance in real-time. These data, which can be built into interfaces for both managers or frontline workers themselves, can rank the best performing bureaucrats, monitor performance over time, manage the allocation of tasks, and incentivise better (chiefly, ‘quicker’) performance.
Interfaces therefore enhance the scope for ‘top-down monitoring’ of frontline workers by the kinds of other officials who have always undertaken oversight of this sort; the managers, team leaders, back-office bureaucrats, and so on.Footnote 106 However, through their design, interfaces can also distribute these management and monitoring functions across broader teams of civil servants working on the front line. As work on ‘data dashboards’ in social security programmes across welfare states demonstrates, the easy access to performance metrics means that the ‘structuring and prioritising’ of work have now become ‘tasks that are increasingly seen as part of frontline work’ itself, rather than the preserve of more senior staff.Footnote 107 By displaying real-time information – the volume of pending cases, their average processing time relative to colleagues, predefined case statuses (such as low/high priority, overdue, unassigned, etc), team or individual targets, and so on – frontline workers have a greater insight on the metrics associated with their caseload, and the kinds of prompt and priming design patterns analysed above can be used to shape their processing accordingly.Footnote 108
De Witte et al argue that this can lead to a shift in the focus of frontline workers (in their case, Belgian social workers) from the ‘narrative’ of their clients’ cases, and towards the metrics shown on the ‘database’ that manages their day-to-day work (in their case, a data dashboard).Footnote 109 This is echoed in Kersing et al’s analysis of Dutch work coaches, which shows the impact these interfaces can have in shaping the work of frontline bureaucrats.Footnote 110 Performance metrics cut across three interfaces in their study: the team management dashboard, the quality officer’s dashboard, and the work coach dashboard. Even the more limited metrics incorporated into the latter moved some work coaches from a ‘client coach role identity’ to a ‘caseload manager role identity’.Footnote 111 Here, they found themselves increasingly ‘working for the data’ and prioritising ‘data-satisfying’ behaviour over being ‘people-focused’.Footnote 112 The interface may provide the frontline worker with more ‘insight and control over their caseload’, but in doing so, it may also serve to shape the decisions they take about their prioritisation and processing of clients’ cases.Footnote 113
These kinds of interfaces are well-established in digitalised welfare states, the UK included. One such example is the so-called ‘Active Operations Management’ methodology (known as AOM) to monitor ‘workflow management processes’ for staff working in benefit contact and processing centres, alongside JobCentre Plus offices.Footnote 114 An interface built on-top of existing DWP systems, the AOM shows workflow displays of a similar variety to those analysed by De Witte et al and Kersing et al above, allowing for the real-time management and monitoring of staff workflows.Footnote 115 Evaluations from the DWP demonstrate how the AOM was seen by frontline staff as ‘negative by the majority who commented on it’.Footnote 116 As their processing of cases increased, the interface flagged their free capacity for new cases, leading to more work and a pressure to maintain the pace – a process that led to ‘continually rising expectations about workflow’Footnote 117 and ‘gaming’ to ‘artificially slow the workflow down’.Footnote 118 The tool was not limited to staff working on web-based interfaces themselves, but cut across all kinds of contact points, with ‘up-to-the-minute performance information’ coming from the telephony systems in contact centres and being incorporated into the real-time metrics displayed on the interface.
These kinds of monitoring and management interfaces were seen across the GitHub sample. For instance, the ‘DWP Health PIP Agent Prototype’ details an interface design for the workflow of officials in the Work and Health Decision Making Directorate in the DWP at the Ty Taf office in Pontypridd, Wales.Footnote 119 Key screens in the ‘service statistics’ section are set out in Figure 10 below.
Screens in the ‘service statistics’ section of the ‘DWP Health PIP Agent Prototype’.

The system provides three tiers of monitoring information: overall service statistics (overall claims in process, pending, disallowed etc); team processing overviews (breaking down service level statistics across teams); and individual ‘productivity breakdown by individual team members’ (comparing performance metrics from one team member to another). Here, the prototype interface uses placeholder name text in the place of real team members within the Ty Taf processing office.Footnote 120 In addition to forming part of a distinct ‘service statistics’ interface, these statistics are made available to all users in the standard ‘agent view’, allowing frontline officials to compare their performance against others in their team.
However, perhaps the best example of how interfaces can combine these kinds of monitoring and management metrics into workflows can be found in the ‘DWP Task Master’ prototype.Footnote 121 Its internal-facing front-page explains that the interface provides a ‘service for case managers and decision makers to receive, view and manage their tasks’, with a view to helping ‘agents choose, perform and manage a task’. Figure 11 provides an excerpt from this interface.
Excerpt from the ‘DWP Task Master’ prototype.

There are three elements of particular interest here. First, the prioritised to-do list component echoes a similar design aimed at claimants in the UC interface. Indeed, alongside the journal (a text-based chat interface), the UC claimant account is ‘organised around’ the ‘to do list’ interface.Footnote 122 For claimants, the to-do list provides a non-linear way to structure the input of data (one described by civil servants involved in its design as ‘atypical’ and ‘quite untraditional’ for a benefits application).Footnote 123 Here, the same interface element is being used for staff, with the assigned staff member and system-flagged priority sitting alongside the task type details. Secondly, the ‘my clearances’ view provides a detailed real-time assessment of total cases processed, the total tasks assigned and an average processing time per task. This information is provided not only to team leaders or management staff, but instead – in line with Kersing et al’s arguments above – incorporates case management metrics into the interfaces used by the street-level workers themselves. The interface itself highlights that reports on these processes are still escalated upwards – as in the ‘recently completed tasks’ screen, which details at the top that the ‘last weekly report [was] automatically sent to team leader’. Thirdly, the task information screen structures the discharge of a task that the street-level worker feels they cannot do, either due to a lack of experience or training, access to information or ‘other reason’. This results in an interface that manages the on-flow and off-flow of work for street-level bureaucrats, without the need for interacting with other team members outside of it.
Conclusion
Interfaces are now firmly part of the ‘digital architecture’ of the welfare state.Footnote 124 As is now the case across public services, a community of civil servants, sometimes working alongside private providers, designs and delivers digital interfaces that implement polices and entitlements. Interfaces increasingly manage applications, staff workflows, claim maintenance, handling of evidence and appeals, and any other conceivable interaction a member of the public could have with a public service. As reflected across the examples throughout this paper, this heavily underexplored community has its own design patterns and processes, steeped in practices from the user-experience and human-computer interaction fields. ‘Prompting and priming’, ‘happy path processing’ and workflow management all reflect the kinds of design choices that civil servants take in constructing these interfaces – the pop-up modal dialogs, radio buttons, text-boxes, branch logics and so on – and how they approach these choices, which may be at odds with what is otherwise considered ‘good administration’ elsewhere in the bureaucracy.
Each of these three design patterns shows how law and policy is refracted through this community of interface designers. ‘Prompting and priming’ practices demonstrate how interfaces shape administrative discretion even where they fall short of fully structuring it. The Appeal Response Prototype’s template responses and one-click insertions show how interfaces can steer officials towards standardised responses, even if not going as far as pre-populating fields. While structured interfaces with rigid tick-boxes might clearly engage concerns about unlawful fettering, prompts and primes operate in a grey area, where prompts, suggestions, and defaults shape design-making.
The prevalence of ‘happy path’ processing across both claimant-facing and staff-facing interfaces reveals how principles rooted in user-interface design and human-computer interaction can shape how need is articulated and assessed. By designing first for straightforward cases and standard circumstances, these interfaces risk marginalising those whose needs, relationships, or circumstances do not fit predetermined categories. For socio-legal scholars with an interest in the digital welfare state, this suggests that interface design can subtly restructure how complexity and exception are managed (or even designed out) in applications or other processes to secure social entitlement.
The use of interfaces to manage staff workflows reveals how interface design can diffuse case management functions across the front line. The ‘DWP Task Master’ and ‘Health Quality Review’ prototypes demonstrate how performance metrics, real-time monitoring, and automated task allocation are increasingly embedded into the daily work of officials via the interfaces they use. The incorporation of individual productivity breakdowns, team comparisons, and automated reporting into the same interfaces that officials use to process cases means that performance management is increasingly woven into the fabric of everyday administrative work.
The three patterns identified here are not distinct; they can each bleed into one another when it comes to individual interface designs. For example, the design and monitoring built into staff workflows may incorporate elements of prompting and priming (such as presenting performance statistics in a dynamic way during a workflow) or ‘happy path’ processing (by designing for processing decisions about ‘straightforward’ claimants before ‘complex’ ones). Likewise, claimant-facing ‘prompts and primes’ may be felt disproportionately by users deemed to be outside of the ‘happy path’, where the default user journey only becomes possible to navigate with these nudges and inducements.
More broadly, these design patterns have implications for how we understand ‘interface governance’ and the ‘interface-first bureaucracy’.Footnote 125 The interfaces analysed in this paper do more than digitise existing processes; they reshape the possibilities for administrative action, reconfigure the distribution of burdens between state and citizen, and embed principles rooted in user-interface design into the design and delivery of entitlement. The emerging integration of AI-enabled technologies into these interfaces raises new possibilities, not only in terms of incorporating other functionality (such as chatbot tools) but also in reshaping the responsiveness of interfaces themselves (such as providing ‘bespoke’ interfaces for individual users based on their predicted or actual behaviour and predicting needs to proactively recommend relevant services). If these ‘agent-driven interfaces’ proliferate – which is the stated aim of Google and other developers – they will likely reveal their own new design patterns.Footnote 126 As it is increasingly the case that ‘everyone interfaces’, understanding the design and delivery of the administrative state requires an understanding of how developers design and deliver its interfaces.


 Open access