1 INTRODUCTION
Radio source catalogues that cover wide areas of sky are important tools for exploring the properties and evolution of a large range of source populations. Combining multiple source catalogues allows the determination of source spectral index information and statistical studies with large samples of different radio galaxy populations, such as active galactic nuclei (AGN) and star-burst galaxies. Measuring how the relative fractions of different populations change and, ultimately, how the differential source counts evolve with frequency (see de Zotti et al. Reference de Zotti, Massardi, Negrello and Wall2010 for a review) provides essential insight into the co-evolution of galaxies and their central super-massive black holes through cosmic time.
The S-band Polarisation All-Sky Survey (S-PASS) has mapped the southern sky for declinations (Dec) δ ⩽ 0° in total intensity and polarisation with the 64-m Parkes radio telescope at a frequency of 2 300 MHz.
S-PASS is a project to map the diffuse emission of the entire southern sky at 2.3 GHz. The main survey goals are to investigate the polarised synchrotron emission, Galactic and extragalactic magnetism, and Cosmic Microwave Background polarised foregrounds. A more detailed description of the S-PASS survey strategy and science goals is given by Carretti (Reference Carretti, Kothes, Landecker and Willis2010) and in the upcoming survey description paper (Carretti et al., in preparation).
One S-PASS data product is a collection of all-southern-sky total intensity maps, containing more than 104 extragalactic radio sources. Most of the radio sources in the S-PASS images will be distant radio galaxies.
In this paper, we present the construction and verification of the S-PASS Stokes I source catalogue. We compare the S-PASS source catalogue to several other radio source catalogues to assess its quality (see Table 1): the Sydney University Molonglo Sky Survey (SUMSS; Mauch et al. Reference Mauch, Murphy, Buttery, Curran, Hunstead, Piestrzynski, Robertson and Sadler2003); the NRAO VLA Sky Survey (NVSS; Condon et al. Reference Condon, Cotton, Greisen, Yin, Perley, Taylor and Broderick1998); the Parkes-MIT-NRAO survey (PMN; Griffith & Wright Reference Griffith and Wright1993 and corresponding paper series); the Australia Telescope Compact Array (ATCA) calibrator list;Footnote 1 and the Parkes Radio Source Catalogue (PKSCAT90; Bolton, Savage, & Wright Reference Bolton, Savage and Wright1979; Wright & Otrupcek Reference Wright and Otrupcek1990).
Radio source catalogues used in the comparison and verification of the S-PASS source catalogue.

a This is the number of sources in the overlap region only and excludes sources in the comparison catalogues that fall within the |b| < 10° cut imposed on the S-PASS source catalogue. If declination cuts are imposed during verification, they are explicitly stated in the text.
b The full PMN catalogue is comprised of four sub-catalogues. For this paper, we use only the ‘Southern’ and ‘Zenith’ sub-catalogues.
c Selected sources above 500 mJy within the nominal S-PASS declination range.
The paper is structured as follows. In Section 2, the observation strategy and image processing is outlined. In Section 3, we describe the procedures used to construct the source catalogue. Section 4 contains the analysis and verification of the catalogue and in Section 5, we outline the catalogue format. Finally, we review our conclusions in Section 6. Throughout, spectral indices, α, are defined using the convention S ν∝να.
2 DATA COLLECTION AND REDUCTION
2.1. Observations
Observations were carried out over the period 2007 October to 2010 January using the Parkes S-band receiver. The S-band receiver is a package with a system temperature T sys = 20 K, a beam full width at half-maximum (FWHM) of 8.9 arcmin, and a circular polarisation front-end ideal for linear polarisation observations with single-dish telescopes.
Observing was carried out in long azimuth scans taken at the elevation of the south celestial pole as viewed from Parkes covering the entire Dec range (δ ⩽ 0°) in each scan. Specifically, a scan length in azimuth of 115° and a scan rate of 15 deg min−1 is required to realise this. Earth rotation was used to span the whole right ascension (RA) range.
As described in Carretti (Reference Carretti, Kothes, Landecker and Willis2010), each night a zig-zag in the sky is realised (see Figure 8 of Carretti Reference Carretti, Kothes, Landecker and Willis2010). Combining the different zig-zags taken on different nights, all of the RA range can be observed with the appropriate sampling. The azimuthal scans are observed either eastward at sky-rise, or westward at sky-set. That way, two full sets of scans are realised with different directions in the sky, that, combined, provide an effective basket weaving.
The Parkes observatory staff performed pointing calibrations at the beginning of each session, delivering the telescope with pointing offsets better than 10 arcsec in both RA and Dec (more than sufficient for 9 arcmin beam-width observations). Scans to check pointing calibrations were performed at each session by the observing team to check that no residual offset along the scan direction was present. More details can be found in Carretti (Reference Carretti, Kothes, Landecker and Willis2010), while a full description will be included in the forthcoming S-PASS survey description paper (Carretti et al. in preparation).
Data were collected with the Digital Filter Bank mark 3 (DFB3) using a configuration with 256 MHz bandwidth and 512 frequency channels (0.5 MHz channel width). This configuration also provides full Stokes information (autocorrelation products for the two circular polarisations RR* and LL*, and their complex cross-product RL*).
The primary flux density calibrator was PKS B1934-638, using the model from Reynolds (Reference Reynolds1994), with PKS B0407-658 as the secondary calibrator. The resulting absolute flux calibration is accurate to within $5\text{--}10\%$
.
$5\text{--}10\%$
.
2.2. Data reduction
A software pipeline developed by the S-PASS team was employed to reduce and calibrate the data given the complex observation strategy and science goals. Output data were binned into 8 MHz channels for calibration and radio frequency interference (RFI) flagging purposes. The calibrator flux density model was used to calibrate each individual channel, giving a flat calibrated bandpass (see Carretti et al. Reference Carretti2013a) without need for further corrections. After RFI flagging, the useful band covered the ranges 2 176–2 216 MHz and 2 256–2 400 MHz. All useful 8 MHz bands were binned together in one channel for an effective central frequency of 2 307 and 184 MHz bandwidth.
The maps are arranged in rings of Dec such that the entire S-PASS observed sky is captured. Map centres are − 7.5°, − 22.5°, − 37.5°, − 52.5°, − 67.5°, and − 82.5°—with 24, 24, 21, 18, 13, and 7 maps, respectively in each Dec range. Each map is a grid of 3 × 3 arcmin2 in zenithal equidistant (ARC) projection. For analysis focussed on compact sources, S-PASS scans are spatially high-pass filtered to remove the large scale spatial structure (Lamee et al. Reference Lamee, Rudnick, Farnes, Carretti, Gaensler, Haverkorn and Poppi2016). A median filter with a 45 arcmin window was used to achieve this. A window size of 5 × the intrinsic resolution (9 arcmin) was chosen in order to give the best trade-off between ineffectively removing large scale structure and not affecting the source flux estimates. The filtered scans were then spatially convolved with a 6 arcmin Gaussian window. All data points within the Gaussian window were binned and weighted based on the window function value at that pixel coordinate. This generated the final set of 107 15 × 15 deg2 maps, with an effective beam width of θfwhm = 10.75 arcmin.
The mean RMS noise in the Stokes I maps is σrms ≈ 12.9 mJy beam−1. Since the thermal noise is an order of magnitude lower (σth ≈ 1 mJy beam−1, Carretti et al. Reference Carretti2013b), the sensitivity is limited by the confusion noise which we estimate to be $\sigma _\mathrm{c}=\sqrt{\sigma _\mathrm{rms}^2-\sigma _\mathrm{th}^2}\approx 12.9\mathrm{\,mJy\,beam^{-1}}$
. This is consistent with the estimate from a scaled approximation of equation (14) in Condon (Reference Condon1974),
$\sigma _\mathrm{c}=\sqrt{\sigma _\mathrm{rms}^2-\sigma _\mathrm{th}^2}\approx 12.9\mathrm{\,mJy\,beam^{-1}}$
. This is consistent with the estimate from a scaled approximation of equation (14) in Condon (Reference Condon1974),
 $$\begin{equation}
\sigma _\mathrm{c}\approx 0.2\left(\frac{\nu }{\mathrm{GHz}}\right)^{-0.7}\left(\frac{\theta _\mathrm{fwhm}}{\mathrm{arcmin}}\right)^2\approx 12.9\mathrm{\,mJy\,beam^{-1}}
\end{equation}$$
$$\begin{equation}
\sigma _\mathrm{c}\approx 0.2\left(\frac{\nu }{\mathrm{GHz}}\right)^{-0.7}\left(\frac{\theta _\mathrm{fwhm}}{\mathrm{arcmin}}\right)^2\approx 12.9\mathrm{\,mJy\,beam^{-1}}
\end{equation}$$
which is appropriate for synthesised beams larger than θfwhm = 0.17 arcmin.
3 CATALOGUE CONSTRUCTION
The final S-PASS source catalogue was constructed by combining the source catalogue for each of the 107 total intensity maps. Here, we detail the catalogue creation process for one tile and then how the individual tile catalogues were combined to create the final S-PASS source catalogue.
3.1. Source finding for one tile
We used the source finding algorithm aegean Footnote 2 (Hancock et al. Reference Hancock, Murphy, Gaensler, Hopkins and Curran2012) and its associated tool set to create a source catalogue from the raw images. aegean fits one or more elliptical Gaussians to each source and produces a set of characterising source parameters. A signal-to-noise cut of 5σsrc, where σsrc is the local RMS for each source as calculated during the noise estimation step, was imposed on the tile catalogues.
3.1.1. Background and noise estimation
The Background And Noise Estimation tool (bane; part of the aegean tool set) was used to create background and RMS noise maps, evaluated on angular scales of ~ 3°, for individual images. See Figure 1 for an example of an S-PASS tile image and the corresponding background and RMS noise maps. Background values for the individual maps are expected to be close to zero, if slightly negative, due to the median filtering applied to the images. Typical background values measured by bane are ≈ −2.3 mJy beam−1, but range from − 3.7 to 0.5 mJy beam−1. The combination of the median filtering, described in Section 2.2, and the background subtraction eradicates any significant diffuse structure away from the Galactic plane.
Top: A typical S-PASS image, centred on J2000 coordinates (α, δ) = (05:08:42, −37:31:30). Middle: The background estimation for the image produced by bane. Values are negative due to the median filtering applied (see Section 2.2). Bottom: The RMS noise map produced by bane.

3.2. Catalogue combination and filtering
The source tables for each image were concatenated into one all-southern-sky source catalogue, covering Dec δ ⩽ 0° for all RA. For some RAs, sources are found outside the nominal Dec boundary. There are 118 such sources with δ > 0° that are included in the final catalogue and are used throughout the catalogue verification.
The tile images at each Dec strip overlap the next lowest Dec strip by ~ 50 arcmin. The overlap in RA varies with Dec, ranging from ~ 1° at the equator to ~ 10° at δ ≈ −82°. Due to the overlap, the combined table contained multiple detections of several thousand sources. For each source that was detected multiple times, only the detection with the lowest RMS noise was retained in the final source catalogue.
Sources near the Galactic plane (|b| < 10°) were removed. This conservative exclusion region was chosen because even though a median filter was applied to the scans, the Galactic plane would require a different analysis and catalogue creation pipeline due to the high source density and incomplete removal of large scale structures. This region will be examined in an upcoming paper.
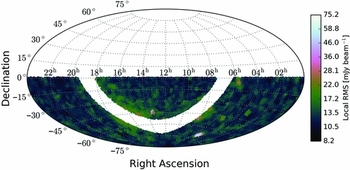
The final source catalogue contains 23 389 extragalactic sources and covers a sky area of approximately 16 600 deg2 (see Figure 2 for the RMS noise map). Notable exceptions to the otherwise uniform sky noise level are Centaurus A, the Large Magellanic Cloud and areas near the Galactic plane.
An Aitoff projection RMS noise map of the sky area covered by S-PASS, including the |b| < 10° cut. The mean local RMS noise for sources in the catalogue is ≈ 12.9 mJy beam−1 with notable exceptions being Centaurus A and the Large Magellanic Cloud which have local RMS values ~ 6 times the mean.

The Stokes I source catalogue format is outlined in Section 5 and an example selection of sources can be found in Tables 2 and 3.

Continuation of Table 2. Columns 3 and 4 from Table 2 have been appended to provide a reference.

a Errors of −1 indicate a fitting error or nearly circular source, where major and minor axis errors and position angle are poorly defined.
b The residual mean and std. dev. from the fitting process (i.e. data subtract model). If a source has been well fitted, the residuals will be small.
3.2.1. Resolved S-PASS sources
Given the S-PASS beam size, we would expect that few sources outside the Galactic plane will be partially or fully resolved with angular size ≳ 11 arcmin.
The ability to determine whether a source is resolved typically depends on the signal-to-noise of the source, where low signal-to-noise sources are much more difficult to constrain with an elliptical Gaussian. Using the fitted major and minor axes (a and b) to estimate the source extent and we can determine whether the source is truly resolved. This assumes that all sources are well fit, thus any spurious fitting errors will produce non-sensical results.
To assess how many sources are resolved, we define the extent of a source as
 $$\begin{equation}
\zeta = \frac{ab}{a_\mathrm{psf}b_\mathrm{psf}},
\end{equation}$$
$$\begin{equation}
\zeta = \frac{ab}{a_\mathrm{psf}b_\mathrm{psf}},
\end{equation}$$
where a psf and b psf are the major and minor axis for the local point spread function. In the case of S-PASS a psf ≡ b psf = 645 arcsec. The error in the extent is calculated by summing the fractional errors in a and b in quadrature, i.e. (Δζ/ζ)2 ≈ (Δa/a)2 + (Δb/b)2.
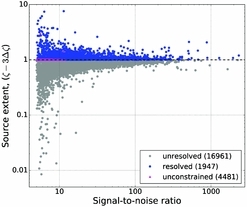
A source is resolved at the 3σ level (≈ 99.7% confidence assuming Gaussian statistics) if (ζ − 3Δζ) ⩾ 1, otherwise the source is unresolved. Figure 3 identifies three source categories: resolved, unresolved, and unconstrained. Unconstrained sources are those for which aegean has been unable to determine errors in the semi-major (a) or semi-minor (b) axes. Resolved and unresolved S-PASS source numbers are calculated from the total source catalogue minus those sources with unconstrained source size errors.
S-PASS source extents (ζ − 3Δζ) as a function of signal-to-noise ratio. Magenta triangles represent sources with unconstrained source size errors (i.e. Δa = −1 arcsec or Δb = −1 arcsec in Table 3). Resolved sources are depicted as blue circles and unresolved sources are shown as grey circles. The catalogue consists of 8% resolved sources and 73% unresolved sources, with the remaining 19% having unconstrained source size errors.

Resolved sources comprise ~ 8% of the total number of catalogued sources, while unresolved and unconstrained sources contribute ~ 73 and ~ 19%. We consider all 23 389 sources, regardless of whether they are resolved or not, for the verification analysis.
4 VERIFICATION
The S-PASS source catalogue consists primarily of compact sources. In order to assess the quality of the final catalogue, a number of tests have been performed.
We analyse the internal catalogue flux density distribution and the average source spectra with respect to PMN counterparts at 4.8 GHz and PKSCAT90 counterparts at 2.7 GHz. The catalogue astrometry, completeness, and reliability are also examined in this section.
4.1. Flux density scale
The 16 cm (2.1 GHz) ATCA calibrator catalogue has high resolution (~ 6 arcsec, assuming 6 km array configuration), with sources selected to be compact and (mostly) have no other nearby source within ~ 11 arcmin. ATCA calibrators were chosen for comparison with S-PASS sources because they provide an independent and accurate measurement of source flux densities.
The S-PASS catalogue was cross-matched with a list of calibratorsFootnote 3 for ATCA. The flux density limit for both source lists was restricted to S peak > 500 mJy beam−1. The two catalogues were cross-matched symmetrically based on sky position with a 300 arcsec cross-matching radius, taking only the best matches. The cross-matching included all S-PASS sources, including those outside the nominal δ ⩽ 0° boundary. This produced a matched list containing 363 sources.
After scaling the ATCA flux density to 2.3 GHz assuming a spectral index of − 0.7, we calculate the ratio of the S-PASS to ATCA source flux density. The median flux density ratio is 1.04 ± 0.01, which is consistent with unity given the S-PASS absolute flux calibration uncertainty (see Section 2.1) and that errors in the ATCA flux measurements are not included.
The same analysis was also conducted using the PKSCAT90 2.7 GHz fluxes. This comparison has the benefit that both surveys were produced with the same instrument at similar frequencies and therefore with comparable resolution elements, reducing cross-matching confusion. The cross-matched list contains 1 232 sources. Scaling the PKSCAT90 fluxes to 2.3 GHz, the median ratio of S-PASS to PKSCAT90 flux densities is 0.967 ± 0.003. This is again consistent within the S-PASS absolute flux calibration uncertainty of 10%.
The distribution of ratios is expected to centre around unity. The results from cross-matching to both reference catalogues are plotted in Figure 4. The dashed line indicates a ratio of 1, the solid line is the measured median ratio value and the dotted lines are the 1σ confidence levels. Given that both distributions have peaks consistent with unity, we assert that the S-PASS flux density scale is reliable to within the 10% uncertainty.
Flux density ratio distributions for sources brighter than S peak > 500 mJy beam−1. Top: ATCA (2.1 GHz, extrapolated to 2.3 GHz) and S-PASS source flux ratios. The median ratio, with standard error is 1.04 ± 0.01. Bottom: PKSCAT90 (2.7 GHz, extrapolated to 2.3 GHz) and S-PASS source flux ratios. The median ratio, with standard error is 0.967 ± 0.003. The median is displayed as a solid black line, a ratio of unity is marked by the dashed line, and the dotted lines represent the 1σ confidence levels.

4.2. Spectral index distribution
To further test the accuracy of the S-PASS flux density scale, we examine the spectral index distribution between S-PASS at 2.3 GHz and PMN at 4.8 GHz. PMN was chosen as its resolution (5 arcmin) is comparable to that of S-PASS (~ 11 arcmin), reducing cross-matching issues. Spectral indices for 772 sources were calculated by cross-matching the S-PASS and PMN catalogues with a search radius of 300 arcsec and selecting only S-PASS sources brighter than 500 mJy beam−1.
Caution should be taken when interpreting any individual source spectral index information for S-PASS and PMN. The surveys are separated by decades and source time-variability may result in drastic changes in observed spectral index properties, misrepresenting the true source spectral index.
Figure 5 shows the distribution of spectral indices, with a median value (solid black line) of αmed = −0.69 ± 0.02. The 1σ confidence interval (dashed black lines) spans spectral index values of − 0.93 to − 0.26. There are very few source populations that can achieve a spectral index of α < −2; however, a spectral index of − 0.5 ≲ α is not uncommon (e.g. blazars and QSOs). The tail of sources with spectral indices α ≳ −0.5, visible in Figure 5, is therefore not unexpected. A similar distribution is observed independently by Lamee et al. (Reference Lamee, Rudnick, Farnes, Carretti, Gaensler, Haverkorn and Poppi2016) using only a sample of ~ 500 S-PASS Stokes I sources and cross-matching with NVSS.
Spectral index distribution between 2.3 and 4.8 GHz for all S-PASS sources with S peak > 500 mJy beam−1 and a counterpart in PMN. The solid black line identifies the median spectral index (αpmn spass = −0.69 ± 0.02) and the black dashed lines represent the 1σ confidence interval (− 0.93 to − 0.26). Note the extended tail of flat and inverted spectral indices.

The extended tail could be evidence for two source populations being partially resolved. In comparison to the Australia Telescope 20GHz Survey (AT20G; Murphy et al. Reference Murphy2010) spectral index distribution, where there is no clean distinction between source populations, it seems more likely that S-PASS is observing a single population with an extended ‘flat’ spectrum tail.
4.3. Astrometry
The median signal-to-noise ratio for an S-PASS source is SNR ~ 10. For sources with SNR ~ 10, the mean position error, which accounts for the background noise, is Δθ ~ 35 arcsec (using equations 20 and 21 from Condon Reference Condon1997). The Gaussian fitting errors in RA and Dec (columns 4 and 5) that aegean calculates are consistent with the description given by Condon (Reference Condon1997), assuming a synthesised beam of 645 arcsec and a pixel spacing of 0.05°. We expect the mean errors in the RA and Dec for the entire catalogue to be approximately this value.
We cross-matched the S-PASS catalogue with the SUMSS and NVSS catalogues, chosen for their excellent astrometry. Bright source (S ν ≳ 5 mJy beam−1) positions in NVSS are accurate to within (εα, εδ) = (0.45, 0.56) arcsec (Condon et al. Reference Condon, Cotton, Greisen, Yin, Perley, Taylor and Broderick1998). The SUMSS catalogued sources have mean offsets from their cross-match with NVSS of ⟨Δα⟩ = −0.59 ± 0.07 arcsec and ⟨Δδ⟩ = −0.30 ± 0.08 arcsec (Mauch et al. Reference Mauch, Murphy, Buttery, Curran, Hunstead, Piestrzynski, Robertson and Sadler2003). Using a cross-matching radius of 10.75 arcmin, we retrieve the average astrometric offsets for S-PASS sources.
Cross-matching with SUMSS, we find that the offsets are ⟨Δα⟩ = 4.7 ± 24.7 arcsec and ⟨Δδ⟩ = 3.1 ± 22.4 arcsec (see Figure 6). Cross-matching with NVSS, we find that the offsets are ⟨Δα⟩ = −8.5 ± 24.1 arcsec and ⟨Δδ⟩ = −2.8 ± 22.6 arcsec (see Figure 7).
Astrometric offset distributions from cross-matching S-PASS with SUMSS. The mean offset in RA is 4.7 and 3.1 arcsec in Dec. The solid black line represents the distribution mean and the dashed lines identify the standard deviation.

Astrometric offset distributions from cross-matching S-PASS with NVSS. The mean offset in RA is − 8.5 and − 2.8 arcsec in Dec. The solid black line represents the distribution mean and the dashed lines identify the standard deviation.

Cross-matching between catalogues with vastly different angular resolutions and much higher source densities, false matches can become an issue. Given the source densities of SUMSS and NVSS (~ 21 deg−2, ~ 52 deg−2), and the size of the S-PASS beam (FWHM = 10.75 arcmin), we could expect ~ 0.5 SUMSS sources, and ~ 1.3 NVSS sources per S-PASS beam. Consequently, this could lead to spurious cross-matches between unrelated sources and would increase the spread of astrometric offsets.
Overall, the astrometry for S-PASS sources has no net systematic offset and the errors are in agreement with the estimated Δθ ~ 35 arcsec. Note that individual source position errors are a function of signal-to-noise.
4.4. Completeness
To calculate the catalogue completeness, only S-PASS images that do not contain the Galactic plane were selected. The selection criterion was that the image centre Galactic latitude be more than 15° away from the Galactic plane (i.e. |b centre| ⩾ 15°). This resulted in 80 of the original 107 images being used for this analysis.
To estimate the completeness, 200 simulated sources were injected, over a flux density range of $0.01\text{--}10$
Jy, into each of the selected S-PASS images. The background and noise maps from the original images (i.e. before simulated source injection) were used with the simulated maps and processed by aegean in the same manner as when creating the source catalogue (see Section 3). This ensured that the background and noise properties of each simulated image were identical to those of the original maps.
$0.01\text{--}10$
Jy, into each of the selected S-PASS images. The background and noise maps from the original images (i.e. before simulated source injection) were used with the simulated maps and processed by aegean in the same manner as when creating the source catalogue (see Section 3). This ensured that the background and noise properties of each simulated image were identical to those of the original maps.
The completeness (Ci ) for each image, i, was calculated by counting the number of simulated sources detected (Di ) versus the number injected into each image at each flux density bin (i.e. Ci (S ν) = Di (S ν)/200). These completeness values were then combined to calculate the completeness for the entire catalogue.
In Figure 8, the median completeness has been plotted for the catalogue, with the shaded region representing the 1σ confidence interval. The catalogue SNR cut-off, 5σrms is plotted as a dashed black line for reference. The catalogue achieves a completeness of > 95% at 0.225 Jy and is more than 99% complete at 0.5 Jy. The catalogue is 100% complete above flux densities of 1 Jy and far from the Galactic plane.
The S-PASS catalogue median completeness (solid black line) and the 67% confidence interval (shaded grey). The 5σrms cut-off is indicated by the vertical dashed line.

4.5. Reliability estimate
The reliability was estimated by measuring the fraction of S-PASS sources that have a counterpart in SUMSS for Dec − 89° ⩽ δ ⩽ −40°, and NVSS for Dec − 40° < δ ⩽ −1°. As when examining the flux scale and spectral index distribution of S-PASS sources, we select only those sources with a peak flux above 500 mJy beam−1, which is approximately the S-PASS 99% completeness limit. If we assume that the sources are self-absorbed (S ν∝ν2.5, i.e. a worst case scenario), this corresponds to SUMSS and NVSS flux densities of 41 and 145 mJy beam−1, respectively—well above the 99% completeness limit for each survey.
In the S-PASS source catalogue, there are 550 sources in the SUMSS region and 1 003 sources in the NVSS region with S-PASS flux densities above 500 mJy beam−1. Cross-matching SUMSS to S-PASS with a matching radius of 300 arcsec, we find that there are 517 sources above the defined flux density limit with an S-PASS source above 500 mJy beam−1. Using the same cross-matching criteria, we find there are 945 NVSS sources above the defined flux density limit with an S-PASS source above 500 mJy beam−1.
The ratio of sources detected in the cross-match to the number of suitable sources in S-PASS gives an estimate for the reliability at 500 mJy beam−1. For SUMSS and NVSS, this corresponds to ~ 94% reliability.
As a baseline, a mock catalogue was created from the S-PASS source catalogue by shifting each source RA and Dec by + 0.5°. Cross-matching this mock catalogue in the same way as above, we find that there are 58 matches between SUMSS and S-PASS and 14 between NVSS and S-PASS. This corresponds to a false matching rate between ${\sim }2\text{--}9\%$
, implying that the actual source catalogue reliability could be as low as 85% at 500 mJy beam−1.
${\sim }2\text{--}9\%$
, implying that the actual source catalogue reliability could be as low as 85% at 500 mJy beam−1.
We note the discussion in Section 4.3 about source density considerations when cross-matching S-PASS with SUMSS and NVSS. The resolution difference between S-PASS, SUMSS, and NVSS makes it difficult to disentangle whether sources are truly matched to the appropriate counterpart. One S-PASS beam can contain many SUMSS or NVSS sources, which results in a misleading cross-match. Also, some sources within SUMSS and NVSS may not be matched correctly due to imaging artefacts, high local noise levels or complex source structure, so the catalogue reliability may well be higher than calculated here. In order to provide a comprehensive reliability estimate, the issue of cross-matching with different resolution catalogues should be addressed. This would require a sophisticated algorithm, taking into account more than just simple distance between sources, such as the Positional Update and Matching Algorithm (PUMAFootnote 4 ; Line et al. Reference Line, Webster, Pindor, Mitchell and Trott2017).
5 CATALOGUE FORMAT
An example of the first 25 sources has been included in Tables 2 and 3. A description of each column in the catalogue is as follows:
-
Column (1): the S-PASS source name, formatted as SPASS_Jhhmmss ± ddmmss.
Columns (2) and (3): the J2000 RA in hh:mm:ss and the J2000 Dec in dd:mm:ss.
Columns (4) and (5): the errors in RA and Dec in arcseconds as quoted by aegean.
Columns (6) and (7): the peak flux density and associated error in Jy beam−1. Uncertainties do not include flux scaling errors.
Columns (8) and (9): the integrated flux density and associated error in Jy. Uncertainties do not include flux scaling errors.
Columns (10) and (11): the background level and local RMS value, as calculated by bane, in Jy beam−1.
Columns (12) and (13): the major axis of the fitted elliptical Gaussian and associated error in arcseconds.
Columns (14) and (15): the minor axis of the fitted elliptical Gaussian and associated error in arcseconds.
Columns (16) and (17): the position angle of the fitted elliptical Gaussian (measured East from North) and associated error in degrees.
Columns (18) and (19): the residual mean and residual standard deviation from the fitting process in Jy beam−1.
6 SUMMARY
Using S-PASS total intensity data, the first southern-sky extragalactic source catalogue at 2.3 GHz has been created, containing 23 389 radio sources.
The S-PASS source catalogue covers 16 600 deg2 of sky. The internal flux scale is reliable to within the 10% calibration uncertainty estimate. The S-PASS source spectral index distribution is consistent with a population with a median spectral index of α ≈ −0.7 and a tail of flat and inverted spectrum sources.
Typical astrometric offsets are consistent with approximately 35 arcsec, though individual source astrometric errors vary as a function of signal-to-noise. The catalogue is 95% complete at 225 mJy and is 100% complete above 1 Jy. Approximately, 94% of S-PASS sources with a peak flux density above 500 mJy beam−1 have a lower frequency counterpart. Given the difference in source densities between S-PASS and the compared catalogues, this number is difficult to correctly estimate and could be as low as 85%.
A variety of science applications are possible using the S-PASS catalogue, including source spectrum studies by cross-matching with similar all-sky surveys, such as the newly released GaLactic and Extragalactic All-sky MWA (GLEAM) survey catalogue (Wayth et al. Reference Wayth2015, Hurley-Walker et al. Reference Hurley-Walker2017) or the Planck Catalogue of Compact Sources (PCCS; Planck Collaboration et al. 2014). With a centre frequency in the range where Giga-hertz Peaked Spectrum sources (O’Dea, Baum, & Stanghellini Reference O’Dea, Baum and Stanghellini1991) are expected to exhibit a spectral turn over, S-PASS would be a valuable addition to wide-band studies of these objects (e.g. Callingham et al. Reference Callingham2015).
ACKNOWLEDGEMENTS
This work has been carried out in the framework of the S-band Polarisation All Sky Survey (S-PASS) collaboration. The Parkes radio telescope is part of the Australia Telescope National Facility, which is funded by the Commonwealth of Australia for operation as a National Facility managed by CSIRO. Parts of this research were conducted by the Australian Research Council Centre of Excellence for All-sky Astrophysics (CAASTRO), through project number CE110001020. This research has made use of the VizieR catalogue access tool, CDS, Strasbourg, France. The original description of the VizieR service was published in A&AS 143, 23. The Dunlap Institute is funded through an endowment established by the David Dunlap family and the University of Toronto. B.M.G. acknowledges the support of the Natural Sciences and Engineering Research Council of Canada (NSERC) through grant RGPIN-2015-05948, and of the Canada Research Chairs programme.