


Introduction
Basal drag provides an important resistive component in the force budget of glaciers and ice sheets, with implications for the accuracy of mass-loss projections and the dynamics of ice streams (Echelmeyer and others, Reference Echelmeyer, Harrison, Larsen and Mitchell1994; Gillet-Chaulet and others, Reference Gillet-Chaulet2012; Larour and others, Reference Larour, Seroussi, Morlighem and Rignot2012; Morlighem and others, Reference Morlighem, Seroussi, Larour and Rignot2013; Schoof and Mantelli, Reference Schoof and Mantelli2021). Basal drag is classically represented in the form of a sliding law following Weertman (Reference Weertman1957), which relates the ice–bed sliding velocity to the resulting basal drag (synonymous with basal shear stress or basal traction) through a power law with an unknown friction coefficient and exponent. Using inverse methods that rely on surface-velocity and ice-thickness observations to infer the basal friction coefficient, large spatio-temporal variations in the friction coefficient, or corresponding basal drag, have previously been inferred over ice streams in Greenland and Antarctica (e.g. Joughin and others, Reference Joughin, MacAyeal and Tulaczyk2004; Sergienko and others, Reference Sergienko, Creyts and Hindmarsh2014; Ranganathan and others, Reference Ranganathan, Minchew, Meyer and Gudmundsson2020; Maier and others, Reference Maier, Gimbert, Gillet-Chaulet and Gilbert2021).
Although ice streams flow primarily by sliding, complex basal conditions near their onset regions can lead to flow by a combination of sliding and internal deformation. Basal conditions near the onset of the largest ice stream in Greenland, the Northeast Greenland Ice Stream (NEGIS), have been extensively studied (Fahnestock and others, Reference Fahnestock, Abdalati, Joughin, Brozena and Gogineni2001; Christianson and others, Reference Christianson2014; Keisling and others, Reference Keisling2014; Beyer and others, Reference Beyer, Kleiner, Aizinger, Rückamp and Humbert2018; Franke and others, Reference Franke2021). NEGIS is notoriously challenging to reproduce in ice-flow models (Greve and Herzfeld, Reference Greve and Herzfeld2013; Rückamp and others, Reference Rückamp, Greve and Humbert2019), and its warm basal environment is likely central to its existence (Fahnestock and others, Reference Fahnestock, Abdalati, Joughin, Brozena and Gogineni2001; Smith-Johnsen and others, Reference Smith-Johnsen, de Fleurian, Schlegel, Seroussi and Nisancioglu2020). In the upstream part of NEGIS, active-source seismics and radio-echo sounding indicate the ice rests on water-saturated till, with a strong connection to the subglacial water system of its onset, and might be controlled by variations in basal friction further downstream (Christianson and others, Reference Christianson2014; Keisling and others, Reference Keisling2014; Franke and others, Reference Franke2021). In general, the basal conditions of NEGIS are rather intricate, with areas of fast flow over a rough bed downstream of smoother-bedded areas near the onset (Franke and others, Reference Franke2021). Similarly, the Ross ice streams of west Antarctic are the frequent subject of research attempting to understand the balance between driving stresses, basal drag, and lateral (shear-margin) drag in ice streams. It is believed that these ice streams are enabled by weak subglacial sediment, and that the relatively small driving stresses experienced (small slopes) are balanced by significant components of both lateral and basal drag (MacAyeal and others, Reference MacAyeal, Bindschadler and Scambos1995; Whillans and van der Veen, Reference Whillans and van der Veen1997; Hermann and Barclay, Reference Hermann and Barclay1998; Kamb, Reference Kamb2001). The relatively smooth bed and direct evidence of subglacial sediment suggest that the Ross ice streams are likely areas where friction, rather than bedrock topography, is the primary cause of sticky spots (localised increased drag). Although early studies suggested that bedrock highs are the most likely cause of sticky spots beneath these ice streams (e.g. Alley, Reference Alley1993), more recent work has focused on the connection to till strength and water availability (Anandakrishnan and Alley, Reference Anandakrishnan and Alley1997; Tulaczyk and others, Reference Tulaczyk, Kamb and Engelhardt2000).
Variations in basal drag are generally thought to be the result of variations in the subglacial water pressure, temperature at the ice–bed interface, and composition and roughness of the bed. Inversion procedures for basal properties are, however, sensitive to rheological uncertainties (e.g. Arthern and others, Reference Arthern, Hindmarsh and Williams2015); missing or approximated ice physics, as well as measurement error, can manifest itself in the inferred basal friction coefficient field. Nevertheless, inferring basal conditions by inversion is a prerequisite for modelling the transient flow of ice masses (e.g. DeConto and Pollard, Reference DeConto and Pollard2016), which cannot reproduce surface-velocity observations without such calibration.
Strong anisotropic crystal orientation fabrics are common in deep layers of ice sheets (see review in Faria and others, Reference Faria, Weikusat and Azuma2014a) and are known to introduce mechanical anisotropies (Duval and others, Reference Duval, Ashby and Anderman1983; Shoji and Langway, Reference Shoji and Langway1985, Reference Shoji and Langway1988). Numerical ice-flow modelling has shown that fabric anisotropies can affect the deformation of ice masses at large scales (Thorsteinsson and others, Reference Thorsteinsson, Waddington and Fletcher2003; Gillet-Chaulet and others, Reference Gillet-Chaulet, Gagliardini, Meyssonnier, Zwinger and Ruokolainen2006; Pettit and others, Reference Pettit, Thorsteinsson, Jacobson and Waddington2007; Martín and Gudmundsson, Reference Martín and Gudmundsson2012; Hruby and others, Reference Hruby2020). Neglecting the orientation fabric by assuming isotropic ice (Glen's flow law) might therefore lead to an incorrect basal friction field being inferred, even if the isotropic flow-rate factor, A, is jointly inferred to compensate for rheological uncertainties due to missing fabric information. If so, this has two immediate implications. First, errors in the basal friction field affect the sliding velocity and thus the vertically integrated mass flux. Simulations of the kind undertaken for mass-loss projections use present conditions to infer the basal drag as calibration for transient simulations, and errors in the basal friction field may therefore bias mass-loss projections (depending on flow regime and flow approximations). Second, attempts to relate inferred spatio-temporal variations in the friction coefficient or basal drag fields to specific subglacial conditions and processes might be obscured by the orientation fabric.
In this study, we investigate the effect of approximating ice as isotropic when inferring the basal friction coefficient field over a subglacial sticky spot and bedrock bump using the canonical method of an adjoint-based inversion. Specifically, we consider flow regimes where both basal sliding and internal deformation are non-negligible, arguably relevant near ice-stream onsets and less so for fast sliding systems (e.g. outlet regions). For this purpose, we rely on a vertical slab anisotropic ice-flow model with a Weertman sliding law and a spectral fabric model, paired with an isotropic version of the same model, to isolate the effects of fabric anisotropy on inferred subglacial conditions. We subsequently investigate whether the concerns raised over neglecting the orientation fabric can be alleviated by accounting for an equivalent isotropic enhancement factor field.
Notation
Throughout the paper, primes shall be used to denote monocrystal rheological parameters and stresses/strain rates, as opposed to non-primed variables used to denote bulk (polycrystalline) rheological parameters and stresses/strain rates. Boldface symbols denote vectors or tensors, the order of the latter being implicit by the context. Let a and b be vectors, and A and B be second-order tensors. The following products are then used: a · b = a ib i, ab = a ib j (the outer, dyadic product), A · a = A ija j, A ·· ab = A ija jb i, A · B = A ijB jk, and A ·· B = A ijB ji = tr(A · B), where summation over repeated indices is implied. The identity matrix is denoted by I, and the superscript ${\sf T}$ denotes the matrix transpose.
Anisotropic ice-flow modelling
We seek to separate the effect of fabric anisotropy from other sources of rheological uncertainty when inverting for the basal friction coefficient field using Glen's isotropic flow law. For this purpose, we perform a set of adjoint-based inversions (using Glen's law) of steady and transient states produced by an anisotropic flow law, and compare the results to the true friction coefficient field. As a frame of comparison (control) to weigh the Glen's law inversions against, we additionally carry out identical inversions using the anisotropic flow law itself. Doing so requires an anisotropic flow law that is simple enough for the inversion procedure to be feasible, yet can adequately reproduce (most) known effects that fabric anisotropy has on the directional viscosity structure of glacier ice. We find that Johnson's flow law fulfils both needs; it represents the lowest-order anisotropic extension of Glen's law at the expense of additionally accounting for a fabric-orientation vector field (m) and two directional enhancement-factor fields (E mt and E mm). We therefore begin by introducing Johnson's law and the underlying fabric model used to determine m, E mt, and E mm, which relies on a mixed Taylor–Sachs grain rheology. For the reader who is not interested in the technicalities of anisotropic ice-flow modelling, it is possible to skip to ‘Numerical experiments’, noting only the meaning of m, E mt, and E mm.
Johnson's flow law
The dominant effect of fabric anisotropy on ice flow can be modelled using the transversely isotropic rheology of Johnson (Reference Johnson1977), which approximates material (ice) parcels as axisymmetric with symmetry axis m (Fig. 1a). In the two-dimensional (2-D) case, the rotational symmetry about m reduces to a reflectional symmetry about m, and the flow law becomes (Rathmann and others, Reference Rathmann, Hvidberg, Grinsted, Lilien and Dahl-Jensen2021)


Here, τ and ${\dot {\boldsymbol \epsilon }} = ( {\boldsymbol \nabla }{\bf u} + ( {\boldsymbol \nabla }{\bf u}) ^{\mkern -1.5mu{\sf T}}) /2$ are the bulk deviatoric stress and strain rate tensors, A is the usual isotropic rate factor, and n is the power-law exponent. The bulk directional enhancement factors E mm and E mt are the strain rate enhancements for compression/extension along m and shear parallel to the plane with normal m (Fig. 1a), which follows from the forward rheology (not shown):


where t denotes any direction transverse to m, and the indices m and t indicate the tensorial components in the directions of m and t, respectively. In the limit of E mm = E mt = 1, Johnson's flow law reduces to Glen's flow law, representing isotropic ice. The enhancement-factor exponent 2/(n + 1) ensures that the components $ {\dot{\epsilon}}_{mm}$ and $ {\dot{\epsilon}}_{mt}$
 in Johnson's law, relative to those in Glen's isotropic law, are by definition $E_{mm}$
 and $E_{mt}$
 , respectively.
(a) Axisymmetric polycrystal with longitudinal (E mm), shear (E mt), and 45°-shear (E pq) bulk enhancement factors with respect to the symmetry axis m. The transverse direction, t, lies in the plane of isotropy (t⊥m), while p is oriented at 45° to m and p⊥q. (b) Monocrystal lattice composed of hexagonal cells. Three crystallographic planes are highlighted in grey, where the c-axis indicates the basal-plane normal direction. Monocrystals are modelled as a transversely isotropic material with symmetry axis c and longitudinal (E cc′) and shear (E ca′) enhancement factors with respect to c. The transverse direction, a, lies in the plane of isotropy (a⊥c).

Bulk directional enhancement factors
Calculating E mm and E mt for a local ice parcel can be regarded as a problem of forming a suitable average over the parcel (polycrystal). A popular approach is to regard polycrystals as an ensemble of interactionless monocrystals (e.g. Castelnau and Duval, Reference Castelnau and Duval1994; Svendsen and Hutter, Reference Svendsen and Hutter1996; Gödert and Hutter, Reference Gödert and Hutter1998; Thorsteinsson, Reference Thorsteinsson2001). In this case, E mm and E mt follow from the monocrystal rheology by averaging over all grain orientations. Recognising that monocrystals deform 100–1000 times easier by basal plane shear (planes with normal c) than along any other crystallographic plane (Weertman, Reference Weertman1973; Duval and others, Reference Duval, Ashby and Anderman1983), monocrystals have previously been approximated as transversely isotropic too (e.g. Meyssonnier and Philip, Reference Meyssonnier and Philip1996; Svendsen and Hutter, Reference Svendsen and Hutter1996; Staroszczyk and Gagliardini, Reference Staroszczyk and Gagliardini1999). Following previous work, we therefore model the monocrystal rheology by a three-dimensional (3-D) but linear Johnson law:

where τ′ and ${\dot {\boldsymbol \epsilon }}'$ are the microscopic deviatoric stress and strain rate tensors, A′ is an isotropic rate factor, and the enhancement factors E cc′ and E ca′ are the strain rate enhancements for compression/extension along c and shear parallel to basal planes (Fig. 1b), i.e. $\dot {\epsilon }'_{cc} = A'E_{cc}'\tau '_{cc}$
 and $\dot {\epsilon }'_{ca} = A'E_{ca}'\tau '_{ca}$
 .
.
In the simplest case, the grain-averaged rheology, $\langle {{\dot {\boldsymbol \epsilon }}'( {\boldsymbol \tau }') } \rangle$ , may be constructed by assuming a uniform stress field over the polycrystal scale equal to the bulk stress (Sachs hypothesis), that is τ′ = τ and hence $\langle {{\dot {\boldsymbol \epsilon }}'( {\boldsymbol \tau }') } \rangle = \langle {{\dot {\boldsymbol \epsilon }}'( {\boldsymbol \tau }) } \rangle$
 . The average is defined as

where ψ(θ, ϕ) is the grain number distribution in orientation space S 2, dΩ = sin(θ)dθdϕ is the infinitesimal solid angle, and $N = \int _{S^2} \psi ( \theta ,\; \phi ) {\rm d} {\Omega }$ is the total number of grains. Unless stated otherwise, $\langle {\cdot } \rangle = \langle {\cdot } \rangle _{\psi ( \theta , \phi ) }$
 is henceforth assumed implicit. Inserting Eqn (5) into Eqn (6), gives

where $\langle {{\bf c}^k} \rangle = 1/N \int _{S^2} {\bf c}^k\psi ( \theta ,\; \phi ) {\rm d} {\Omega }$ is the k-th order structure tensor. Provided with $\langle {{\dot {\boldsymbol \epsilon }}'( {\boldsymbol \tau }) } \rangle$
 , Thorsteinsson (Reference Thorsteinsson2001) suggested defining the bulk enhancement of the v–w component of ${\dot {\boldsymbol \epsilon }}$
 as (v and w being arbitrary vectors)

where $\langle {{{\dot {\boldsymbol \epsilon }}'( {\boldsymbol \tau }) }} \rangle _{{\rm const.}}$ is the average strain rate tensor of an isotropic polycrystal (ψ(θ, ϕ) = const.).
In contrast to the Sachs hypothesis, the Taylor hypothesis assumes a constant strain rate over the polycrystal scale equal to the bulk strain rate, that is ${\dot {\boldsymbol \epsilon }}' = {\dot {\boldsymbol \epsilon }}$ and hence $\langle {{\boldsymbol \tau }'( {\dot {\boldsymbol \epsilon }}') } \rangle = \langle {{\boldsymbol \tau }'( {\dot {\boldsymbol \epsilon }}) } \rangle$
 . In order to determine E vw using Taylor's hypothesis, $\langle {{\boldsymbol \tau }'( {\dot {\boldsymbol \epsilon }}) } \rangle$
 must be posed in the inverse form ${\dot {\boldsymbol \epsilon }}( \langle {{{\boldsymbol \tau }'}} \rangle )$
 , given which

The reader is referred to Appendix A on how to determine ${\dot {\boldsymbol \epsilon }}( \langle {{{\boldsymbol \tau }'}} \rangle )$ .
.
The realised stress and strain rate fields inside polycrystals are meanwhile between the two end-member cases of either field being homogeneous, although some observations and experiments (Azuma and Higashi, Reference Azuma and Higashi1985; Azuma, Reference Azuma1995) suggest that the Sachs assumption is the better approximation of the two. As an alternative to more sophisticated homogenisation schemes, such as the viscoplastic self-consistent compromise between the Sachs and Taylor assumptions (Meyssonnier and Philip, Reference Meyssonnier and Philip1996), we model E vw as a simple linear combination of the Sachs and Taylor behaviour:

where the weight α ∈ [0; 1] is taken to be a free but constant parameter. In summary, model (10) has three free parameters (E cc′, E ca′, and α) and depends on the fields ψ and τ.
Constraining the free grain parameters
E mm and E mt are by definition the bulk enhancement factors of a polycrystal when subject to bulk pure- and simple-shear stresses with respect to m and t:


where τ0 is an arbitrary stress magnitude that cancels by virtue of the division in Eqns (8) and (9), as does A′. Deformation tests conducted on ice samples with strong single-maximum fabrics (aligned c-axes) suggest that E mt ≃ 10 (Pimienta and others, Reference Pimienta, Duval and Lipenkov1987) and E mt/E pq ≃ 103 to 104 (Shoji and Langway, Reference Shoji and Langway1985, Reference Shoji and Langway1988), where E pq = E pq(τ0[pq + qp]) and ${\bf p} = ( {\bf m} + {\bf t}) /\sqrt {2}$ and ${\bf q} = ( {\bf m}-{\bf t}) /\sqrt {2}$
 (see Fig. 1a).
Figures 2a, b show the Sachs (α = 0) and Taylor (α = 1) bulk enhancement factors E mt (coloured contours), E mm (dashed black contours), and E mt/E pq (solid black contours) for a unidirectional fabric (c = m) as a function of the grain parameters E cc′ and E ca′. In line with past studies, the Sachs model is limited in how strong E mt can become, and the Taylor model in how strong E mm can become (see Gillet-Chaulet and others (Reference Gillet-Chaulet, Gagliardini, Meyssonnier, Montagnat and Castelnau2005) and references therein). Following Gillet-Chaulet and others (Reference Gillet-Chaulet, Gagliardini, Meyssonnier, Montagnat and Castelnau2005) by setting E cc′ = 1 (grains are equally hard to compress along c and a), Fig. 2c shows the resulting bulk enhancements as a function of E ca′ and α. On setting (E cc′, E ca′, α) = (1, 103, 0.0125), the model (10) is able to reproduce the experimentally determined bulk enhancements mentioned above, which implies E mm = 10−2. Note that small values of α are consistent with the Sachs hypothesis being approximately true (at least as far as mechanical strength of polycrystals is concerned).
Bulk enhancement factors E mt (coloured contours), E mm (dashed contours), and E mt/E pq (solid contours) for a unidirectional orientation fabric (c = m) as a function of the grain enhancement factors E cc′ and E ca′ in the case of (a) the Sachs model, (b) the Taylor model, and (c) a linear combination of the Sachs and Taylor models depending on α (assuming grains are equally hard to compress along c and a, implying E cc′ = 1). The cross in panel c indicates the grain parameters used to model the bulk enhancement factors in our ice-flow simulations. Note the colourbar scale is linear in panel a, as opposed to in panel b and panel c, because E mt varies less in the Sachs model (see main text).

We mention in passing that the rheology of monocrystals has experimentally been found to follow a power law with an orientation-dependent non-linear viscosity (Kamb, Reference Kamb1961; Duval and others, Reference Duval, Ashby and Anderman1983). If the linear-viscous grain rheology (5) is assumed, bulk enhancements can be up to an order of magnitude weaker for intermediate-to-strong fabrics in the Sachs limit (8) (Rathmann and others, Reference Rathmann, Hvidberg, Grinsted, Lilien and Dahl-Jensen2021). By including the α-weighted Taylor contribution, the linear-viscous model (10) reproduces the experimentally derived bulk enhancements for strong fabrics (which neither the Sachs nor Taylor model can accomplish alone), and thus is taken to suffice for our purpose although it might too deviate from the non-linear values for intermediate-strength fabrics.
Fabric evolution
Simulating the flow of anisotropic ice requires solving a coupled time-dependent problem involving the velocity and fabric fields, u(x, t) and ψ(x, t, θ, ϕ). Under cold and low-stress conditions, the orientation fabric of an ice parcel is predominantly a function of its strain history (Alley, Reference Alley1988). That is, the strain-induced rotation of c-axes, or lattice rotation, accounts for the tendency of grain c-axes to rotate towards the compressive axis and away from the extensional axis (Azuma and Higashi, Reference Azuma and Higashi1985; van der Veen and Whillans, Reference van der Veen and Whillans1994), consistent with ice cores drilled at cold, low strain rate locations (Faria and others, Reference Faria, Weikusat and Azuma2014b). Under warm (typically − 10 °C or above) and high-stress conditions, however, the orientation fabric is, instead, predominantly a function of dynamic recrystallisation processes that depend on the in situ stress state (Duval and Castelnau, Reference Duval and Castelnau1995). In this case, grains nucleate in regions of high-lattice distortion, which is a process considered to work in conjunction with migration recrystallisation for explaining the recovery of distorted lattices; that is, newly formed strain-free nuclei grow at the expense of consuming older, more strained grains (De La Chapelle and others, Reference De La Chapelle, Castelnau, Lipenkov and Duval1998). Because grains nucleate with c-axis orientations favourable for deformation by basal glide (Kamb, Reference Kamb1972), the resulting fabrics can differ considerably from those produced by lattice rotation alone (Alley, Reference Alley1992), and hence possibly change the local directional viscosity structure resulting from lattice rotation.
In our ice-flow model, we consider non-negligible sliding at the ice–bed interface, which is commonly associated with relatively warm near-bed temperatures. For this reason, we investigate both end-member cases where fabric evolution is dominated by either lattice rotation or dynamic recrystallisation near the bed. Polygonisation is neglected throughout; a recrystallisation process which accounts for the division of grains along internal sub-grain boundaries when exposed to bending stresses (Alley and others, Reference Alley, Gow and Meese1995). In effect, polygonisation reduces the average grain size upon grain division but does not necessarily change the orientation fabric much (Alley, Reference Alley1992). Strictly speaking, we therefore consider only discontinuous dynamic recrystallisation (DDRX), understood as the combined effect of nucleation and migration recrystallisation.
Lattice rotation
We model lattice rotation using our spectral fabric model (Rathmann and others, Reference Rathmann, Hvidberg, Grinsted, Lilien and Dahl-Jensen2021). The model is a kinematic model in the sense that c-axes rotate in response to the bulk stretching, ${\dot {\boldsymbol \epsilon }}$ , and spin, ${\boldsymbol \omega } = ( {\boldsymbol \nabla }{\bf u}-( {\boldsymbol \nabla }{\bf u}) ^{\mkern -1.5mu{\sf T}}) /2$
 , thereby allowing the detailed microscopic stress and strain rate fields to be neglected and hence interactions between neighbouring grains to be disregarded. By moreover requiring that basal planes preserve their orientation when subject to simple shear (like a deck of cards), the rotation of an arbitrary c-axis c = c(θ, ϕ) = [sin(θ)cos(ϕ), sin(θ)sin(ϕ), cos(θ)] is modelled as (Castelnau and others, Reference Castelnau, Duval, Lebensohn and Canova1996; Svendsen and Hutter, Reference Svendsen and Hutter1996; Gödert and Hutter, Reference Gödert and Hutter1998)

The corresponding effect on the (continuous) number distribution, ψ, is modelled as a conservative advection process on S 2 involving the c-axis velocity field $\dot {{\bf c}}( \theta ,\; \phi )$ (Gödert and Hutter, Reference Gödert and Hutter1998):

where D/Dt is the material derivative, and the divergence operator acts on S 2.
Note that existing fabric models that focus on the time evolution of $\langle {{\bf c}^2} \rangle$ (effectively a low-order representation of ψ) have previously found a kinematic approach to be sufficient for reproducing observed fabric eigenvalue trends in ice cores (Gillet-Chaulet and others, Reference Gillet-Chaulet, Gagliardini, Meyssonnier, Zwinger and Ruokolainen2006; Durand and others, Reference Durand2007; Martín and others, Reference Martín, Gudmundsson, Pritchard and Gagliardini2009), a result that our model reproduces for the GRIP ice-core fabric (Thorsteinsson and others, Reference Thorsteinsson, Kipfstuhl and Miller1997) (not shown).
Dynamic recrystallisation
We model DDRX (nucleation and migration recrystallisation) as a single, spontaneous decay process on S 2 following Placidi and others (Reference Placidi, Greve, Seddik and Faria2010):
 $${{\rm D} \psi\over {\rm D} t} = \Gamma \psi ,\; $$
where Γ = Γ(θ, ϕ) is the orientation decay rate. In this way, the orientation density increases locally on S 2 where Γ(θ, ϕ) > 0, and decreases where Γ(θ, ϕ) < 0.
The c-axes of nucleated grains tend to align with the direction that maximises the resolved basal plane shear stress, τ · c − (τ ·· cc)c, thus favouring deformation by basal glide. Placidi and others (Reference Placidi, Greve, Seddik and Faria2010) proposed that

where Γ0 is a DDRX rate factor that depends on the local temperature, dislocation density, and stress state. The deformability, D, is the normalised square of the resolved shear stress

which is strictly positive. The average deformability, 〈D〉, provides a threshold for the deformability, D, below which orientations decay, and above which are produced. Formally speaking, 〈D〉 is a Lagrange multiplier that ensures the total number of grains, $N = \int _{S^2} \psi \, {\rm d} {\Omega }$ , is conserved, which follows directly from calculating the material derivative

In reality, however, it is the total mass that is conserved, not N. Nonetheless, in the absence of more sophisticated models, Eqn (16) provides a useful model to explore the major effect of DDRX, here understood as the orientation-dependent nucleation and consumption of grains as a function of τ.
For reference, the decay rate Eqn (16) is plotted in Fig. 3 in the case of unconfined uniaxial compression along ${\hat {\bf z}}$ (panel a), uniaxial compression along ${\hat {\bf x}}$
 with extension confined to ${\hat {\bf z}}$
 (panel b), and simple ${\hat {\bf x}}$
 –${\hat {\bf z}}$
 shear (panel c). Note that Γ depends on the instantaneous value of ψ by virtue of 〈D〉, which was taken to be isotropic in Fig. 3. Red and blue colours indicate the directions for which orientations are produced (grain nucleates) and decay (grains consumed), respectively. Although the case of unconfined uniaxial compression (Fig. 3a) is relevant for the stress regimes found near ice domes, the latter cases of confined compression and vertical shear are relevant for the stress regimes realised in our ice-flow simulations.
Orientation decay rate functions for DDRX in the case of unconfined uniaxial compression along ${\hat {\bf z}}$ (a), uniaxial compression along ${\hat {\bf x}}$
 with extension confined to ${\hat {\bf z}}$
 (b), and simple ${\hat {\bf x}}$
 –${\hat {\bf z}}$
 shear (c). Positive (red) and negative (blue) areas indicate the directions for which orientations are produced (grain nucleates) and decay (grains consumed), respectively.

Representation
We represent the grain number distribution by a series expansion in spherical harmonic functions, $Y_{l}^{m}( \theta ,\; \phi )$ :
:

where the expansion coefficients, $\psi ^{m}_{l}$ , constitute the fabric model unknowns (degrees of freedom), and L is the wave-mode truncation above which finer-scale structure in ψ is unresolved. We defer the reader to the Appendix for further details on how lattice rotation and DDRX affect the time-evolution of $\psi ^{m}_{l}$
 .
.
We end by noting that for expansion (19), the entries of the structure tensors $\langle {{\bf c}^2} \rangle$ and $\langle {{\bf c}^4} \rangle$
 – required to calculate E mm and E mt – are given by linear combinations of $\psi ^{m}_{l}$
 for l ≤ 4 (Advani and Tucker, Reference Advani and Tucker1987; Rathmann and others, Reference Rathmann, Hvidberg, Grinsted, Lilien and Dahl-Jensen2021).
Numerical experiments
We are interested in the extent to which the true basal drag or friction coefficient field can be inferred by an inversion procedure if ice is assumed isotropic when in fact it is not. For this purpose, we consider two idealised vertical slab models that are 40 k m long and 2 k m tall, placed on a 0.3° inclined plane (approximately the surface slope over the Northeast Greenland Ice Stream) with periodic left–right boundaries.
Both models are subject to a Weertman sliding law along the basal boundary, Γb:

where ${\bf t}_{{\rm b}} = {\boldsymbol \sigma }\,{\boldsymbol \cdot }\,{\hat {\bf n}} - ( {\boldsymbol \sigma }\,{\boldsymbol \cdot } {\boldsymbol \cdot } \, {\hat {\bf n}}{\hat {\bf n}}) {\hat {\bf n}}$ is the basal shear stress, ub is the basal sliding velocity, f = f(x) is the square root of the friction-coefficient field, m is the sliding-law exponent, and ${\hat {\bf n}}$
 and ${\hat {\bf r}}$
 are the boundary normal and tangential directions, respectively. No melting is assumed at the ice–bed boundary and therefore ${\bf u}_{{\rm b}} \parallel {\hat {\bf r}}$
 . We considered both linear sliding, m = 1, and non-linear hard-bedded sliding, m = 3. However, because the resulting fabric development is largely the same (not shown, discussed below), we focus on the results for m = 1. Whether fabric evolves similarly in the Coulomb-plastic limit, which recent work has shown to be relevant for weak beds such as deformable till (Joughin and others, Reference Joughin, Smith and Schoof2019) and perhaps for hard beds (Zoet and Iverson, Reference Zoet and Iverson2020), was not considered. On that note, we re-emphasise that our study is concerned with flow regimes where both sliding and internal deformation are non-negligible. In the case of e.g. fast-sliding ice streams and marine outlets, the sliding is likely affected by the effective pressure at the bed (e.g. Brondex and others, Reference Brondex, Gillet-Chaulet and Gagliardini2019), and the possibility of reduced shear stresses/strains (increased longitudinal stresses/strains) due to sliding may cause fabric development different from that reported here.
The free-surface height, s(x, t), is allowed to evolve the usual way according to the local mass convergence (no accumulation or melting assumed)

where $u_x^{{\rm s}} = u_x( x,\; \, s( x,\; \, t) )$ and $u_z^{{\rm s}} = u_z( x,\; \, s( x,\; \, t) )$
 are the surface velocity components.
The first model (Fig. 4a) investigates the effect of a sticky spot, defined as a local increase in the friction coefficient (strictly speaking a flow-transverse sticky line). Specifically, we consider a sticky spot on a flat bed, given by the centred Gaussian profile

where the peak value, $f^2_1$ , is taken to be 100 times that of the surrounding constant background value of $f^2_0 = 5\times 10^{10}\, {\rm Pa}\, {\rm s}\, {\rm m}^{-1}$
 . The value of $f^2_0$
 was selected to allow for moderate sliding on the order of 20 % of the modelled surface velocities, although a larger and smaller sliding ratios was also considered (see ‘Discussion’). The second model (Fig. 4b) investigates the effect of a bed bump (strictly speaking a lateral ridge) with an amplitude of b 1 = 200 m (10% of the ice thickness), given by the centred Gaussian bed profile

but with a uniform friction coefficient of $f^2( x) = f^2_0$ . In both models, wider asperities where also considered (see ‘Discussion’).
Ice-flow model configuration and boundary conditions used in the (a) sticky spot and (b) bed bump numerical experiments.

The rate of DDRX, Γ0, depends in principle on the local temperature, dislocation density, and stress state. Although Richards and others (Reference Richards, Pegler, Piazolo and Harlen2021) recently explored possible functional forms of Γ0, we shall, for simplicity, consider the two cases where fabric evolution is dominated near the bed by either lattice rotation or DDRX. Specifically, one experiment assumes lattice rotation without DDRX by setting Γ0 = 0, while the other assumes lattice rotation with active DDRX by setting

taken to represent gradually warming ice between z = H Γ and z = 0 (the bed). Indeed, within a temperature range of − 30 to − 5 °C, Richards and others (Reference Richards, Pegler, Piazolo and Harlen2021) found that Γ0 depends approximately linearly on temperature. Here, we set H Γ = 2000 m/3 to confine DDRX to the lower third of the ice mass. Note that Γ0 simply sets the DDRX timescale, representing the relative strength of DDRX to lattice rotation in our model. With Eqn (24), the fabric evolves and saturates ~5 times faster in our simulations compared to when lattice rotation acts alone, and DDRX is therefore regarded to be the dominant process.
In summary, four forward experiments are considered, consisting of two kinds of model geometries (Fig. 4) in which DDRX is either negligible or dominant in the lower third of the ice mass.
Forward simulations
The full Stokes momentum balance was solved for all four forward models using Johnson's flow law with n = 3 and A = 3.5 × 10⁻²⁵ s−1 Pa−3 (corresponding to isothermal ice at ~− 10 °C) until a steady fabric state was reached, taking approximately 100 a and 500 a with and without DDRX, respectively. Although real temperature distributions in glaciers and ice sheets are not isothermal, our aim is to investigate (in isolation) the effect of mechanical anisotropies induced by fabric, whereas temperature heterogeneities affect the viscosity isotropically through the flow-rate factor A = A(T). Insofar as the temperature is high enough to affect the rate of DDRX, temperature can indirectly induce mechanical anisotropies, which Eqn (24) attempts to represent (albeit rather simplistically without a thermal coupling).
The fabric fields were initialised uniformly to match the GRIP surface state (not shown), corresponding to a weak vertical single maximum. In the upper 30 % of the model domains, the (initial) fabric field was held fixed throughout time. In addition to ensuring that ice is approximately isotropic at the surface, this fabric slab boundary condition allows for the fabric to reach steady state much faster than without; weak shear strain rates in the near-surface cause fabric to develop much slower than below. Note, however, that this choice does not affect the steady-state fabric solution below, nor does it affect our conclusions.
The momentum balance, surface evolution, and fabric evolution were solved using a backward Euler (implicit) time-stepping scheme with a step size of Δt = 0.5 a, a Taylor–Hood finite-element discretisation of position space on a structured triangular mesh with a grid size of (Δx, Δz) = (600 m, 120 m) refined to (Δx, Δz) = (200 m, 60 m) within 15 km ≤ x ≤ 25 km and 0 km ≤ y ≤ 1 km, and a spectral discretisation of orientation space truncated at L = 10. For L = 10, the regularisation selected in orientation-space (see Appendix C) is 30 times stronger for modes $\psi ^{m}_{l}$ with l = 10 compared to l = 4, thereby significantly reducing the effect of regularisation on the modes that E mt and E mm depend upon (l ≤ 4). The truncation implies a 66-dimensional linear advection–reaction–diffusion problem must be solved per computational node in order to evolve the fabric field. In terms of traditional structure-tensor-based fabric models, L = 10 corresponds to simulating all even-ordered structure tensors through order ten. The entire system was solved using FEniCS (Logg and others, Reference Logg, Mardal and Wells2012), relying on Newton's method to solve the non-linear momentum balance. The Jacobian of the residual form (required for Newton iterations) was calculated using the unified form language (UFL) (Alnæs and others, Reference Alnæs, Logg, Ølgaard, Rognes and Wells2014), used by FEniCS to specify weak forms, which supports automatic symbolic differentiation. The weak forms are presented in Appendix C.
Inversions
Basal friction
Selecting the four Johnson steady states as the ‘true’ states, we attempt to invert for f(x) using Glen's flow law and compare the results to the true friction fields, and to results obtained from inversions using Johnson's flow law (the ‘true’ rheology). All remaining parts of the problem are assumed perfectly known (bedrock height, surface height, surface velocities, and the fabric field).
We emphasise that inverting for f using Johnson's flow law is only feasible for synthetic experiments, and not in practice, since the true fabric state is generally unknown for real glaciers where inversions are performed. Our aim is, however, to assess the type of error introduced by assuming fabric isotropy by virtue of Glen's flow law, which the comparison allows. In this way, re-inferring f with Johnson's law serves as a best-case scenario with which to compare the Glen-based inversions (elaborated on below). If Johnson's flow law is to be used for inversions over real glaciers, a more formal investigation is needed to clarify the effects that imperfect knowledge of fabric, bed and surface profiles, and surface velocities have.
We invert for f(x) using the canonical method by MacAyeal (Reference MacAyeal1993) and Joughin and others (Reference Joughin, MacAyeal and Tulaczyk2004) of reducing the surface-velocity misfit by minimising an appropriate cost functional. Following ice-flow models such as Úa (Gudmundsson and others, Reference Gudmundsson, Krug, Durand, Favier and Gagliardini2012; Ranganathan and others, Reference Ranganathan, Minchew, Meyer and Gudmundsson2020), we adopt the cost functional

which penalises both the surface-velocity misfit and large gradients in f 2, the former depending on the surface velocity uncertainties as prescribed by diagonal matrix β, the latter depending on the magnitude of the regularisation parameter γf. Note that the ‘true’ velocity field is well-defined only for our synthetic experiments (taken to be the Johnson states), whereas for real inversions it is to be replaced by the observed velocity field. Since the true surface velocities are in fact known in synthetic experiments, β = diag(1, 1) is arguably an appropriate choice. In the interest of being as generous as possible to Glen's flow law, we find, however, that signal-to-noise ratios in inferred f 2 are improved if vertical velocity errors are not penalised, i.e. β = diag(1, 0). This choice is standard for inversions conducted over real glaciers and ice sheets (e.g. Morlighem and others, Reference Morlighem, Seroussi, Larour and Rignot2013), since often only horizontal velocities are available from satellite observations (e.g. Joughin and others, Reference Joughin, Smith and Howat2018). The conclusions drawn from the inferred f fields are effectively unchanged by this choice.
The problem of determining f such that J(u(f), f) is (locally) minimised was solved following a Newton conjugate gradient descent with a strong Wolfe line search. The cost functional gradient was evaluated with the adjoint-state method using dolfin-adjoint (Mitusch and others, Reference Mitusch, Funke and Dokken2019), a library which allows the adjoint equation to be derived and solved automatically for each gradient evaluation given a forward model in FEniCS.
All inversions were carried out with an initial guess of $f^2( x) = f_0^2 / 10$ . As a stopping criterion we selected a relative change in the cost functional between two consecutive Newton steps of <10−3 (beyond which further iterations provided negligible improvement), requiring up to 23 iterations depending on regularisation.
Isotropic enhancement factor
In addition to fabric anisotropy, the viscosity of glacier ice can locally be affected by e.g. ice temperature anomalies and impurities. Recognising this, some state-of-the-art parameter inversion in glaciology is concerned with jointly inferring both f 2 (or the equivalent thereof) and the flow-rate factor A (see e.g. Arthern, Reference Arthern2015; Isaac and others, Reference Isaac, Petra, Stadler and Ghattas2015; Ranganathan and others, Reference Ranganathan, Minchew, Meyer and Gudmundsson2020). Without doing so, errors in the prescribed rate-factor field will manifest themselves in the inferred friction coefficient field (e.g. Arthern and others, Reference Arthern, Hindmarsh and Williams2015). However, since both f and A affect the surface velocity, without additional constraints this problem is generally underdetermined even for depth-averaged models where only one viscosity needs to be determined at each point in horizontal space.
Inferring A is clearly appropriate to account for isotropic flow-rate enhancements, such as those caused by temperature and impurity heterogeneities. The enhancements due to fabric are however inherently anisotropic, and the ability to represent these by inferring a (single) scalar field is less clear. For this reason, we additionally consider the possibility of isotropically compensating for fabric anisotropy by including an enhancement factor, E(x, y), inspired by Gagliardini and others (Reference Gagliardini2013) and the CAFFE model (Placidi and others, Reference Placidi, Greve, Seddik and Faria2010). That is, by setting

can E(x, y) be inferred such that Glen's law reproduces the true (observed) surface velocities given the true basal friction, f 2? If so, it would indicate that it is possible to isotropically infer the effect of fabric (e.g. when inferring the rate factor of ice shelves), and suggest that that jointly inferring f and A could recover (some) fabric effects, given that the underdeterminedness can be overcome.
Unless carefully posed, inferring E is an underdetermined problem for our non-depth-averaged model even when f is known: the field E(x, y) is to be constrained given only the resulting surface velocities, but surface velocities may increase if any horizontal layer within is enhanced (E > 1). We therefore propose inferring E by minimising the cost functional

where the first term penalises the surface-velocity misfit (identically to Eqn (25)), the second term is a depth-dependent penalisation of deviations from isotropy (E ≠ 1), where the total (integrated) penalty is weighted by γE, and the third term penalises large gradients in u x along the surface depending on the regularisation parameter γu. In this way, the purpose of the weight w(z) is to constrain deviations from isotropy to occur primarily at depth where fabric anisotropy is presumably strongest. For our purpose, we set

which monotonically penalises anisotropy towards the surface ten times more than at the bed. A linearly increasing weight was also found to suffice, although convergence proved slower. The regularisation term (last term) in Eqn (27) leads to smoother and less noisy solutions for E. Although directly penalising gradients in E would have the same effect, the proposed regularisation was found to produce a faster and more reliable convergence.
The cost functional (27) was minimised using the same method as described above for Eqn (25). Inversions were carried out with an uniform initial guess of E = 1 (isotropy), and the free parameters were set to γE = 5 × 10⁻¹⁸ and γu = 5 × 10⁶ . The parameter values were chosen such that the surface-velocity misfit was reasonable without over-fitting E: by further decreasing γu, E becomes noisy, and by increasing γE the cost of introducing anisotropy (E ≠ 1) becomes too large to reduce the surface-velocity misfit. Although other parameter combinations are possible, the present values suffice for demonstrating that inverting for $E_{{\rm }}$ is feasible, at least under fairly strong assumptions about the depths at which fabric affects the flow.
Results
Forward steady states
The forward steady states are shown in Figs 5, 6 in the case of lattice rotation without and with DDRX, respectively. Panels a1–c1 (left-hand column) and a2–c2 (right-hand column) show the results for the sticky spot (sticky line) and bed bump (lateral ridge) model, respectively. Panels a1 and a2 show the resulting steady-state flow speed (true friction field given) of the Johnson flow law, relative to that produced by Glen's law interpolated onto the same grid. Panels b1 and b2 show the ratio of x–z shear enhancement to x–x longitudinal (compressional/extensional) enhancement caused by the fabric. Panels c1 and c2 show the symmetry-axis vector field m (black arrows) and the associated eigenvalues a m (contours). Because the fabric field consists everywhere of a single-maximum in all four simulations, m is identical to the largest eigenvalue direction, which approximately coincides with the vertical direction. Hence, ${\bf m}\simeq {\hat {\bf z}}$ and therefore E mt ≃ E xz and E mm ≃ E xx. For reference, panels d1–e1 and d2–e2 show the corresponding orientation distribution functions, ψ(θ, ϕ)/N, at the near-bed locations marked in panels c1 and c2 (note the subtle differences on close inspection).
Steady states of the sticky spot model (a1–e1) and the bed bump model (a2–e2) without DDRX. Panels a1 and a2 show the steady-state flow speed of the (forward) Johnson flow law, relative to that produced by Glen's law, given the true friction field, f. Panels b1 and b2 show the ratio of x–z shear enhancement to x–x compressional/extensional enhancement caused by the fabric. Panels c1 and c2 show the symmetry-axis vector field m (arrows) and associated eigenvalues a m (contours). Panels d1, e1 and d2, e2 show the orientation distribution functions ψ(θ, ϕ)/N at the locations marked in panels c1 and c2, respectively.

Steady states of the sticky spot model (a1–e1) and the bed bump model (a2–e2) with DDRX. See Fig. 5 for shared descriptions.

The results without DDRX show that the orientation fabric develops over the sticky spot in such a way as to locally enhance deformation by shear and oppose longitudinal deformation (large E xz/E xx ratio in Fig. 5b1), resulting in significant horizontal gradients in the flow speed modelled by Johnson's law compared to (divided by) Glen's law (Fig. 5a1). Although the ratio E xz/E xx is weakened over the sticky spot when DDRX is active (Fig. 6b1), the resulting relative flow speed pattern over the asperity is unchanged (Fig. 6a1). That is, ice flows much faster over the sticky spot if fabric anisotropy is accounted for, both with and without DDRX. The E xz/E xx ratio is similarly large over the bed bump peak (Figs 5b2, 6b2), but the resulting relative speed (Figs 5a2, 6a2) does not indicate a large speed-up due to fabric, suggesting that any speed-up experienced as ice passes over the bump is to first-order well-captured by Glen's law. This is, however, not to say that fabric anisotropy is unimportant: fabric anisotropy still causes gradients in the (relative) surface speed, to which an inversion is sensitive.
Note that with the regularisation selected in orientation space, steady-state eigenvalues saturate ~0.9–0.95 (panels c1 and c2), and the magnitude of E mt and E mm (and hence E xz/E xx) that can be achieved is therefore limited.
Inversions
Basal friction
Figures 7a1, a2 show the inferred profiles of f 2(x) using Glen's (blue lines) and Johnson's (red lines) flow law compared to the true profile (black line) for the sticky spot and bed bump model, respectively. Without affecting conclusions, Fig. 7 shows only the results from inverting the DDRX-active simulations. To estimate the sensitivity of our results to the choice of γf, each inversion was carried out for a small ensemble of γf (see Fig. 7 legends). The corresponding basal drag (tb) and horizontal surface velocity component ($u_x^{{\rm s}}$ ) are shown in panels b1, b2 and c1, c2, respectively. Panels d1 and d2 show the corresponding vertically integrated mass fluxes and are treated later in the ‘Discussion’.
Inverted sliding-law friction coefficients (a1 and a2), resulting basal drag (b1 and b2), resulting horizontal surface velocity component (c1 and c2), and resulting vertically integrated horizontal mass fluxes (d1 and d2). Left- and right-hand panels show the results for the sticky spot and bed bump model, respectively. Red and blue lines denote inversions using Johnson's and Glen's flow law, respectively, carried out for different strengths of regularisation (lighter/darker lines).

The results show that f 2 is underestimated if inverted for with Glen's law (blue lines compared to black in Figs 7a1, a2), whereas the true f 2 can be recovered if the (true) Johnson flow law is used, depending on the amount of regularisation. Of course, the Glen-based inversions can, without further ado, be evaluated by comparing with the true value of f 2. The purpose of including the Johnson-based inversions is simply to characterise the degree of regularisation (smoothing) that the Glen-based inversions are subject to; the Johnson-based inversions represent best-case scenarios for the Glen-based inversions. Note that in both models, the background value of f 2 (the equivalent of $f^2_0$ ) is not constant when inferred using Glen's law. This carries over to the resulting basal drag, too (Figs 7b1, b2).
Given the small surface-velocity misfit (Figs 7c1, c2), the discrepancies between the Johnson- and Glen-based inversions may be attributed to the effect of fabric anisotropy and are treated in the ‘Discussion’.
Isotropic enhancement factor
Figures 8a, b show the inferred isotropic enhancement factor field, $E_{{\rm }}$ , for the sticky spot and bed bump experiments with DDRX, respectively. Similar results are found for the lattice-rotation-only experiments. The inferred patterns conform with the softening suggested by the anisotropic enhancement factors and the relative flow speeds in Fig. 6. By dividing the shear $\dot {\epsilon }_{xz}( {\boldsymbol \tau } = \tau _0( {\hat {\bf x}}{\hat {\bf z}} + {\hat {\bf z}}{\hat {\bf x}}) )$
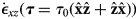 and the longitudinal $\dot {\epsilon }_{xx}( {\boldsymbol \tau } = \tau _0({\bf I}/2-{\hat {\bf x}}{\hat {\bf x}}) )$
 strain rates resulting from Glen's law ($E_{{\rm }}$
 given) with those produced by Johnson's law (true fabric state given), we find that $E_{{\rm }}$
 to first-order captures the effective shear-strain rate enhancement (Figs 8c, d) at the expense of producing too soft ice when subject to longitudinal stresses (Figs 8e, f).
Inferred equivalent isotropic enhancement factor, $E_{{\rm }}( x,\; \, y)$ , for the sticky spot (a) and bed bump (b) model with DDRX. The shear and longitudinal strain rates resulting from Glen's law ($E_{{\rm }}$
 given) divided by those produced by Johnson's law (true fabric state given) are shown in panels c, d and e, f, respectively, for diagnostic shear and longitudinal stress states (see main text). Panel g shows the resulting horizontal surface velocity components (solid lines) compared to the true profiles (dashed lines). Panel h shows the corresponding vertically integrated mass flux profiles relative to the true profiles.

Figures 8g, h show the resulting horizontal surface-velocity profiles and vertically integrated mass fluxes, respectively. Although the surface velocity peaks are less well-captured (due to regularisation) compared to when inferring f alone, the resulting mass-flux errors are comparatively reduced.
Discussion
Our results suggest that the orientation fabric may evolve locally over a sticky spot to enhance ice for shear deformation to such an extent that the sticky spot may be difficult to infer by inverting for f using Glen's flow law (Fig. 7a1). Although not completely hidden, the peak-to-bottom value of f 2 is much reduced compared to the reference inversions based on Johnson's law. In practice, however, we speculate that real inversions for f in the presence of noisy input fields might make it difficult to discern whether a sticky spot exists at all using Glen's law. This is not to say that Johnson's law is a preferable choice for real inversions (let alone practical), or that other uncertainties are of less concern, such as temperature uncertainties or the limited obtainable resolution by self-adjoint methods in the presence of noise (Martin and Monnier, Reference Martin and Monnier2014), but rather that fabric might additionally obscure interpretations. The resulting basal drag over the asperity is, however, comparable to that inferred using Johnson's law (Fig. 7b1), although noise and the non-constant background drag inferred using Glen's law might in practice also obscure interpretations.
In the case of the bed bump model (Fig. 7a2), inferring f using Glen's law results in a slippery spot at the bump peak where there is none (with a magnitude sensitive to the amount of regularisation chosen, as indicated by the lighter blue lines), and relative sticky flanks. The corresponding basal drag (Fig. 7b2) leads to the same conclusion.
Given these results, we conjecture that a sticky spot might generally cause the orientation fabric to evolve in such a way as to oppose the effect of the sticky spot, and that a bed bump might cause the orientation fabric to evolve in such a way as to make it incorrectly appear slippery on top and sticky on the flanks, thus dampening the effect of the bump. Indeed, when inferring the corresponding isotropic enhancement factor fields (Figs 8a, b), an isotropic softening is found in the aforementioned areas. Note that the inferred isotropic enhancements are locally >5, corresponding in magnitude to temperature anomalies of ~5–10 °C depending on activation energy.
Mass-flux estimates
The difference in background values of f 2 between the Johnson and Glen inversions are expected given the fabric field: from the point of view of the surface velocity field, a uniformly shear-enhanced layer (due to fabric) will have the same effect as uniformly decreasing f 2. If one is interested in inferring anomalies in f 2 compared to a background value (given the above caveat), this is possibly of little concern. On the contrary, care must be exercised when calculating vertically integrated mass fluxes because assuming Glen's law might lead to more sliding being inferred than is actually the case (too small f 2). The vertically integrated horizontal mass flux is by definition

If f is inferred with A given, Figs 7d1, d2 show that assuming isotropic ice (Glen's law) in our 2-D models leads to Φ being overestimated by ~$10\, \!\percnt$ (compared to the true flux). If, on the other hand, $E_{{\rm }}$
 (or A) is inferred with f given, the corresponding mass-flux error is reduced to ~2–$3\, \!\percnt$
 (Fig. 8h). Note that the non-constant fluxes in the Glen-based inversions suggested non-zero emergence velocities (recall we constrain only the horizontal surface-velocity component). Although surface relaxation is often resorted to get rid of the incompatible kinematic free-surface boundary condition (e.g. Zhao and others, Reference Zhao2018), here it is sufficiently clear that the average fluxes are larger than the true fluxes.
Unless flow approximations are adopted for real ice masses that alleviate the mass-flux errors due to neglecting fabric, our results support jointly inferring f and A as a way to reduce mass-flux errors caused by missing fabric information, if inversion procedures can be constructed to overcome the increased underdeterminedness of joint inversions. Further research is needed to determine how exactly this affects mass-loss projections; while our results suggest that the present-day mass flux might be overestimated if only f is inferred (depending on flow approximation), the change in response to a climatic perturbation is not clear. Nor is it clear how these mass-flux errors translate to more realistic 3-D models where asperities are compactly defined, or to what extent it is possible to isotropically compensate for fabric in the popular vertically integrated ‘block flow’ or shallow shelf approximation (ideal limit of no internal deformation, a popular approximation for ice streams and fast-flowing outlet glaciers).
It is important to emphasise that the stress balance does not change by accounting for fabric anisotropy. Rather, the rate-of-deformation is (directionally) enhanced for given stress. In the block-flow approximation, vertical shear is taken to be negligible even when favoured by the orientation fabric. If, however, shear-enhanced layers due to fabric are in fact common, internal deformation may be more relevant in ice streams than isotropic models indicate, perhaps calling into question the assumption of block flow in some parts of ice streams. Observations of orientation fabrics in ice streams have found horizontal (or partially horizontal) girdle patterns, thought to be a signature of significant extensional flow (Smith and others, Reference Smith2017) in agreement with Alley (Reference Alley1992). This should, in principle, harden the ice for further extension. Although our model setup cannot produce that kind of extensional/compressional flow regime, it is (arguably) not settled to what extent ice streams and fast-flowing outlet glaciers can be approximated as ideal block flows throughout.
Caveats
At this point, several caveats are in order. For simplicity, a 2-D ice mass was considered, but it is not clear whether our results carry over to a more realistic 3-D model. It is possible that the identified effects are much more localised and less important in 3-D models. On the other hand, the 2-D scenarios considered here allow for the greatest chance of inferring the true basal friction field, since introducing greater complexity with a 3-D model should only make inferring f more difficult (not to mention A).
Related to the model realism, it is not clear how the DDRX rate factor, Γ0, functionally depends on temperature, stress, strain rate, and dislocation density, although Richards and others (Reference Richards, Pegler, Piazolo and Harlen2021) has taken first steps to address this. Fabrics generally evolve differently in recrystallisation-dominated regimes compared to regimes where lattice rotation acts alone, not least if temperature is allowed to evolve (setting up a thermal–fabric feedback). However, as long as vertical shear stresses are dominant, such as in our model simulations, the corresponding orientation decay rate (Fig. 3c) indicates that any strain-induced vertical single-maximum fabric should be reinforced by DDRX regardless of Γ0. Put differently, unless compressional (extensional) stresses before (after) the sticky spot or bed bump are sufficiently large, the contribution to the decay rate from compressional (extensional) stress regimes (Fig. 3b) is subordinate. This could explain why our results are similar both with and without DDRX. Moreover, if vertical shear is dominant, this might partly explain why only minor fabric changes are found for non-linear sliding (m = 3). On that note, we also find similar steady-state fabric patterns upon multiplying the background friction coefficient, $f_0^2$ , by a factor of 2 and 0.5, corresponding to steady-state sliding ratios of ~10 and $30\, \!\percnt$
 of the modelled surface speed.
We restricted ourselves to the case of a significant sticky spot (100 times the background value) and bed bump ($10\, \!\percnt$ of the ice thickness). For less strong perturbations, it is possible that inversions based on Glen's flow law give acceptable estimates of f (up to a constant). We mention that a higher bed slope (5°) and colder ice (− 40 °C) were additionally considered, both leading to conclusions similar to those presented here. Likewise, similar steady-state fabric patterns were also found upon increasing the Gaussian variance of the asperities by a factor of 2 and 4, corresponding to increasing the width of the asperities from ~2 to 3 and 5 ice thicknesses, respectively. The resulting inversions leave our conclusions unchanged, although fabric's effect on inversions is found to weaken with increasing wavelength of the basal asperities. Martin and Monnier (Reference Martin and Monnier2014) considered adding $1\, \!\percnt$
 Gaussian noise to the horizontal surface velocities provided as input for an adjoint-based inversion, finding a lower bound of identifiable wavelengths in the friction coefficient on the order of several ice thicknesses. The fabric effect reported here might therefore be relevant over the length scales possible to infer in the presence of noise using adjoint-based inverse methods.
Given the bed slope and flow-rate factor (A) used in the presented simulations, the characteristic time taken for an ice parcel near the bed to pass over the asperities is ~50 a, depending on the state considered (transient or steady). This raises the question of whether the fabric of ice parcels, with trajectories over basal asperities, can in fact develop fast enough for our inversion results to be relevant for transient states of real ice masses, too. Our forward simulations without DDRX take ~50 a and 200 a before the orientation fabric develops enough to considerably affect inversions in the sticky spot and bed bump model, respectively. In a sense, this estimate represents an upper bound on the fabric adjustment timescale: the fabrics of real ice parcels approaching basal asperities are unlikely to be isotropic, and hence the fabric adjustment time is likely less. If, however, DDRX is non-negligible, we underline that Γ0 represents a separate characteristic timescale for DDRX. Indeed, given the right conditions, e.g. temperatures above − 10 °C and near the bedrock, fabric evolution due to DDRX can be fast (Alley, Reference Alley1992; De La Chapelle and others, Reference De La Chapelle, Castelnau, Lipenkov and Duval1998; Faria and others, Reference Faria, Weikusat and Azuma2014b). Although a more thorough investigation is needed, the modelled timescales characterising lattice rotation and DDRX suggests that our results are not necessarily restricted to steady state flows; that is, orientation fabrics might generally develop fast enough to affect inversions targeting transient states of real ice masses, too.
We leave the above caveats and questions for future research instead of exhausting a search through model space to determine the exact conditions under which fabric can have an effect. The point is here, rather, to demonstrate that it is possible for the orientation fabric to obscure the basal conditions and affect mass-flux estimates in addition to other rheological uncertainties.
Inferring basal conditions
In this study, we distinguished between a local increase in the friction coefficient and a bedrock bump, the former defined as a ‘sticky spot’. The latter is sometimes also referred to as a sticky spot due to the resulting local increase in basal drag it can introduce (Alley, Reference Alley1993; Stokes and others, Reference Stokes, Clark, Lian and Tulaczyk2007). Generally, there are four possible mechanisms for locally increased drag (Stokes and others, Reference Stokes, Clark, Lian and Tulaczyk2007): (1) till-free areas, (2) areas of relatively strong till, (3) areas of freeze-on, and (4) bedrock bumps. In our parlance, the first three cases alter the friction coefficient field and are therefore indistinguishable from the point-of-view of the ice above, while the fourth (bed bump) is a distinctly different mechanism of increased drag. Given our results, the need for such a distinction is made clear; when using Glen's flow law, the inferred basal drag is much more accurate for a sticky spot than a bedrock bump (at least when inferring f in isolation). Because bedrock bumps can be small or simply located between sparse measurements, these two sources of ‘effective’ sticky spots can, however, not always be separated in practice. Both sources must therefore be considered when inferring basal conditions from inversions.
Unless jointly inferring f and A alleviates the problem, the distinct effect of sticky spots and bedrock bumps suggests that the accuracy of an inversion may vary within a single-drainage basin since roughness often changes along flow (Franke and others, Reference Franke2021; Holschuh and others, Reference Holschuh, Christianson, Paden, Alley and Anandakrishnan2020). Although our study focuses on flow regimes where both sliding and internal deformation are non-negligible (arguably relevant near ice-stream onsets), we end by noting that more research is needed to determine the relevance for flow regimes dominated by longitudinal and lateral (transverse) stresses, such as near fast-flowing outlet glaciers.
Conclusions
We investigated the isolated effect of neglecting the crystal-orientation fabric (mechanical anisotropies) when inferring the basal friction coefficient of a Weertman sliding law. Specifically, we considered two idealised cases of ice flowing over a sticky spot (increased friction coefficient) and a bedrock bump by using a vertical cross-section model, consisting of the anisotropic Johnson flow law, a mixed Taylor–Sachs grain rheology, and a spectral fabric model of lattice rotation and dynamic recrystallisation. Given the resulting anisotropic steady or transient states as input for an adjoint-based inversion procedure under the assumption of isotropic ice (Glen's flow law), we find that bedrock bumps can be misinterpreted as sticky on the flanks and slippery on top when in fact the slipperiness is uniform. When inferring the basal drag over a sticky spot, we find that assuming isotropic ice might be sufficient to identify the sticky spot, but in practice it may be obscured by regularisation and uncertainties in input fields, the latter known to limit the obtainable resolution of basal friction fields (Martin and Monnier, Reference Martin and Monnier2014). For both the sticky spot and bed bump models, fabric was allowed to evolve with and without discontinuous dynamic recrystallisation (nucleation and migration recrystallisation) near the bed. Due to the strong vertical shear regimes simulated, however, the resulting fabric patterns are close enough to produce similar results.
If instead the basal friction coefficient field is assumed to be known, we find that an isotropic enhancement factor field may be inferred to compensate for missing fabric information. Not only does this allow for surface velocities and vertically integrated mass fluxes be satisfactorily reproduced, but the resulting spatially distributed (isotropic) softening conforms with the softening suggested by the proper anisotropic enhancement factors and the flow speed ratios as modelled by Johnson's law compared to Glen's law. The price paid is, however, to render the material too soft when subject to longitudinal stresses. Our results therefore suggest that jointly inferring basal friction and the flow-rate factor in Glen's law might be a reasonable approach to reduce mass-flux errors by compensating for missing fabric information.
We emphasise that more research is needed to address the caveats raised (see ‘Discussion’), and hence better determine the physical conditions under which the identified fabric effect might exist. Specifically, our conclusions apply to 2-D flowline modelling where both sliding and internal deformation are non-negligible. The relevance for fast-sliding flow regimes (e.g. outlet systems) is not clear, and we cannot identify whether the equivalent isotropic enhancement factor could be depth-averaged for use in simple flow approximations. Nonetheless, the fact that the orientation fabric can hide (or at least obscure) the true basal boundary conditions from inversions suggests that care should be exercised when integrating mass fluxes under the assumption of isotropic ice, unless the flow-rate factor is jointly inferred or flow approximations otherwise alleviate the error caused by neglecting fabric. Similarly, care should be exercised when attempting relate subglacial conditions and processes to basal properties inferred from an inversion relying on Glen's flow law.
Code availability
The spectral fabric model is available at https://github.com/nicholasmr/specfab.
Acknowledgements
We thank two anonymous reviewers for comments that helped improve this manuscript greatly, which includes suggesting us to consider dynamic recrystallisation and inferring an equivalent isotropic enhancement factor field. We also thank Ralf Greve and Edwin D. Waddington for feedback provided at the early stages of developing the slab flow model and fabric model, and Christine Hvidberg, Dorthe Dahl-Jensen, and Aslak Grinsted for valuable discussions. The research leading to these results has received funding from the Villum Investigator grant no. 16572 as part of the IceFlow project, and from the European Research Council under the European Community's Seventh Framework Programme (FP7/2007–2013)/ERC grant agreement 610055 as part of the ice2ice project.
Appendix A. Taylor enhancement factor
The Taylor-averaged linear Johnson grain rheology is given by (Rathmann and others, Reference Rathmann, Hvidberg, Grinsted, Lilien and Dahl-Jensen2021)
 $$\big \langle{{\boldsymbol \tau}'}\big \rangle = A'\Bigg({\dot{\bf \epsilon}} - {{E_{cc}'^{-1}}-1\over 2}( {\dot{\bf \epsilon}}{\boldsymbol \cdot} {\boldsymbol \cdot} \, \big \langle{{\bf c}^2}\big \rangle) {\bf I} + {3( {E_{cc}'^{-1}}-1) -4( {E_{ca}'^{-1}}-1) \over 2}{\dot{\bf \epsilon}}{\boldsymbol \cdot} {\boldsymbol \cdot} \, \big \langle{{\bf c}^4}\big \rangle + \left({E_{ca}'^{-1}}-1\right)( {{\dot{\bf \epsilon}}}{\boldsymbol \cdot}{\big \langle{{\bf c}^2}\big \rangle} + {\big \langle{{\bf c}^2}\big \rangle}{\boldsymbol \cdot}{{\dot{\bf \epsilon}}}) \Bigg).$$
Vectorising $\langle {{\boldsymbol \tau }'}\rangle$ and ${\dot {\boldsymbol \epsilon }}$
 according to

Eqn (A1) may be written as the 9 × 9 linear problem

where

is a 9 × 9 matrix that depends on the second- and forth-order structure tensors, ⊗ is the generalised outer product (Kronecker product), and

The forward form of the Taylor-averaged grain rheology (A2) is therefore

where ${\cal V}^{-1}$ reverts the vectorisation.
Note that for small and large values of E cc′ and E ca′, respectively, Eqn (A2) may be ill-conditioned. In that case, solving the Tikhonov regularised problem

was found to provide good estimates of ${\cal V}( {\dot {\boldsymbol \epsilon }})$ for λ = 10−6.
Appendix B. Dynamic recrystallisation
In order to calculate the time-evolution of the fabric expansion coefficients due to DDRX, it is helpful to adopt the bra-ket notation for characterising the fabric state:

where summation over repeated l and m is implied. Given Eqn (B1), the expansion coefficients, $\psi ^{m}_{l}$ , follow directly from calculating the overlap between $Y_{l}^{m}$
 and ψ:

where the overlap between any two arbitrary functions X and Y on S 2 is given by

and $\langle {Y_{l}^{m}}\vert {Y_{l'}^{m'}} \rangle = \delta _{l, l'}\delta _{m, m'}$ by definition since $Y_{l}^{m}$
 are mutually orthogonal. The Eulerian rate-of-change of the expansion coefficients,

due to recrystallisation is therefore

If D is expanded in terms of $Y_{l}^{m}$ , the matrix elements $\langle {Y_{l}^{m}}\vert {D}\vert {Y_{l'}^{m'}} \rangle$
 in Eqn (B5) reduce to a linear combination of Gaunt coefficients (overlap integrals involving triple products in $Y_{l}^{m}$
 ). Following Rathmann and others (Reference Rathmann, Hvidberg, Grinsted, Lilien and Dahl-Jensen2021), considerable notational simplicity may be achieved by writing τ in terms of the expansion coefficients of the quadric surface τ ·· cc, defined as

which evaluate exactly to (i.e. higher wave-number coefficients vanish)

and τ is therefore exactly

Expressing c2 and c4 in terms of $Y_{l}^{m}$ , D can be written as (verified in Mathematica)

where


and the stress-dependent coupling weights are


Although 〈D〉 can be calculated directly from the definition

given the second- and fourth-order structure tensors, we note that the conservation constraint

implies that 〈D〉 is, by virtue of Eqn (B5), nothing but the inner product

Hence, the term containing 〈D〉 in Eqn (B5) is nonlinear.
In summary, the effect of recrystallisation is represented by a linear transformation of $\psi ^{m}_{l}$ and a common nonlinear scaling transformation of $\psi ^{m}_{l}$
 (for all l and m), both depending on τ.
Appendix C. Weak forms
Stokes problem
Forming the inner product between the stress balance, $-{\boldsymbol \nabla }\cdot {\boldsymbol \tau } + {\boldsymbol \nabla } p = \rho {\bf g}$ , and a vector weight function v, and adding the incompressibility condition, ${\boldsymbol \nabla }\cdot {\bf u} = 0$
 , multiplied by the weight function q, the weak Stokes problem follows from integrating the result over the model domain:

where second-order derivatives were integrated by parts, the surface Γs is assumed stress free (${\boldsymbol \sigma }\,{\boldsymbol \cdot }\,{\hat {\bf n}} = {\bf 0}$ ), ρ = 917 kg m−3 is the density of ice, g is the gravitational acceleration, tb is the basal traction given by the sliding law, and ${\boldsymbol \tau }( {\dot {\boldsymbol \epsilon }})$
 is the flow law. The mixed variational problem (C1) was discretised using Taylor–Hood elements for both the unknowns and weight functions (Galerkin method), i.e. linear elements for p and q, and quadratic elements for u and v. The term additionally added to Eqn (C1) weakly imposes ${\bf u}\,{\boldsymbol \cdot }\,{\hat {\bf n}} = 0$
 on Γb through a Lagrange multiplier field, λ, and its weight function, w (both linear elements). Note that the Cauchy stress-vector component normal to the basal boundary is absorbed into λ.
Free-surface evolution
The free-surface equation was discretised in time using a backward Euler scheme. Upon multiplying by a weight function, w, and integration over the domain length, its weak form is given by

where k is the time-step index. The term additionally added to the right-hand is a Laplacian term (having been integrated by parts) for numerical stability. The weak form (C2) was discretised in space using linear elements for both s and w (Galerkin method), and νs = 1 × 10⁻³ m2 s−1 was found to suffice.
Fabric evolution
Adding the models for lattice rotation and recrystallisation from the main text, the number distribution evolves according to

The two terms additionally added to the right-hand side provide Laplacian regularisation in orientation space and real space depending on the diffusion coefficients $\nu _{\psi }^{{\dagger} }$ and νψ, respectively; the former required for any spectral truncation of ψ (Rathmann and others, Reference Rathmann, Hvidberg, Grinsted, Lilien and Dahl-Jensen2021), the latter needed to stabilise fabric evolution for the finite-element discretisation used (more sophisticated stabilisation techniques were not attempted).
Calculating the rate-of-change of $\psi ^{m}_{l}$ using Eqn (B4) with (C3), it follows that
 $$\dot{\psi}^{m}_{l} + ( {\bf u}{\boldsymbol \cdot}{\boldsymbol \nabla}) \psi^{m}_{l} + \big \langle{Y_{l}^{m}}\vert{R}\vert{Y_{l'}^{m'}}\big \rangle\psi^{m'}_{l'} = \Gamma_0\left(\big \langle{Y_{l}^{m}}\vert{D}\vert{Y_{l'}^{m'}}\big \rangle\psi^{m'}_{l'} -\left\langle{D}\right\rangle\psi^{m}_{l} \right)- \nu_{\psi}^{\dagger} l( l + 1) \psi^{m}_{l} + \nu_{\psi}\nabla^2\psi^{m}_{l},\; $$
where $R = R( {\dot {\boldsymbol \epsilon }},\; \, {\boldsymbol \omega })$ is a linear operator representing the effect of c-axis rotation (see Rathmann and others (Reference Rathmann, Hvidberg, Grinsted, Lilien and Dahl-Jensen2021) for details), and the identity $\nabla ^2 Y_{l}^{m} = -l( l + 1) Y_{l}^{m}$
 was used.
Equation (C4) implies a nonlinear system must be solved per computational node in order to evolve the fabric field (a 66-dimensional system in the case of L = 10 used in this study). In our numerical implementation, however, we linearised the problem by using a backward Euler time-discretisation scheme for all terms but 〈D〉. Upon multiplying by a weight function, ζ, and integration over the model domain, the corresponding weak form of (C4) is given by

where k is the time-step index, and the last term in (C4) was integrated by parts assuming ${\boldsymbol \nabla }\psi \, {\boldsymbol \cdot } \,{\hat {\bf n}} = 0$ on the bedrock boundary. The form (C5) was discretised in space using linear elements for both $\psi ^{m}_{l}$
 and ζ (Galerkin method).
We end by noting that in all forward simulations presented here, hyper diffusion on S 2 was used by setting l(l + 1) → [l(l + 1)]2, thereby further reducing the influence that regularisation has on the lowest wavenumber modes (l ≤ 4) which E mm and E mt depend on. With this choice, regularisation is [10(10 + 1)/4(4 + 1)]2 ≃ 30 times stronger for modes with l = 10 compared to l = 4. In all forward simulations, regularisation corresponding to νψ = 5 × 10⁻⁵ and $\nu _{\psi }^{{\dagger} } = 1\times 10^{-4}\, \left \Vert {{\dot {\boldsymbol \epsilon }}}\right \Vert$ was used, the strain rate dependence of the latter following the fabric model of the numerical ice-flow model Elmer Ice (Gillet-Chaulet and others, Reference Gillet-Chaulet, Gagliardini, Meyssonnier, Montagnat and Castelnau2005).


 Open access