

Introduction
The stability of Antarctic Peninsula (AP) ice shelves has been extensively investigated (e.g. Reynolds Reference Reynolds1988, Lucchitta & Rosanova Reference Lucchitta and Rosanova1998, Scambos et al. Reference Scambos, Hulbe, Fahnestock and Bohlander2000, Reference Scambos, Bohlander, Shuman and Skvarca2004, Braun et al. Reference Braun, Humbert and Moll2009, Holt et al. Reference Holt, Glasser, Quincey and Siegfried2013) since Mercer (Reference Mercer1978) commented on the role of atmospheric warming in the region. Particular interest has been paid to the Prince Gustav (Cooper Reference Cooper1997, Glasser et al. Reference Glasser, Scambos, Bohlander, Truffer, Pettit and Davies2011), Larsen A (Rott et al. Reference Rott, Skvarca and Nagler1996) and Larsen B ice shelves (Scambos et al. Reference Scambos, Bohlander, Shuman and Skvarca2004, Glasser & Scambos Reference Glasser and Scambos2008), owing to the rapidity with which the final collapse phases occurred (weeks-to-months). The irregular and significant break-up patterns of the Wilkins Ice Shelf (e.g. Braun et al. Reference Braun, Humbert and Moll2009, Scambos et al. Reference Scambos, Fricker, Liu, Bohlander, Fastook, Sargent, Massom and Wu2009) and recession of George VI Ice Shelf have also been examined, and illustrate the instability of the remaining ice shelves in this region (e.g. Lucchitta & Rosanova Reference Lucchitta and Rosanova1998, Holt et al. Reference Holt, Glasser, Quincey and Siegfried2013).
Holt et al. (Reference Holt, Glasser, Quincey and Siegfried2013) concluded that there are several common glaciological characteristics that precede break-up phases of AP ice shelves. These include: i) sustained recession and a concave ice front towards the centre of an ice shelf from lateral pinning points (Doake et al. Reference Doake, Corr, Rott, Skvarca and Young1998), ii) thinning from atmospheric or oceanic warming (Shepherd et al. Reference Shepherd, Wingham and Rignot2004, Fricker & Padman Reference Fricker and Padman2012, Pritchard et al. Reference Pritchard, Ligtenberg, Fricker, Vaughan, van den Broeke and Padman2012), iii) an increase in flow speed (Rack et al. Reference Rack, Doake, Rott, Siegel and Skvarca2000, Rack & Rott Reference Rack and Rott2004, Vieli et al. Reference Vieli, Payne, Shepherd and Du2007), and iv) structural weakening along suture zones (Glasser & Scambos Reference Glasser and Scambos2008) and at the calving front (Braun et al. Reference Braun, Humbert and Moll2009).
The approximate timing of break-up events appears to be associated with the southward migration of the empirical -9°C mean annual isotherm (Morris & Vaughan Reference Morris and Vaughan2003), caused by atmospheric warming in the region of c. 3°C since 1951 (King Reference King1994, Meredith & King Reference Meredith and King2005). Barrand et al. (Reference Barrand, Vaughan, Steiner, Tedesco, Munneke, van den Broeke and Hosking2013) identified that enhanced recession of ice shelves occurred when surface melt duration was lengthened, and Fyke et al. (Reference Fyke, Carter, Mackintosh, Weaver and Meissner2010) have suggested that break-up events occur when positive degree days exceed 200 days per annum. Other authors, including Shepherd et al. (Reference Shepherd, Wingham, Payne and Skvarca2003, Reference Shepherd, Wingham and Rignot2004), Pritchard et al. (Reference Pritchard, Ligtenberg, Fricker, Vaughan, van den Broeke and Padman2012), Fricker & Padman (Reference Fricker and Padman2012), Padman et al. (Reference Padman, Costa, Dinniman, Fricker, Goebel, Huckstadt, Humbert, Joughin, Lenaerts, Ligtenberg, Scambos and van den Broeke2012) and Rignot et al. (Reference Rignot, Jacobs, Mouginot and Scheuchl2013), have highlighted the importance of basal melting on ice shelf mass balance, and in relation to this, a warming trend of intermittent and deep water in the Weddell Sea (e.g. Robertson et al. Reference Robertson, Visbeck, Gordon and Fahrbach2002), warming water on the continental shelf of the Bellingshausen Sea (up to 0.5°C in the upper 100 m; Meredith & King Reference Meredith and King2005), intermittent thickening of the Bellingshausen Sea’s Warm Deep Waters (WDW) (e.g. Holland et al. Reference Holland, Jenkins and Holland2010), and a reduction in annual and seasonal sea ice extent in the western AP (Stammerjohn et al. Reference Stammerjohn, Martinson, Smith, Yuan and Rind2008), all indicating environmental change across the region.
It has also been noted that widespread meltwater on the ice shelf surface acts as a driving force in fracture propagation that preconditions the ice shelf for rapid collapse (MacAyeal et al. Reference MacAyeal, Scambos, Hulbe and Fahnestock2003, Scambos et al. Reference Scambos, Hulbe and Fahnestock2003), although the winter break-up events of the Wilkins Ice Shelf illustrated that this is not a precursor for all collapses (see Scambos et al. Reference Scambos, Fricker, Liu, Bohlander, Fastook, Sargent, Massom and Wu2009). Other factors such as embayment geometry (Fox & Vaughan Reference Fox and Vaughan2005) and the presence of ice rises (Hughes Reference Hughes1983, Reynolds Reference Reynolds1988, Doake & Vaughan Reference Doake and Vaughan1991, Braun et al. Reference Braun, Humbert and Moll2009) may also impact the response of individual ice shelves.
In this paper, we examine the structural and dynamic regimes of Stange Ice Shelf (SIS) between 1973 and 2011 using remote sensing data.
Study area
The SIS is located on the south-west AP (Fig. 1). Morris & Vaughan (Reference Morris and Vaughan2003) showed that mean annual temperatures of SIS range from -11°C at the north ice front to -15°C at the English Coast grounding line, and thus is below the -9°C mean annual isotherm. The ice shelf is fed by ice flowing from three grounded locations, and has three independent ice fronts. Consequently, SIS has a complex configuration, but it has rarely been documented, and little is known about its glaciological conditions and evolution over its recent history. Cook & Vaughan (Reference Cook and Vaughan2010) commented on the fluctuating ice fronts and identified a total areal decrease of 3% between 1973 and 2008 (from 8286 km2 to 8022 km2). Fricker & Padman (Reference Fricker and Padman2012) showed that spatially-averaged elevation changes varied from -0.90 to 0.61 m a-1 from 1992–2008. Furthermore, Rignot et al. (Reference Rignot, Jacobs, Mouginot and Scheuchl2013) estimated that c. 85% of the SIS mass loss occurs through basal melting, with a mean rate of c. 3.5 m a-1, with only a small calving flux.
Location of Stange Ice Shelf on the Antarctic Peninsula. c. Overview of Stange Ice Shelf from 1973–2011. b. & d. Changes at the north, central and south ice fronts.

Data and methods
Ice-surface structural mapping
The following surface features and glaciological structures were digitized in various thermal, visible and microwave satellite images acquired between 1973 and 2011: ice front and ice shelf grounding line to estimate the area, rifts, fracture traces, crevasses, longitudinal structures (elsewhere termed flow stripes, streaklines, flowbands), pressure ridges, and ice rumples (see Holt et al. Reference Holt, Glasser, Quincey and Siegfried2013 for description and significance of structures). Two Landsat Multi-spectral Scanner (MSS), five Landsat Thematic Mapper (TM) and 13 Enhanced TM (ETM+) images were used for the years 1973, 1986, 1989, 2001, 2005 and 2011 (Table I). Mapping was performed using those image bands that offered the highest spatial and spectral resolution, noting that resolvable spatial scales increase with increasing wavelength. Landsat MSS Band 5 (0.6–0.7 µm, red, 82 m), Landsat TM/ETM+ Band 4 (0.77–0.90 µm, near infrared, 30 m) and Landsat ETM+ Panchromatic Band 8 (0.52–0.9 µm, green/red/near infrared, 15 m) were used. A single ERS-2 Synthetic Aperture Radar (SAR) scene (spatial resolution c. 25 m) was used to calculate the area for February 1996 when there was a gap in the Landsat acquisition over Antarctica.
List of satellite images and their uses in this study.

M=full glaciological mapping assessment, P=partial assessment, S=spatial assessment, F=used in surface feature tracking.
Digitizing was carried out at three main scales for consistency across all satellite scenes: i) 1:100 000 for large surface features such as longitudinal structures, ii) 1:50 000 for rifts, the ice front and the grounding zone, and iii) 1:25 000 for crevasses and pressure ridges. For areas where significant change was observed, further mapping at finer spatial and temporal resolutions was carried out to provide detail of short-term changes.
Ice shelf velocity
To estimate ice shelf flow speed, manual feature tracking was carried out for the years 1989, 2004 and 2010 following the method of Holt et al. (Reference Holt, Glasser, Quincey and Siegfried2013). A manual approach was chosen over automated alternatives for the following reasons: i) the considerable variations in surface-feature scale across the ice shelf limited automated procedures, ii) the ability to map displacements between multiple scenes over different paths and rows of the satellite image, and iii) the partial masking of features by fine clouds or atmospheric haze in a number of scenes.
Fourteen Landsat scenes with time differences of less than three years were used to calculate surface flow speeds (Table I). Landsat scenes were initially co-registered to within one pixel of each other, with displacement measurements also carried out to an estimated accuracy of one pixel, resulting in a maximum uncertainty for flow speed and direction of two pixels between image pairs. The datapoints were normalized to express displacement in metres per annum, and interpolated using a nearest-neighbour algorithm, selected because it performs equally well with regularly and irregularly distributed data (Watson Reference Watson1992). As an independent check, comparison of our 2010 feature tracking results with InSAR derived flow speeds (Reference Vieli, Payne, Shepherd and Du2007) by Rignot et al. (Reference Rignot, Mouginot and Scheuchl2011) show good agreement (typically±30 m) across SIS.
Surface elevation change
Surface elevation changes (dh/dt) was estimated for the period 1992–2008 using ERS-1/-2 and Envisat radar altimetry (RA) crossover data following the methods detailed by Fricker & Padman (Reference Fricker and Padman2012). The RA data were obtained from NASA-GSFC’s Ice Altimetry group (http://icesat4.gsfc.nasa.gov/). Data acquired during the summer (December–March) were excluded to avoid periods of potential surface melting that may have affected the radar altimeter return signal (Thomas et al. Reference Thomas, Davis, Frederick, Krabill, Li, Manizade and Martin2008). Therefore, this analysis is based on RA measurements acquired between 1 April and 30 November each year.
The data were subsetted to ice shelf areas using an ice shelf mask digitized from the image Mosaic of Antarctica (MOA) (Scambos et al. Reference Scambos, Haran, Fahnestock, Painter and Bohlander2007), and adjusted accordingly using an InSAR-derived grounding zone map (Rignot et al. Reference Rignot, Mouginot and Scheuchl2011). Crossover analysis was used to determine elevations at the intersecting points of ascending and descending tracks; the precise location and surface elevation of the crossover points were determined by interpolating the surface elevation measurement either side of the crossover. A central reference point was then used for each crossover to allow comparisons through time. Any crossovers located within 10 km of the grounding zone were excluded to ensure the analysis was conducted only where hydrostatic equilibrium had been reached, and points near the ice fronts that were ‘lost’ to calving events during the data period were removed. One additional crossover was removed from the original Fricker & Padman (Reference Fricker and Padman2012) dataset because it was close to an ice rumple, so that hydrostatic equilibrium may have been compromised at this point. In total, 13 crossover points were analysed across SIS, with the average distance between crossover locations being c. 27 km.
Surface melt calculation
Surface melt extent was estimated from Envisat ASAR Wide-Swath-Mode (WSM) data for all summers for which data from this mode of the instrument is available (2006, 2007, 2011, 2012). The ASAR WSM data have a spatial resolution of 150 m and the revisit time at the latitude of SIS is 2–3 days. Deriving surface melt from active microwave imagery such as scatterometry is well established (e.g. Tedesco & Monaghan Reference Tedesco and Monaghan2009, Trusel et al. Reference Trusel, Frey and Das2012), but SAR data were chosen for its higher spatial resolution (Luckman et al. Reference Luckman, Elvidge, Jansen, Kulessa, Munneke, King and Barrand2014). In common with other studies, the radar backscatter in each image was compared with the mean value for all winter images. Radar backscatter is highly sensitive to water content; meltwater present at or near the surface absorbs the microwave radiation and the backscatter declines. A threshold of 3 dB below the winter mean was used to indicate the presence of surface meltwater (Nagler & Rott Reference Nagler and Rott2000). The decline in backscatter when water is present is so pronounced that the detection of surface melt is not very sensitive to the 3 dB threshold. Annual melt days are defined as the number of days for which melt was detected, assuming continued presence or absence of melt on intervening days when no imagery was available.
Results
Spatial extent and geometry
Our results show that SIS experienced a net loss of c. 338 km2 of ice (4%) between 1973 and 2011 (Figs 1 & 2). Only the north ice front experienced a net loss (384.0 km2). The central and south ice fronts advanced by 45.2 km2 and 0.8 km2, respectively, between 1973 and 2011 (Table II). The south ice front displayed cycles of ice front advance and calving along preconditioned structural weaknesses. Changes at the central ice front were largely a result of ice motion parallel to the ice front profile (i.e. not typical forward motion, Fig. 1c & d). Despite the observed retreat, the north ice front retained its distinctive shape, with a central ‘ice tongue’ protruding into Ronne Entrance (Fig. 1b). The three sub-components of the central ice front showed little change (Fig. 1d); central ice front 1 was almost linear, and central ice fronts 2 and 3 were slightly convex. The south ice front’s profile was comparable in 2011 to that in 1973 (Fig. 1d).
Stange Ice Shelf area change at the north, central and south ice fronts (columns), and net rate of change (dashed line) from 1973–2011.

Loss, gain and net changes at each of the ice fronts of Stange Ice Shelf between 1973 and 2011.
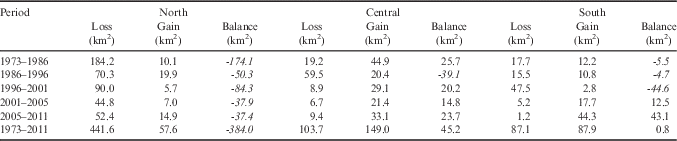
Italics indicate periods where the net change was negative.
Ice shelf flow
The greatest contributors to SIS by mass were located along the English Coast with the Lidke Ice Stream, ST07 and ST08 (previously unnamed tributaries, ST=Stange tributary) exhibiting the highest flow speeds (c. 500–1000 m a-1; see Fig. 3a for locations). The ST07 and ST08 ice streams had little impact on the main ice shelf because they terminate at the south ice front which is largely independent of the rest of SIS. Ice speed reduced as the ice flowed between Spaatz Island and Smyley Island towards the north ice front, impinging on slow moving ice from Smyley Island.
Stange Ice Shelf flow velocities derived from manual feature tracking for a. c. 1989 and b. c. 2010. Grey arrows indicate flow direction, black dots are the points from which velocities have been interpolated (number of points used a. n=365, b. n=572). c. Overall velocity change. d. Area of the greatest velocity change near the south ice front.

Over much of the ice shelf, no significant changes in flow speeds were found (Fig. 3c). However, two significant changes were observed towards the south ice front in flow units ST07 and ST08 (Fig. 3d). First, the majority of this section has slowed by up to 100 m a-1, particularly towards the western edge of the flow units. Second, an increase in flow speed of up to 400 m a-1 was measured between the English Coast and Case Island.
Structural glaciology
Longitudinal structures emanated from the English Coast, Spaatz and Smyley islands, and their associated tributary glaciers (Fig. 4b). The clearest examples can be traced from the part of the grounding zone where ST02–ST05 and the Lidke Ice Stream flow into SIS (‘i’ in Fig. 4b), extending for 25 km into the ice shelf. Smaller clusters also emanated from ST01 and Hill Glacier on Spaatz Island, from ice flowing off Smyley Island, and in ice feeding the south ice front (ST07 and ST08). The trace of features originating from Smyley Island was limited by extensive fracturing of the ice in this area.
Landsat ETM+ scenes showing Stange Ice Shelf c. 2010. b. Structural overview of SIS c. 2010 (FZ=fracture zone). A set of Landsat images showing structural changes near the south ice front between c. 2001, d. 2004, and e. 2009, with clear shearing where flow speed increases in ST07. Rift set 1 and rift set 2 refer to existing and new rift zones. CI=Case Island, RP=Rydberg Peninsula.

The clearest longitudinal features mark the boundary (sutures) of different units of English Coast tributaries (‘ii’ in Fig. 4b). Of particular interest are three deformed examples in the centre of the ice shelf. These three features demark ice sourced from ST02, ST03 and ST04, respectively. They spread towards their downstream limit and, in one case (ST03), fold back into the ice shelf. Other structures in this area (longitudinal structures) indicate a largely convergent flow regime.
There were also several key zones in which extensive fracturing occurred, in three distinct situations (Fig. 4b). Fracture zones 1 and 2 occurred at the suture of two flow units around headlands. At the grounding zones, these rifts had wide openings and were often filled with brash ice and calved blocks. Occasionally, open water was also visible at their base. As these rifts propagate along the ice flow-lines, they sealed to form fracture traces which remained visible in the ice for c. 15 km. Rifts in fracture zones 3, 4 and 5 emanated from the grounding zone and advected along-flow to their respective ice fronts. Rifts in these zones also formed at the suture zones between flow unit boundaries at the grounding line, which were typically filled with brash ice and calved blocks from the adjacent rift walls. In fracture zones 3 and 5, in particular, the form of fractures near the grounding line may be the surface expression of basal crevasses. Fracture zones 6 and 7 form at the north ice front and cut back longitudinally and transversely into the ice shelf. Individual features were also observed at the central ice front, but these were limited in quantity, extent and distribution.
Structural evolution at the south ice front
A time series of structural maps constructed from imagery dating between 1973 and 2011 revealed relatively few significant changes in the number or distribution of structures at the surface of SIS. Those changes that did occur were focused around the three ice fronts, with the most significant of them being observed at the south ice front (Fig. 4c–e).
Tributaries ST07 and ST08 were the main sources of ice at the south ice front and, although this area of the ice shelf was heavily fractured during the entire study period, the variable intensity and organization of fractures suggests that the flow regime significantly altered over that time. In particular, during 2001, a calving event (58 km2) was observed from ice fed by ST08, and fragmentation of ice derived from ST07 close to the ice front continued with calved blocks and brash ice appearing behind the ice front (rift set 1, Fig. 4c). Most significantly, a new rift zone developed between ST07 and slower moving ice adjacent to Case Island, with their spread and complexity of arrangement increasing away from the grounding line (rift set 2, Fig. 4d). Rift set 2 expanded between 2001 and 2005, as did rift set 1 between ST07 and ST08. By 2011, large areas of the two flow units were fragmented, with calved blocks and brash ice filling open rifts across large zones of this area of the ice shelf. Calved blocks within the rifts show a clockwise rotation between successive scenes (not shown here), illustrating a shearing motion between flow units. Additionally, the most southerly of this string of rifts had migrated westward and cut across the central region of the ST08 flow unit, effectively isolating a large block of ice close to the south ice front primed for calving.
Ice shelf surface elevation change: 1992–2008 (ERS/Envisat RA)
There was considerable spatial and temporal variability in the surface elevation changes (dh/dt) observed at 13 RA crossovers across SIS, (Figs 5 & 6, with the data also summarized in Table III). Between 1992 and 2008, the dominant signal across the ice shelf was surface lowering; this lowering was widespread, but was spatially variable.
Annual surface elevation change (dh/dt) measurements for the 13 ERS/Envisat RA crossovers on SIS between 1992 and 2008. Crossover labels are given in a. p. Total ice surface elevation change, displayed in metres per annum, for each crossover for the full observation period. See also Fig. 6 and Table III.

Time series of surface elevation change for the 13 crossover locations on Stange Ice Shelf (X1–X13; see Fig. 5a for location of crossovers). Grey crosses indicate all surface elevation measurements, red diamonds show the mean surface elevation for the corresponding year (measured April–April), black bars show the standard deviation within the annual data, and the blue line indicates the trend over the whole period for each crossover. The box plot shows the shelf-averaged, annual dh/dt, with the width of each box indicating the length of the time period (April–April; typically one year, with the exception of 1993–95 due to an absence of RA data in 1994), and the height indicating the standard error of all datapoints within the corresponding period.

Mean dh/dt per annum (SD) per crossover between 1992 and 2008, and mean number of melt days (final column) for the corresponding crossovers.

Italics indicate periods where dh/dt was negative, dashes indicate no data available for that period, SD=standard deviation.
There was significant interannual variability in dh/dt at each crossover (Figs 5 & 6). There was strong surface lowering between 1992 and 1996, followed by a period of positive spatially-averaged dh/dt (1996–2002). The strongest surface-lowering signal (-1.66±0.32 m a-1), averaged over the entire ice shelf, occurred during the period 2002 to 2003, and there was only a weak surface-lowering signal between 2003 and 2008 (Fig. 6).
Only three of the 13 crossovers (X2, X4 and X11) showed a positive elevation trend over the RA observation period (Fig. 6 and Table III (rows). Of those locations that underwent surface lowering, crossover X3 exhibited the greatest change (c. -15 m). Overall, the estimated shelf-averaged elevation change between 1992 and 2008 was -0.17±0.01 m a-1.
Surface melt days: 2006–12
Figure 7 shows the mean annual number of surface melt days estimated from Envisat ASAR data for 2006, 2007, 2011 and 2012. The estimated number of melt days varied widely across the ice shelf; the highest number of surface melt days was observed adjacent to Spaatz Island (c. 60–80 d a-1) and the lowest number of melt days was adjacent to the English Coast (c. <10 d a-1) between ST03 and ST08. The rest of the ice shelf surface experienced melting for an average of c. 35 d a-1.
Mean number of surface melt days per annum on Stange Ice Shelf over the period 2006–12 estimated from Envisat ASAR imagery. Red areas at the ice fronts indicate where ice has been lost to calving.

Discussion
Ice shelf flow stability
The linear longitudinal structures emanating from the grounding zone of SIS indicate that in the recent past (centuries) it has been a largely stable and convergent system (Fahnestock et al. Reference Fahnestock, Scambos, Bindschadler and Kvaran2000, Glasser et al. Reference Glasser, Kulessa, Luckman, Jansen, King, Sammonds, Scambos and Jezek2009). Longitudinal structures only show evidence of deformation downstream of the series of ice rumples near the English Coast (Fig. 4). These probably represent localized flow divergence and shear drag around the ice rumples rather than any large-scale flow changes (Hambrey & Dowdeswell Reference Hambrey and Dowdeswell1994).
The most pronounced longitudinal features are linked to flow sutures between ST02 and ST03, then subsequently with ST04. Their along-flow longevity (c. 77 km, equivalent to c. 320 years of advection) illustrates the dominance of flow from these active units, which is also illustrated by the current flow regime (Fig. 3b). These features (marked ‘ii’ in Fig. 4b) can be traced with flow from 1974–2011 without undergoing any further deformation, therefore they can be linked to a past change in flow regime. They may represent shear-folds, caused by the faster flowing ice from the English Coast tributaries impinging against the resistant headlands of Spaatz Island and Benkert Mount. The cause of the change to the flow regime is unclear, but it may be linked to increased discharge from the English Coast tributary glaciers or a shift in the stress and strain regimes in the ice shelf following changes to its mass. As there was no further deformation of these structures during our observation period, we hypothesize that the flow dynamics over much of the ice shelf have remained consistent for c. 250 years, i.e. the minimum period of time it would have taken for the youngest fold (see Fig. 4b) to have advected to its current position from the grounding line, assuming present day flow speed and direction.
Brittle deformation and shearing 2001–11
Between 2001 and 2011, shear fractures propagated at the eastern margin of ST07 (rift set 2, Fig. 4c–e), steadily increasing in quantity, size and distance from the grounding line over this period. Examination of a February 2014 Landsat 8 image (not shown here) confirms that shear fracturing has continued in this region. Our flow speed estimates for the periods c. 1989 and c. 2010 show a clear increase along this boundary (Fig. 3d). The observed fracturing is probably caused by this increase in speed, coupled with rapid thinning of the ice shelf flowband that feeds the south ice front.
Conversely, flow towards the western side of tributary ST08 decreased over the same period. This is largely due to the grounded ice on Rydberg Peninsula providing a greater lateral drag as the ice shelf thins, as opposed to the shearing between the two floating flowbands discussed above. This situation is similar to that, observed and modelled on the Larsen B Ice Shelf prior to its collapse. Vieli et al. (Reference Vieli, Payne, Shepherd and Du2007) showed that as Larsen B thinned, its flow speed reduced but the sutures between floating flow units became weaker and consequently encouraged further shearing in these zones (Glasser & Scambos Reference Glasser and Scambos2008). As the south ice front of SIS is largely independent of the rest of the shelf, we do not expect this shearing to induce widespread retreat, but it may lead to enhanced calving and recession in this area.
Surface elevation change and thinning of Stange Ice Shelf
The rate of change of surface elevation (dh/dt) of SIS, observed with satellite RA, varies significantly in both time and space (Figs 5 & 6). For the period 1992–2008, dh/dt averaged over the entire SIS was -0.17±0.01 m a-1. The greatest linear trend, calculated over the same period, was c. -0.69 m a-1 recorded at crossover X3 within the flowbands for ST07 and ST08 on the south-eastern SIS (Fig. 6).
The general trend of surface lowering (dh/dt<0) of AP ice shelves has been attributed to a combination of basal melting and firn compaction exceeding ice advection and precipitation (Pritchard et al. Reference Pritchard, Ligtenberg, Fricker, Vaughan, van den Broeke and Padman2012). Firn compaction has been implicated as the primary component of surface lowering on the northern Larsen C and the remnant Larsen B ice shelves (Holland et al. Reference Holland, Corr, Pritchard, Vaughan, Arthern, Jenkins and Tedesco2011, Pritchard et al. Reference Pritchard, Ligtenberg, Fricker, Vaughan, van den Broeke and Padman2012), although there are large uncertainties in modelled firn state changes. An increase in the contribution of firn compaction to surface lowering on these ice shelves is aided by lengthening melt seasons (e.g. Barrand et al. Reference Barrand, Vaughan, Steiner, Tedesco, Munneke, van den Broeke and Hosking2013). In contrast, a regional coupled ocean/ice shelf model (Holland et al. Reference Holland, Jenkins and Holland2010) suggests that mass loss from both George VI and Wilkins ice shelves has been caused by increasing basal melting in response to regional changes in climate, in particular changes in wind stress. Padman et al. (Reference Padman, Costa, Dinniman, Fricker, Goebel, Huckstadt, Humbert, Joughin, Lenaerts, Ligtenberg, Scambos and van den Broeke2012) also found, from a mass budget of Wilkins Ice Shelf, that long-term surface lowering must be driven primarily by increased basal melting. However, on shorter time intervals (a few years) changes in surface mass balance and firn compaction rate may be significant (Padman et al. Reference Padman, Costa, Dinniman, Fricker, Goebel, Huckstadt, Humbert, Joughin, Lenaerts, Ligtenberg, Scambos and van den Broeke2012 fig. 5).
We anticipate, from its setting, that the mass budget for SIS will have more in common with the nearby Wilkins and George VI ice shelves than with Larsen Ice Shelf in the Weddell Sea. Thus a change in delivery of ocean heat to the ice shelf base is the most probable cause of long-term variability of dh/dt. However, we first consider whether there is any evidence for firn compaction to contribute to dh/dt. The mean number of surface melt days on SIS (c. 35) is less than the 49-day mean value across the rest of the AP (Barrand et al. Reference Barrand, Vaughan, Steiner, Tedesco, Munneke, van den Broeke and Hosking2013), but the value varies between c. 10 and c. 80 days of melting in an average year (Fig. 7). The mean annual surface temperature of SIS ranges from -11°C to -15°C (Morris & Vaughan Reference Morris and Vaughan2003), and neither summer temperatures nor melt durations over most of SIS are sufficient to induce the formation of melt pools. However, there is a positive trend in the number of melting days over the west AP from 1979–2008 (Tedesco Reference Tedesco2009), increasing by between 0.55 d a-1 and 1.8 d a-1 for Wilkins and George VI ice shelves, respectively. With similar trends apparent over SIS, we hypothesize that some of the observed surface-elevation lowering is a consequence of increasing rates of firn densification (cf. Holland et al. Reference Holland, Corr, Pritchard, Vaughan, Arthern, Jenkins and Tedesco2011). For regions which have experienced long melt seasons for decades, increasing the number of annual melt days has a negligible effect on elevation as most firn is already compacted each year, thus the firn layer is very thin (Holland et al. Reference Holland, Corr, Pritchard, Vaughan, Arthern, Jenkins and Tedesco2011). Instead, the greatest potential for firn densification is where SIS presently experiences only occasional melting. For SIS, this is the region along the English Coast (Fig. 7).
If firn compaction does play a role in setting dh/dt, a temporal correlation might be expected between dh/dt (Figs 5 & 6) and the length of the melt season. Fahnestock et al. (Reference Fahnestock, Abdalati and Shuman2002) reported peninsula-wide surface melting during 1992–93, 1994–95 and 1997–8, and Barrand et al. (Reference Barrand, Vaughan, Steiner, Tedesco, Munneke, van den Broeke and Hosking2013) reported extensive surface melting during 2002–03, with slightly higher-than-average melt during 2007–08 and 2008–09. Although we observed spatially-averaged elevation lowering for all of these periods (Fig. 5, Table III), there is no significant correlation between measured dh/dt and melt duration at any of the locations of the satellite altimeter crossovers. Therefore, we conclude that firn compaction is probably not a primary cause of surface lowering of SIS.
The preceding tentative conclusion suggests that increased basal melting is required to explain observed dh/dt. This is consistent with regional modelling by Holland et al. (Reference Holland, Jenkins and Holland2010), analysis of the mass budget for nearby Wilkins Ice Shelf by Padman et al. (Reference Padman, Costa, Dinniman, Fricker, Goebel, Huckstadt, Humbert, Joughin, Lenaerts, Ligtenberg, Scambos and van den Broeke2012), and a measured rise in ocean temperatures over the continental shelf over the last two decades further north in the Bellingshausen Sea (Meredith & King Reference Meredith and King2005, Martinson et al. Reference Martinson, Stammerjohn, Iannuzzi, Smith and Vernet2008). There are no long-term oceanographic measurements available to confirm trends in provision of ocean heat to the base of SIS. However, warm (>1°C) Circumpolar Deep Water (CDW) reaches the SIS ice fronts at depths >300 m (see fig. 9a in Padman et al. Reference Padman, Costa, Dinniman, Fricker, Goebel, Huckstadt, Humbert, Joughin, Lenaerts, Ligtenberg, Scambos and van den Broeke2012). This warm water fuels a SIS-averaged basal melt rate w b of 3.5±0.7 m a-1 (Rignot et al. Reference Rignot, Jacobs, Mouginot and Scheuchl2013, table 1), which is comparable to the rate for George VI and Wilkins ice shelves. The observed time-averaged dh/dt for SIS (-0.17 m a-1 in our estimates based on RA for 1992–2008, and -0.07 m a-1 reported by Rignot et al. (Reference Rignot, Jacobs, Mouginot and Scheuchl2013) based on laser altimetry for 2003–08) corresponds to around a 20–40% excess in w b relative to the value required for steady-state. This amount of temporal change in w b is consistent with the modelled variability of George VI Ice Shelf melting reported by Holland et al. (Reference Holland, Jenkins and Holland2010).
As with firn compaction, one potential validation for the role of basal melting in dh/dt is the interannual variability of the proposed forcing (in this case, circulation of ocean heat) and measured dh/dt. The inflow of warm CDW near the sea floor provides the thermal forcing required to melt ice near the grounding zone, and CDW flux is expected to vary in this region (Holland et al. Reference Holland, Jenkins and Holland2010). Furthermore, changes in basal melt rate may result from changes in depth of the thermocline separating the WDW from the cold upper ocean layers (Padman et al. Reference Padman, Costa, Dinniman, Fricker, Goebel, Huckstadt, Humbert, Joughin, Lenaerts, Ligtenberg, Scambos and van den Broeke2012). The latter process is suggested by the existence of very cold water (<0°C) at the depth of the ice draft near the three SIS ice fronts (c. 200 m; Fig. 8; see fig. 9b in Padman et al. Reference Padman, Costa, Dinniman, Fricker, Goebel, Huckstadt, Humbert, Joughin, Lenaerts, Ligtenberg, Scambos and van den Broeke2012). Regions of the ice shelf near the ice fronts experience a wide range of dh/dt, including both lowering and increase (Figs 5 & 6), which may reflect variability of thermocline depth. This may, in turn, be primarily associated with changing wind-stress patterns driven by the En Niño–Southern Oscillation (ENSO) (see Dutrieux et al. Reference Dutrieux, De Rydt, Jenkins, Holland, Ha, Lee, Steig, Ding, Abrahamsen and Schröder2014).
Thickness of Stange Ice Shelf estimated from RA data (Griggs & Bamber Reference Griggs and Bamber2011).

Holland et al. (Reference Holland, Jenkins and Holland2010), in their numerical model of the Bellingshausen Sea, found that most rapid increases in modelled basal melt rate for George VI Ice Shelf occurred during 1989–92 and 2004–06, corresponding to periods of elevated CDW layers in Ronne Entrance (Holland et al. Reference Holland, Jenkins and Holland2010 fig. 7). The timing of these events is well-matched with the observed surface lowering for SIS (-0.58 m a-1, and -0.73 m a-1 respectively; Fig. 5, Table III) and, given that the draft of SIS at its north and south fronts (c. 200 m and c. 340 m, Fig. 8) are greater than that at the southern margin of George VI Ice Shelf (c. 180 m), the raising of CDW may have also enhanced the basal melting from SIS. Due to the relatively shallow draft of much of SIS in relation to the depth of cold surface water, SIS may also experience a significant seasonal cycle in basal melting regardless of the modulation of the CDW inflow, as reported for the relatively shallow Wilkins Ice Shelf (Dinniman et al. Reference Dinniman, Klinck and Hofmann2012, Padman et al. Reference Padman, Costa, Dinniman, Fricker, Goebel, Huckstadt, Humbert, Joughin, Lenaerts, Ligtenberg, Scambos and van den Broeke2012).
In conclusion, based on comparisons with other studies and regional models, the most probable cause for SIS surface lowering from 1992–2008 is an increase in basal melting caused by changes in ocean circulation rather than an increase in firn compaction. This suggests that, in assessing the future stability of SIS, the focus should be on mechanisms for changing the ocean heat flux under the ice shelf.
Summary
Remote-sensing data for the period 1973–2011 has provided a detailed description of the structural and dynamic regimes of SIS. Our main observations were as follows:
-
i) Most of the ice shelf’s flow regime has changed little over the last 250 years, since the formation of the youngest fold structure in ice flowing from the English Coast.
-
ii) Flow speed changes were concentrated near the south ice front.
-
iii) Structural evolution was most evident at the south ice front, where shear fractures developed between 2001 and 2011 at the eastern boundary of ST07.
-
iv) Widespread surface lowering was observed across the ice shelf (-0.17±0.01 m a-1), although there was large temporal and spatial variability. The greatest changes occurred in areas with less surface melting per annum (on average).
-
v) Mean annual surface melt days ranged from c. 60–80 days in the northern portion, c. 35 days over much of the central section and <10 days along the southern margins.
We suggest that shear fractures develop near the south ice front as a consequence of ice shelf thinning. Flow speed here increases along the eastern suture of ST07, but decreases where ST08 becomes subjected to increased side drag along Rydberg Peninsula. Overall, SIS is stable and no immediate break-up as observed elsewhere on the AP is expected. However, regular recession of the north ice front, a largely concave profile and diverging embayment preconditions the main body of SIS for rapid retreat when critical thresholds are met; the south ice front acts as an indicator that glaciological change is probable in this region. In conclusion, glaciological changes observed here relate to changes in ocean circulation rather than the atmosphere, thus future research should focus on mechanisms for changing the ocean heat flux beneath the ice shelf cavities.
Acknowledgements
We thank Jay Zwally’s Ice Altimetry group at the NASA Goddard Space Flight Center for processing, archiving and distributing their RA datasets for all satellite radar altimeter missions (see http://icesat4.gsfc.nasa.gov). HAF and LP were supported by two awards from NASA (NNX10AG19G and NNX13AP60G). The authors thank the editors and the two anonymous reviewers for their comments that greatly improved the manuscript.
Author contributions
Holt carried out the structural mapping, velocity calculation and re-analysis of RA data, and wrote the majority of the paper unless stated below. Glasser was involved with developing the project’s initial ideas, provided expert guidance and edited the manuscript. Fricker, Padman and Siegfried supplied the RA data and offered guidance on the interpretation and discussion. Fricker edited the final manuscript and Padman contributed heavily to the final section of the discussion as well as editing the final manuscript. Luckman supplied the surface melt data and contributed to the data and methods. King contributed to the structural interpretation. Quincey was involved with the initial project and provided expert guidance in its inception.


 Open access