





Management Implications
Ranunculus ficaria (lesser celandine) is an invasive species that forms monocultures in riparian habitats. The window for spring herbicide treatment is narrow due to its short growing season. Control was achieved with both imazapyr and glyphosate application, with effectiveness varying with application date. Imazapyr application caused ∼95% reduction for every application date, while glyphosate was effective to the same extent only in mid-March. There was no advantage of using increased concentration of herbicide; we thus recommend using 1.5% v/v of Arsenal®, for a final concentration of 0.81% ai imazapyr, or 1.5% v/v AquaNeat® for a final concentration of 0.42% ai glyphosate. Cover of native species 1 yr later was highest for the early April application and lowest for the early May application. Spraying in early May with imazapyr controlled R. ficaria but is not recommended due to non-target effects on native species. Taking all factors into account, we recommend using imazapyr during the flowering period (early April) or, slightly less optimal for native species recovery, using glyphosate or imazapyr during the pre-flowering period (mid-March). If cost of materials is an issue, we recommend application of glyphosate in mid-March instead of imazapyr, as Arsenal® is currently more than twice the cost of AquaNeat®. Imazapyr is preferred in mid-March if cost of labor is an issue, as it can have longer-lasting effects and thus requires fewer applications. No treatment provided complete control, and there was recolonization following disturbance. Thus, follow-up annual treatments are necessary. Further, differences between sites, possibly due to local conditions, mean that site-specific monitoring and adjustment may be necessary.
Introduction
Invasive plants have negative impacts on native ecosystems and ecosystem services globally (Rai and Singh Reference Rai and Singh2020), including reduction of biodiversity (Fierke and Kauffman Reference Fierke and Kauffman2006). Invasive species in riparian areas can negatively affect water quality and function in adjacent aquatic habitats (Robertson and Coll Reference Robertson and Coll2019). Removal of invasive species can prevent local extinction (Baider and Florens Reference Baider and Florens2011) and allow the reestablishment of native species (Cipollini et al. Reference Cipollini, Ames and Cipollini2009). Thus, invasive plants are controlled during ecological restoration, using mechanical and chemical methods (Weidlich et al. Reference Weidlich, Flórido, Sorrini and Brancalion2020).
Lesser celandine (Ranunculus ficaria L.) is an ornamental species in the buttercup family (Ranunculaceae) native to Europe and is considered an invasive species in the United States (Axtell et al. Reference Axtell, DiTommaso and Post2010). It is distributed in the Northeast, Midwest, Pacific Northwest, and Texas (USDA Plants 2025) and is frequently found in riparian habitats. Ranunculus ficaria has documented negative impacts on growth and reproduction of native species (Cipollini and Schradin Reference Cipollini and Schradin2011). It has a brief growing period; in the Midwest in southwest Ohio, it generally leafs out in mid- to late February and completely senesces by early to mid-June (KC, personal observation). For this reason, it has been hypothesized that spring ephemeral species are likely most heavily impacted by R. ficaria (Axtell et al. Reference Axtell, DiTommaso and Post2010), although this has never been systematically examined. In fact, the presence of R. ficaria can enhance pollinator visits to some ephemeral species (Masters and Emery Reference Masters and Emery2015). Ranunculus ficaria has negative effects on longer-lived native species beyond its short overlap in growing season with most natives (Cipollini and Schradin Reference Cipollini and Schradin2011). Effects may be a result of putative allelopathy on a variety of species, observed in both the laboratory and field (Cipollini and Bohrer Reference Cipollini and Bohrer2016; Cipollini and Flint Reference Cipollini and Flint2013; Cipollini and Schradin Reference Cipollini and Schradin2011; Cipollini et al. Reference Cipollini, Titus and Wagner2012).
Two herbicides commonly used for invasive species control are glyphosate and imazapyr. Glyphosate is the most highly used herbicide worldwide (Benbrook Reference Benbrook2016) and for invasive species control in North America (Wagner et al. Reference Wagner, Antunes, Irvine and Nelson2017). It is a systemic nonselective herbicide that prevents the synthesis of aromatic amino acids, with the death of the plant within 1 to 3 wk (Kanissery et al. Reference Kanissery, Gairhe, Kadyampakeni, Batuman and Alferez2019). Its half-life in soil is 7 to 60 d (Kanissery et al. Reference Kanissery, Gairhe, Kadyampakeni, Batuman and Alferez2019). Glyphosate activity in soil can decline rapidly; Tesfamariam et al. (Reference Tesfamariam, Bott, Cakmak, Römheld and Neumann2009) found little to no effect of glyphosate in soils on non-target plants as soon as 21 d after glyphosate application to weeds or to bare soil. Imazapyr is also a systemic nonselective herbicide and is the third most used herbicide for invasive species control in North America (Wagner et al. Reference Wagner, Antunes, Irvine and Nelson2017). It blocks the action of acetohydroxyacid synthase (Huripurshad et al. Reference Huripurshad, Beckett and Campbell2018), preventing the synthesis of branched-chain amino acids and thus leading to death. It has a half-life in soil from 82 to 268 d, with imazapyr soil residues having negative effects on productivity more than 10 mo after application (Douglass et al. Reference Douglass, Nissen, Meiman and Kniss2016). Residual control of purple loosestrife (Lythrum salicaria L.) by imazapyr was seen for 2 yr after application (Knezevic et al. Reference Knezevic, Smith, Kulm, Doty, Kincaid, Goodrich and Stolcpart2004), making it a good control option for perennials.
Efficacy of these herbicides can vary with timing of application (Cipollini et al. Reference Cipollini, Anderson, Sandlin and Cipollini2025; Love and Anderson Reference Love and Anderson2009; Weese and Barnes Reference Weese and Barnes2017) and with plant species (Enloe et al. Reference Enloe, Leary, Prince, Sperry and Lauer2020). For example, imazapyr had the most impact on cotton (Gossypium hirsutum L.) during the reproductive stage (Marshall et al. Reference Marshall, Williams and Jones2024). With any use of herbicide, possible effects on non-target native species need to be considered (Douglass et al. Reference Douglass, Nissen, Meiman and Kniss2016; Holmes and Berry Reference Holmes and Berry2009; McAlpine et al. Reference McAlpine, Lamoureaux, Timmins and Wotton2018). Imazapyr can affect untreated non-target plants by root absorption (Kochenderfer et al. Reference Kochenderfer, Zedaker, Johnson, Smith and Miller2001) and has been shown to have more negative impacts on native species than glyphosate during control of L. salicaria (Knezevic et al. Reference Knezevic, Smith, Kulm, Doty, Kincaid, Goodrich and Stolcpart2004). Other studies have found limited non-target effects of herbicide use during the dormant season (Tatina Reference Tatina2015). Native species cover and richness increased after removal of Japanese stiltgrass [Microstegium vimineum (Trin.) A. Camus], with differences among control method (Judge et. al Reference Judge, Neal and Shear2008). Measuring native species response is therefore important when evaluating the success of an ecological restoration project.
Managers actively control infestations of R. ficaria (e.g., Hammerschlag et al. Reference Hammerschlag, Salmons, Kraft, Paul and Hatfield2002; Mack Reference Mack2008). Study of effectiveness of control techniques is limited to one published study with glyphosate applied at a single concentration of 1.35% ai glyphosate (Frey and Schmit Reference Frey and Schmit2017). Control of R. ficaria is complicated by its ephemeral nature and resultant short window of time available for foliar application. A previous study found effective control with early-season application of glyphosate during early flowering and during 50% flowering (Frey and Schmit Reference Frey and Schmit2017). Hammerschlag et al. (Reference Hammerschlag, Salmons, Kraft, Paul and Hatfield2002) recommends the use of 0.81% ai (1.5% v/v) of glyphosate over 2 yr. However, there is some evidence that herbicides with different modes of action may have differing effectiveness according to timing and associated phenological stages of R. ficaria. Mack (Reference Mack2008) anecdotally suggested that glyphosate is less effective when applied during pre-bloom or post-bloom of R. ficaria and further suggested that imazapyr is more effective during these phenological stages. Indeed, Frey and Schmit (Reference Frey and Schmit2017) found that glyphosate was slightly less effective when applied earlier during the pre-flowering stage compared with during 50% flowering. The response of the native communities after R. ficaria removal using different control methods has not been examined, although removal method is known to affect native community response (Cipollini et al. Reference Cipollini, Ames and Cipollini2009; Flory and Clay Reference Flory and Clay2009).
We studied the effects of date of application (pre-flowering, flowering and post-flowering), herbicide type (imazapyr and glyphosate) and herbicide concentration (high and low) on control of R. ficaria at 1 yr after treatment. We also examined the response of the native species cover at 1 yr after treatment to assess possible non-target effects of the control techniques. We hypothesized that the effectiveness of each herbicide in controlling R. ficaria would vary with timing of herbicide application. We expected that glyphosate would be most effective on R. ficaria during flowering and that imazapyr would be most effective during pre- and post-flowering, with stronger effects at higher concentrations. We also posited that the negative non-target effects on native species recovery would be greater with imazapyr, with a greater concentration of herbicide, and at later application dates.
Materials and Methods
We located three geographically distinct forested riparian areas that were infested with R. ficaria in southwest Ohio. Glenwood Gardens (39.2564°N, 84.4742°W) and Lake Isabella (39.2383°N, 84.3017°W) are located ∼15 km apart in the Cincinnati, OH, metro area in two separate watersheds. Lytle Creek (39.4379°N, 83.8518°W) in Wilmington, OH, is ∼45 km to the northeast of the Cincinnati sites. The study sites in Glenwood Gardens and Lake Isabella were in a park and were less disturbed by flooding than the study site on Lytle Creek. The subspecies at each site was Ranunculus ficaria L. var. bulbifera Marsden-Jones (Post et al. Reference Post, Krings, Wall and Neal2009). At each site, we applied a full-factorial design with type of herbicide (glyphosate or imazapyr), concentration of herbicide (low or high), and date of herbicide application (pre-flowering, flowering and post-flowering). For each treatment combination, we treated an area of 4 m2, replicated three times per site. All plots had ∼100% cover of R. ficaria when treated; we did not measure native species cover before spraying, as it was less than 5% at all plots. Sites were treated in 1 yr (2010 at Lytle Creek and 2011 at Glenwood Gardens and Lake Isabella), and response variables were measured in the subsequent year at each site.
We applied treatments on three different dates throughout the growing season. The first set of treatments was applied in mid-March during the pre-flowering growth period of R. ficaria (March 19, 2010, at Lytle Creek, March 22, 2011, at Glenwood Gardens and Lake Isabella). The next treatments were performed in early April during the flowering stage of R. ficaria (April 6, 2010, at Lytle Creek and April 6, 2011, at Glenwood Gardens and Lake Isabella). The final treatments occurred in early May during the post-flowering stage of R. ficaria (May 6, 2010, at Lytle Creek, May 5, 2011, at Glenwood Gardens and Lake Isabella). Table 1 presents the growing degree days (GDD) of each application and measurement day.
Date and growing degree days (GDD) for herbicide treatment application and sampling dates in riparian areas infested with Ranunculus ficaria in southwest Ohio.a

Table 1. Long description
The table presents data on herbicide treatment application and sampling dates for Ranunculus ficaria in two locations: Lytle Creek and Glenwood Gardens and Lake Isabella. It includes three columns: Activity, Date, and Growing Degree Days (GDD). The table has six rows, each representing different activities such as pre-flowering application, flowering application, post-flowering application, measure of R. ficaria cover, and measure of native species cover. The dates and GDD values for each activity are listed for both locations. For example, the pre-flowering application at Lytle Creek occurred on March 19, 2010, with 156 GDD, while at Glenwood Gardens and Lake Isabella, it occurred on March 22, 2011, with 299 GDD. The table highlights the variations in GDD for different activities and locations, providing insights into the growing conditions and treatment timings.
a GDD dates were determined using an online calculator with the temperature data from the closest airport (Columbus for Lytle Creek and Cincinnati for Glenwood Gardens and Lake Isabella), using a base temperature of 0 C and starting date of January 1 (NEWA 2026).
We used two dilutions of the herbicides glyphosate (AquaNeat®, 53.8% ai/39.85% ae, NuFarm Americas, Burr Ridge, IL) and imazapyr (Arsenal®, 27.8% ai/22.6% ae, BASF Corporation, Research Triangle Park, NC). We prepared the concentration levels of the two herbicides through a volume/volume dilution (1.5% v/v for low concentration and 3.0% v/v for high concentration). This led to final active ingredient low and high concentrations of 0.81% ai and 1.62% ai for glyphosate and 0.42% ai and 0.84% ai for imazapyr, respectively. We used volume/volume dilutions instead of percentage of active ingredient because herbicide solutions are prepared this way in practice. We added the non-ionic surfactant Invade™ 90 to the herbicide dilutions (alkylarylpolyoxyethylene, free fatty acids, ether, and isopropanol, 90% ai, Innvictis Crop Care, Loveland, CO). We applied treatments on sunny days using a hand-pump herbicide sprayer commonly available at hardware stores until the leaves were fully saturated. There was no rain for at least 24 h after each application. Any of the very limited native species were avoided when spraying, mimicking application technique in practice (Frey and Schmit Reference Frey and Schmit2017).
In the year following the spraying treatment, we measured percent cover of R. ficaria on April 11 and measured percent cover of native species in mid-June (Table 1). A 0.75-m-diameter circular sampling plot was placed in the center of each treatment plot, and percent cover was estimated visually in 5% increments. We analyzed the data using a four-way ANOVA, with the factors of site, date of application, herbicide type, and herbicide concentration (Minitab, State College, PA). Site was a random factor. Data were rank transformed before analysis to meet model assumptions. Some plots were excluded from our data analyses due to unexpected plot disturbance (e.g., logs, scouring, digging, debris deposition) that occurred in the year after herbicide application. Tukey’s tests at α = 0.05 were performed to determine significant differences between treatments when significance was found in the ANOVA.
Results and Discussion
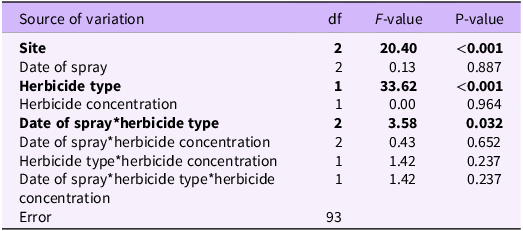
Most treatments reached 95% reduction in cover of R. ficaria (Figure 1). Across all other treatments, the effect of herbicide type was significant (Table 2), with less R. ficaria cover overall in plots treated with imazapyr (2.9 ± 0.1, mean ± SE) than in plots treated with glyphosate (16.3 ± 3.5, mean ± SE). Imazapyr was similarly more effective than glyphosate on the control of the invasives perennial pepperweed (Lepidium latifolium L.) (Boyer and Burdick Reference Boyer and Burdick2010), common reed [Phragmites australis (Cav.) Trin. ex Steud.] (Mozdzer et al. Reference Mozdzer, Hutto, Curtis, Clarke and Field2008), and cogongrass [Imperata cylindrica (L.) P. Beauv.] (Minogue et al. Reference Minogue, Miller and Lauer2012), although the opposite was found for Japanese climbing fern [Lygodium japonicum (Thunb.) Sw.] (Minogue et al. Reference Minogue, Bohn, Osiecka and Lauer2010).
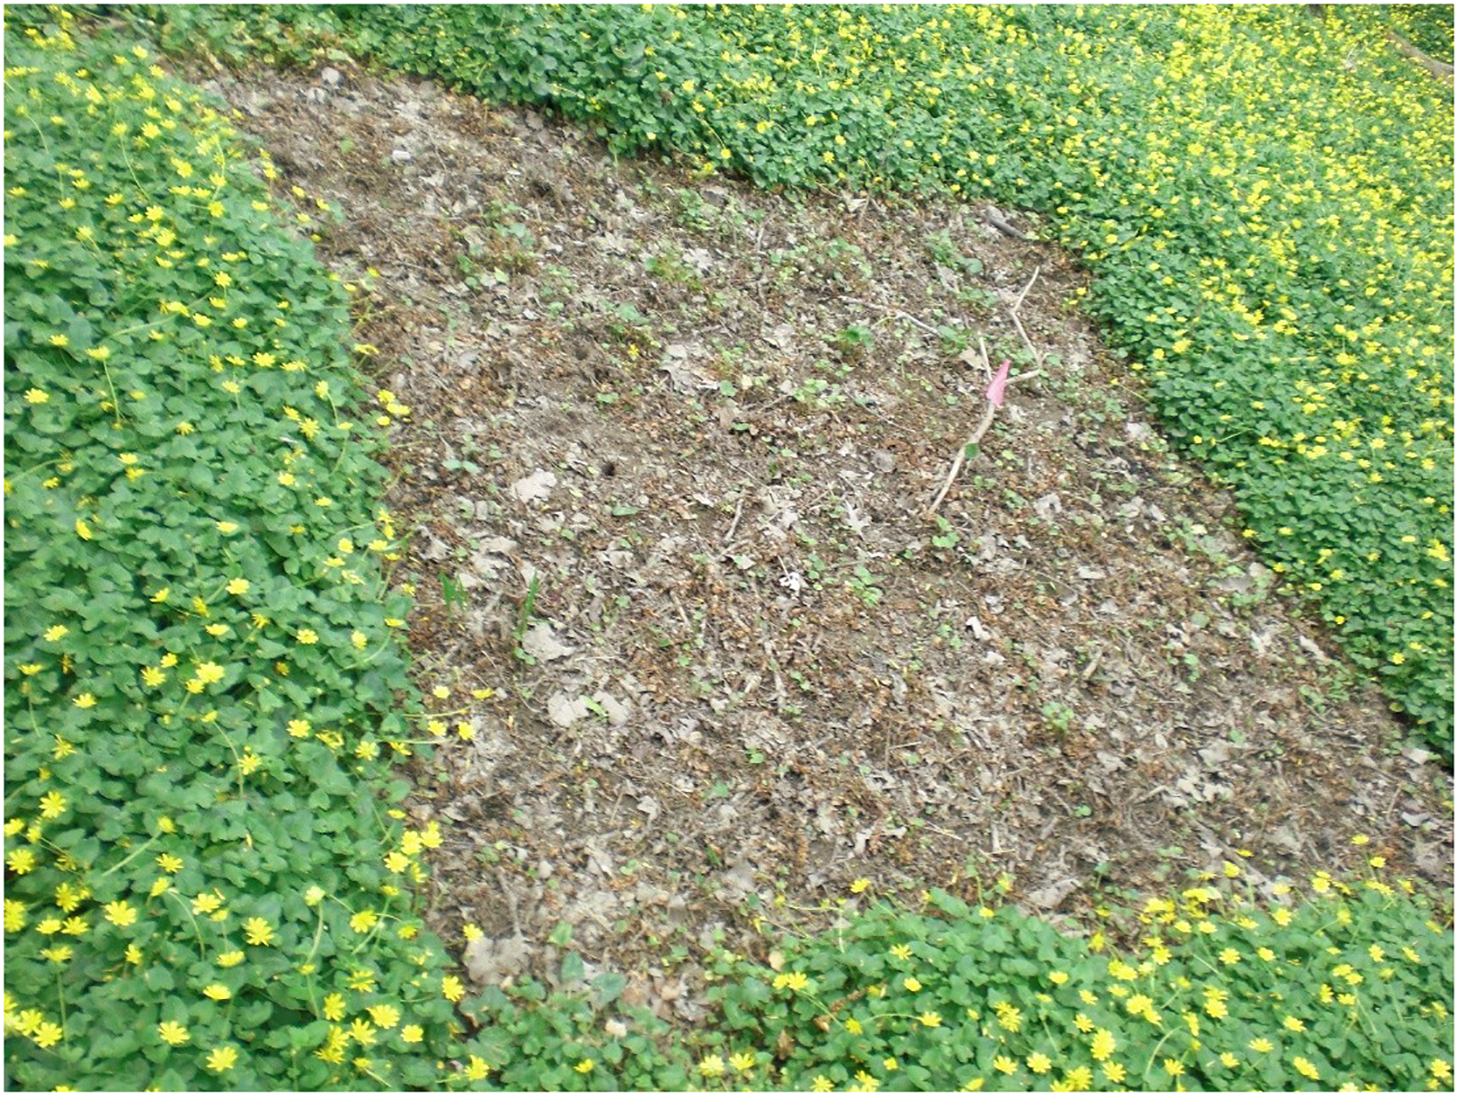
Plot treated in mid-March with glyphosate at 1 yr after treatment at Lytle Creek, showing the reduction of Ranunculus ficaria in the treated plot in the center compared to the untreated surrounding area where Ranunculus ficaria is thriving. Photo was taken in late March before any significant native species growth.
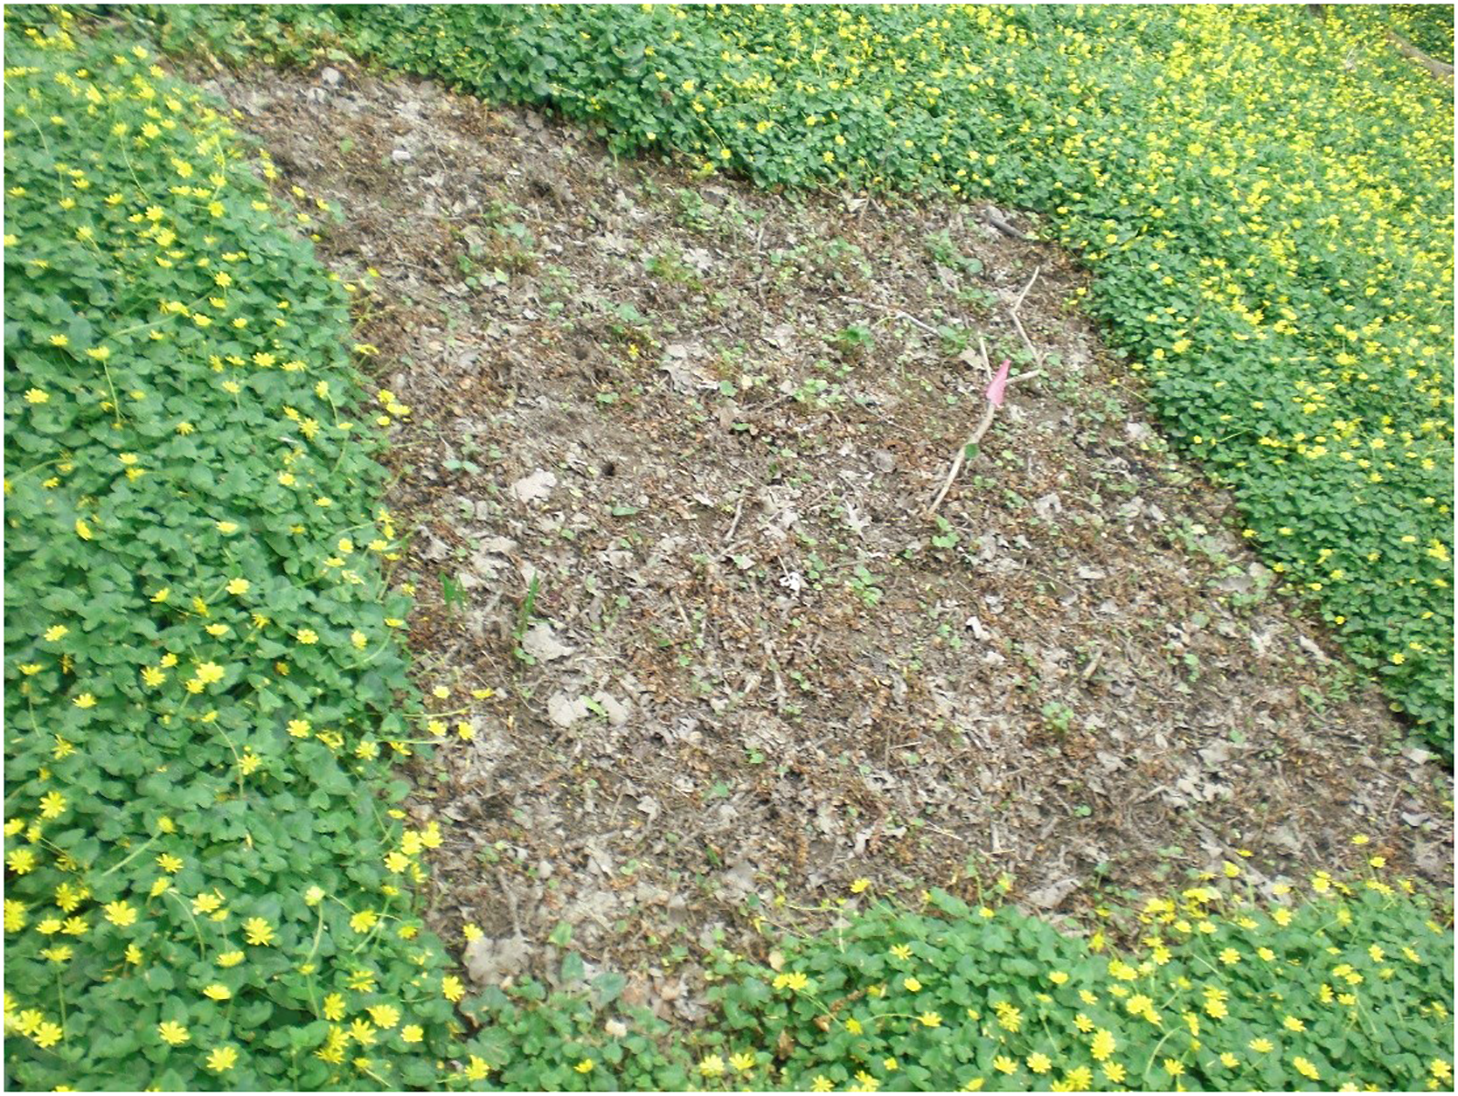
Figure 1. Long description
The image depicts a plot of land that has been treated with glyphosate, a herbicide, one year after the treatment. The area shows a mix of bare soil and sparse vegetation, with some green plants scattered around the edges. The central part of the plot has very little plant growth, indicating the effectiveness of the herbicide in controlling invasive species. The surrounding invasive species vegetation are thriving outside the treated area.
Results of ANOVA for Ranunculus ficaria percent cover at 1 yr after application in southwest Ohio.
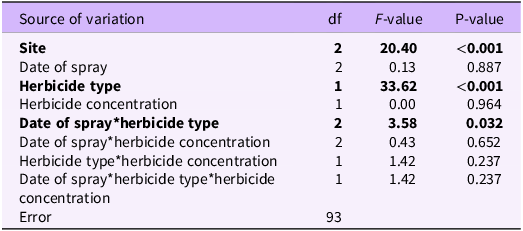
Table 2. Long description
The table presents the results of an ANOVA analysis for the percent cover of Ranunculus ficaria one year after herbicide application in southwest Ohio. It includes sources of variation such as site, date of spray, herbicide type, herbicide concentration, and their interactions. The table has 11 rows and 5 columns, with headers for source of variation, degrees of freedom (df), F-value, and P-value. Notable findings include significant effects of herbicide type and interactions between date of spray and herbicide type, with P-values less than 0.001 for herbicide type and 0.032 for the interaction. The error row has 93 degrees of freedom.
Bold text indicates significance at α = 0.05.
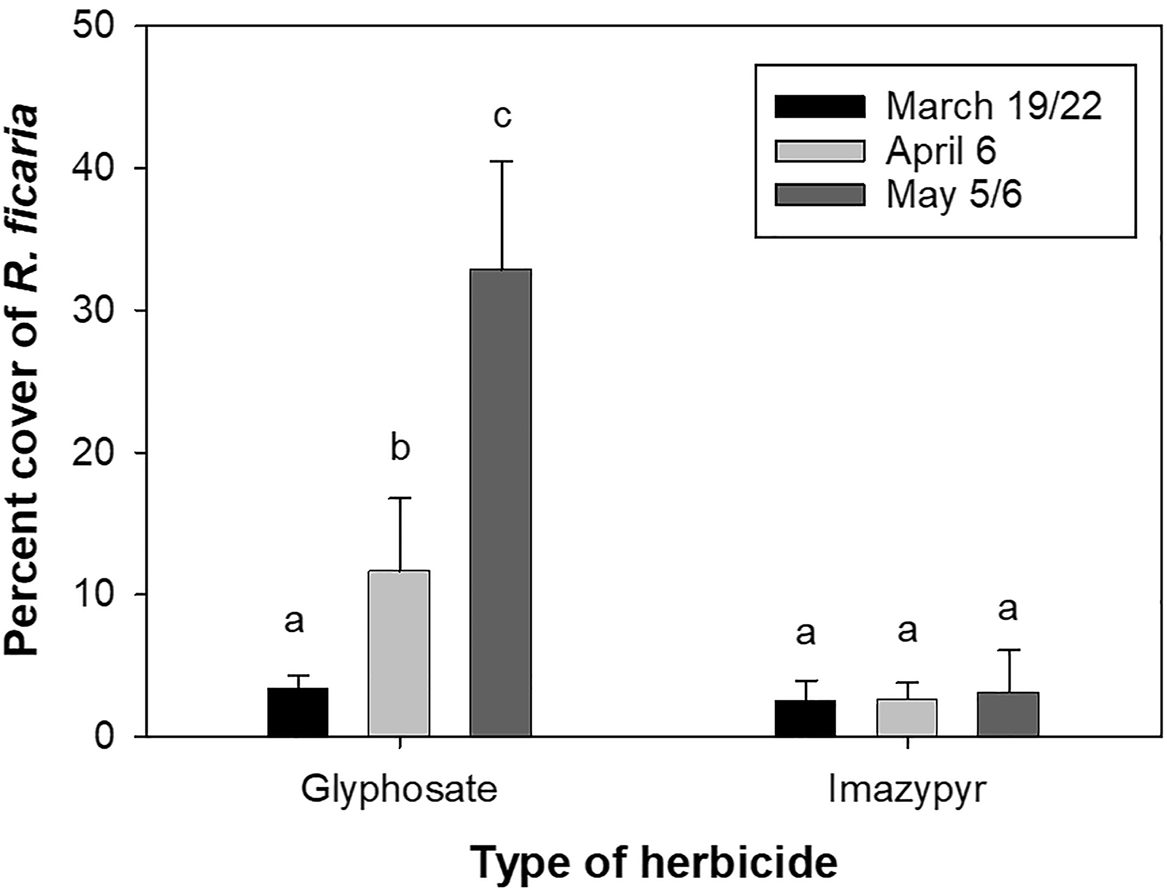
Herbicide efficacy can vary with date of application (Cipollini et al. Reference Cipollini, Anderson, Sandlin and Cipollini2025; Minogue et al. Reference Minogue, Miller and Lauer2012; Mozdzer et al. Reference Mozdzer, Hutto, Curtis, Clarke and Field2008). The interaction between date of spraying and herbicide type was significant across all other treatments (Table 2). Imazapyr effectively controlled R. ficaria on all application dates. In contrast, glyphosate application became less effective as the growing season progressed (Figure 2). These results contradict our hypothesis; we hypothesized that glyphosate would be most effective only during flowering based on the subjective observations of Mack (Reference Mack2008). Decrease in effectiveness over time with glyphosate may be related to the increasing density and overlapping of leaves that we observed during the growing season (KC, personal observation). On the first treatment date, the plants were small and distinct from one another, as the leaves had not fully expanded, allowing saturation of all leaves during application. As the season progressed, the leaves and petioles expanded, and the plants formed an overlapping mass, with herbicide being intercepted by the top layer of leaves. Herbicide effectiveness can decrease as density of target species increases (Dieleman et al. Reference Dieleman, Mortensen and Martin1999; Taylor and Hartzler Reference Taylor and Hartzler2000), likely due to overlapping leaves inhibiting the distribution of herbicide to all plants. Imazapyr was effective throughout the season, possibly due to intercepting leaves being less of an issue for this herbicide with longer soil-residual times (Newton et al. Reference Newton, Cole and Tinsley2008; Shaner Reference Shaner2014) that lead to systemic action from root uptake (Huripurshad et al. Reference Huripurshad, Beckett and Campbell2018). Imazapyr controlled L. salicaria (Knezevic et al. Reference Knezevic, Smith, Kulm, Doty, Kincaid, Goodrich and Stolcpart2004) and reed canarygrass (Phalaris arundinacea L.) (Bahm et al. Reference Bahm, Barnes and Jensen2014), with control lasting for two seasons after application. Frey and Schmit (Reference Frey and Schmit2017) found similar efficacy with glyphosate at a concentration of 1.35% ai on R. ficaria early in the season; their study, however, was limited to time periods up to 50% flowering in early April. Weese and Barnes (Reference Weese and Barnes2017) found that glyphosate application in midwinter (January to February) was more effective on control of the woody vine Japanese honeysuckle (Lonicera japonica Thunb.) than application in early April, with imazapyr having similar efficacy during both application dates, similar to our results. Knezevic et al. (Reference Knezevic, Rapp, Datta and Irmak2013) also found that imazapyr was equally effective across multiple dates, while glyphosate efficacy varied with date for control of P. australis.
Percent cover of Ranunculus ficaria at 1 yr after application of glyphosate or imazapyr on three different application dates, across three sites in southwestern Ohio. Imazapyr was effective each application date. Glyphosate effectiveness was most effective early in the growing season. Means with the same letters are not significantly different according to Tukey’s test at α = 0.05.
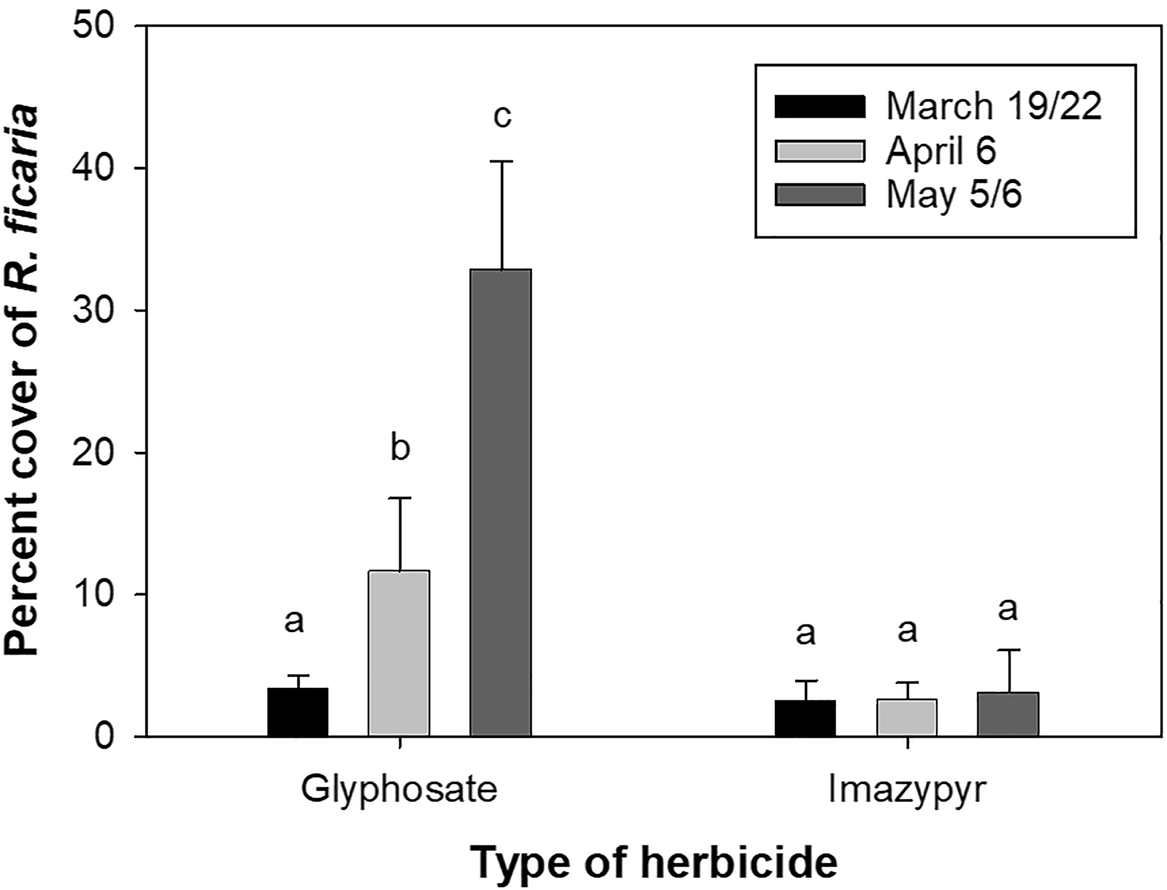
Figure 2. Long description
The bar graph compares the percentage cover of Ranunculus ficaria after applying glyphosate or imazapyr on three different dates. The x-axis represents the type of herbicide, with two categories: Glyphosate and Imazypyr. The y-axis represents the percentage cover of Ranunculus ficaria, ranging from 0 to 50. There are three data series represented by different colors: black for March 19/22, gray for April 6, and dark gray for May 5/6. For Glyphosate, the percentage cover increases from approximately 5 in March to approximately 15 in April and reaches around 40 in May. For Imazypyr, the percentage cover remains relatively low and consistent across all three dates, around 5. The graph includes error bars indicating variability in the data. Means with the same letters are not significantly different according to Tukey’s test at alpha equals 0.05. All values are approximated.
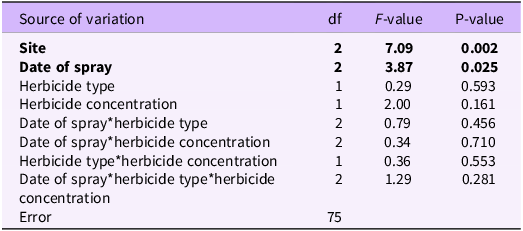
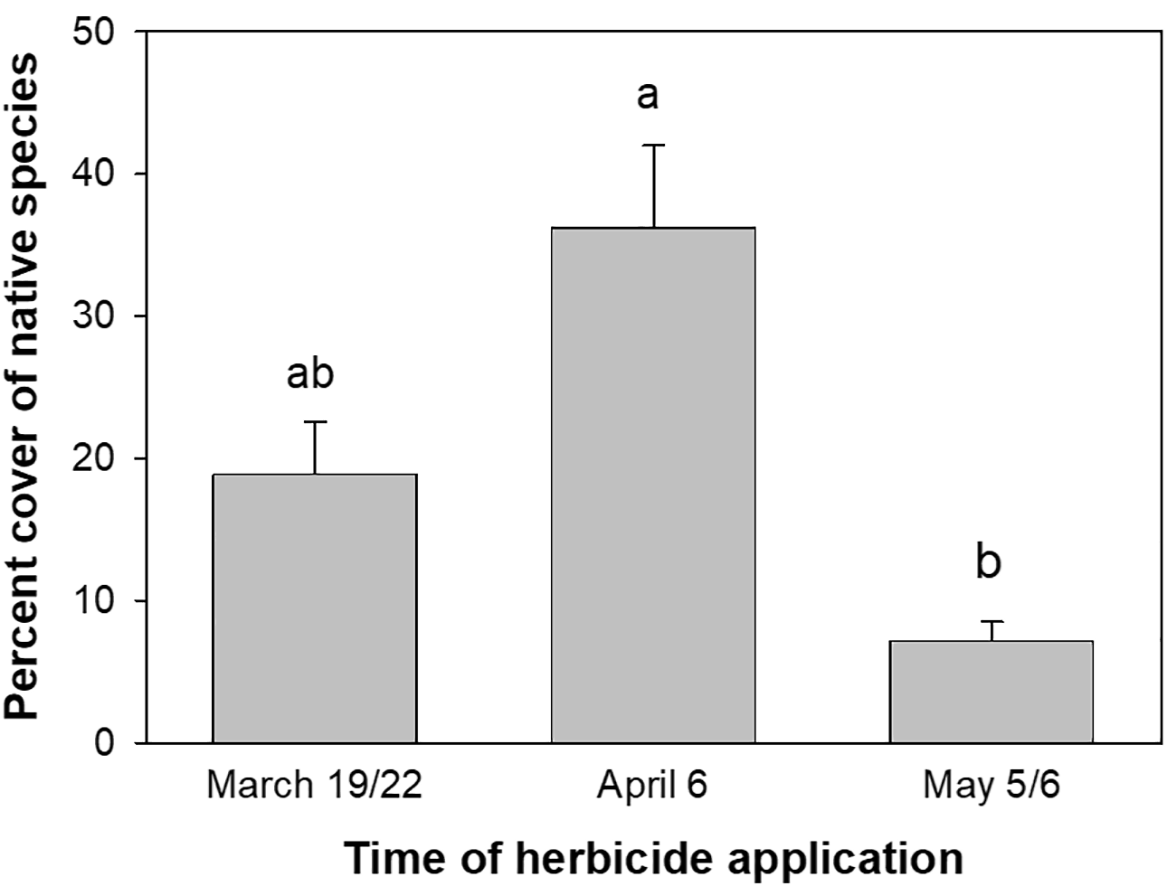
For the response of native species, the date of application was significant, across all herbicides, concentrations, and sites (Table 3). Native species cover was highest on plots sprayed during flowering on April 6 and lowest on plots sprayed post-flowering in early May, with plots sprayed pre-flowering in mid-March intermediate between the two (Figure 3). Native species that were found in the experimental plots at 1 yr after treatment included Virginia creeper [Parthenocissus quinquefolia (L.) Planch.], jewelweed (Impatiens capensis Meerb.), clearweed [Pilea pumila (L.) A. Gray], clustered black snakeroot [Sanicula odorata (Raf.) K.M. Pryer & L.R. Phillippe], smartweed (Polygonum pensylvanicum L.), black cherry (Prunus serotina Ehrh.), and red maple (Acer rubrum L.). We expected application post-flowering to have the most negative effects, as more native species have begun to emerge at that time. Because herbicides are absorbed and active in metabolically active tissues, non-target impacts can be minimized or avoided by spraying when native species are still dormant (Frey et al. Reference Frey, Herms and Cardina2007; Frey and Schmit Reference Frey and Schmit2017; Tatina Reference Tatina2015). We did not find other invasive species being released by the removal of R. ficaria as has been seen in other studies (Cipollini et al. Reference Cipollini, Ames and Cipollini2009; Frey and Schmit Reference Frey and Schmit2017). However, these sites have yet to be extensively invaded by M. vimineum, one species that benefited from removal of R. ficaria (Frey and Schmit Reference Frey and Schmit2017).
Results of ANOVA for percent cover of native species at 1 yr after application in southwest Ohio.
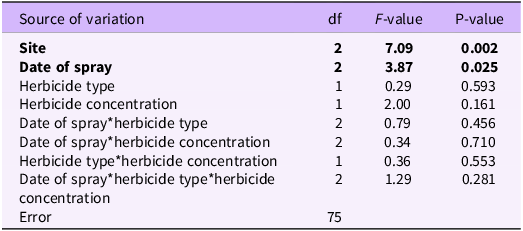
Table 3. Long description
The table presents ANOVA results for the percent cover of native species in southwest Ohio one year after herbicide application. It includes sources of variation such as site, date of spray, herbicide type, herbicide concentration, and their interactions. The table has 11 rows and 5 columns, with columns for source of variation, degrees of freedom, F-value, and p-value. Notable findings include significant effects of site and date of spray on native species cover, with p-values of 0.002 and 0.025 respectively. Other factors like herbicide type, concentration, and their interactions show non-significant p-values, indicating lesser impact.
Bold text indicates significance at α = 0.05.
Native species percent cover ∼at 1 yr after herbicide application in mid-June. Cover was greatest when herbicides were applied during flowering in early April and least when herbicides were applied post-flowering in early May. Means with the same letters are not significantly different according to Tukey’s test at α = 0.05.
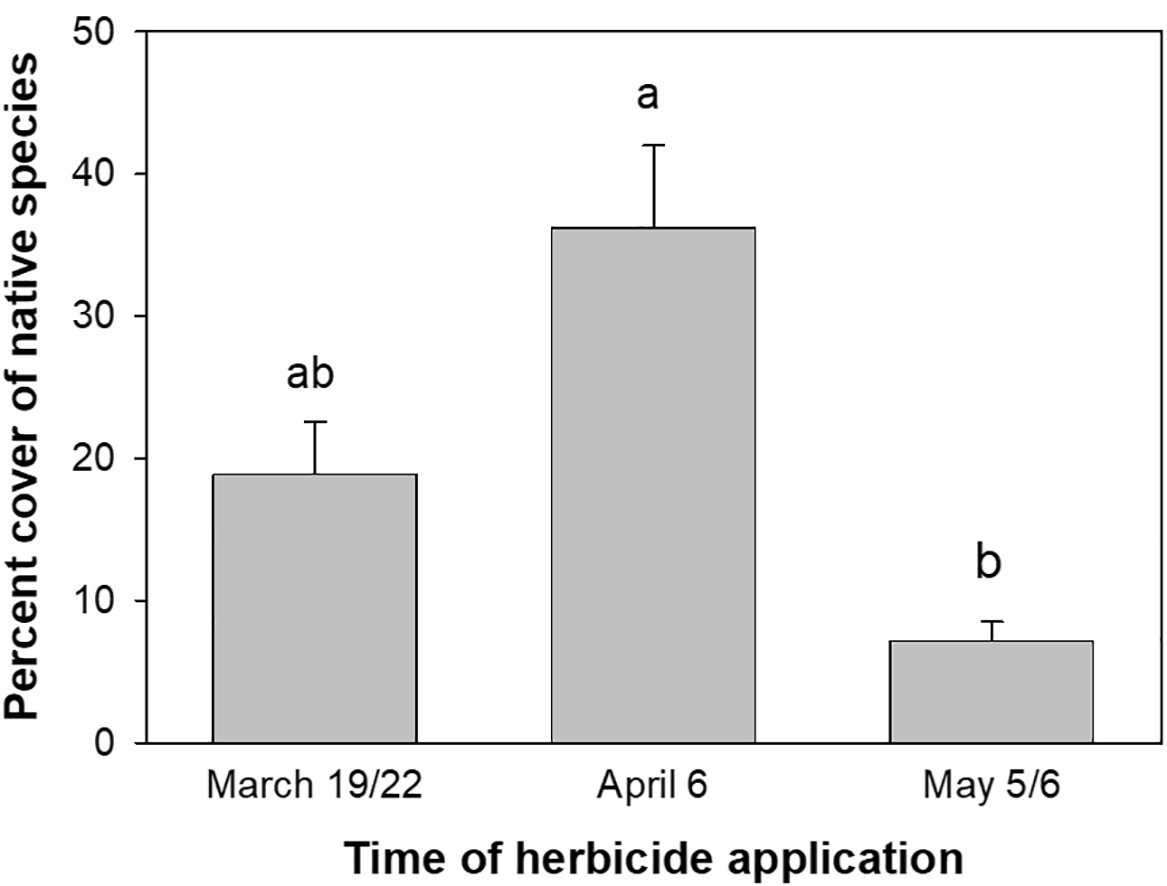
Figure 3. Long description
The bar graph compares the percentage cover of native species at one year after herbicide application in mid-June. The x-axis represents the time of herbicide application with three data points: March 19/22, April 6, and May 5/6. The y-axis shows the percentage cover of native species, ranging from 0 to 50. There are three vertical bars, each representing a different time of herbicide application. The bar for April 6 shows the highest percentage cover of native species, approximately 40, and is labeled with the letter ‘a’. The bar for March 19/22 shows a percentage cover of around 20 and is labeled with ‘ab’. The bar for May 5/6 shows the lowest percentage cover, approximately 10, and is labeled with ‘b’. The graph indicates that herbicide application during flowering in early April results in the greatest cover of native species, while application post-flowering in early May results in the least cover. Means with the same letters are not significantly different according to Tukey’s test at alpha equals 0.05. All values are approximated.
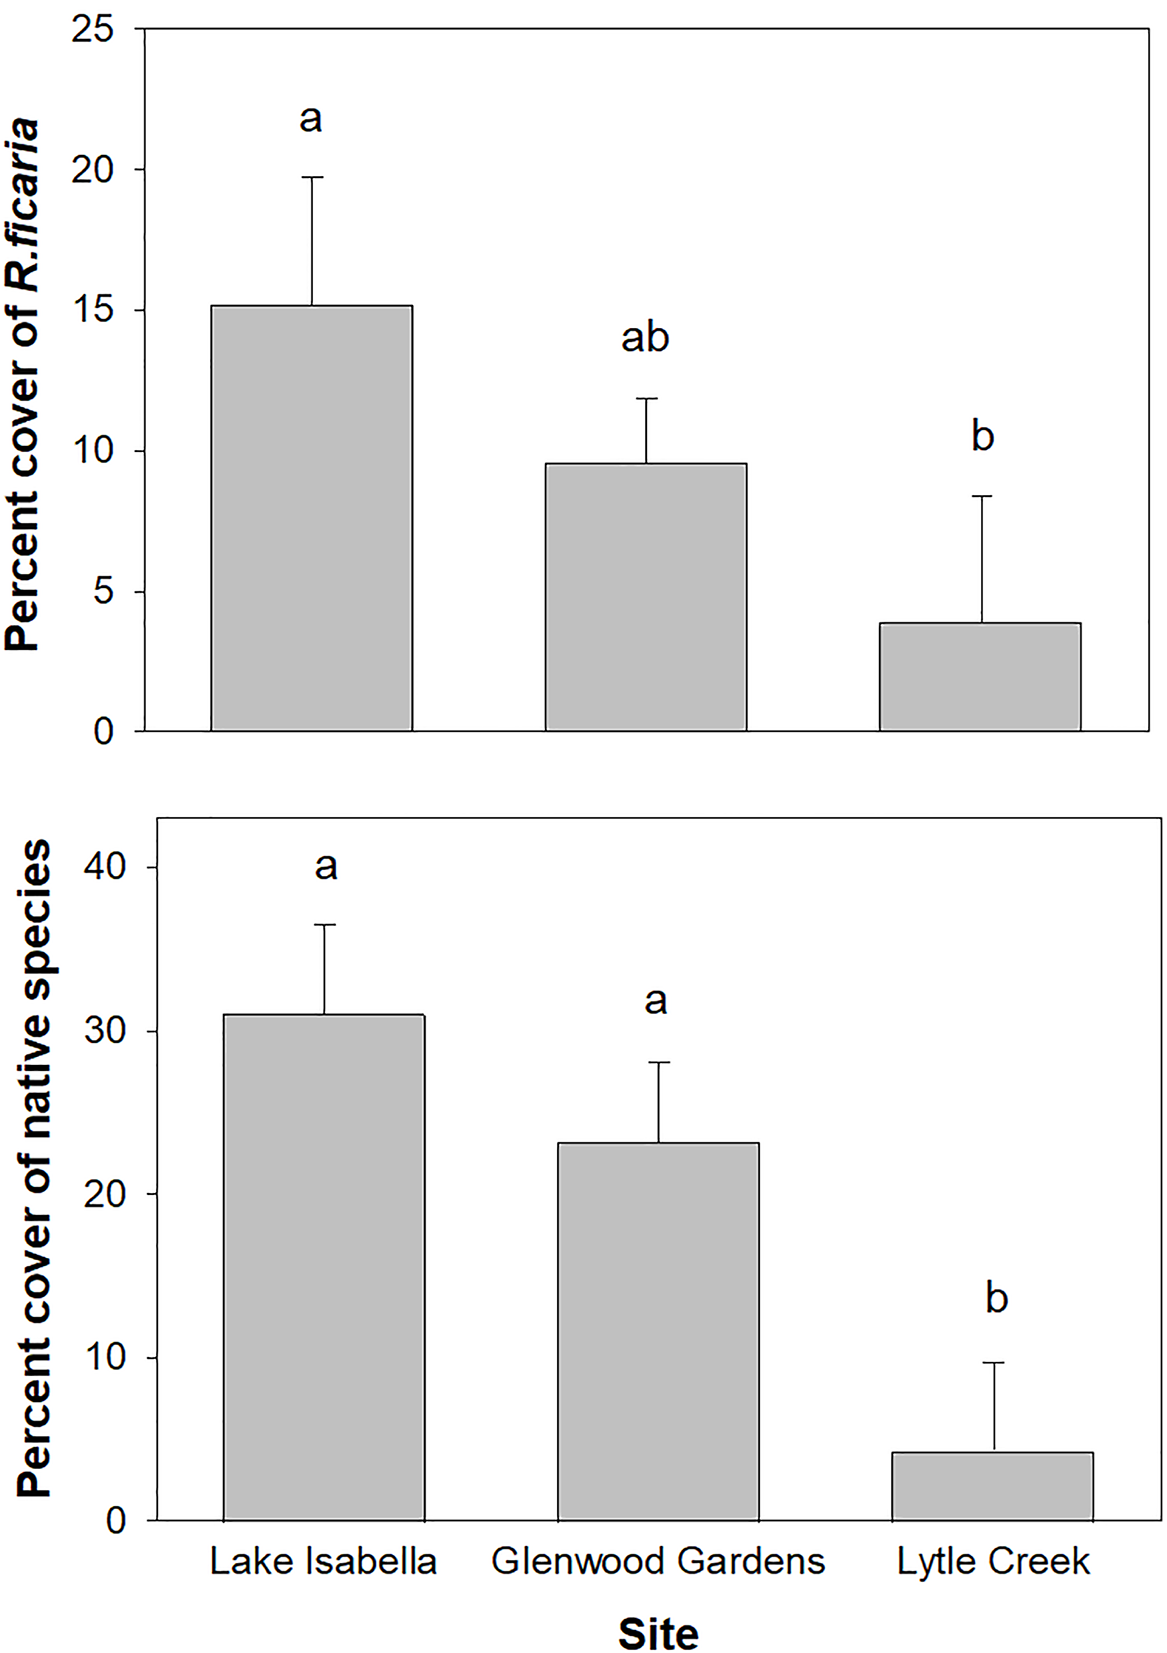
We found differences between sites in the efficacy of control and subsequent response of native species. Across all treatments, percent cover of R. ficaria was significantly affected by site (Table 2), with the greatest overall control at Lytle Creek (Figure 4). Percent cover of native species was also significantly affected by site (Table 3), with the lowest overall percent cover of native species at Lytle Creek (Figure 4). Understanding differences among sites was not a goal of our study; rather, we used multiple sites as a random factor to find a generalized recommendation for application that was not site specific. Differences in R. ficaria control and native species response between sites may be related to phenological differences in timing of treatment application due to yearly variation in growing season, to different local climatic conditions between the geographically distanced sites, or to differences in ecosystem characteristics at each site. For example, it is known that soil texture and slope can affect abundance and reproduction of R. ficaria (Kermack and Rauschert Reference Kermack and Rauschert2019). Lytle Creek is furthest north, had later phenological application times (Table 1) and the most disturbance, and is thus distinct from the other two more southern sites.
Percent cover of Ranunculus ficaria and percent cover of native species at each site at 1 yr after treatment. Lytle Creek had the highest amount of R. ficaria control and the lowest amount of subsequent native species cover. Means with the same letters are not significantly different according to Tukey’s test at α = 0.05.
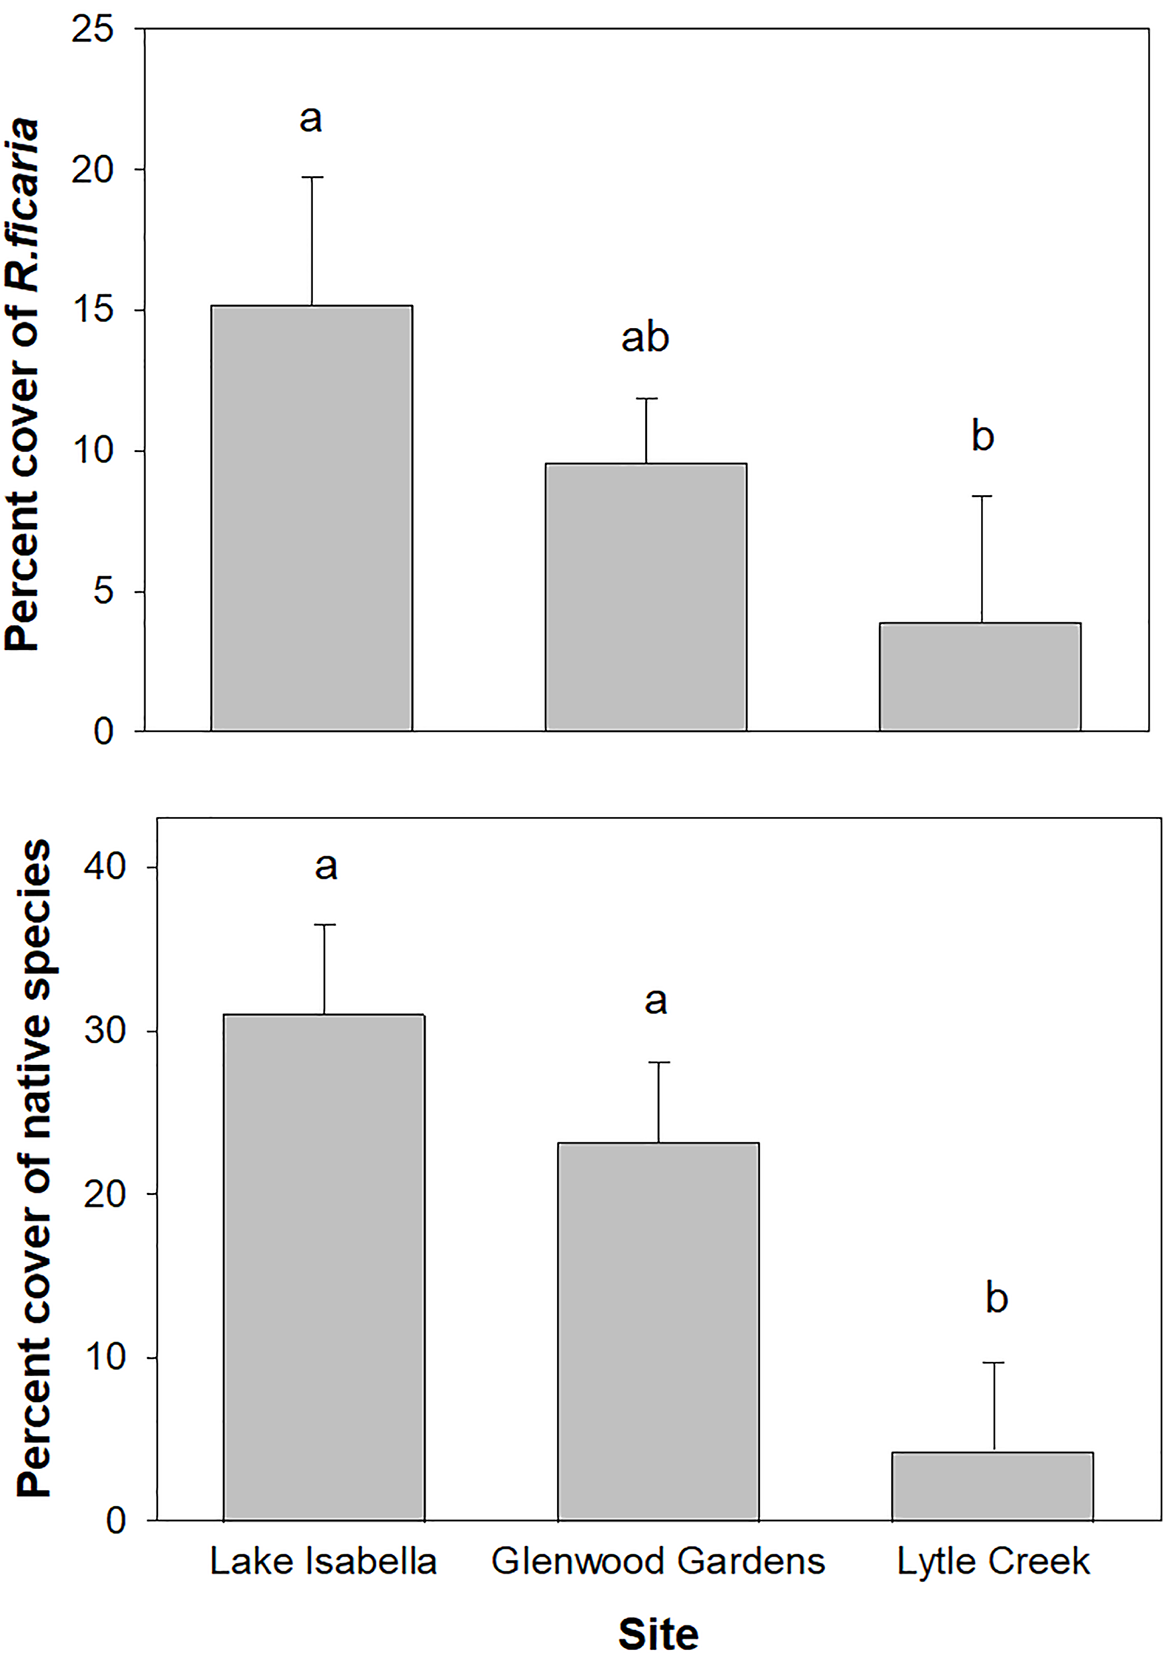
Figure 4. Long description
The bar graph consists of two sets of vertical bars, each representing different data points for three sites: Lake Isabella, Glenwood Gardens, and Lytle Creek. The top graph shows the percentage cover of Ranunculus ficaria, with Lake Isabella having the highest cover at approximately 15 percent, Glenwood Gardens around 10 percent, and Lytle Creek the lowest at around 5 percent. The bottom graph displays the percentage cover of native species, with Lake Isabella and Glenwood Gardens both showing around 30 percent and 25 percent respectively, while Lytle Creek has the lowest cover at around 5 percent. The bars are labeled with letters indicating statistical significance, where bars with the same letter are not significantly different according to Tukey’s test at alpha equals 0.05. All values are approximated.
We did not find any effects of herbicide concentration on control of R. ficaria (Table 2) or on response of native species (Table 3), contrary to our predictions. Other studies have found effects of increasing concentration on control of other invasive species (e.g., Cipollini et al. Reference Cipollini, Anderson, Sandlin and Cipollini2025), perhaps indicating that the higher doses that we used in our study exceeded the maximum effective dose (Harrington and Miller Reference Harrington and Miller2005). We found similar effectiveness of glyphosate at a concentration that was 40% less than that used by Frey and Schmit (Reference Frey and Schmit2017). Using a lower concentration means a lower cost of application, an important consideration in ecological restoration (Iacona et al. Reference Iacona, Sutherland, Mappin, Adams, Armsworth, Coleshaw, Cook, Craigie, Dicks, Fitzsimons, McGowan, Plumptre, Polak, Pullin and Ringma2018).
Taking all results into consideration, we recommend the use of 1.5% v/v of Arsenal® (0.81% ai imazapyr), applied during the flowering period in early April. Application of 1.5% v/v of AquaNeat® (0.42% ai glyphosate) or Arsenal® in mid-March before flowering would have a similar impact, although native species recovery may be slightly less optimal. However, the current cost of Arsenal® is more than twice the cost of AquaNeat®, based on Internet retail costs. If cost of materials is an issue, we would thus recommend the application of glyphosate pre-flowering in mid-March. If labor cost is an issue, we recommend application of imazapyr, as it would require less reapplication due to longer residual effects. We do not recommend application of herbicides post-flowering in early May due to effects on non-target native species.
It is important to note that no treatment was 100% effective in controlling R. ficaria. Spot treatment in subsequent years will be necessary to control any remaining plants and prevent reestablishment. Additionally, a large amount of reproduction in this species appears to be asexual, as no achenes were produced in one study (Kermack and Rauschert Reference Kermack and Rauschert2019), and asexual bulbils produced and released by the plant readily germinate (Verheyen and Hermy Reference Verheyen and Hermy2004). Fragments of aquatic plants can also be transported via hydrochory or water dispersal (Riis and Sand-Jensen Reference Riis and Sand-Jensen2006), with streams serving as corridors for invasive species (Aronson et al. Reference Aronson, Patel, O’Neill and Ehrenfeld2017). For R. ficaria, genetic structure suggests hydrochory is occurring (Mattingly et al. Reference Mattingly, Day, Rauschert, Tayal and Hovick2023). Production of large amounts of bulbils, coupled with hydrochory, means that floodplains will be continually invaded from upstream infestations, requiring continued treatment of new populations downstream.
Our study is limited by its short time span. Native cover was measured just once in mid-June. We measured at this time because it has been hypothesized that R. ficaria may have the largest effects on spring species (Axtell et al. Reference Axtell, DiTommaso and Post2010). Longer studies of invasive species control and subsequent response of native species are needed (Kettenring and Adams Reference Kettenring and Adams2011), as R. ficaria can have effects on a native species that only overlaps with R. ficaria during the growing season for a brief period (Cipollini and Schradin Reference Cipollini and Schradin2011). Because there were differences observed between sites in control and in native species response, further research should aim to examine the reasons for these differences in order to create more site-specific recommendations for control of R. ficaria.
Acknowledgments
Tom Borgman provided advice on research locations. Don Maher with the City of Wilmington provided access to research locations. Lori Askeland provided support during a writing workshop. We thank two anonymous reviewers for comments that improved the article.
Funding statement
Hamilton County Park District provided funding for this research.
Competing interests
The authors declare no conflicts of interest.


 Open access

