


1. Introduction
In design education, project work is commonly organized in teams to mirror the complexity and ambiguity of professional practice (Reference FleischmannFleischmann, 2022). Previous research has also shown that working in teams helps to raise learning success by enabling cross-learning and broadening a student’s problem-solving strategies (Reference Kastas UzunKastas Uzun, 2020). However, the overall performance of a team depends on many factors: shared understanding of goals and processes (Reference Aubé, Rousseau and TremblayAubé et al., 2015), effective cooperation (Reference McDonoughMcDonough, 2000), high-quality communication and sound collective decision-making (Reference Ryder-SmithRyder-Smith, 1999). Research suggests that these are in turn are affected by the personalities in a team. Personality traits influence one’s core communication skills, including active listening and assertiveness, which are foundational for teamwork (Reference Hassan, Sumardi and AzizHassan et al., 2019). Understanding personality differences can strengthen a team’s interpersonal dynamics and foster collaboration (Reference Filbeck and SmithFilbeck & Smith, 1997) whereas unmanaged differences within a team can escalate task-related conflicts and undermine progress in doing complex projects (Reference Bradley, Klotz, Postlethwaite and BrownBradley et al., 2013; Reference D’Silva, Ortega and SulaimanD’Silva et al., 2016).
The often used studio model for design projects is effective for exploration and iteration but is highly dependent on instructors’ teaching styles and students’ traits (Reference Dannels and MartinDannels & Martin, 2008). In studio learning, there is more emphasis on students’ autonomy in learning (Reference Kokotsaki, Menzies and WigginsKokotsaki et al., 2016). Therefore, students’ interactions within their teams are important to maximizing students’ learning in design projects (Reference Ejichukwu, Tolbert Smith and AyoubEjichukwu et al., 2024).
It seems therefore opportune to investigate links between the combination of personality traits in a team and the team’s design performance. Many types of personality test exist, such as the Big Five Personality Traits Test (Big5), the Sixteen Personality Factor Questionnaire (16PF), and the Myers-Briggs Type Indicator (MBTI) (Reference CherryCherry, 2024). These tests differ in historical origins, theoretical basis, and intended applications, such as clinical diagnosis, tracking personality changes, or screening candidates for employment (Reference CherryCherry, 2024).
At Singapore University of Technology and Design (SUTD), our case study, all undergraduate students who are admitted are required to do the MBTI (for findings see Reference Hendra, Blessing, Silva and AngHendra et al., 2025) and Big5 test to help distribute them uniformly into so called ‘cohorts’ during their first (freshmore) year of studies. In this paper we focus on the Big5 test. Big5 is one of the most validated personality tests across different age groups and populations (Reference Donnellan, Oswald, Baird and LucasDonnellan et al., 2006; Reference Shkembi, Treska and XhomaraShkembi et al., 2024). Many studies have shown that Big5 traits are correlated to performance, team collaboration, and individual motivation, both in educational and professional settings (Reference Bidjerano and DaiBidjerano & Dai, 2007; Reference MammadovMammadov, 2021; Reference Salgado and TáurizSalgado & Táuriz, 2014).
The exploratory research described in this paper aims to investigate whether, in the context of first-year “Introduction to Design” course, the combination of personality traits in a design project team affects a team’s performance in terms of their final grade. Our hypotheses are the following:
-
1. A student’s Big5 trait score(s) is (are) correlates to their team’s design project performance, measured by the team’s final grade.
-
2. A design team’s mean Big5 trait score(s) (the average of members’ Big5 trait scores) correlates to their design team’s performance.
-
3. A design team’s within-team standard deviation in Big5 trait score(s) correlates to the team’s performance.
2. Background
2.1. Big Five (Big5) personality traits test
Big5 is a psychological framework that categorizes personality into five broad domains: Openness, Conscientiousness, Extraversion, Agreeableness, and Neuroticism (Reference DziakDziak, 2024). The Big5 test scores each trait between 0 and 100, that is, instead of sorting people into “types”, people are compared with the mean within each trait (TRUITY, 2025). Reference Power and PluessPower and Pluess (2015) describe the five traits as such:
-
• “Openness (O)” (also referred to as openness to experience) emphasizes individual’s imagination and ability to make insights.
-
• “Conscientiousness (C)” is defined by high levels of thoughtfulness, good impulse control, and goal-directed behaviours.
-
• “Extraversion (E)” (or extroversion) is characterized by excitability, sociability, talkativeness, assertiveness, and high amounts of emotional expressiveness.
-
• “Agreeableness (A)” includes attributes such as trust, altruism, kindness, affection, and other prosocial behaviours.
-
• “Neuroticism (N)” is characterized by sadness, moodiness, and emotional instability.
As mentioned before, the Big5 model has been validated through robust research across different age groups and populations (Reference Donnellan, Oswald, Baird and LucasDonnellan et al., 2006; Reference Shkembi, Treska and XhomaraShkembi et al., 2024), and has broad applicability across sectors. In workplace environments, it is used to forecast job performance, suitability for various roles, and responsiveness to training initiatives (Reference Barrick and MountBarrick & Mount, 1991; Reference Salgado and TáurizSalgado & Táuriz, 2014). Within educational settings, it is effective for predicting academic success and understanding how students manage their learning. However, Big5 has some limitations. Non-clinical tests (such as in our research) rely on self-reporting, making it vulnerable to social desirability bias and inaccurate self-perception (Reference Wood, Anglim and HorwoodWood et al., 2021). Relevant in our context are the issues Big5 has with dispositional trait-descriptive words and cross-cultural applicability outside Europe and the USA (Reference De Raad and MlačićDe Raad & Mlačić, 2020).
2.2. Big5 and individual performance
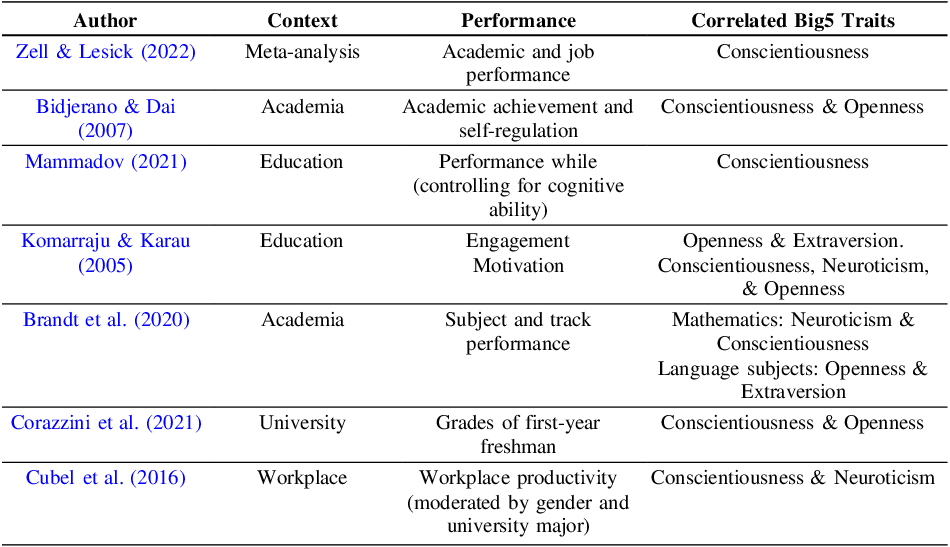
Research has shown the following correlations of Big5 traits with individual performance. Some findings are summarized in the Table 1 below.
Summary of literature findings on Big5 and individual’s performance

In summary, research has shown that while Big5 trait-performance correlations vary by domain and context, “conscientiousness” tends to emerge as a good predictor of individual performance.
2.3. Big5 and team performance
Big5 is closely linked to how teams function interpersonally, shaping underlying team processes and members’ self-efficacy for teamwork (Reference Schaffer and ManegoldSchaffer & Manegold, 2024). When teams understand their members’ Big5 test results this can help them to build trust and collaborate more effectively through making the interpersonal differences explicit and manageable (Reference Murmu and NeelamMurmu & Neelam, 2022). Reference Peeters, Van Tuijl, Rutte and ReymenPeeters et al. (2006) found that across various student and professional samples, higher mean “agreeableness” and “conscientiousness” scores within a team tend to improve team performance. They also found that a team’s satisfaction is primarily shaped by similarity in “agreeableness” and “neuroticism” while dissimilarity in “conscientiousness” of a team’s members can be detrimental to the team’s performance (Reference Peeters, Van Tuijl, Rutte and ReymenPeeters et al., 2006). Reference Jolić Marjanović, Krstić, Rajić, Stepanović Ilić, Videnović and Altaras DimitrijevićJolić Marjanović et al. (2024) confirmed these findings in a collaborative problem-solving context: a team’s mean “conscientiousness” and “agreeableness” scores correlated to better team performance. Their research highlights that “conscientiousness” specifically aligns with task role management, task-focused processes and overall performance, whereas “agreeableness” correlates to social role enactment, relationship-oriented processes and emergent states (Reference Jolić Marjanović, Krstić, Rajić, Stepanović Ilić, Videnović and Altaras DimitrijevićJolić Marjanović et al., 2024). Overall, evidence suggests that a team’s mean “conscientiousness” and “agreeableness” scores are associated with more effective coordination, greater satisfaction, and better performance within team settings.
3. Methodology
3.1. Design project
The study in this paper focused on the first-year course “Introduction to Design,” mandatory for all students at Singapore University of Technology and Design, which spans 14 weeks and introduces students to the fundamentals of design thinking using the Double Diamond framework (UK Design Council, 2024). As part of the course, students are required to work in a team on a design project based on a theme, rather than a design brief, allowing each team the freedom to interpret and define the problem in their own way. The theme of the analyzed course was “Interacting with Light.” The course involves one lecture and two consultation sessions per week of each team with their two class instructors.
Team performance in our study is represented by the final project grade of the team, which consists of four components according to the four stages of the project: discovering the problem (15%), defining the problem (15%), developing ideas (20%), and delivering the final prototype (50%). The first three components are graded by the class instructors of the team. The last component is graded by two class instructors from one or two other cohorts, who were not involved in the weekly consultations.
3.2. Participants
Of the 550 students enrolled in the “Introduction to Design” course, 535 students (97%) participated in the study, even though participation was voluntary and no incentives were provided. The enrolled students were free to form their own teams, each comprising four to six members of their cohort (a cohort has a maximum of 50 students), resulting in a total of 108 teams. Out of the 15 students who did not wish to participate in the study, 14 teams were affected. These teams were removed from the analysis. Resulting in a total of 535 participants for individual-level analysis and 94 teams for team-level analysis. The study had received approval from SUTD’s Institutional Review Board (IRB).
3.3. Data collection
The data was obtained from the university’s student administration. This included: the results of the Big Five Personality Test (TRUITY, 2025) of the 535 students, which they did four months prior to our study, right after they were admitted to SUTD (see Section 1), their cohort number, design team name and design team grade.
3.4. Data analysis
For individual-level analysis, the relationship between the Big5 trait scores and student grades (which is the grade obtained by their team) were analyzed through linear regression to investigate Hypothesis 1 (see Section 1).
For team-level analysis, the relationship between the mean Big5 trait scores of the team members and the team grades was analysed through linear regression to investigate Hypothesis 2. Similar linear regression analysis was done with the within-team Big5 standard deviation scores and the team grades to investigate Hypothesis 3.
To visualise the distribution of the personality traits of the participants (both individual and team data), binning was used. The raw data was first split into bins of 10, e.g: more than 0 and less than or equal to 10, more than 10 and less than or equal to 20, etc. For each bin, the number of teams whose mean score fell within that range was computed (e.g the number of teams with mean “extraversion” trait between 20 to 30 is twenty teams). These bin counts were then plotted using the midpoint of the bin (e.g bin 20 to 30 is plotted at 25). The best fit curve is plotted using these points (see Figure 1 and Figure 2 in Section 4).
4. Results
4.1. Big5 and individual performance
The distribution of the individual Big5 traits scores is shown in Figure 1 (created as described in Section 3.4). Figure 1 shows that the individual Big5 trait scores are not normally distributed.
Big5 traits distribution for individual students -10-point bin (N=535 students)

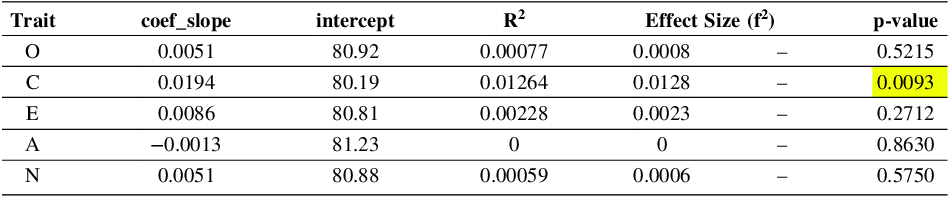
Linear regression analysis was used to examine whether individual student’s Big5 personality traits correlate with design performance, i.e. the grade of the student’s team The results are shown in Table 2. For each analysis, the estimated slope, y-intercept, coefficient of determination (R2), effect size (f2) and statistical significance coefficient (p-value).
Linear regression analysis between individual Big5 score and team grade (N=535 students) for each trait

This individual-level result shows that “conscientiousness” has a statistically significant (p-value<0.05) positive correlation with performance (measured as the grade of the student’s team), with slope 0.0194 and p-value=0.0093. The result indicates that a 10-point (out of 100) increase in a student’s “conscientiousness” score is associated with roughly a 0.19-point (out of 100) increase in the final grade. Although seemingly of little practical significance (about 0.2% increase), in the context of the range of grades (for these teams from 90 to 67) and their translation into letter grades (in this case from A+ to D), every 0.1 grade difference can result in a higher or lower letter grade.
4.2. Big5 and design team performance
At team-level, the distribution of the mean Big5 trait scores of its team members is shown in Figure 2. Compared to the individual-level distribution (Figure 1) where there is no clear distribution, the team-level distribution shows a more normal distribution, in this case unimodal distribution for “extraversion”, “agreeableness”, and “neuroticism”, and bimodal distribution for “openness” and “conscientiousness”.
Big5 traits distribution for teams - 10-point bin (N=94 teams)

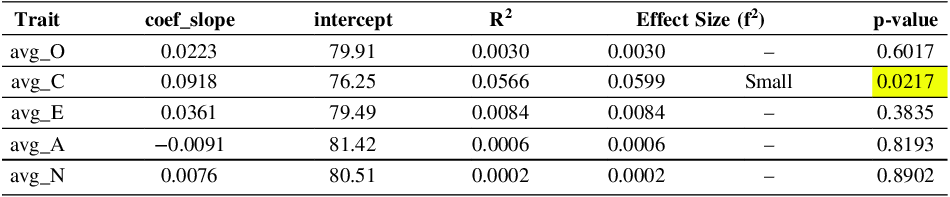
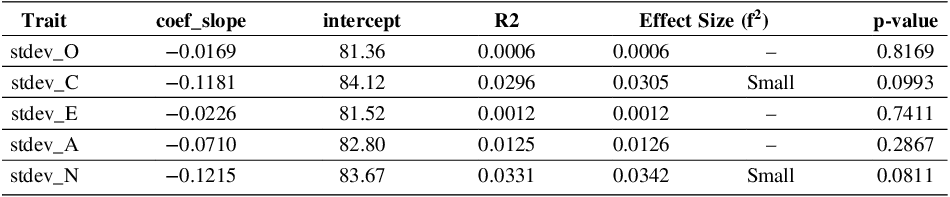
Linear regression was used to examine the influence on a team’s performance (final project grade) of the team-level Big5 personality trait score looking into the mean of the team’s individual scores (Table 3) and the within-team traits variety (standard deviation) of the scores (Table 4).
Linear regression analysis of team mean Big5 score and grades (N=94 teams) for each trait

Only the mean “conscientiousness” score of the a team shows a statistically significant (p-value<0.05) positive correlation with small effect size (0.02<f2<0.15) to the team grade, with slope = 0.0918 and p-value=0.0217, indicating that a 10-point (out of 100) increase in a team’s mean “conscientiousness” score is associated with roughly a 0.9-point (out of 100) increase in the final grade. Note that this is considerably higher than the correlation at individual level, which was 0.19).
Linear regression analysis between team’s Big5 standard deviation score and grades (N=94 teams) for each trait

Table 4 shows the analysis of the within-team traits variety of the team-level Big5 trait scores and team grades. The variety of “conscientiousness” scores within the team members shows a marginally significant (p-value<0.1) with small effect size (0.02<f2<0.15) negative correlation to the team grade, with slope=-0.1181 and p-value = 0.0993. This result indicates that, in our case, teams with a greater spread in “conscientiousness” scores among their team members tend to obtain lower grades, approximately a 1.2-point decrease in grade for each 10-point increase in the team’s “conscientiousness =” standard deviation.
The variety of “neuroticism” scores within the team members shows a marginally significant (p-value<0.1) with small effect size (0.02<f2<0.15) negative correlation to the team grade, with slope=-0.1215 and p-value = 0.0811. This result indicates that, in our case, teams with a greater spread in “neuroticism” scores among their team members tended to obtain lower grades, approximately a 1.2-point decrease in grade for each 10-point increase in the team’s “neuroticism” standard deviation.
5. Discussions
The following sections reflect on the findings and propose possible explanations. Two patterns stand out: (i) mean “conscientiousness” score is positively correlated (p-value<0.05) with design project grades at both the individual and team-level, with the addition of (ii) within-team traits variety in “conscientiousness” scores shows a marginally significant negative correlation (p-value<0.1) to the team-level design project grades and (iii) within-team variety in “neuroticism” scores, shown by standard deviations within the team, shows marginally significant negative correlation (p-value<0.1) with team grades. Based on the slope, within-team “neuroticism” variety has the greatest impact on grades, followed by within-team “conscientiousness” variety, within-team mean “conscientiousness”, and individual “conscientiousness” score.
Albeit the effect sizes of these two findings being small (the results suggest that personality traits do not dominate the design team outcomes), the findings may be used to hint how the traits influence the design process and hence the grades. The following sections discusses how specific characteristics of these two traits, as found in literature, could play a role in the context of design, and hence may be an explanation of the observed correlations with team performance. As most of this literature is non-design specific, our suggestions are tentative. further research will be necessary to assess their validity and reliability.
5.1. Conscientiousness trait and design project performance
Our research has shown that the “conscientiousness” score both at team and individual level was significantly correlated with higher design team grades. This result is coherent with the literature (Section 2.2): “conscientiousness” is a robust predictor of performance across educational contexts (Reference MammadovMammadov, 2021; Reference Zell and LesickZell & Lesick, 2022). Power and Pluess (2015) defined “conscientiousness” as a high level of thoughtfulness with good impulse control and goal-directed behaviours. Individuals with high scores of “conscientiousness” often show task-focused and reliable actions with sustained effort (Reference Jolić Marjanović, Krstić, Rajić, Stepanović Ilić, Videnović and Altaras DimitrijevićJolić Marjanović et al., 2024), which may have a positive impact in how a team functions and collaborative problem solving.
Design projects often involve changing requirements, iterative prototyping, and frequent coordination issues (Reference LukaLuka, 2014). Under these conditions and given the above characteristics of “conscientiousness” from the literature, a higher “conscientiousness” score in the context of design may improve team performance in maintaining task visibility, enforcing milestone discipline, and sustaining momentum when uncertainty increases.
However, the negative correlation of within-team variety and the team grade, suggests that the positive impact of “conscientiousness” requires the team members to have a similarly high score. Under design project conditions, a strong variation in “conscientiousness” score can plausibly manifest as inconsistent follow-through, uneven workload distribution, or misaligned expectations around team pace and quality, which can degrade team execution even if one or two team members are highly reliable.
This effect of the team composition in terms of standard deviation seems more unique to design project settings. The negative correlation of grades with within-team standard deviation implies that a mismatch in team forming may negatively affect the team grade. Using the team’s “conscientiousness” score variety could potentially help team forming.
In practical terms, these findings not only support the literature on an individual’s “academic predictor” in the context of a design project but also highlight team-process risks that instructors may be able to mitigate/anticipate during the team formation and/or the design project. Based on the consequences of “conscientiousness” traits mentioned, instructors could, for example, include having explicit milestone structures and visible task tracking.
5.2. Neuroticism trait and design project performance
Our research has shown that the standard deviation of “neuroticism” score in a design team shows a marginally significant negative correlation with the team design team grades, even though the score itself at individual and team level did not correlate with design team grades. Literature suggests that individuals with a lower “neuroticism” score (higher emotional stability) tend to perform better (Reference Brandt, Lechner, Tetzner and RammstedtBrandt et al., 2020; Reference Cubel, Nuevo-Chiquero, Sanchez-Pages and Vidal-FernandezCubel et al., 2016), are often able to respond effectively to change, stress, or unexpected situations (Reference Huang, Ryan, Zabel and PalmerHuang et al., 2014), and are able to buffer the negative effects of stress and performance pressure, often leading to better engagement and performance in stressful conditions (Reference Tewfik, Kim and PatilTewfik et al., 2023). Having a larger standard deviation of “neuroticism” within the team would suggest that the team members are more mismatched in their stress sensitivity, and that this, rather than the individual or team Neuroticism scores.
A design project is characterized by ill-defined problems, non-linear iteration, critique sessions, and persistent uncertainty (Reference LukaLuka, 2014). All of these may repeatedly activate stress responses. Under these conditions and given the above characteristics of “neuroticism” scores from the literature, large within-team differences in “neuroticism” scores can plausibly manifest as differing (or in some extreme cases may even be conflicting) reactions to the stress conditions, such as divergent tolerance for ambiguity, misaligned preferences for project’s pacing, and team’s willingness to take more risks in their decisions. These could in turn lead the team to spending more time in resolving internal conflict than working to solve the design problem.
Based on the consequences of “neuroticism” traits mentioned, instructors could include having critique/ feedback guides to prevent students’ negative reactions (such as defensiveness and escalation) during feedback sessions as well as students’ within-team discussions (which some may find stressful), structured/more check-ins during high-uncertainty phases, and milestone-based workload distribution to avoid last-minute stress cascades.
5.3. Limitations and future research
A key limitation of this study is that the Big5 personality traits data are self-reported (online questionnaire), which is susceptible to inaccurate self-perception and interpretations. Students may also provide socially desirable answers instead of their actual behaviours or preferences.
The study is limited to the context of a first-year introductory design course. The correlation of Big5 traits and grades differs for different subjects and tracks (Reference Brandt, Lechner, Tetzner and RammstedtBrandt et al., 2020), so the generalizability to other design contexts or contexts in general may be limited.
While this study has found correlations between Big5 trait scores and team performance in a design project, it does not establish causation. The size effects and literature suggest that team performance is influenced by many other factors such as their members’ experience in prototyping, the design task complexity, etc. The factors need to be identified and their correlation with team performance determined.
Future research should incorporate multi-method assessment of personality and behaviour, such as through peer/instructor observations, to investigate the reasons behind the differences in performance, both in individual and team-level. Future research should also replicate the studies across design courses and academic levels to improve its generalizability for design projects in an educational context, or even beyond. Moreover, as the goal of our research is to improve design education through personality-informed teaching, future research should focus on developing teaching suggestions/ methods to help students and teams that whose personality scores are found to correlate with lower grades (for example: low individual-level “conscientiousness” score and dissimilarities in “neuroticism” score in the team) to improve design education.
6. Conclusion
Our study examined how the Big5 personality traits relate to design project grades, both at individual-level and team-level. We observed that at team level, a higher average “conscientiousness” score in a team has a statistically significant, positive correlation with higher team grades, whereas other traits are not. Moreover, larger within-team variety in “conscientiousness” and “neuroticism” scores showed a marginally significant negative correlation with team grades, while standard deviation in the other traits show no such correlation. Lastly, at individual level, “conscientiousness” is the only trait with a statistically significant correlation to the grade of the individual’s team. These results are aligned with literature, with “conscientiousness” scores linked to a focus on following the tasks of a design project and “neuroticism” scores linked to the ability of handling stressful or unexpected situations. Both are crucial in a design project.
Despite these insights, some limitations apply: the self-reporting nature of the Big5 test may lead to inaccurate self-perceptions and social desirability bias; the single context (one design project course) limits generalizability; and the observed correlations cannot establish causation.
Overall, this paper has found that there are correlations between students’ performance (both in individual and team-level) to Big5 traits, such as “conscientiousness” and “neuroticism”. Future research should focus on validating and explaining the findings of this paper through qualitative observations and assessments, to identify other factors that influence design project outcomes in an educational setting, and to develop targeted interventions to help individuals or groups that have traits that are correlated with lower grades in design education.



 Open access

