Preface
The articles of this special issue focus on some of the major scientific questions that a future IR observatory will be able to address. We adopt the SPace Infrared telescope for Cosmology and Astrophysics (SPICA) design as a baseline to demonstrate how to achieve the major scientific goals in the fields of galaxy evolution, Galactic star formation and protoplanetary disks formation and evolution. The studies developed for the SPICA mission serve as a reference for future work in the field, even though the mission proposal has been cancelled by ESA from its M5 competition. The mission concept of SPICA employs a 2.5 m telescope, actively cooled to below ${\sim}8\, \mathrm{K}$
, and a suite of mid- to far-IR spectrometers and photometric cameras, equipped with state-of-the-art detectors (Roelfsema et al. Reference Roelfsema2018). In particular, the SPICA Far-Infrared Instrument (SAFARI) is a grating spectrograph with low (
${\sim}8\, \mathrm{K}$
, and a suite of mid- to far-IR spectrometers and photometric cameras, equipped with state-of-the-art detectors (Roelfsema et al. Reference Roelfsema2018). In particular, the SPICA Far-Infrared Instrument (SAFARI) is a grating spectrograph with low ( $R \sim\, $
200–300) and medium-resolution (
$R \sim\, $
200–300) and medium-resolution ( $R \sim\, $
3 000–11 000) observing modes instantaneously covering the 35–210
$R \sim\, $
3 000–11 000) observing modes instantaneously covering the 35–210 ${\rm{\mu }}\mathrm{m}$
wavelength range. The SPICA Mid-Infrared Instrument (SMI) has three operating modes: a large field of view (
${\rm{\mu }}\mathrm{m}$
wavelength range. The SPICA Mid-Infrared Instrument (SMI) has three operating modes: a large field of view ( $10' \times 12'$
) low-resolution
$10' \times 12'$
) low-resolution $17{-}36 {\rm{\mu }}\mathrm{m}$
imaging spectroscopic
$17{-}36 {\rm{\mu }}\mathrm{m}$
imaging spectroscopic $(R \sim\, $
50–120) mode and photometric camera at
$(R \sim\, $
50–120) mode and photometric camera at $34\, {\rm{\mu }}\mathrm{m}$
(SMI-LR), a medium-resolution
$34\, {\rm{\mu }}\mathrm{m}$
(SMI-LR), a medium-resolution $(R \sim\, $
1 300–2 300) grating spectrometer covering wavelengths of
$(R \sim\, $
1 300–2 300) grating spectrometer covering wavelengths of $18{-}36 {\rm{\mu }}\mathrm{m}$
(SMI-MR), and a high-resolution echelle module
$18{-}36 {\rm{\mu }}\mathrm{m}$
(SMI-MR), and a high-resolution echelle module $(R \sim 29\,000)$
for the
$(R \sim 29\,000)$
for the $10{-}18 {\rm{\mu }}\mathrm{m}$
domain (SMI-HR). Finally, BBOP, a large field of view (
$10{-}18 {\rm{\mu }}\mathrm{m}$
domain (SMI-HR). Finally, BBOP, a large field of view ( $2'.6 \times 2'.6$
), three-channel (70, 200 and
$2'.6 \times 2'.6$
), three-channel (70, 200 and $350\, {\rm{\mu }}\mathrm{m}$
) polarimetric camera complements the science payload.
$350\, {\rm{\mu }}\mathrm{m}$
) polarimetric camera complements the science payload.
1. Introduction
As new stars form in dusty environments, infrared (IR) observations are key to studying obscured star formation and, in turn, achieving a better understanding of galaxy formation and evolution. This is particularly important around the very active period known as the Cosmic Noon (i.e. $\textit{z}\sim2$
; Madau & Dickinson Reference Madau and Dickinson2014), where dust absorbs and re-radiates in the IR, on average, 80% of the ultra-violet (UV) and optical radiation (Reddy et al. Reference Reddy2012).
$\textit{z}\sim2$
; Madau & Dickinson Reference Madau and Dickinson2014), where dust absorbs and re-radiates in the IR, on average, 80% of the ultra-violet (UV) and optical radiation (Reddy et al. Reference Reddy2012).
At $\textit{z}>3$
our knowledge of the on-going star formation is mainly based on UV rest-frame observations (e.g. Bouwens et al. Reference Bouwens2015; Livermore, Finkelstein, & Lotz Reference Livermore, Finkelstein and Lotz2017; Livermore et al. Reference Livermore, Trenti, Bradley, Bernard, Holwerda, Mason and Treu2018; Oesch et al. Reference Oesch, Bouwens, Illingworth, Labbé and Stefanon2018), given the large availability of optical and near-IR observatories such as the Hubble Space Telescope (HST). UV observations have shown that dust corrections at
$\textit{z}>3$
our knowledge of the on-going star formation is mainly based on UV rest-frame observations (e.g. Bouwens et al. Reference Bouwens2015; Livermore, Finkelstein, & Lotz Reference Livermore, Finkelstein and Lotz2017; Livermore et al. Reference Livermore, Trenti, Bradley, Bernard, Holwerda, Mason and Treu2018; Oesch et al. Reference Oesch, Bouwens, Illingworth, Labbé and Stefanon2018), given the large availability of optical and near-IR observatories such as the Hubble Space Telescope (HST). UV observations have shown that dust corrections at $\textit{z}>3$
may be relatively small (e.g. Bouwens et al. Reference Bouwens2016; Dunlop et al. Reference Dunlop2017). Conversely, studies based on emission lines have shown that UV-based star-formation rate may be underestimated for galaxies with high level of star formation, due to an increased importance of the dusty stellar populations in these galaxies (e.g. Reddy et al. Reference Reddy2015). Similarly, recent observations of galaxies at
$\textit{z}>3$
may be relatively small (e.g. Bouwens et al. Reference Bouwens2016; Dunlop et al. Reference Dunlop2017). Conversely, studies based on emission lines have shown that UV-based star-formation rate may be underestimated for galaxies with high level of star formation, due to an increased importance of the dusty stellar populations in these galaxies (e.g. Reddy et al. Reference Reddy2015). Similarly, recent observations of galaxies at $\textit{z}>6$
have shown the presence of a large quantity of dust (e.g.
$\textit{z}>6$
have shown the presence of a large quantity of dust (e.g. ${\sim}10^6\,{\rm M}_{\odot}$
; Tamura et al. Reference Tamura2019), which may be more concentrate and warm than clouds in local galaxies, increasing the UV attenuation (e.g. Sommovigo et al. Reference Sommovigo, Ferrara, Pallottini, Carniani, Gallerani and Decataldo2020)
${\sim}10^6\,{\rm M}_{\odot}$
; Tamura et al. Reference Tamura2019), which may be more concentrate and warm than clouds in local galaxies, increasing the UV attenuation (e.g. Sommovigo et al. Reference Sommovigo, Ferrara, Pallottini, Carniani, Gallerani and Decataldo2020)
In addition, when studying the cosmic star-formation-rate density (SFRD) of the Universe, there are some tensions between the results obtained from UV observations (e.g. Schenker et al. Reference Schenker2013; Bouwens et al. Reference Bouwens2015) and results based on IR or radio data (e.g. Magnelli et al. Reference Magnelli2013; Novak et al. Reference Novak2017; Gruppioni et al. Reference Gruppioni2020), with the former indicating a steeper redshift evolution (i.e. lower SFRD at high-z) than the latter. This tension is at least partially due to UV observations not being representative of the whole galaxy population (Bouwens et al. Reference Bouwens2020). Indeed, recent observations have shown the non-negligible presence of a dusty and optically-dark galaxy population (e.g. Franco et al. Reference Franco2018; Wang et al. Reference Wang2019; Talia et al. Reference Talia, Cimatti, Giulietti, Zamorani, Bethermin, Faisst, Le Fèvre and SmolÇiĆ2021), which contributes to 17% of the star-formation rate density at $\textit{z}\sim5$
, as estimated by Gruppioni et al. (Reference Gruppioni2020) from a sample of blindly detected far-IR galaxies in the ALMA Large Program to INvestigate survey (ALPINE; Le Fèvre et al. Reference Le Fèvre2020).
$\textit{z}\sim5$
, as estimated by Gruppioni et al. (Reference Gruppioni2020) from a sample of blindly detected far-IR galaxies in the ALMA Large Program to INvestigate survey (ALPINE; Le Fèvre et al. Reference Le Fèvre2020).
Due to the capabilities of past and current IR and sub-millimetre observatories, for example Herschel, Spitzer and the Atacama Large Millimetre/submillimetre Array (ALMA), current observations have been limited to the brightest IR galaxies or to very small fields. A new IR telescope with both high sensitivity and large survey capability, such as a SPICA-like mission, the Origins Space TelescopeFootnote a (OST; Leisawitz et al. Reference Leisawitz, Barto, Breckinridge and Stahl2019) or the Galaxy Evolution Probe (Glenn et al. Reference Glenn, Lystrup, MacEwen, Fazio, Batalha, Siegler and Tong2018, GEP), is therefore essential to improving our understanding of the dust-obscured Universe at different epochs.
One of the primary science goals of SPICA was the detection and analysis of the dust-obscured phases of galaxy evolution, including activity from both star formation and accretion onto supermassive black holes. Combined low-resolution (LR) spectroscopy and photometry at IR wavelengths could enable the detection of polycyclic aromatic hydrocarbons (PAHs) features, fine-structure lines as well as the dust continuum emission at mid-IR wavelengths. At these wavelengths the light is not heavily affected by dust absorption, as happens instead at UV and optical wavelengths, and, therefore, it allows the analysis of the evolutionary phases which are difficult to study at shorter wavelengths. In addition, the advantage of the spectro-photometric observations at mid- to far-IR wavelengths is the possibility to analyse the physics behind the processes responsible for the observed galaxy evolution and the environment in which they take place.
In this work, we make use of the state-of-the-art Spectro-Photometric Realisations of Infrared-selected Targets at all-z simulation (Spritz; Bisigello et al. Reference Bisigello2021, hereafter B21) that is particularly suited for predictions of IR surveys and includes both star-forming galaxies and active galactic nuclei (AGN). Using this simulation and following the works by Kaneda et al. (Reference Kaneda2017), Gruppioni et al. (Reference Gruppioni2017) and Spinoglio et al. (Reference Spinoglio2021), we aim at exploring the capability of a SPICA-like cold 2.5 m telescope to drive significant progress in our knowledge on galaxy evolution. Given the dismissal of the SPICA mission concept from the M5 competition, we expanded this work to include a comparison with the OST and the GEP, two NASA concepts for cryogenic IR observatory with 5.9 and 2.0 m primary mirrors, respectively.
This paper is organised as follows. Section 2 introduces the Spritz simulation, the SPICA spectro-photometric surveys used as references and the OST and GEP surveys. Section 3 contains the different predictions for SPICA complemented, when possible, with OST and GEP expectations. We summarise our main findings in Section 4. Throughout the paper, we consider a $\Lambda$
CDM cosmology with
$\Lambda$
CDM cosmology with $H_0=70\,{\rm km}\,{\rm s}^{-1}{\rm Mpc}^{-1} $
,
$H_0=70\,{\rm km}\,{\rm s}^{-1}{\rm Mpc}^{-1} $
, $\Omega_{m}=0.27$
and
$\Omega_{m}=0.27$
and $\Omega_\Lambda=0.73$
.
$\Omega_\Lambda=0.73$
.
2. The Spritz simulation and SPICA mock catalogues
2.1. The Spritz simulation
To predict the galaxy population that could be observed by future IR missions, we created mock observations using the newly developed Spritz simulations (Bisigello et al. Reference Bisigello2021). All the mock catalogues considered in this paper are made publicly available.Footnote b
Briefly, in Spritz all simulated galaxies are extracted from a set of observed luminosity functions (LFs) or galaxy stellar mass functions (GSMF):
-
The Herschel LFs measured by Gruppioni et al. (Reference Gruppioni2013) for different galaxy populations such as normal star-forming galaxies (hereafter spirals), starburst (SB) and two composite systems with an AGN contribution that is only visible in the mid-IR and, even if with some obscuration, in the X-rays (SF-AGN and SB-AGN). The first composite AGN population, that is SF-AGN, is common at $\textit{z}=1$
–2 and includes low-luminosity AGN, while the second one, that is SB-AGN, is common at
${z}>2$
, hosts a bright, but heavily obscured AGN and has a high SFR (i.e.
$\mathrm{log}_{10}(sSFR/yr)\sim\, $
8 in the simulation). All these LFs are described by a modified Schechter function (Saunders et al. Reference Saunders, Rowan-Robinson, Lawrence, Efstathiou, Kaiser, Ellis and Frenk1990), whose parameter values are summarised in Table 1 in Bisigello et al. (Reference Bisigello2021). At
${z}>3$
the LFs are extrapolated assuming a constant characteristic luminosity and a decreasing number density at the knee as
$\propto(1+z)^{k_{\Phi}}$
, with
$k_{\Phi}=-4$
to
$-1$
. These values have been chosen to explore a large range of possible density evolution and are consistent with recent observations of the total IR LF observed at
${z}>3$
(Gruppioni et al. Reference Gruppioni2020).
$\textit{z}=1$
–2 and includes low-luminosity AGN, while the second one, that is SB-AGN, is common at
${z}>2$
, hosts a bright, but heavily obscured AGN and has a high SFR (i.e.
$\mathrm{log}_{10}(sSFR/yr)\sim\, $
8 in the simulation). All these LFs are described by a modified Schechter function (Saunders et al. Reference Saunders, Rowan-Robinson, Lawrence, Efstathiou, Kaiser, Ellis and Frenk1990), whose parameter values are summarised in Table 1 in Bisigello et al. (Reference Bisigello2021). At
${z}>3$
the LFs are extrapolated assuming a constant characteristic luminosity and a decreasing number density at the knee as
$\propto(1+z)^{k_{\Phi}}$
, with
$k_{\Phi}=-4$
to
$-1$
. These values have been chosen to explore a large range of possible density evolution and are consistent with recent observations of the total IR LF observed at
${z}>3$
(Gruppioni et al. Reference Gruppioni2020). -
The obscured and un-obscured AGN (AGN2 and AGN1, respectively) LF, as derived by Bisigello et al. (Reference Bisigello2021) using Herschel observations along with a set of far-ultraviolet observations up to
${z}=5$
. The LF is described by a modified Schechter function and the evolution of the parameters describing the function at
${z}<5$
is extrapolated at higher redshift (see Table 1 in Bisigello et al. Reference Bisigello2021). -
The K-band LF of elliptical galaxies (Ell), taken from the average LF of Cirasuolo et al. (Reference Cirasuolo2007), Arnouts et al. (Reference Arnouts2007) and Beare et al. (Reference Beare, Brown, Pimbblet and Taylor2019). The LF is extrapolated for galaxies at
$\textit{z}>2$
by keeping the characteristic luminosity constant and with a number density at the knee decreasing as
$\propto(1+z)^{-1}$
. -
The GSMF of dwarf irregular galaxies (Irr) by Huertas-Company et al. (Reference Huertas-Company2016). For consistency with the Herschel LFs, at
$\textit{z}>3$
we extrapolated the GSMF, which is not well studied at these high-z, by keeping the characteristic mass constant and decreasing the number density at the knee as
$\propto(1+z)^{k_{\Phi}}$
, with
$k_{\Phi}$
ranging from
$-4$
to
$-1$
.





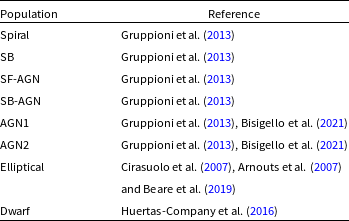
The different galaxy populations and the references for their LF or GSMF are reported in Table 1.
The different galaxy populations included in Spritz and the reference of the LF or GSMF from which their number densities are derived.
Mock fluxes for different current and future facilities, including SPICA, are derived by convolving the throughput of each filter with an empirical galaxy template associated to each galaxy population. We considered 35 empirical templates taken from Polletta et al. (Reference Polletta2007), Rieke et al. (Reference Rieke, Alonso-Herrero, Weiner, Pérez-González, Blaylock, Donley and Marcillac2009), Gruppioni et al. (Reference Gruppioni2010) and Bianchi et al. (Reference Bianchi2018). We included these templates as they are the same used by Gruppioni et al. (Reference Gruppioni2013) to derive the Herschel IR LF, except for dwarf galaxies which were not observed in large numbers by Herschel .
The main physical properties for each simulated galaxy, such as stellar mass, AGN fraction, gas metallicity and intrinsic luminosity at different wavelengths, are derived from the associated template or from a broad set of empirical relations (see Bisigello et al. Reference Bisigello2021, and references therein). The simulation also includes mock SMI and OST spectra, obtained considering the same galaxy templates used for deriving the simulated photometric data.
We added optical and IR nebular line emission to these templates, considering a set of empirical and theoretical relations (see Bisigello et al. Reference Bisigello2021, and references therein). All lines include star formation and, if present, the AGN contribution. The AGN component is limited to the contribution of the narrow-line gas-emitting regions. Therefore, as the contribution of the broad-line regions is missing, the fluxes of the permitted lines for the simulated un-obscured AGN (AGN1) should be considered as lower limits. Similarly, the numbers of AGN1 with a detection of permitted lines should be considered as lower limits.
The large-scale structure is included in the simulation using the algorithm by Soneira & Peebles (Reference Soneira and Peebles1978) to extract positions based on a two-point correlation function. In particular, we assumed the power-law approximation by Limber (Reference Limber1953) for the angular two-point correlation function $w(\theta)=A_{w}\theta^{1-\gamma}$
, with
$w(\theta)=A_{w}\theta^{1-\gamma}$
, with $\gamma=1.7$
, as suggested by observations (e.g. Wang, Brunner, & Dolence Reference Wang, Brunner and Dolence2013), and
$\gamma=1.7$
, as suggested by observations (e.g. Wang, Brunner, & Dolence Reference Wang, Brunner and Dolence2013), and $\mathrm{A}_{w}$
evolving with the stellar mass (Wake et al. Reference Wake2011; Hatfield et al. Reference Hatfield, Lindsay and Jarvis2016) but not with redshift (Béthermin et al. Reference Béthermin2015; Schreiber et al. Reference Schreiber2015). We highlight that the assumptions made on the clustering have no impact on the results presented in this work, as this information in used, at the moment of writing, only to create mock images and we do not analyse source blending.
$\mathrm{A}_{w}$
evolving with the stellar mass (Wake et al. Reference Wake2011; Hatfield et al. Reference Hatfield, Lindsay and Jarvis2016) but not with redshift (Béthermin et al. Reference Béthermin2015; Schreiber et al. Reference Schreiber2015). We highlight that the assumptions made on the clustering have no impact on the results presented in this work, as this information in used, at the moment of writing, only to create mock images and we do not analyse source blending.
As detailed in Bisigello et al. (Reference Bisigello2021), Spritz agrees well with a broad set of observations (LFs and number counts) at different wavelengths. In particular, the simulation is in agreement, within the simulation uncertainties, with the mid- and far-IR number counts ( ${\sim}24$
–
${\sim}24$
– $600\,{\rm{\mu }}\mathrm{m}$
) and with the recent IR LF observed by Gruppioni et al. (Reference Gruppioni2020) up to
$600\,{\rm{\mu }}\mathrm{m}$
) and with the recent IR LF observed by Gruppioni et al. (Reference Gruppioni2020) up to $\textit{z}\sim6$
, showing the reliability of the extrapolation at
$\textit{z}\sim6$
, showing the reliability of the extrapolation at $\textit{z}>3$
, at least at IR wavelengths. In addition, Gruppioni et al. (Reference Gruppioni2020) found a general agreement between observed galaxies at
$\textit{z}>3$
, at least at IR wavelengths. In addition, Gruppioni et al. (Reference Gruppioni2020) found a general agreement between observed galaxies at $\textit{z}\sim 6$
and the SED templates used to built Spritz, confirming the validity of the templates used, even at high-z.
$\textit{z}\sim 6$
and the SED templates used to built Spritz, confirming the validity of the templates used, even at high-z.
Looking at other wavelengths, the part of the UV LF dominated by galaxies (i.e. AB magnitude M 1 600Å >-23) in Spritz is underestimated at $\textit{z}>2$
, indicating that a population of dust-poor galaxy may be missing in the simulation. The absence of such population should however not impact the results presented in this paper focused on future IR missions.
$\textit{z}>2$
, indicating that a population of dust-poor galaxy may be missing in the simulation. The absence of such population should however not impact the results presented in this paper focused on future IR missions.
The bright-end of the X-ray LF of the simulation is in agreement with previous observational results up to $\textit{z}= 6$
(Aird et al. Reference Aird2010; Aird et al. Reference Aird, Coil, Georgakakis, Nandra, Barro and Pérez-González2015; Miyaji et al. Reference Miyaji2015; Vito et al. Reference Vito2018; Wolf et al. Reference Wolf2021), above which no observations are at the moment available. The faint-end slope, on the contrary, is slightly overestimated and the difference between our simulation and observations increases with redshift, from a factor of four at
$\textit{z}= 6$
(Aird et al. Reference Aird2010; Aird et al. Reference Aird, Coil, Georgakakis, Nandra, Barro and Pérez-González2015; Miyaji et al. Reference Miyaji2015; Vito et al. Reference Vito2018; Wolf et al. Reference Wolf2021), above which no observations are at the moment available. The faint-end slope, on the contrary, is slightly overestimated and the difference between our simulation and observations increases with redshift, from a factor of four at ${z}\sim 0.5$
to a factor of
${z}\sim 0.5$
to a factor of ${\sim}15$
at
${\sim}15$
at ${z}\sim 5$
, but still within the uncertainties. This will be further investigated in a future work and it is expected to have an impact on the comparison between IR and X-ray fluxes presented in Section 3.1.3.
${z}\sim 5$
, but still within the uncertainties. This will be further investigated in a future work and it is expected to have an impact on the comparison between IR and X-ray fluxes presented in Section 3.1.3.
We can overall conclude that the Spritz simulation can reliably be used to perform SPICA, GEP and OST predictions. We refer to Bisigello et al. (Reference Bisigello2021) for more information about Spritz.
2.2. Simulated catalogues
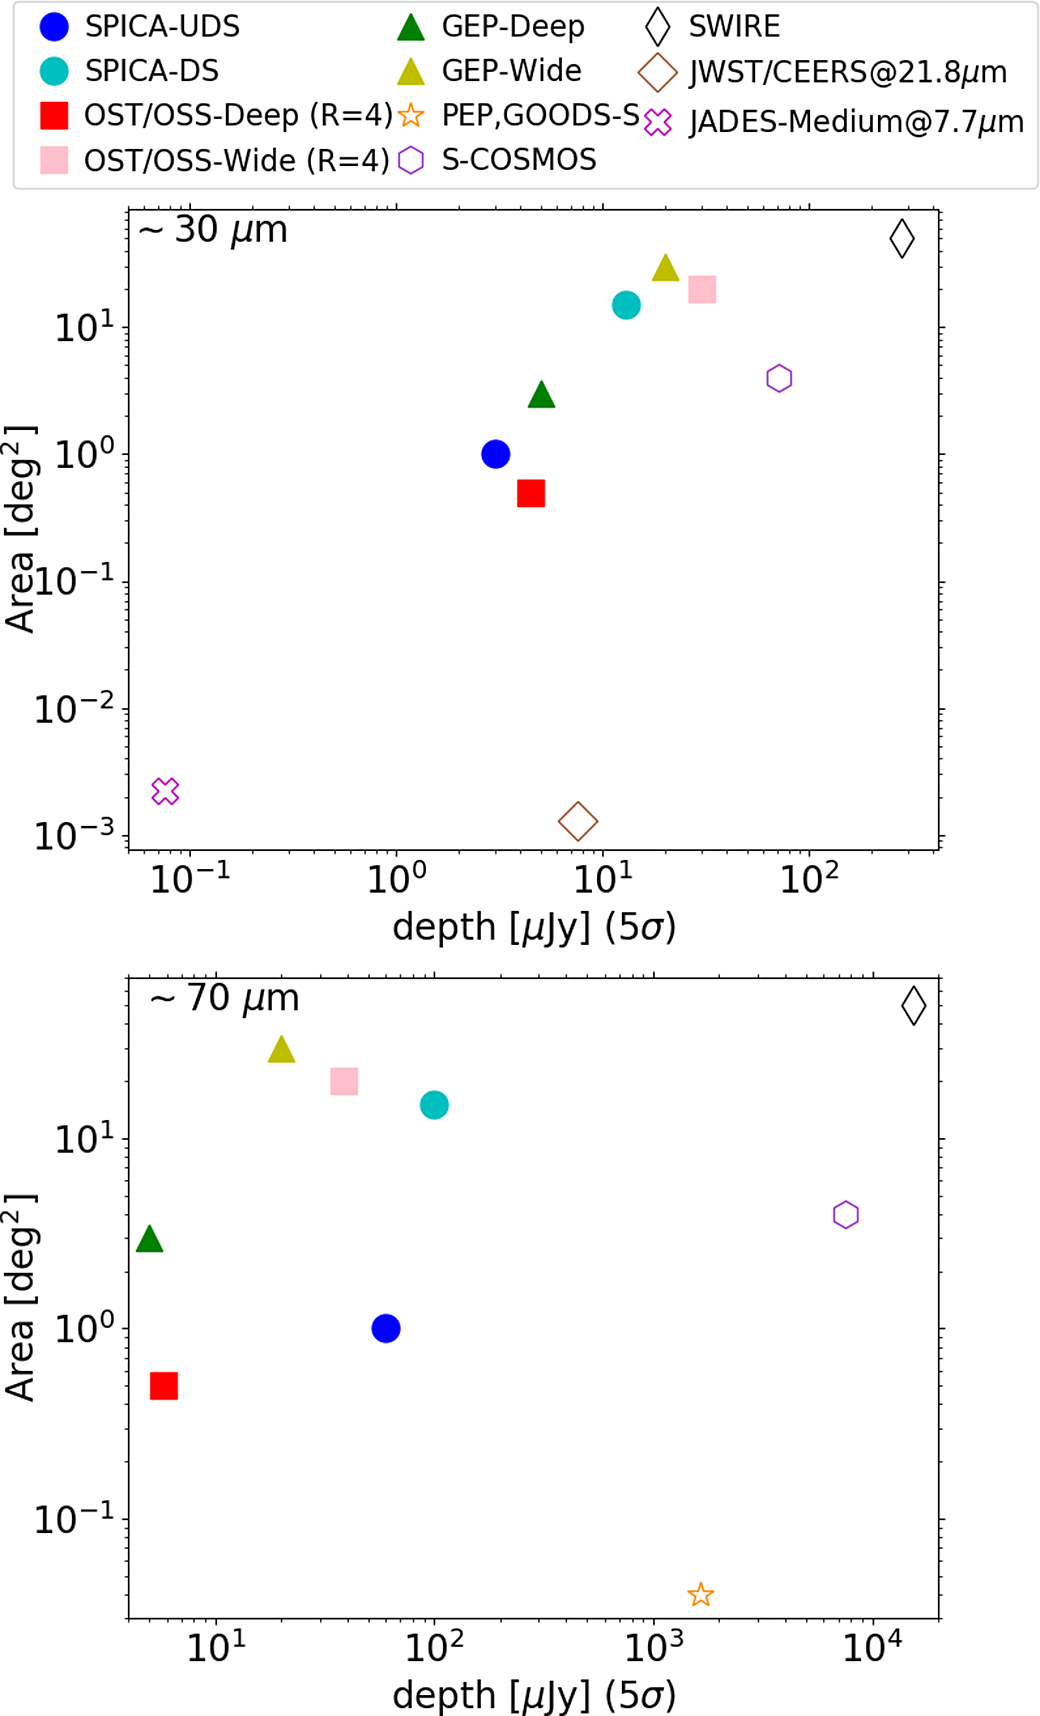
In the next sections we describe in detail the simulated catalogues we created resembling six different surveys of SPICA, OST and GEP. To show the improvement of such surveys with respect to previous ones, we show in Figure 1 the comparison between the depth and area of the considered SPICA, OST and GEP surveys with the depth and area of past surveys observing around 30 and $70\, {\rm{\mu }}\mathrm{m}$
(i.e. Lonsdale et al. Reference Lonsdale2003; Sanders et al. Reference Sanders2007; Magnelli et al. Reference Magnelli2013).
$70\, {\rm{\mu }}\mathrm{m}$
(i.e. Lonsdale et al. Reference Lonsdale2003; Sanders et al. Reference Sanders2007; Magnelli et al. Reference Magnelli2013).
Comparison between area and depth covered by different surveys, observing around 30 (top) and $70\, {\rm{\mu }}\mathrm{m}$
(bottom). Coloured points indicate the surveys considered in this work (see legend). Empty points indicate some past surveys at 24 and
$70\, {\rm{\mu }}\mathrm{m}$
(bottom). Coloured points indicate the surveys considered in this work (see legend). Empty points indicate some past surveys at 24 and $70\,{\rm{\mu }}\mathrm{m}$
. For comparison, we also include two future JWST surveys: the JWST/CEERS survey at
$70\,{\rm{\mu }}\mathrm{m}$
. For comparison, we also include two future JWST surveys: the JWST/CEERS survey at $21.8\, {\rm{\mu }}\mathrm{m}$
(brown diamonds) and the JWST/JADES medium survey at
$21.8\, {\rm{\mu }}\mathrm{m}$
(brown diamonds) and the JWST/JADES medium survey at $7.7\, {\rm{\mu }}\mathrm{m}$
(magenta crosses).
$7.7\, {\rm{\mu }}\mathrm{m}$
(magenta crosses).
In the same figure, we also include a comparison with two approved James Webb Space Telescope (JWST; Gardner et al. Reference Gardner, Thronson, Stiavelli and Tielens2009) surveys: the Mid Infrared Instrument (MIRI Kendrew et al. Reference Kendrew2015; Rieke et al. Reference Rieke2015; Wright et al. Reference Wright2015) observations at $21.8\, {\rm{\mu }}\mathrm{m}$
which is part of the Cosmic Evolution Early Release Science (CEERSFootnote c) survey and the MIRI
$21.8\, {\rm{\mu }}\mathrm{m}$
which is part of the Cosmic Evolution Early Release Science (CEERSFootnote c) survey and the MIRI $7.7\, {\rm{\mu }}\mathrm{m}$
observations of the Medium JWST Advanced Deep Extragalactic Survey (JADESFootnote d). JWST and the three far-IR missions analysed in this work are complementary in wavelengths, as JWST covers
$7.7\, {\rm{\mu }}\mathrm{m}$
observations of the Medium JWST Advanced Deep Extragalactic Survey (JADESFootnote d). JWST and the three far-IR missions analysed in this work are complementary in wavelengths, as JWST covers $\lambda<28.8\, {\rm{\mu }}\mathrm{m}$
while SPICA, OST and GEP cover
$\lambda<28.8\, {\rm{\mu }}\mathrm{m}$
while SPICA, OST and GEP cover $\lambda>$
20, 25 and
$\lambda>$
20, 25 and $10\, {\rm{\mu }}\mathrm{m}$
, respectively. At the same time, JWST is particularly suited for performing very deep mid-IR observations, as in imaging it can reach a
$10\, {\rm{\mu }}\mathrm{m}$
, respectively. At the same time, JWST is particularly suited for performing very deep mid-IR observations, as in imaging it can reach a $10\sigma$
depth of
$10\sigma$
depth of $7.09\, {\rm{\mu }}\mathrm{Jy}$
at
$7.09\, {\rm{\mu }}\mathrm{Jy}$
at $21.0\, {\rm{\mu }}\mathrm{m}$
in
$21.0\, {\rm{\mu }}\mathrm{m}$
in $10^{4}\, \mathrm{s}$
(Glasse et al. Reference Glasse2015), but they are limited to small area in the sky given the small MIRI field-of-view (
$10^{4}\, \mathrm{s}$
(Glasse et al. Reference Glasse2015), but they are limited to small area in the sky given the small MIRI field-of-view ( $74^{\prime\prime}\times113^{\prime\prime}$
; Bouchet et al. Reference Bouchet2015).
$74^{\prime\prime}\times113^{\prime\prime}$
; Bouchet et al. Reference Bouchet2015).
2.2.1. SPICA
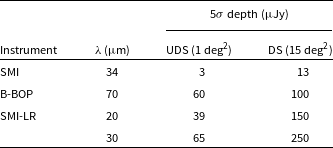
In this work, we simulated two different spectro-photometric surveys, following two planned SPICA surveys (Table 2):
-
an Ultra-Deep Survey (UDS) covering
$1\, \mathrm{deg}^{2}$
in 600 h, reaching down to
$3\, {\rm{\mu }}\mathrm{Jy}$
(
$5\sigma$
) with SMI at
$34\, {\rm{\mu }}\mathrm{m}$
and
$60\, {\rm{\mu }}\mathrm{Jy}$
(
$5\sigma$
) with B-BOP at
$70\, {\rm{\mu }}\mathrm{m}$
. In the same amount of time SMI-LR would simultaneously obtain spectra down to
$39\, {\rm{\mu }}\mathrm{Jy}$
at
$20\, {\rm{\mu }}\mathrm{m}$
and
$65\, {\rm{\mu }}\mathrm{Jy}$
at
$30\, {\rm{\mu }}\mathrm{m}$
(
$5\sigma$
). -
a deep survey (DS) covering 15 deg2 in 600 h, reaching down to
$13\, {\rm{\mu }}\mathrm{Jy}$
(
$5\sigma$
) with SMI at
$34\, {\rm{\mu }}\mathrm{m}$
and
$100\, {\rm{\mu }}\mathrm{Jy}$
(
$5\sigma$
) with the B-BOP at
$70\, {\rm{\mu }}\mathrm{m}$
. In the same amount of time SMI-LR would simultaneously obtain spectra down to
$150\, {\rm{\mu }}\mathrm{Jy}$
at
$20\, {\rm{\mu }}\mathrm{m}$
and
$250\, {\rm{\mu }}\mathrm{Jy}$
at
$30\, {\rm{\mu }}\mathrm{m}$
(
$5\sigma$
).


Both spectroscopic limits are derived considering a low background level (i.e. 19 MJy sr–1 at $27\, {\rm{\mu }}\mathrm{m}$
). Photometric confusion noise is not included in Spritz and corresponds at
$27\, {\rm{\mu }}\mathrm{m}$
). Photometric confusion noise is not included in Spritz and corresponds at $5\sigma$
to
$5\sigma$
to $9\, {\rm{\mu }}\mathrm{Jy}$
and 0.25 mJy at
$9\, {\rm{\mu }}\mathrm{Jy}$
and 0.25 mJy at $34\, {\rm{\mu }}\mathrm{m}$
and
$34\, {\rm{\mu }}\mathrm{m}$
and $70\, {\rm{\mu }}\mathrm{m}$
, respectively. The confusion noise may be broken with the help of the available spectroscopic data (Raymond et al. Reference Raymond, Isaak, Clements, Rykala and Pearson2010), but it is necessary to consider with caution sources with fluxes similar or below the mentioned confusion noise, as they may need additional de-blending analysis.
$70\, {\rm{\mu }}\mathrm{m}$
, respectively. The confusion noise may be broken with the help of the available spectroscopic data (Raymond et al. Reference Raymond, Isaak, Clements, Rykala and Pearson2010), but it is necessary to consider with caution sources with fluxes similar or below the mentioned confusion noise, as they may need additional de-blending analysis. $5\sigma$
depths at four wavelengths corresponding to the two SPICA photometric filters and LR spectrograph at two reference wavelengths, as planned for the two spectro-photometric surveys considered in this work.
$5\sigma$
depths at four wavelengths corresponding to the two SPICA photometric filters and LR spectrograph at two reference wavelengths, as planned for the two spectro-photometric surveys considered in this work.
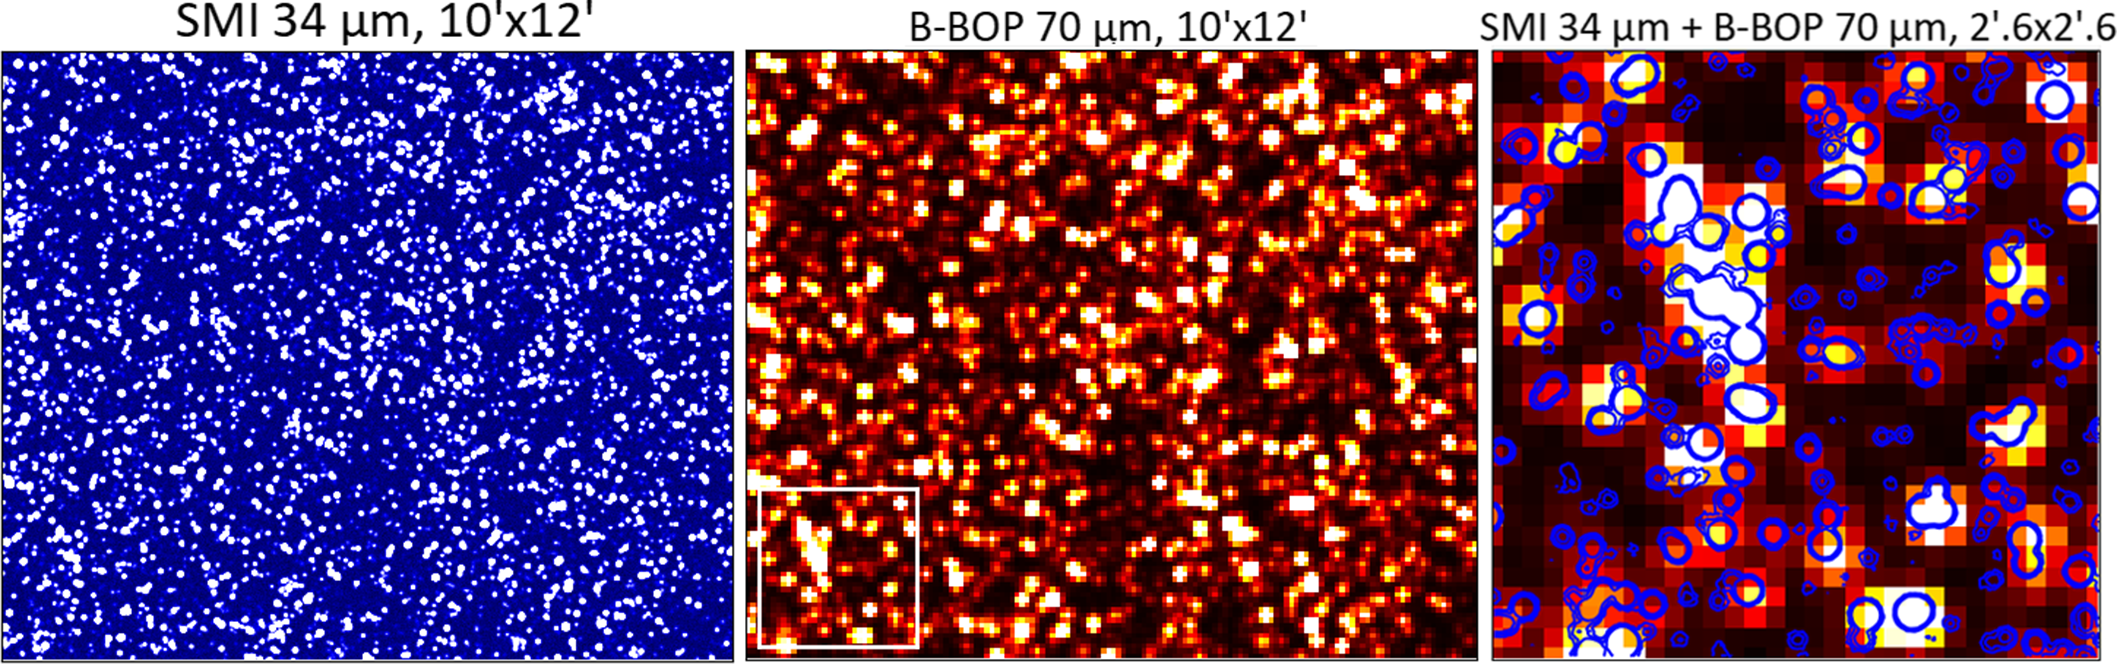
Galaxies in the two mock catalogues are selected to have a signal-to-noise (S/N) larger than 3 either in the SMI or B-BOP photometric filters, similarly to what is done with real data to limit the number of false detection. In Figure 2, we report as an example a $10^{\prime}\times12^{\prime}$
simulated image with SMI at
$10^{\prime}\times12^{\prime}$
simulated image with SMI at $34\, {\rm{\mu }}\mathrm{m}$
(left panel) and B-BOP at
$34\, {\rm{\mu }}\mathrm{m}$
(left panel) and B-BOP at $70\, {\rm{\mu }}\mathrm{m}$
(central panel). The chosen area corresponds to a single SMI pointing, whereas a B-BOP pointing covers a smaller area, that is
$70\, {\rm{\mu }}\mathrm{m}$
(central panel). The chosen area corresponds to a single SMI pointing, whereas a B-BOP pointing covers a smaller area, that is $2^{\prime}.6\times2^{\prime}.6$
. In the right panel, we show a zoom-in of the B-BOP pointing with, superimposed, the SMI image. In this figure, it is possible to appreciate the different size of the point-spread function (PSF), which has been approximated by a two-dimensional Gaussian. The PSF has a full-width-half-maximum of
$2^{\prime}.6\times2^{\prime}.6$
. In the right panel, we show a zoom-in of the B-BOP pointing with, superimposed, the SMI image. In this figure, it is possible to appreciate the different size of the point-spread function (PSF), which has been approximated by a two-dimensional Gaussian. The PSF has a full-width-half-maximum of $3.5^{\prime\prime}$
at
$3.5^{\prime\prime}$
at $34\, {\rm{\mu }}\mathrm{m}$
and of
$34\, {\rm{\mu }}\mathrm{m}$
and of $9^{\prime\prime}$
at
$9^{\prime\prime}$
at $70\, {\rm{\mu }}\mathrm{m}$
.
$70\, {\rm{\mu }}\mathrm{m}$
.
Left: Simulated SMI image at $34\, {\rm{\mu }}\mathrm{m}$
of a field of
$34\, {\rm{\mu }}\mathrm{m}$
of a field of $10^{\prime}\times12^{\prime}$
, which corresponds to a single SMI pointing. Centre: Simulated B-BOP image at
$10^{\prime}\times12^{\prime}$
, which corresponds to a single SMI pointing. Centre: Simulated B-BOP image at $70\, {\rm{\mu }}\mathrm{m}$
of the same field. The B-BOP field-of-view (
$70\, {\rm{\mu }}\mathrm{m}$
of the same field. The B-BOP field-of-view ( $2'.6 \times 2'.6$
) is shown for comparison in the bottom left (white square). Right: Zoom-in of the B-BOP image in the B-BOP field-of-view. Blue contours are the superimposed SMI image (5, 10 and
$2'.6 \times 2'.6$
) is shown for comparison in the bottom left (white square). Right: Zoom-in of the B-BOP image in the B-BOP field-of-view. Blue contours are the superimposed SMI image (5, 10 and $20\sigma$
). Each point corresponds to one galaxy or blends of several galaxies simulated with Spritz, depending on source blending, down to the noise level.
$20\sigma$
). Each point corresponds to one galaxy or blends of several galaxies simulated with Spritz, depending on source blending, down to the noise level.
2.2.2. OST
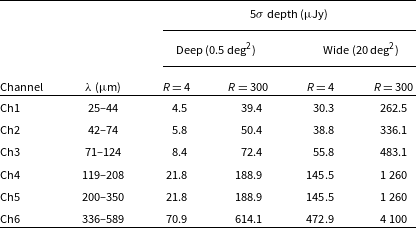
The Origins Survey Spectrometer (OSS; Bradford et al. Reference Bradford, Lystrup, MacEwen, Fazio, Batalha, Siegler and Tong2018) planned for OST consists of six channels covering between 25 and $589\, {\rm{\mu }}\mathrm{m}$
with a resolution of
$589\, {\rm{\mu }}\mathrm{m}$
with a resolution of $R=300$
. In this work, we compared the two aforementioned SPICA surveys with the Deep and Wide surveys planned for OST (hereafter OST-Deep and OST-Wide), covering, respectively, 0.5 and
$R=300$
. In this work, we compared the two aforementioned SPICA surveys with the Deep and Wide surveys planned for OST (hereafter OST-Deep and OST-Wide), covering, respectively, 0.5 and $20\, \mathrm{deg}^{2}$
with a
$20\, \mathrm{deg}^{2}$
with a $5\sigma$
depth of 39.4 and
$5\sigma$
depth of 39.4 and $262.5\, {\rm{\mu }}\mathrm{Jy}$
at 25–
$262.5\, {\rm{\mu }}\mathrm{Jy}$
at 25– $44\, {\rm{\mu }}\mathrm{m}$
, at a resolution of
$44\, {\rm{\mu }}\mathrm{m}$
, at a resolution of $R=300$
.
$R=300$
.
For comparison with the two SPICA photometric surveys, we also considered the photometric points derived considering each OST channel as a photometer, that is at a resolution of $R=4$
instead of
$R=4$
instead of $R=300$
. This corresponds to a
$R=300$
. This corresponds to a $5\sigma$
depth of 4.5 and
$5\sigma$
depth of 4.5 and $30.3\, {\rm{\mu }}\mathrm{Jy}$
at 25–
$30.3\, {\rm{\mu }}\mathrm{Jy}$
at 25– $44\, {\rm{\mu }}\mathrm{m}$
in the OST-Deep and OST-Wide survey, respectively. Taking into account the central wavelengths of the different filters, in the part of this work focused on results based on photometric data, we compared results of the OST/OSS Ch1 with the SPICA/SMI filter at
$44\, {\rm{\mu }}\mathrm{m}$
in the OST-Deep and OST-Wide survey, respectively. Taking into account the central wavelengths of the different filters, in the part of this work focused on results based on photometric data, we compared results of the OST/OSS Ch1 with the SPICA/SMI filter at $34\, {\rm{\mu }}\mathrm{m}$
and of OST/OSS Ch2 with the SPICA/B-BOP filter
$34\, {\rm{\mu }}\mathrm{m}$
and of OST/OSS Ch2 with the SPICA/B-BOP filter $70\, {\rm{\mu }}\mathrm{m}$
. We instead considered all six OST/OSS channels when comparing the spectroscopic capability of the two instruments.
$70\, {\rm{\mu }}\mathrm{m}$
. We instead considered all six OST/OSS channels when comparing the spectroscopic capability of the two instruments.
Confusion noise should not be a major problem in OST, given the large primary mirror, and it corresponds to 120 nJy and 1.1 mJy at 50 and $250\, {\rm{\mu }}\mathrm{m}$
. As for SPICA, the available spectra can be used to de-blend galaxies and break the confusion noise (Raymond et al. Reference Raymond, Isaak, Clements, Rykala and Pearson2010). The full list of OST/OSS channels and their expected observational depths are listed in Table 3.
$250\, {\rm{\mu }}\mathrm{m}$
. As for SPICA, the available spectra can be used to de-blend galaxies and break the confusion noise (Raymond et al. Reference Raymond, Isaak, Clements, Rykala and Pearson2010). The full list of OST/OSS channels and their expected observational depths are listed in Table 3. $5\sigma$
depths at six wavelengths corresponding to the OST/OSS spectroscopic channels, as planned for the two spectroscopic surveys (i.e. OST-Deep and OST-Wide) considered in this work.
$5\sigma$
depths at six wavelengths corresponding to the OST/OSS spectroscopic channels, as planned for the two spectroscopic surveys (i.e. OST-Deep and OST-Wide) considered in this work.
2.2.3. GEP
GEP (Glenn et al. Reference Glenn, Lystrup, MacEwen, Fazio, Batalha, Siegler and Tong2018) is a NASA concept of a 2 m cold (4 K) telescope with photometric and spectroscopic capability. The GEP Imager (GEP-I) is planned to have 23 bands covering 10– $400\, {\rm{\mu }}\mathrm{m}$
, with spectral resolution
$400\, {\rm{\mu }}\mathrm{m}$
, with spectral resolution $R=8$
at 10–
$R=8$
at 10– $95\, {\rm{\mu }}\mathrm{m}$
and
$95\, {\rm{\mu }}\mathrm{m}$
and $R=3.5$
at 95–
$R=3.5$
at 95– $400\, {\rm{\mu }}\mathrm{m}$
. Considering the central wavelengths of the different filters, in this work we compared results for the SPICA/SMI filter at
$400\, {\rm{\mu }}\mathrm{m}$
. Considering the central wavelengths of the different filters, in this work we compared results for the SPICA/SMI filter at $34\, {\rm{\mu }}\mathrm{m}$
and SPICA/B-BOP at
$34\, {\rm{\mu }}\mathrm{m}$
and SPICA/B-BOP at $70\, {\rm{\mu }}\mathrm{m}$
with the GEP-I filters centred at
$70\, {\rm{\mu }}\mathrm{m}$
with the GEP-I filters centred at ${\sim}33$
(Band 10) and
${\sim}33$
(Band 10) and $73\, {\rm{\mu }}\mathrm{m}$
(Band 16).
$73\, {\rm{\mu }}\mathrm{m}$
(Band 16).
At the moment of writing, there are four surveys planned:
-
An all sky survey with a
$5\sigma$
depth of
${\sim}1\ \mathrm{mJy}$
. -
A survey covering
$300\, \mathrm{deg}^{2}$
with a
$5\sigma$
depth of
${\sim}50\, {\rm{\mu }}\ \mathrm{Jy}$
. -
A survey covering
$30\, \mathrm{deg}^{2}$
with a
$5\sigma$
depth of
${\sim}20\, {\rm{\mu }} \mathrm{Jy}$
(hereafter GEP-Wide). -
A survey covering
$3\, \mathrm{deg}^{2}$
with a
$5\sigma$
depth of
${\sim}5\, {\rm{\mu }} \mathrm{Jy}$
(hereafter GEP-Deep).


For a better comparison with the SPICA surveys, in this work we considered only the last two surveys. Given the size of the primary mirror, GEP is expected to reach the confusion noise level in imaging at approximately $70\, {\rm{\mu }}\mathrm{m}$
in the two considered surveys (Glenn et al. Reference Glenn2019).
$70\, {\rm{\mu }}\mathrm{m}$
in the two considered surveys (Glenn et al. Reference Glenn2019).
In addition, the GEP Spectrometer (GEP-S) concept consists of four gratings covering from 24 to $193\, {\rm{\mu }}\mathrm{m}$
with
$193\, {\rm{\mu }}\mathrm{m}$
with $R=200$
. However, current plans for GEP-S include only pointed observations (Glenn et al. Reference Glenn2019). Therefore, we decided to limit the comparison of GEP and SPICA only to their photometric capability.
$R=200$
. However, current plans for GEP-S include only pointed observations (Glenn et al. Reference Glenn2019). Therefore, we decided to limit the comparison of GEP and SPICA only to their photometric capability.
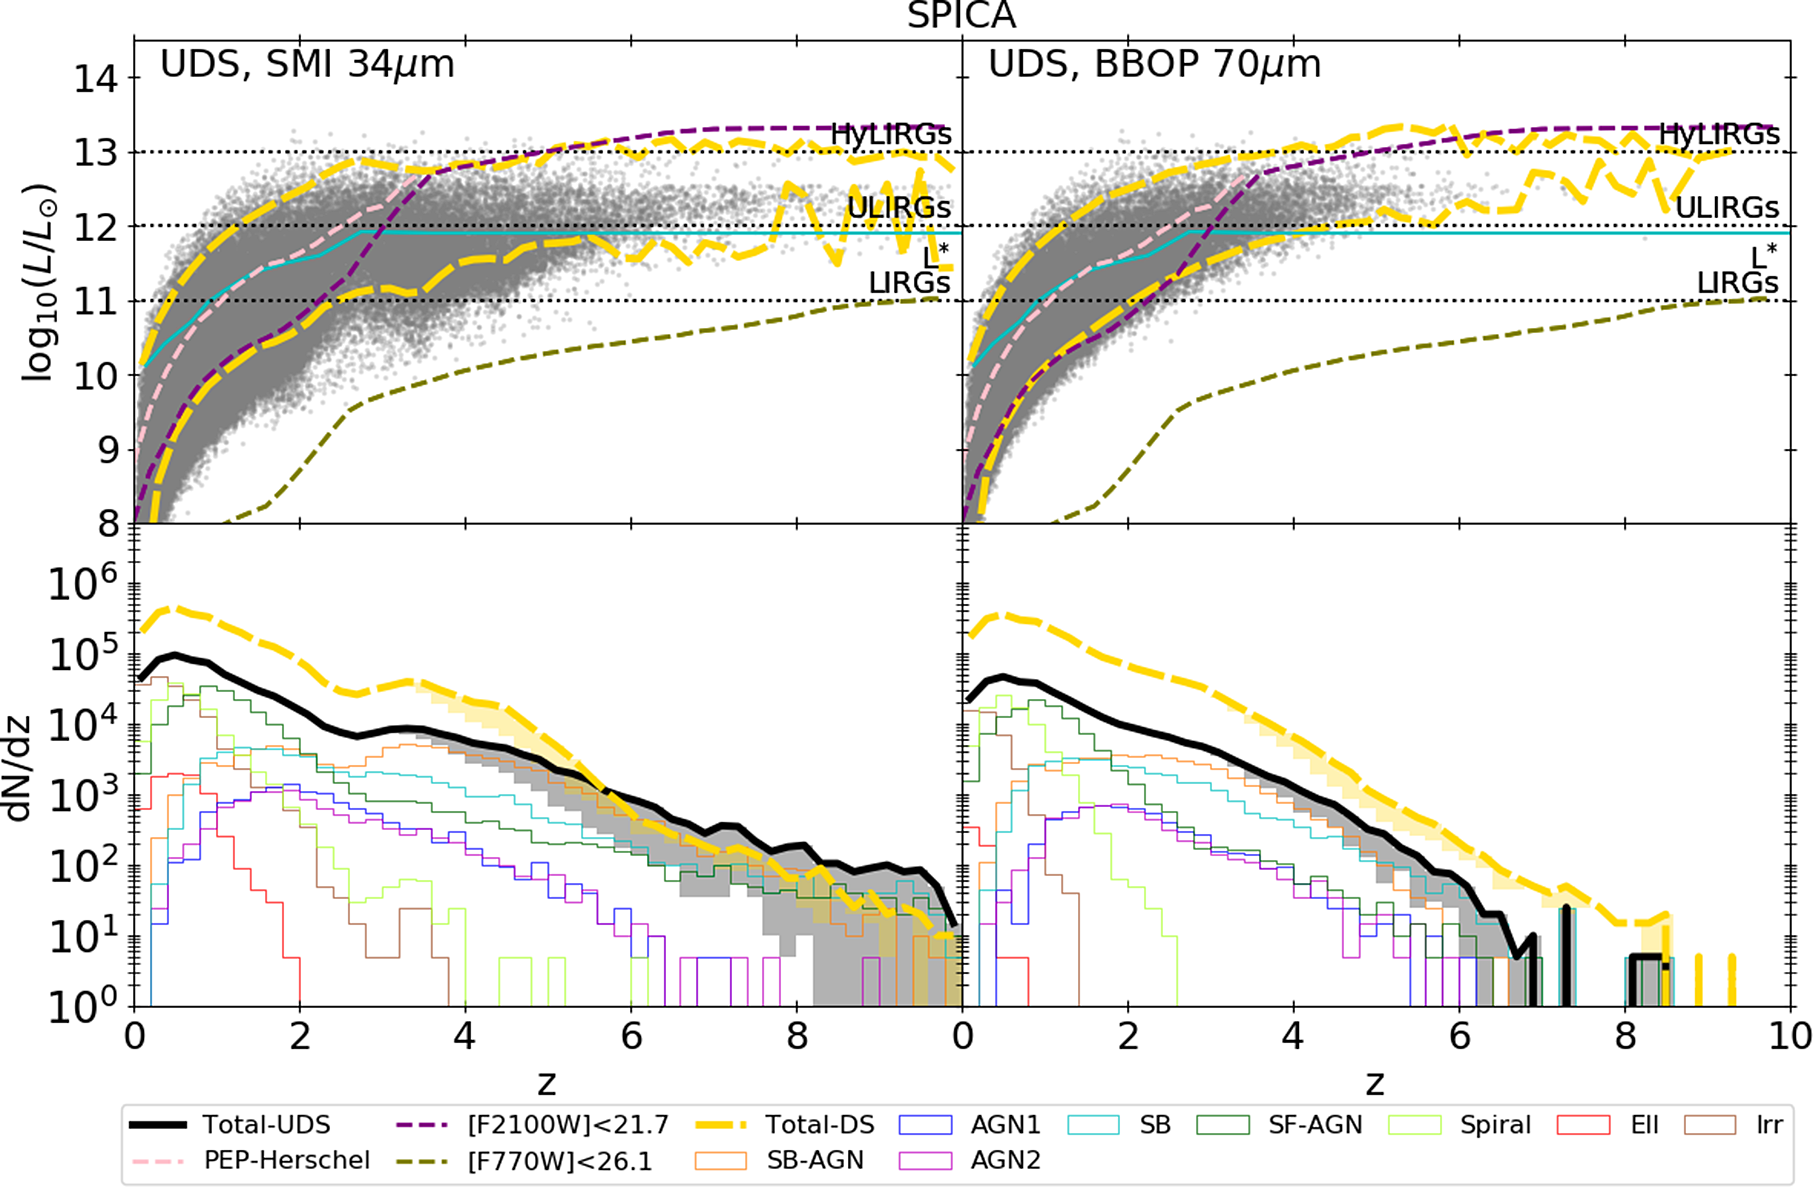
Top: $L_{IR}$
vs redshift for simulated galaxies (grey points) detected at
$L_{IR}$
vs redshift for simulated galaxies (grey points) detected at $34\, {\rm{\mu }}\mathrm{m}$
(left) and
$34\, {\rm{\mu }}\mathrm{m}$
(left) and $70\, {\rm{\mu }}\mathrm{m}$
(right) in the SPICA UDS. The dashed tick yellow lines refer to the
$70\, {\rm{\mu }}\mathrm{m}$
(right) in the SPICA UDS. The dashed tick yellow lines refer to the $L_{IR}$
area occupied by galaxies detected in SPICA DS. In each panel, the cyan solid line indicates the luminosity of the knee of the LF, as derived by Gruppioni et al. (Reference Gruppioni2013), while the pink dotted line show the 80% completeness of the Herschel-PEP survey at
$L_{IR}$
area occupied by galaxies detected in SPICA DS. In each panel, the cyan solid line indicates the luminosity of the knee of the LF, as derived by Gruppioni et al. (Reference Gruppioni2013), while the pink dotted line show the 80% completeness of the Herschel-PEP survey at $100\, {\rm{\mu }}\mathrm{m}$
in the GOODS-S (Berta et al. Reference Berta2013). We also report the 80% completeness of the two samples with JWST/MIRI [F2100]<21.7 and [F770W]<26.7. The horizontal dotted black lines indicate the IR luminosity limit of HyLIRGs, ULIGRs and LIRGs. Results are obtained considering the high-z extrapolation with
$100\, {\rm{\mu }}\mathrm{m}$
in the GOODS-S (Berta et al. Reference Berta2013). We also report the 80% completeness of the two samples with JWST/MIRI [F2100]<21.7 and [F770W]<26.7. The horizontal dotted black lines indicate the IR luminosity limit of HyLIRGs, ULIGRs and LIRGs. Results are obtained considering the high-z extrapolation with $k_{\Phi}=-1$
. Both surveys would have allowed to observe not only ULIRGs, as done with Herschel , but also less luminous galaxies. Bottom: Redshift distribution per unit redshift interval of sources detected at
$k_{\Phi}=-1$
. Both surveys would have allowed to observe not only ULIRGs, as done with Herschel , but also less luminous galaxies. Bottom: Redshift distribution per unit redshift interval of sources detected at $34\, {\rm{\mu }}\mathrm{m}$
with SMI (left) and at
$34\, {\rm{\mu }}\mathrm{m}$
with SMI (left) and at $70\, {\rm{\mu }}\mathrm{m}$
with B-BOP, as expected in the UDS (tick black lines) and in the DS (tick yellow dashed lines). For the UDS, we report also the distributions of the different sub-populations (coloured lines), all derived considering
$70\, {\rm{\mu }}\mathrm{m}$
with B-BOP, as expected in the UDS (tick black lines) and in the DS (tick yellow dashed lines). For the UDS, we report also the distributions of the different sub-populations (coloured lines), all derived considering $k_{\Phi}=-1$
. Results obtained with other
$k_{\Phi}=-1$
. Results obtained with other $\textit{z}>3$
extrapolations, that is from
$\textit{z}>3$
extrapolations, that is from $k_{\Phi}=-4$
to
$k_{\Phi}=-4$
to $-2$
, are included in the grey and yellow areas. Overall, observations at
$-2$
, are included in the grey and yellow areas. Overall, observations at $34\, {\rm{\mu }}\mathrm{m}$
could reach galaxies up to
$34\, {\rm{\mu }}\mathrm{m}$
could reach galaxies up to $\textit{z}\sim 8$
.
$\textit{z}\sim 8$
.
3. Predictions
3.1. Galaxy populations expected from photometric surveys
In this section, we give an overview of the physical properties of the galaxy populations that are expected to be detected by the considered photometric surveys, as derived from Spritz. We concentrate on the nature of such objects, but we highlight that, for their analysis, it may be necessary to rely on additional spectroscopic data (see Section 3.2) or a larger set of photometric data including also other wavelengths.
3.1.1. IR luminosities
We start by investigating the IR luminosity of the galaxies that we expect to observe with a SPICA-like mission (Figure 3), compared to predictions for OST (Figure 4) and GEP (Figure 5).
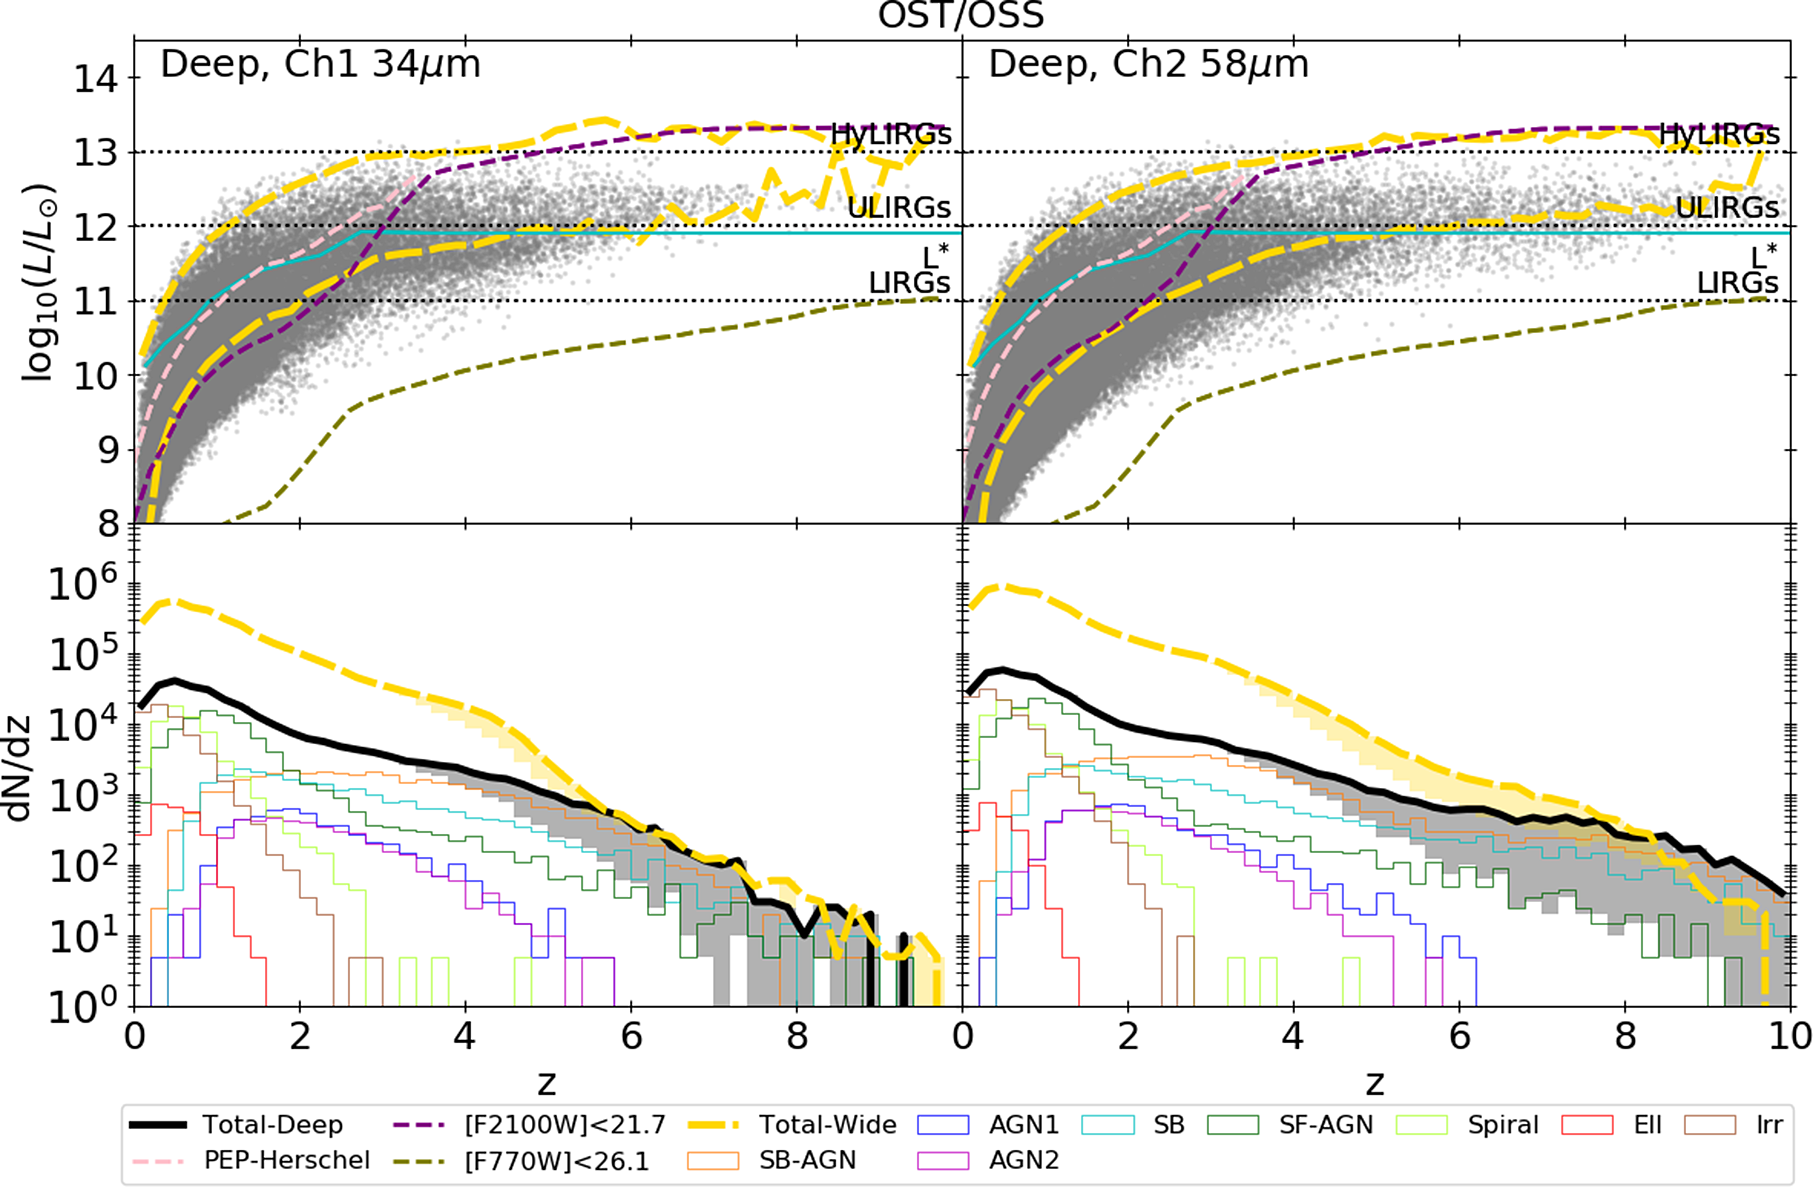
Same as Figure 3, but for galaxies detected with OST in channel 1 and 2 in the OST-Deep survey. Tick yellow dashed lines show the results for the OST-Wide survey. Both surveys will allow the detection of galaxies up to ${z}=7$
, thus extending the existing observations well below the ULIRG typical luminosity, at least up to
${z}=7$
, thus extending the existing observations well below the ULIRG typical luminosity, at least up to ${z}=5$
.
${z}=5$
.
Same as Figure 3, but for galaxies detected with GEP-I in channel 10 and 16 in the GEP-Deep survey. Tick yellow dashed lines show the results for the GEP-Wide survey. At both wavelengths, these surveys will allow the detection of galaxies up to ${z}=9$
and, at
${z}=9$
and, at $73\, {\rm{\mu }}\mathrm{m}$
, of some galaxies below the ULIRG luminosity at
$73\, {\rm{\mu }}\mathrm{m}$
, of some galaxies below the ULIRG luminosity at ${z}>5$
.
${z}>5$
.
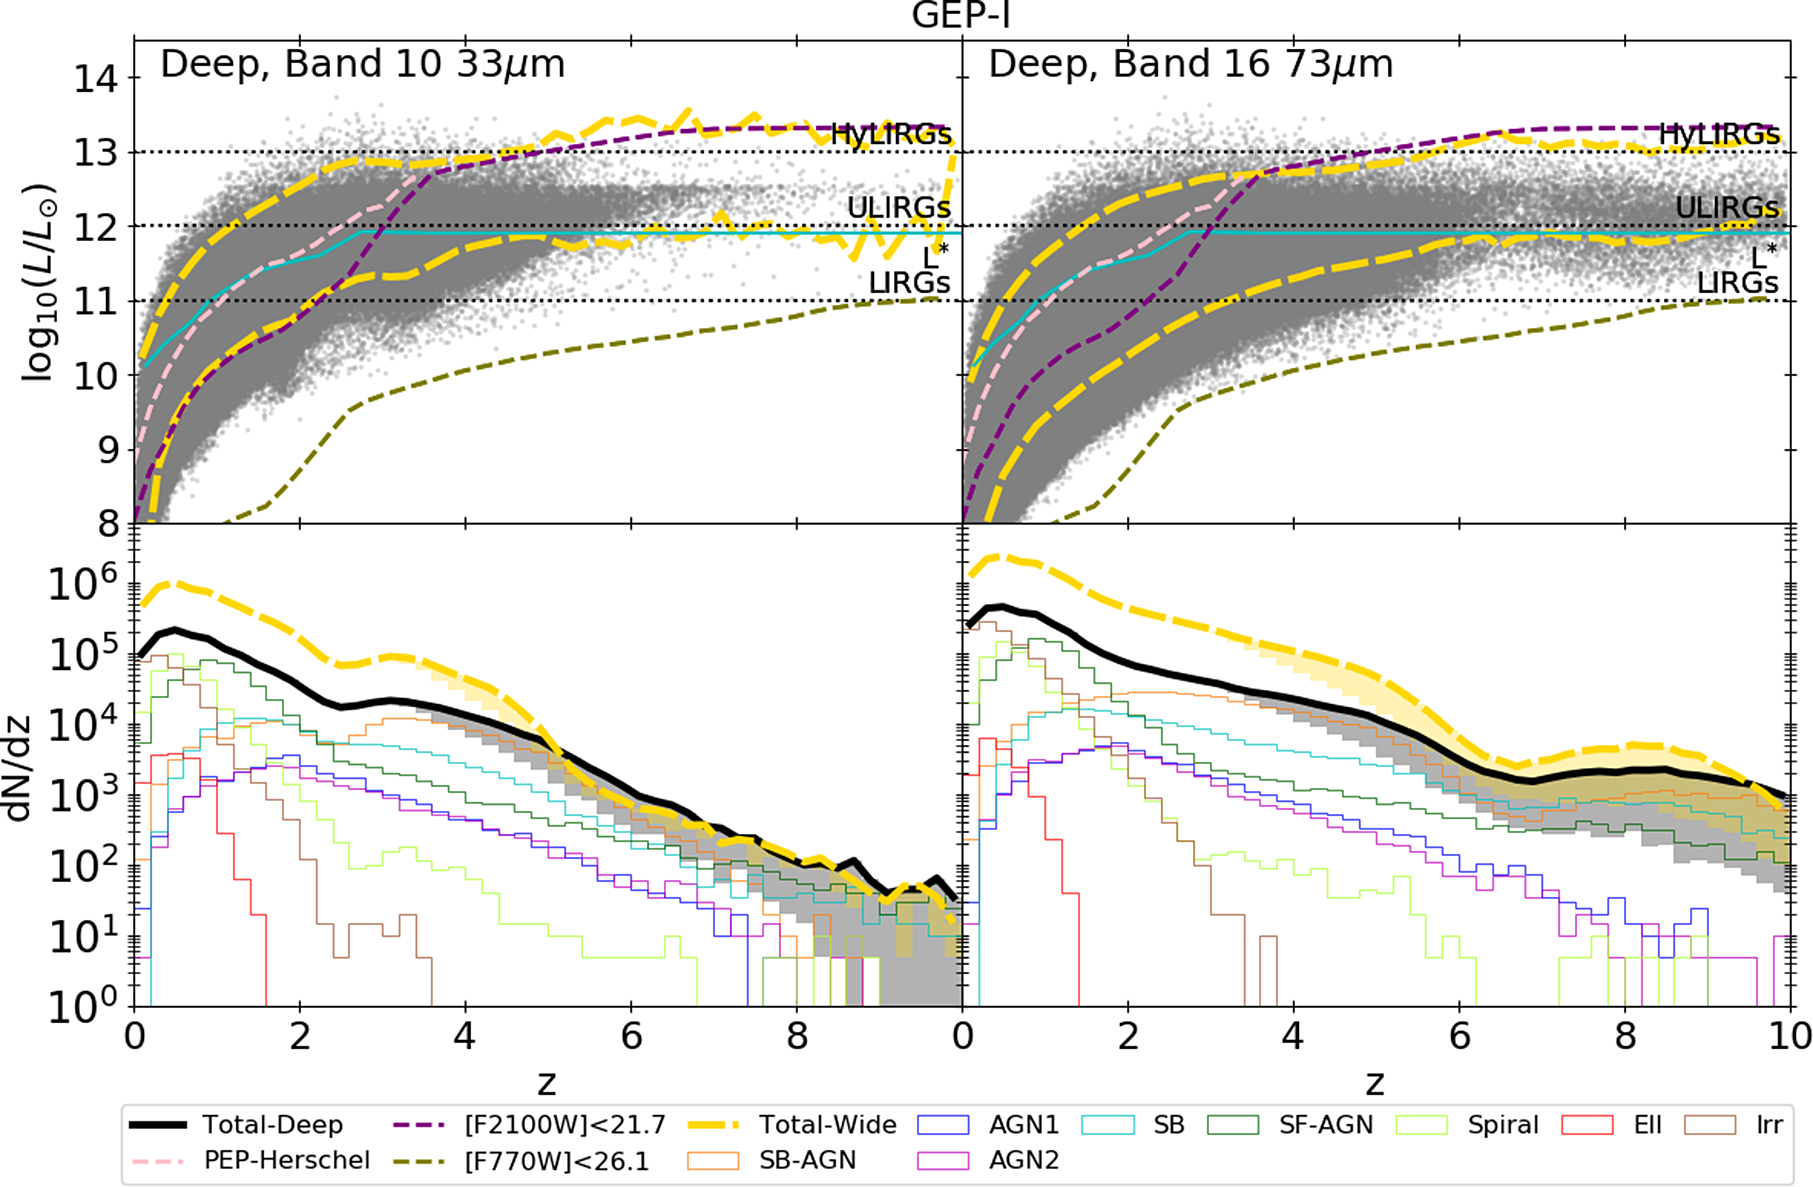
In both the UDS and DS, SMI would be able to detect galaxies with IR luminosities at the knee of the luminosity function, as derived by Gruppioni et al. (Reference Gruppioni2013), up to ${z}=6$
. This would be possible, at least for some objects, even up to
${z}=6$
. This would be possible, at least for some objects, even up to ${z}=10$
, while it would be limited to
${z}=10$
, while it would be limited to ${z}<4$
for B-BOP observations in both surveys.
${z}<4$
for B-BOP observations in both surveys.
The depth and area of the DS are ideal to statistically investigate the population of Ultra-luminous IR (ULIRG) and Hyper-luminous IR galaxies (HyLIRG), that is. respectively $L_{IR}>10^{12}\,{\rm L}_{\odot}$
and
$L_{IR}>10^{12}\,{\rm L}_{\odot}$
and $L_{IR}>10^{13}\,{\rm L}_{\odot}$
. We indeed would expect to detect around 4–
$L_{IR}>10^{13}\,{\rm L}_{\odot}$
. We indeed would expect to detect around 4– $6\times10^{4}$
ULIRGs up to redshift
$6\times10^{4}$
ULIRGs up to redshift ${z}=10$
, showing a mean redshift in the range
${z}=10$
, showing a mean redshift in the range ${z}=2.8$
–3.5 and
${z}=2.8$
–3.5 and ${\sim}700$
–900 HyLIRGs with a mean redshift
${\sim}700$
–900 HyLIRGs with a mean redshift ${z}=2.6$
–3.8. For comparison, in the UDS, which covers only
${z}=2.6$
–3.8. For comparison, in the UDS, which covers only $1\, \mathrm{deg}^{2}$
, we would expect to detect only a few tens (30–50) of HyLIRGs. For an area of
$1\, \mathrm{deg}^{2}$
, we would expect to detect only a few tens (30–50) of HyLIRGs. For an area of $100\, \mathrm{deg}^{2}$
and considering the same observational depth of the DS, which was not possible with SPICA but may be feasible with future IR missions, we would expect
$100\, \mathrm{deg}^{2}$
and considering the same observational depth of the DS, which was not possible with SPICA but may be feasible with future IR missions, we would expect ${\sim}5\,000$
–6 000 HyLIRGs with mean redshift
${\sim}5\,000$
–6 000 HyLIRGs with mean redshift ${z}=3.6$
–3.8 and 3.5–
${z}=3.6$
–3.8 and 3.5– $4.7\times10^{5}$
ULIRGs with mean redshift
$4.7\times10^{5}$
ULIRGs with mean redshift ${z}= 3.0$
–3.4.
${z}= 3.0$
–3.4.
The uncertainties on the numbers of ULIRG and HyLIRG are due to the extrapolation of the IR LF at ${z}>3$
, which impacts also the mean redshift of the simulated sample. In fact, if we consider
${z}>3$
, which impacts also the mean redshift of the simulated sample. In fact, if we consider $k_{\Phi}=-$
4 instead of
$k_{\Phi}=-$
4 instead of $k_{\Phi}=-$
1, the average redshift decreases as there are fewer galaxies at
$k_{\Phi}=-$
1, the average redshift decreases as there are fewer galaxies at $\textit{z}>3$
.
$\textit{z}>3$
.
The predicted HyLIRGs number (i.e. 30– $50\, \mathrm{deg}^{-2}$
) corresponds to a larger surface density than the one observed by Wang et al. (Reference Wang2021), which ranges between 5 and 18 HyLIRGs
$50\, \mathrm{deg}^{-2}$
) corresponds to a larger surface density than the one observed by Wang et al. (Reference Wang2021), which ranges between 5 and 18 HyLIRGs $\mathrm{per\ deg}^{2}$
. However, these surface densities are consistent with each other, once we take into account the uncertainties on the bright-end of the IR Herschel LF by Gruppioni et al. (Reference Gruppioni2013), which varies between 0.07 and 0.43 dex for
$\mathrm{per\ deg}^{2}$
. However, these surface densities are consistent with each other, once we take into account the uncertainties on the bright-end of the IR Herschel LF by Gruppioni et al. (Reference Gruppioni2013), which varies between 0.07 and 0.43 dex for $L_{IR}>10^{13}\,{\rm L}_{\odot}$
, depending on the considered redshift. Even considering the more optimistic estimation of the HyLIRGs surface density, we need an area larger than
$L_{IR}>10^{13}\,{\rm L}_{\odot}$
, depending on the considered redshift. Even considering the more optimistic estimation of the HyLIRGs surface density, we need an area larger than ${\sim}70\ \mathrm{arcmin}^{2}$
to detect at least one of them. This consideration shows the complementarity of missions such as SPICA, OST or GEP with respect to JWST, for which it is difficult to observe large areas, particularly in the mid-IR.
${\sim}70\ \mathrm{arcmin}^{2}$
to detect at least one of them. This consideration shows the complementarity of missions such as SPICA, OST or GEP with respect to JWST, for which it is difficult to observe large areas, particularly in the mid-IR.
The galaxy population observed by a SPICA-like mission would not be limited to extreme IR galaxies. Indeed, with SMI at $34\, {\rm{\mu }}\mathrm{m}$
, we would expect to observe below the luminosity of the so-called Luminous IR galaxies (LIRGs,
$34\, {\rm{\mu }}\mathrm{m}$
, we would expect to observe below the luminosity of the so-called Luminous IR galaxies (LIRGs, $L_{IR}=10^{11}\,{\rm L}_{\odot}$
) up to
$L_{IR}=10^{11}\,{\rm L}_{\odot}$
) up to ${z}=4.0$
and
${z}=4.0$
and ${z}=2.5$
in the UDS and DS, respectively. Even if these observations would be mainly limited to
${z}=2.5$
in the UDS and DS, respectively. Even if these observations would be mainly limited to ${z}<2.0$
at
${z}<2.0$
at $70\, {\rm{\mu }}\mathrm{m}$
, they would lead to breakthrough results such as the unprecedented, direct measure of the faint-end slope of the luminosity function at these wavelengths.
$70\, {\rm{\mu }}\mathrm{m}$
, they would lead to breakthrough results such as the unprecedented, direct measure of the faint-end slope of the luminosity function at these wavelengths.
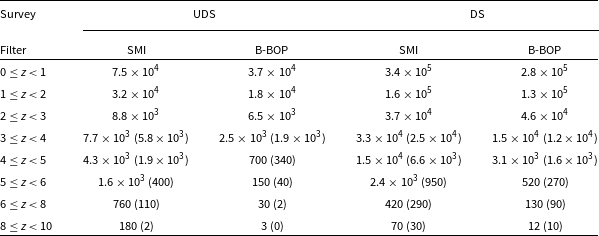
Approximated number of galaxies in different redshift intervals detected by SMI and B-BOP, as expected for the UDS and DS. Numbers in brackets are for the most conservative extrapolation at $\textit{z}>3$
considered in this work (i.e.
$\textit{z}>3$
considered in this work (i.e. $k_{\Phi}=-4$
).
$k_{\Phi}=-4$
).
The OST/OSS Ch1 depth in the OST-Deep survey is similar to the SMI depth at $34\, {\rm{\mu }}\mathrm{m}$
in the SPICA UDS and, indeed, the IR luminosity of observed galaxies is expected to be similar. In the OST-Wide Survey the OST/OSS Ch1 is instead planned to be shallower than SMI at
$34\, {\rm{\mu }}\mathrm{m}$
in the SPICA UDS and, indeed, the IR luminosity of observed galaxies is expected to be similar. In the OST-Wide Survey the OST/OSS Ch1 is instead planned to be shallower than SMI at $34\, {\rm{\mu }}\mathrm{m}$
, that is
$34\, {\rm{\mu }}\mathrm{m}$
, that is $30.3\, {\rm{\mu }} \mathrm{Jy}$
compared to
$30.3\, {\rm{\mu }} \mathrm{Jy}$
compared to $13\, {\rm{\mu }}\mathrm{Jy}$
. This limits the number of the detectable faint galaxies with respect to what was expected for SPICA. However, the planned observational depths for the OST/OSS Ch2 are deeper than the ones planned for SPICA/B-BOP at
$13\, {\rm{\mu }}\mathrm{Jy}$
. This limits the number of the detectable faint galaxies with respect to what was expected for SPICA. However, the planned observational depths for the OST/OSS Ch2 are deeper than the ones planned for SPICA/B-BOP at $70\, {\rm{\mu }}\mathrm{m}$
. For this reason, in the OST/OSS Ch2 we expect to observe galaxies below the ULIRG limit up to
$70\, {\rm{\mu }}\mathrm{m}$
. For this reason, in the OST/OSS Ch2 we expect to observe galaxies below the ULIRG limit up to ${z}\sim 7.5$
in the OST-Deep Survey and up to
${z}\sim 7.5$
in the OST-Deep Survey and up to ${z}\sim 5.5$
in the OST-Wide Survey.
${z}\sim 5.5$
in the OST-Wide Survey.
GEP-I observational depths are expected to be of ${\sim}5$
and
${\sim}5$
and $20\, {\rm{\mu }}\ \mathrm{Jy}$
, in the 3 and
$20\, {\rm{\mu }}\ \mathrm{Jy}$
, in the 3 and $30\, \mathrm{deg}^{2}$
surveys, respectively. Such surveys are therefore deeper than both SPICA surveys at
$30\, \mathrm{deg}^{2}$
surveys, respectively. Such surveys are therefore deeper than both SPICA surveys at $70\, {\rm{\mu }}\mathrm{m}$
and the SPICA DS at
$70\, {\rm{\mu }}\mathrm{m}$
and the SPICA DS at $34\, {\rm{\mu }}\mathrm{m}$
. For this reason, we expect to see galaxies with IR luminosity below the ULIRGs regime up to
$34\, {\rm{\mu }}\mathrm{m}$
. For this reason, we expect to see galaxies with IR luminosity below the ULIRGs regime up to $\textit{z}= 5.5$
(5.0) and 8.5 (4.0) at 33 and
$\textit{z}= 5.5$
(5.0) and 8.5 (4.0) at 33 and $73\, {\rm{\mu }}\mathrm{m}$
in the deepest (widest) considered GEP survey. However, we note that the number and the maximum observable redshift of galaxies with
$73\, {\rm{\mu }}\mathrm{m}$
in the deepest (widest) considered GEP survey. However, we note that the number and the maximum observable redshift of galaxies with $L_{IR}<10^{12}\,{\rm L}_{\odot}$
detected by GEP-I may be underestimated, as we consider only two of the 23 filters available. A similar case does not hold for OST, as the most sensitive filters are those at the shortest wavelengths and they are the filters we considered in this work.
$L_{IR}<10^{12}\,{\rm L}_{\odot}$
detected by GEP-I may be underestimated, as we consider only two of the 23 filters available. A similar case does not hold for OST, as the most sensitive filters are those at the shortest wavelengths and they are the filters we considered in this work.
We also compared the 80% limits of the $L_{IR}$
, derived using Spritz, of two samples selected in two JWST/MIRI filters: [F2100W] < 21.7 (i.e.
$L_{IR}$
, derived using Spritz, of two samples selected in two JWST/MIRI filters: [F2100W] < 21.7 (i.e. $7.5\, {\rm{\mu }}\mathrm{Jy}$
) and [F770W] < 26.7 (i.e.
$7.5\, {\rm{\mu }}\mathrm{Jy}$
) and [F770W] < 26.7 (i.e. $0.07\, {\rm{\mu }}\mathrm{Jy}$
). The two selections correspond to the magnitude limits of the CEERS and JADES surveys, respectively, in their two longest wavelength filters (see Section 2.2.1). For this comparison, photometric errors are not included in the JWST fluxes.
$0.07\, {\rm{\mu }}\mathrm{Jy}$
). The two selections correspond to the magnitude limits of the CEERS and JADES surveys, respectively, in their two longest wavelength filters (see Section 2.2.1). For this comparison, photometric errors are not included in the JWST fluxes.
The first flux cut corresponds to a $L_{IR}$
limit similar to the UDS and DS limits at
$L_{IR}$
limit similar to the UDS and DS limits at $70\, {\rm{\mu }}\mathrm{m}$
, to the OST-Wide limit at
$70\, {\rm{\mu }}\mathrm{m}$
, to the OST-Wide limit at $34\, {\rm{\mu }}\mathrm{m}$
and to the GEP-Wide limit at
$34\, {\rm{\mu }}\mathrm{m}$
and to the GEP-Wide limit at $33\, {\rm{\mu }}\mathrm{m}$
, at least up to
$33\, {\rm{\mu }}\mathrm{m}$
, at least up to ${z}=3$
, while it probes galaxies with brighter
${z}=3$
, while it probes galaxies with brighter $L_{IR}$
than the other SPICA, OST and GEP surveys. The second JWST flux threshold corresponds to a
$L_{IR}$
than the other SPICA, OST and GEP surveys. The second JWST flux threshold corresponds to a $L_{IR}$
limit much fainter than all the considered SPICA, OST and GEP surveys, showing the power of JWST to observe very faint galaxies.
$L_{IR}$
limit much fainter than all the considered SPICA, OST and GEP surveys, showing the power of JWST to observe very faint galaxies.
The expected number of galaxies observed by JWST will be smaller than the number observed by the considered SPICA, OST and GEP surveys, given the small sky area covered by the two considered JWST surveys (i.e. ${\sim}4.6$
and
${\sim}4.6$
and $8 \mathrm{arcmin}^{2}$
for the CEERS F2100W and for the JADES F770W observations, respectively). These small areas would also limit or preclude observations of very bright galaxies. In addition, JWST does not allow one to fully sample the far-IR dust bump at any redshift, but this is instead possible with OST and GEP, enabling the characterisation of the properties of the dust in high-redshift galaxies. Moreover, the same would have been possible with SPICA, thanks to the capabilities of the B-BOP instrument.
$8 \mathrm{arcmin}^{2}$
for the CEERS F2100W and for the JADES F770W observations, respectively). These small areas would also limit or preclude observations of very bright galaxies. In addition, JWST does not allow one to fully sample the far-IR dust bump at any redshift, but this is instead possible with OST and GEP, enabling the characterisation of the properties of the dust in high-redshift galaxies. Moreover, the same would have been possible with SPICA, thanks to the capabilities of the B-BOP instrument.
3.1.2. Redshift distribution
In Figure 3, we show the expected redshift distribution per unit redshift interval of the galaxies that would be detected in the SPICA UDS and DS with SMI at $34\, {\rm{\mu }}\mathrm{m}$
and B-BOP at
$34\, {\rm{\mu }}\mathrm{m}$
and B-BOP at $70\, {\rm{\mu }}\mathrm{m}$
. In Table 4 we list the predicted number of galaxies that would be detected in the considered filters in the UDS and DS in different redshift intervals. At
$70\, {\rm{\mu }}\mathrm{m}$
. In Table 4 we list the predicted number of galaxies that would be detected in the considered filters in the UDS and DS in different redshift intervals. At ${z}<2$
, we would expect a few times
${z}<2$
, we would expect a few times $10^{4}$
objects per redshift bin to be detected at both wavelengths in the UDS, while this number increases to a few times
$10^{4}$
objects per redshift bin to be detected at both wavelengths in the UDS, while this number increases to a few times $10^{5}$
in the DS. These are predominantly normal star-forming galaxies, that is labelled as spiral, irregular or SF-AGN in the figures, with an increment of the starburst fraction with increasing redshift. Such observations would have allowed for outstanding improvements of our knowledge of the LF, not only at its knee, thanks to the large number of observed galaxies, but also at the faint end, considering the possible observations of galaxies below the LIRG limit.
$10^{5}$
in the DS. These are predominantly normal star-forming galaxies, that is labelled as spiral, irregular or SF-AGN in the figures, with an increment of the starburst fraction with increasing redshift. Such observations would have allowed for outstanding improvements of our knowledge of the LF, not only at its knee, thanks to the large number of observed galaxies, but also at the faint end, considering the possible observations of galaxies below the LIRG limit.
Up to ${z}=2$
, we would also expect to observe a sample of elliptical galaxies, whose analysis in the IR has been limited up to now mainly to nearby objects (e.g. Smith et al. Reference Smith2012). Their numbers would vary between
${z}=2$
, we would also expect to observe a sample of elliptical galaxies, whose analysis in the IR has been limited up to now mainly to nearby objects (e.g. Smith et al. Reference Smith2012). Their numbers would vary between $10^{2}$
and
$10^{2}$
and $10^{3}$
objects in total, depending on the instrument considered and the area covered.
$10^{3}$
objects in total, depending on the instrument considered and the area covered.
At increasing redshift, the number of observed galaxies would decrease, but we would expect to detect galaxies up to extremely high-z at $34\, {\rm{\mu }}\mathrm{m}$
and at least up to
$34\, {\rm{\mu }}\mathrm{m}$
and at least up to $\textit{z}= 7$
–8 at
$\textit{z}= 7$
–8 at $70\, {\rm{\mu }}\mathrm{m}$
, thanks to the combination of depth and area coverage. At
$70\, {\rm{\mu }}\mathrm{m}$
, thanks to the combination of depth and area coverage. At $34\, {\rm{\mu }}\mathrm{m}$
, we would expect
$34\, {\rm{\mu }}\mathrm{m}$
, we would expect ${\sim}100$
–900 objects at
${\sim}100$
–900 objects at ${z}>6$
detected in the UDS and slightly less, that is
${z}>6$
detected in the UDS and slightly less, that is ${\sim}300$
–500, in the shallower DS. The uncertainties are due to the high-z extrapolation. The
${\sim}300$
–500, in the shallower DS. The uncertainties are due to the high-z extrapolation. The $70\, {\rm{\mu }}\mathrm{m}$
filter would have been less sensitive than the
$70\, {\rm{\mu }}\mathrm{m}$
filter would have been less sensitive than the $34\, {\rm{\mu }}\mathrm{m}$
filter, resulting on fewer observed objects. In particular, we predict at maximum a few tens of detections in the UDS and around one hundred in the DS.
$34\, {\rm{\mu }}\mathrm{m}$
filter, resulting on fewer observed objects. In particular, we predict at maximum a few tens of detections in the UDS and around one hundred in the DS.
Keeping in mind the limitations of the simulation at ${z}>6$
, we would expect these high-z galaxies to be SBs or composite galaxies with an AGN component (i.e. SB-AGN and SF-AGN), with some AGN-dominated system only in the DS. In the UDS (DS) these galaxies would have an average stellar mass of
${z}>6$
, we would expect these high-z galaxies to be SBs or composite galaxies with an AGN component (i.e. SB-AGN and SF-AGN), with some AGN-dominated system only in the DS. In the UDS (DS) these galaxies would have an average stellar mass of $\mathrm{log}_{10}(\rm{M^*}/\rm{M}_{\odot})=10.7$
(11.1), with values ranging from 8.5 (9.1) to 11.8 (12.2). The average SFR, derived combining UV and IR estimations, would be
$\mathrm{log}_{10}(\rm{M^*}/\rm{M}_{\odot})=10.7$
(11.1), with values ranging from 8.5 (9.1) to 11.8 (12.2). The average SFR, derived combining UV and IR estimations, would be $\mathrm{log}_{10}(\rm{SFR_{UV+IR}}/\rm{M}_{\odot}\,\rm{yr}^{-1})=2.1$
in the UDS and 2.3 in the DS, but it could even reach up to
$\mathrm{log}_{10}(\rm{SFR_{UV+IR}}/\rm{M}_{\odot}\,\rm{yr}^{-1})=2.1$
in the UDS and 2.3 in the DS, but it could even reach up to $\mathrm{log}_{10}(\rm{SFR_{UV+IR}}/\rm{M}_{\odot}\,\rm{yr}^{-1})=3.8$
. However, these SFRs need to be considered as lower limits, as comparing the simulation with observations at
$\mathrm{log}_{10}(\rm{SFR_{UV+IR}}/\rm{M}_{\odot}\,\rm{yr}^{-1})=3.8$
. However, these SFRs need to be considered as lower limits, as comparing the simulation with observations at ${z}>6$
, we derived that a population of highly star-forming systems (i.e.
${z}>6$
, we derived that a population of highly star-forming systems (i.e. $\mathrm{log}_{10}$
(sSFR/yr)
$\mathrm{log}_{10}$
(sSFR/yr) $\gtrsim -7.5$
) may be missing (see Bisigello et al. Reference Bisigello2021). The gas-phase metallicity, derived considering the mass-metallicity relation by Wuyts et al. (Reference Wuyts2014), would be on average
$\gtrsim -7.5$
) may be missing (see Bisigello et al. Reference Bisigello2021). The gas-phase metallicity, derived considering the mass-metallicity relation by Wuyts et al. (Reference Wuyts2014), would be on average $12+\mathrm{log}_{10}(\mathrm{O}/\mathrm{H})=8.3$
–8.4, depending on the considered survey, but it could go as down as 7.5. All these values are derived considering the high-z extrapolation with
$12+\mathrm{log}_{10}(\mathrm{O}/\mathrm{H})=8.3$
–8.4, depending on the considered survey, but it could go as down as 7.5. All these values are derived considering the high-z extrapolation with $k_{\Phi}=-1$
.
$k_{\Phi}=-1$
.
The improvement with respect to previous surveys is outstanding, given that Herschel , for example, has been mainly limited to galaxies below $z\leq\,$
3.5 (e.g. Gruppioni et al. Reference Gruppioni2013). This shows the need for similar surveys when investigating the evolution of both star-formation and black hole accretion in galaxies over a large redshift range.
$z\leq\,$
3.5 (e.g. Gruppioni et al. Reference Gruppioni2013). This shows the need for similar surveys when investigating the evolution of both star-formation and black hole accretion in galaxies over a large redshift range.
In Figure 4, we show the results for OST/OSS. On one hand, with the OST/OSS Ch1 filter, we expect to be limited to $\textit{z}<8$
in both the OST-Deep and OST-Wide surveys, with the possibility to observe few tens (300) of galaxies
$\textit{z}<8$
in both the OST-Deep and OST-Wide surveys, with the possibility to observe few tens (300) of galaxies $\textit{z}>8$
(
$\textit{z}>8$
( $\textit{z}>6$
) in the OST-Deep survey if we consider the flattest redshift evolution of the LF (i.e.
$\textit{z}>6$
) in the OST-Deep survey if we consider the flattest redshift evolution of the LF (i.e. $k_{\Phi}=-1$
). On the other hand, with the OST/OSS Ch2 filter we expect to observe 0.8–
$k_{\Phi}=-1$
). On the other hand, with the OST/OSS Ch2 filter we expect to observe 0.8– $2.1\times10^{3}$
galaxies with
$2.1\times10^{3}$
galaxies with $\textit{z}>6$
in the OST-Wide survey of
$\textit{z}>6$
in the OST-Wide survey of $20\, \mathrm{deg}^{2}$
, depending on the considered extrapolation of the LF at high redshift.
$20\, \mathrm{deg}^{2}$
, depending on the considered extrapolation of the LF at high redshift.
In the OST-Deep (OST-Wide) survey such high-z ( $\textit{z}>6$
) galaxies are expected to have, on average,
$\textit{z}>6$
) galaxies are expected to have, on average, $\mathrm{log}_{10}(\rm{M*}/\rm{M}_{\odot})=10.5$
(11.0) and
$\mathrm{log}_{10}(\rm{M*}/\rm{M}_{\odot})=10.5$
(11.0) and $\mathrm{log}_{10}(\rm{SFR_{UV+IR}}/\rm{M}_{\odot}\,\rm{yr}^{-1})= 2.0$
(2.4), considering the
$\mathrm{log}_{10}(\rm{SFR_{UV+IR}}/\rm{M}_{\odot}\,\rm{yr}^{-1})= 2.0$
(2.4), considering the $k_{\Phi}=-1$
high-z extrapolation. These galaxies are, on average, less massive and more star-forming than the ones that would be detected by SPICA, because OST/OSS Ch2 observations are planned to be deeper than B-BOP observations. We remind the reader that for a fair comparison with SPICA capabilities we have considered only the first two OST/OSS channels. However, because of the positive k-correction (i.e. rest-frame wavelengths moving closer to the peak of dust emission at increasing redshift), the number of
$k_{\Phi}=-1$
high-z extrapolation. These galaxies are, on average, less massive and more star-forming than the ones that would be detected by SPICA, because OST/OSS Ch2 observations are planned to be deeper than B-BOP observations. We remind the reader that for a fair comparison with SPICA capabilities we have considered only the first two OST/OSS channels. However, because of the positive k-correction (i.e. rest-frame wavelengths moving closer to the peak of dust emission at increasing redshift), the number of $\textit{z}>6$
galaxies detected by OST is expected to increase when considering all six channels.
$\textit{z}>6$
galaxies detected by OST is expected to increase when considering all six channels.
Figure 5 shows the results for GEP. In the survey of $3\, \mathrm{deg}^{2}$
, we instead expect to observe 1–
$3\, \mathrm{deg}^{2}$
, we instead expect to observe 1– $7\times10^{3}$
galaxies at
$7\times10^{3}$
galaxies at $\textit{z}>6$
with the narrow filter centred at
$\textit{z}>6$
with the narrow filter centred at $73\, {\rm{\mu }}\mathrm{m}$
(Band 16) and 200–3 500 with the filter centred at
$73\, {\rm{\mu }}\mathrm{m}$
(Band 16) and 200–3 500 with the filter centred at $33\, {\rm{\mu }}\mathrm{m}$
(Band 10). In the shallower survey of
$33\, {\rm{\mu }}\mathrm{m}$
(Band 10). In the shallower survey of $30\, \mathrm{deg}^{2}$
we instead expect
$30\, \mathrm{deg}^{2}$
we instead expect ${\sim}500$
–800 galaxies detected in Band 10 and between 2 700 and
${\sim}500$
–800 galaxies detected in Band 10 and between 2 700 and $1.3\times10^{4}$
in Band 16.
$1.3\times10^{4}$
in Band 16.
In the GEP-Deep (GEP-Wide) survey such galaxies are expected to have, on average, $\mathrm{log}_{10}(\rm{M*}/\rm{M}_{\odot})=10.5$
(10.9) and
$\mathrm{log}_{10}(\rm{M*}/\rm{M}_{\odot})=10.5$
(10.9) and $\mathrm{log}_{10}(\rm{SFR_{UV+IR}}/\rm{M}_{\odot}\,\rm{yr}^{-1})=1.9$
(2.2), considering the
$\mathrm{log}_{10}(\rm{SFR_{UV+IR}}/\rm{M}_{\odot}\,\rm{yr}^{-1})=1.9$
(2.2), considering the $k_{\Phi}=-1$
high-z extrapolation. In the GEP-Deep survey we also expect some AGN-dominated galaxies (i.e. AGN1 and AGN2) too rare for the OST-Deep survey or the UDS.
$k_{\Phi}=-1$
high-z extrapolation. In the GEP-Deep survey we also expect some AGN-dominated galaxies (i.e. AGN1 and AGN2) too rare for the OST-Deep survey or the UDS.
Differences between SPICA, OST and GEP are driven by the different observational depths and different survey sizes, but also, in particular in the case of GEP, by the different filter widths.
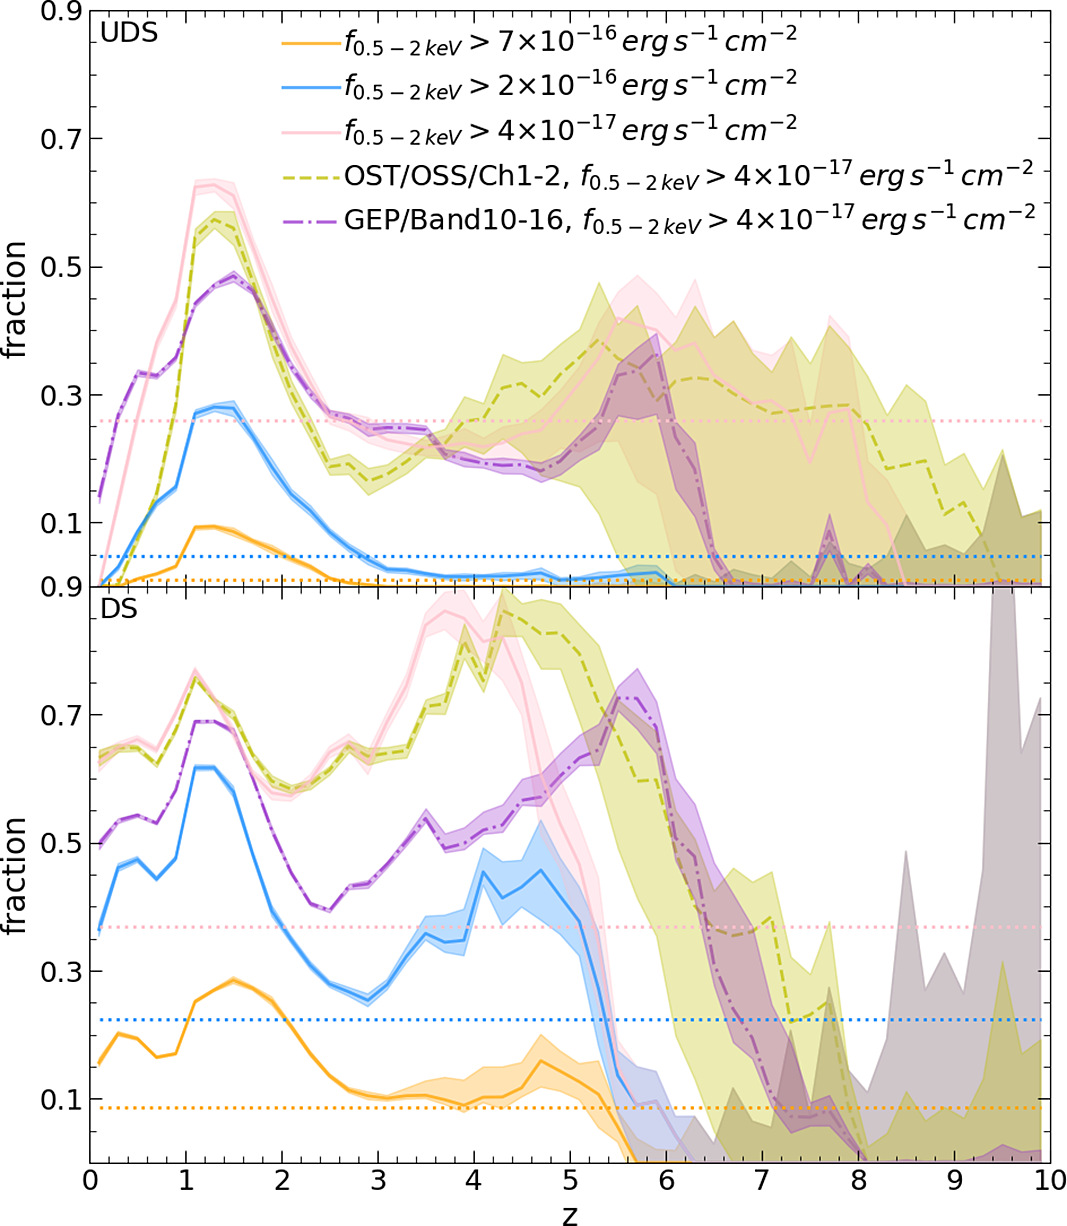
Fraction of simulated AGN detected in the IR with X-ray flux at 0.5–2 keV above $4\times10^{-17}$
(pink lines),
$4\times10^{-17}$
(pink lines), $2\times10^{-16}$
(blue lines) and 7
$2\times10^{-16}$
(blue lines) and 7 $\times10^{-16}\,{\rm erg\,s}^{-1}\,{\rm cm}^{-2}$
(orange lines), in the SPICA UDS (top) and DS (bottom). We also report the fraction of simulated AGN with X-ray flux at 0.5–2 keV above
$\times10^{-16}\,{\rm erg\,s}^{-1}\,{\rm cm}^{-2}$
(orange lines), in the SPICA UDS (top) and DS (bottom). We also report the fraction of simulated AGN with X-ray flux at 0.5–2 keV above $4\times10^{-17}\,{\rm erg\,s}^{-1}\,{\rm cm}^{-2}$
detected with OST/OSS (green dashed line) in the OST-Deep (top) and OST-Wide survey (bottom). The same fraction is shown for AGN detected with GEP (purple dot-dashed line) in the survey of 3 (top) and
$4\times10^{-17}\,{\rm erg\,s}^{-1}\,{\rm cm}^{-2}$
detected with OST/OSS (green dashed line) in the OST-Deep (top) and OST-Wide survey (bottom). The same fraction is shown for AGN detected with GEP (purple dot-dashed line) in the survey of 3 (top) and $30\, \mathrm{deg}^{2}$
(bottom). Shaded areas show the uncertainties, including Poisson errors and the extrapolation at
$30\, \mathrm{deg}^{2}$
(bottom). Shaded areas show the uncertainties, including Poisson errors and the extrapolation at ${z}>3$
, while horizontal dotted lines indicate the average fraction for SPICA across the entire redshift range. IR observations are key to putting together a complete picture of AGN activity, as X-ray observations may miss a large fraction of them because of dust absorption.
${z}>3$
, while horizontal dotted lines indicate the average fraction for SPICA across the entire redshift range. IR observations are key to putting together a complete picture of AGN activity, as X-ray observations may miss a large fraction of them because of dust absorption.
3.1.3. X-ray fluxes
If we focus on the AGN activity, we can investigate what are the expected soft (0.5–2 keV, Figure 6) and hard (2–10 keV, Figure 7) X-ray fluxes for each galaxy detected by a SPICA-like mission, OST or GEP. This is important because, for galaxies with both IR and X-ray observations, it will be possible to analyse the global energetics of the AGN. In addition, IR observations are complementary to X-ray ones (Barchiesi et al. Reference Barchiesi2021), as they allow observations of the most dust-obscured AGN that are difficult to detect in the X-rays. As mentioned in Section 2.1, the observed faint end of the X-ray LF is overestimated by the predictions obtained with Spritz. Therefore, the fractions of IR-detected AGN above certain X-ray fluxes have to be considered as upper limits, at least for the deepest X-ray threshold considered.
Same as Figure 6, but for AGN with X-ray flux at 2–10 keV above $3.3\times10^{-15}$
(pink lines),
$3.3\times10^{-15}$
(pink lines), $2.5\times10^{-15}$
(blue lines) and 2
$2.5\times10^{-15}$
(blue lines) and 2 $\times10^{-16}\,{\rm erg\,s}^{-1}\,{\rm cm}^{-2}$
(orange lines).
$\times10^{-16}\,{\rm erg\,s}^{-1}\,{\rm cm}^{-2}$
(orange lines).
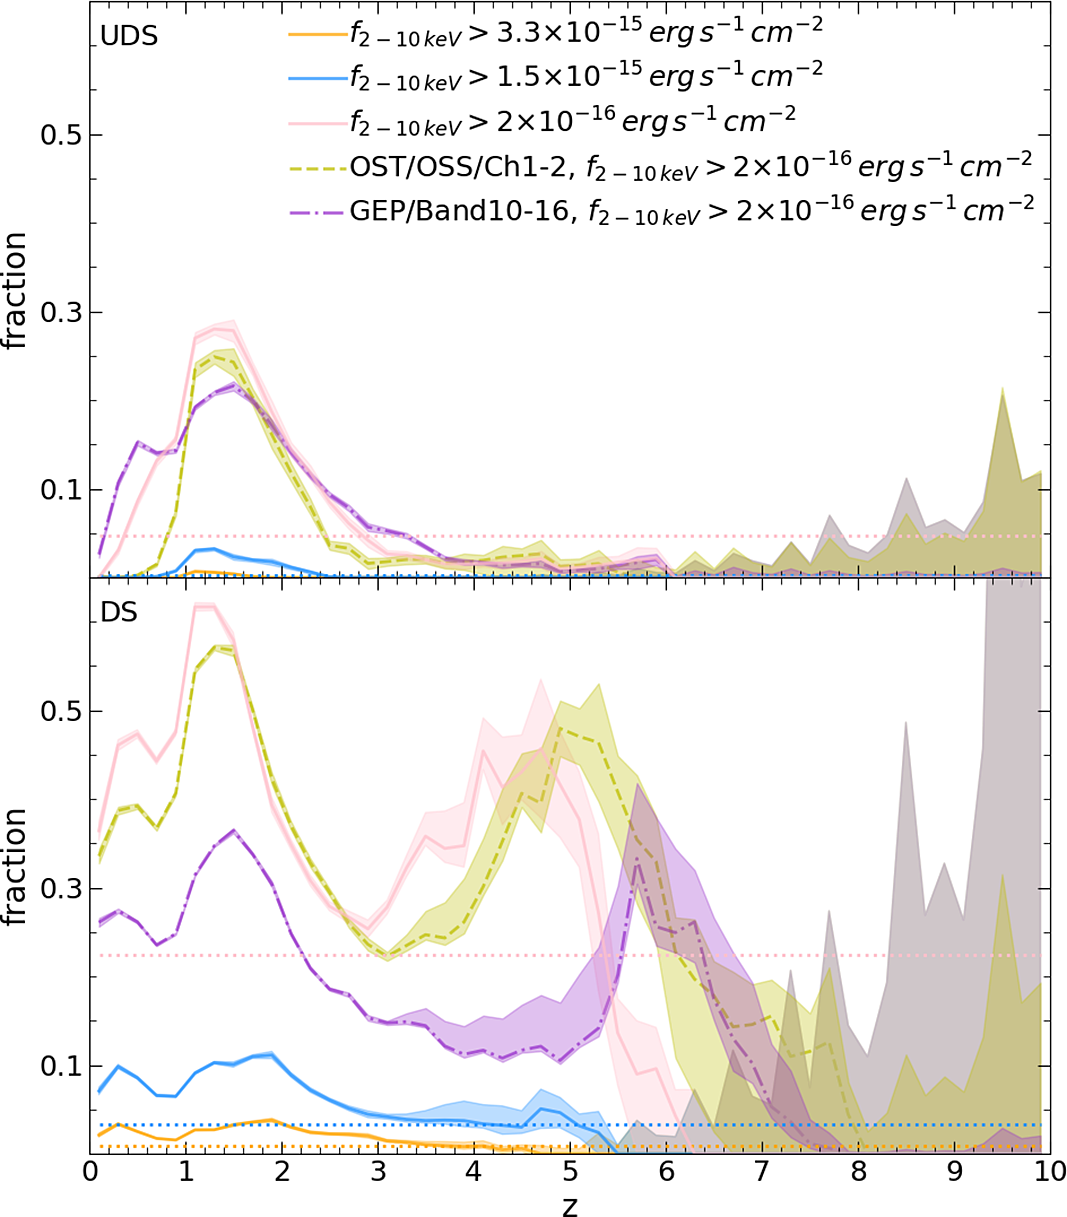
We compared the expected soft (hard) X-ray fluxes of IR detected AGN with the depth of current and future X-ray surveys: $7\times10^{-16}\,{\rm erg\,s}^{-1}\,{\rm cm}^{-2}$ $(3.3\times10^{-15}\,{\rm erg\,s}^{-1}\,{\rm cm}^{-2}$
) like the XMM-Newton Deep survey in COSMOS (Hasinger et al. Reference Hasinger2007),
$(3.3\times10^{-15}\,{\rm erg\,s}^{-1}\,{\rm cm}^{-2}$
) like the XMM-Newton Deep survey in COSMOS (Hasinger et al. Reference Hasinger2007), $2\times10^{-16}\,{\rm erg\,s}^{-1}\,{\rm cm}^{-2}$ $(1.5\times10^{-15}\,{\rm erg\,s}^{-1}\,{\rm cm}^{-2}$
) like the Chandra Deep survey in COSMOS-Legacy (Civano et al. Reference Civano2016) and
$(1.5\times10^{-15}\,{\rm erg\,s}^{-1}\,{\rm cm}^{-2}$
) like the Chandra Deep survey in COSMOS-Legacy (Civano et al. Reference Civano2016) and $4\times10^{-17}\,{\rm erg\,s}^{-1}\,{\rm cm}^{-2}$
(2.0
$4\times10^{-17}\,{\rm erg\,s}^{-1}\,{\rm cm}^{-2}$
(2.0 $\times10^{-16}\,{\rm erg\,s}^{-1}\,{\rm cm}^{-2}$
) like the planned Athena (Nandra et al. Reference Nandra2013) Deep survey.
$\times10^{-16}\,{\rm erg\,s}^{-1}\,{\rm cm}^{-2}$
) like the planned Athena (Nandra et al. Reference Nandra2013) Deep survey.
In the SPICA UDS, we expect, on average, that 26%, 5% and 1% of the detected AGN would have soft X-ray fluxes above $4\times10^{-17}$
, 2
$4\times10^{-17}$
, 2 $\times10^{-16}$
and
$\times10^{-16}$
and $7\times10^{-16}\,{\rm erg\,s}^{-1}\,{\rm cm}^{-2}$
, respectively. This fraction generally would have a peak around
$7\times10^{-16}\,{\rm erg\,s}^{-1}\,{\rm cm}^{-2}$
, respectively. This fraction generally would have a peak around $\textit{z}\sim 1.3$
and then it would decrease with increasing redshift, going from
$\textit{z}\sim 1.3$
and then it would decrease with increasing redshift, going from ${\sim}65\%$
to less than 30% of galaxies having
${\sim}65\%$
to less than 30% of galaxies having $\mathrm{f}_{0.5-2\,{\rm keV}}>4 \times10^{-17}\,{\rm erg\,s}^{-1}\,{\rm cm}^{-2}$
at
$\mathrm{f}_{0.5-2\,{\rm keV}}>4 \times10^{-17}\,{\rm erg\,s}^{-1}\,{\rm cm}^{-2}$
at $\textit{z}>2.5$
.
$\textit{z}>2.5$
.
In the DS, the fractions of detected AGN with soft X-ray fluxes above the considered limits would be larger than in the UDS, that is 37%, 22% and 9%, on average, of detected AGN with soft X-ray fluxes above $4\times10^{-17}$
,
$4\times10^{-17}$
, $2\times10^{-16}$
and
$2\times10^{-16}$
and $7 \times10^{-16}\,{\rm erg\,s}^{-1}$ ${\rm cm}^{-2}$
, respectively. The fraction of galaxies above each X-ray flux cut would be large (
${\rm cm}^{-2}$
, respectively. The fraction of galaxies above each X-ray flux cut would be large ( ${\sim}15$
, 25 and 70%) even at low redshift, reflecting the reduced number of faint AGN in the DS survey. At
${\sim}15$
, 25 and 70%) even at low redshift, reflecting the reduced number of faint AGN in the DS survey. At $\textit{z}>4$
–5, the fraction decreases with increasing redshift reaching fractions below 30%, considering the lowest flux cut
$\textit{z}>4$
–5, the fraction decreases with increasing redshift reaching fractions below 30%, considering the lowest flux cut $\mathrm{f}_{0.5-2\,{\rm keV}}>4 \times10^{-17}\,{\rm erg\,s}^{-1}\,{\rm cm}^{-2}$
.
$\mathrm{f}_{0.5-2\,{\rm keV}}>4 \times10^{-17}\,{\rm erg\,s}^{-1}\,{\rm cm}^{-2}$
.
The fraction of IR AGN detected in the X-rays would be larger in the DS than in the UDS because the DS covers a larger area than the UDS and, therefore, it would contain on average brighter AGN than the UDS. This is visible in Figure 8, where we show the overall distribution of the bolometric AGN luminosity obtained in the two surveys.
Distribution of the bolometric luminosity of the AGN detected in the SPICA UDS (blue solid line) and DS (red solid line). The dashed histograms indicate the distribution of the AGN at ${z}>3$
. Shaded areas show the uncertainties due to the
${z}>3$
. Shaded areas show the uncertainties due to the ${z}>3$
extrapolation. Vertical dotted lines are the median bolometric luminosities of the two surveys across the entire redshift range. The dashed-dotted lines indicate the intrinsic distribution of the bolometric luminosity, before applying any flux selection but normalised to the observed area.
${z}>3$
extrapolation. Vertical dotted lines are the median bolometric luminosities of the two surveys across the entire redshift range. The dashed-dotted lines indicate the intrinsic distribution of the bolometric luminosity, before applying any flux selection but normalised to the observed area.
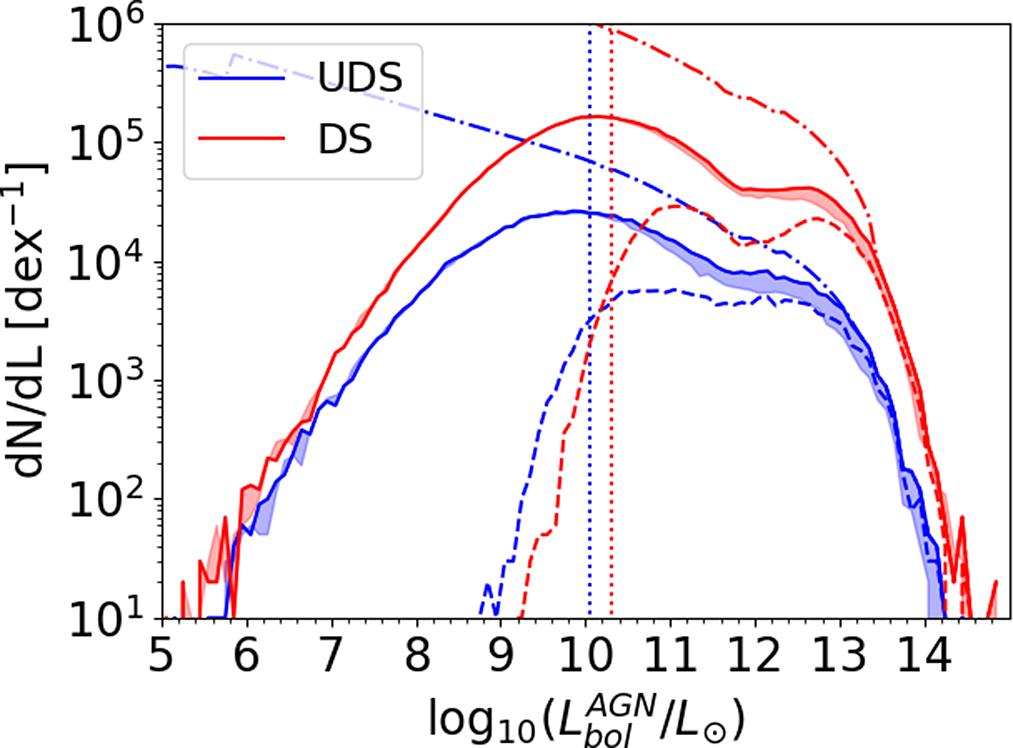
A second peak is present in the redshift evolution of some fractions mentioned above, particularly in the DS. This second peak is due to the $9.7\, {\rm{\mu }}\mathrm{m}$
absorption feature that biases IR photometric observations to detect the brightest objects. It is however necessary to consider that the predicted depth of this feature is subject of various uncertainties. First, different torus models predict different
$9.7\, {\rm{\mu }}\mathrm{m}$
absorption feature that biases IR photometric observations to detect the brightest objects. It is however necessary to consider that the predicted depth of this feature is subject of various uncertainties. First, different torus models predict different $9.7\, {\rm{\mu }}\mathrm{m}$
absorption strength, due to differences in the dust distribution and the silicates composition (e.g. Feltre et al. Reference Feltre, Hatziminaoglou, Fritz and Franceschini2012; Hatziminaoglou et al. Reference Hatziminaoglou, Hernán-Caballero, Feltre and Piñol Ferrer2015). Second, while some low-metallicity galaxies with a clear
$9.7\, {\rm{\mu }}\mathrm{m}$
absorption strength, due to differences in the dust distribution and the silicates composition (e.g. Feltre et al. Reference Feltre, Hatziminaoglou, Fritz and Franceschini2012; Hatziminaoglou et al. Reference Hatziminaoglou, Hernán-Caballero, Feltre and Piñol Ferrer2015). Second, while some low-metallicity galaxies with a clear $9.7\, {\rm{\mu }}\mathrm{m}$
absorption feature have been observed (e.g. Thuan, Sauvage, & Madden Reference Thuan, Sauvage and Madden1999; Houck et al. Reference Houck2004), some other studies (e.g. Kulkarni et al. Reference Kulkarni, Torres-Garcia, Som, York, Welty and Vladilo2011) have pointed out a possible reduction of the
$9.7\, {\rm{\mu }}\mathrm{m}$
absorption feature have been observed (e.g. Thuan, Sauvage, & Madden Reference Thuan, Sauvage and Madden1999; Houck et al. Reference Houck2004), some other studies (e.g. Kulkarni et al. Reference Kulkarni, Torres-Garcia, Som, York, Welty and Vladilo2011) have pointed out a possible reduction of the $9.7\, {\rm{\mu }}\mathrm{m}$
absorption strength with decreasing metallicity. If this is the case, we would expect high-z galaxies to have a less pronounced
$9.7\, {\rm{\mu }}\mathrm{m}$
absorption strength with decreasing metallicity. If this is the case, we would expect high-z galaxies to have a less pronounced $9.7\, {\rm{\mu }}\mathrm{m}$
absorption feature compared to low-z galaxies, used as template in our simulation. Therefore, SPICA observations around
$9.7\, {\rm{\mu }}\mathrm{m}$
absorption feature compared to low-z galaxies, used as template in our simulation. Therefore, SPICA observations around ${z}=4$
would not be biased towards bright IR galaxies, thus reducing the fraction of IR AGN above each X-ray threshold, that is smoothing out the secondary peaks visible in Figure 6.
${z}=4$
would not be biased towards bright IR galaxies, thus reducing the fraction of IR AGN above each X-ray threshold, that is smoothing out the secondary peaks visible in Figure 6.
The fractions of IR-detected AGN above the considered hard X-ray fluxes would have a redshift evolution similar to the fractions of AGN detected in soft X-ray of the same X-ray surveys, although these fractions would be generally lower. These low fractions are due to the hard X-ray depths, which are shallower than the soft X-ray flux depths. In addition, as redshift increases, observed fluxes corresponds to higher rest-frame energies, where the emission falls like a power law with an exponential cutoff. This effect is larger at 2–10 keV than for 0.5–2 keV.
We would expect on average less and 1% of AGN having hard X-ray fluxes above $\mathrm{f}_{2-10\,{\rm keV}}>1$
and
$\mathrm{f}_{2-10\,{\rm keV}}>1$
and $3\times10^{-15}\,{\rm erg\,s}^{-1}\,{\rm cm}^{-2}$
and only 5% above the hard X-ray flux of
$3\times10^{-15}\,{\rm erg\,s}^{-1}\,{\rm cm}^{-2}$
and only 5% above the hard X-ray flux of $2\times10^{-16}\,{\rm erg\,s}^{-1}\,{\rm cm}^{-2}$
, with a maximum of 30% around
$2\times10^{-16}\,{\rm erg\,s}^{-1}\,{\rm cm}^{-2}$
, with a maximum of 30% around ${z}\sim 1.3$
. In the DS, the average fraction would increase to 1, 3 and 22% above
${z}\sim 1.3$
. In the DS, the average fraction would increase to 1, 3 and 22% above $3.3\times10^{-15}$
,
$3.3\times10^{-15}$
, $1.5\times10^{-15}$
and
$1.5\times10^{-15}$
and $2\times10^{-16}\,{\rm erg\,s}^{-1}\,{\rm cm}^{-2}$
. The fraction of IR-detected AGN above the deepest hard X-ray flux cut, that is
$2\times10^{-16}\,{\rm erg\,s}^{-1}\,{\rm cm}^{-2}$
. The fraction of IR-detected AGN above the deepest hard X-ray flux cut, that is $2\times10^{-16}\,{\rm erg\,s}^{-1}\,{\rm cm}^{-2}$
, would show a double peak around
$2\times10^{-16}\,{\rm erg\,s}^{-1}\,{\rm cm}^{-2}$
, would show a double peak around ${z}\sim 1.3$
and
${z}\sim 1.3$
and ${z} \sim 4.5$
with almost no AGN above the hard X-ray flux cut at
${z} \sim 4.5$
with almost no AGN above the hard X-ray flux cut at ${z} > 6$
, similarly to the soft X-ray AGN fraction in the DS. The detection in both soft and hard X-ray bands will allow for analysing in more detail the spectral type of the AGN, directly fitting the X-ray spectra or trough the analysis of the hardness ratio.
${z} > 6$
, similarly to the soft X-ray AGN fraction in the DS. The detection in both soft and hard X-ray bands will allow for analysing in more detail the spectral type of the AGN, directly fitting the X-ray spectra or trough the analysis of the hardness ratio.
In Figures 6 and 7, we also report the expected fraction of AGN with $\mathrm{f}_{0.5-2\,{\rm keV}}>4\times10^{-17}\,{\rm erg\,s}^{-1}\,{\rm cm}^{-2}$
and
$\mathrm{f}_{0.5-2\,{\rm keV}}>4\times10^{-17}\,{\rm erg\,s}^{-1}\,{\rm cm}^{-2}$
and $\mathrm{f}_{2-10\,{\rm keV}}>2\times10^{-16}\,{\rm erg\,s}^{-1}\,{\rm cm}^{-2}$
detected with OST/OSS, in Channel 1 or 2, and with GEP-I, in band 10 or 16. For OST, the average fraction is 25% (3%) in the OST-Deep survey of
$\mathrm{f}_{2-10\,{\rm keV}}>2\times10^{-16}\,{\rm erg\,s}^{-1}\,{\rm cm}^{-2}$
detected with OST/OSS, in Channel 1 or 2, and with GEP-I, in band 10 or 16. For OST, the average fraction is 25% (3%) in the OST-Deep survey of $0.5\, \mathrm{deg}^{2}$
and 45% (25%) in the OST-Wide Survey of
$0.5\, \mathrm{deg}^{2}$
and 45% (25%) in the OST-Wide Survey of $20\, \mathrm{deg}^{2}$
in the soft (hard) X-rays. The similar area and depth of the SPICA UDS and OST-Deep survey are reflected in similar fractions in both soft and hard X-rays. The average fractions for GEP-I are slightly smaller, 18% (5%) and 38% (15%) for the 3 and
$20\, \mathrm{deg}^{2}$
in the soft (hard) X-rays. The similar area and depth of the SPICA UDS and OST-Deep survey are reflected in similar fractions in both soft and hard X-rays. The average fractions for GEP-I are slightly smaller, 18% (5%) and 38% (15%) for the 3 and $30\, \mathrm{deg}^{2}$
survey in soft (hard) X-ray, respectively. Even in this case, the fraction of AGN detected in both IR and X-rays generally decreases with increasing redshift.
$30\, \mathrm{deg}^{2}$
survey in soft (hard) X-ray, respectively. Even in this case, the fraction of AGN detected in both IR and X-rays generally decreases with increasing redshift.
It is important to highlight that, as mentioned before, the fraction of IR-detected AGN with faint X-ray fluxes is not limited to low-power AGN, but contains also Compton-thick AGN (i.e. obscured AGN with hydrogen column density $\mathrm{log}_{10}(N_{H} / {\rm cm}^{-2}) \geq$
24) that are challenging to detect at X-rays, but they become bright at IR-wavelengths. For a more detailed analysis on the possible synergies between SPICA or OST and future X-ray telescopes, such as Athena, we refer to the dedicated work of Barchiesi et al. (Reference Barchiesi2021).
$\mathrm{log}_{10}(N_{H} / {\rm cm}^{-2}) \geq$
24) that are challenging to detect at X-rays, but they become bright at IR-wavelengths. For a more detailed analysis on the possible synergies between SPICA or OST and future X-ray telescopes, such as Athena, we refer to the dedicated work of Barchiesi et al. (Reference Barchiesi2021).
3.2. Detection of IR spectral features
SMI-LR spectroscopy could have been performed simultaneously to the photometric SMI observations for both surveys, as the exposure times were long enough to allow for a complete scan of the sky observed in one pointing. Even taking into account that the spectroscopic limits were significantly shallower than the photometric ones, a fraction of galaxies observed in the photometric UDS and DS would have had low-resolution SMI spectra as well. We predicted the capability of SMI-LR to detect some of the main IR spectral features produced by star formation or AGN activity, considering the expected observational depth of the parallel spectroscopic surveys (see Table 2).
The detection of multiple lines enables robust redshift estimates and then, depending on the line, the study of different physical properties of the galaxies, for example the nature of the ionising sources, gas densities, gas metal abundances. For a detailed analysis of the spectral capability of the other SPICA spectrometer, that is SAFARI, we refer to the work by Spinoglio et al. (Reference Spinoglio2021). The results presented in the next paragraphs are consistent with results from Spinoglio et al. (Reference Spinoglio2021) for the detection of PAH and fine-structure lines, taking into account that, in the aforementioned paper, there is no attempt at separating the AGN and star-forming galaxy populations and the resulting number counts are, consequently, always larger than the ones presented here.
As mentioned previously, the current plan for the GEP spectrometer is to perform only pointed observations, therefore we decided to not include any comparison with SPICA SMI-LR. The comparison between SPICA-LR and OST/OSS is instead possible by considering the six OST/OSS channels with their full resolution, that is $R=300$
, and not with a reduced resolution of
$R=300$
, and not with a reduced resolution of $R=4$
, as done for the comparison between the photometric surveys.
$R=4$
, as done for the comparison between the photometric surveys.
3.2.1. PAH features
We start our analysis from the PAH features, ranging from 3.3 to $17.0\, {\rm{\mu }}\mathrm{m}$
, derived in Spritz considering the relations by Gruppioni et al. (Reference Gruppioni2016), Bonato et al. (Reference Bonato2019) and Mordini et al. (Reference Mordini, Spinoglio and Fernández-Ontiveros2021). The latter includes different relations for low-metallicty galaxies (i.e.
$17.0\, {\rm{\mu }}\mathrm{m}$
, derived in Spritz considering the relations by Gruppioni et al. (Reference Gruppioni2016), Bonato et al. (Reference Bonato2019) and Mordini et al. (Reference Mordini, Spinoglio and Fernández-Ontiveros2021). The latter includes different relations for low-metallicty galaxies (i.e. $12+\mathrm{log(O/H)}<8.2$
), as some observations point out that these galaxies may have suppressed PAH features (Shipley et al. Reference Shipley, Papovich, Rieke, Brown and Moustakas2016). In Figure 9, we report the redshift range in which each PAH feature is inside the wavelength coverage of SPICA/SMI and OST/OSS, for a better comparison between the wavelength coverage of the two instruments.
$12+\mathrm{log(O/H)}<8.2$
), as some observations point out that these galaxies may have suppressed PAH features (Shipley et al. Reference Shipley, Papovich, Rieke, Brown and Moustakas2016). In Figure 9, we report the redshift range in which each PAH feature is inside the wavelength coverage of SPICA/SMI and OST/OSS, for a better comparison between the wavelength coverage of the two instruments.
Redshift range in which each PAH feature is inside the wavelength coverage of OST/OSS (top) and SPICA/SMI (bottom). Vertical black lines show the separation between the different OST/OSS channels. The wide wavelength coverage of OST allows for the simultaneous detection of multiple PAH lines.
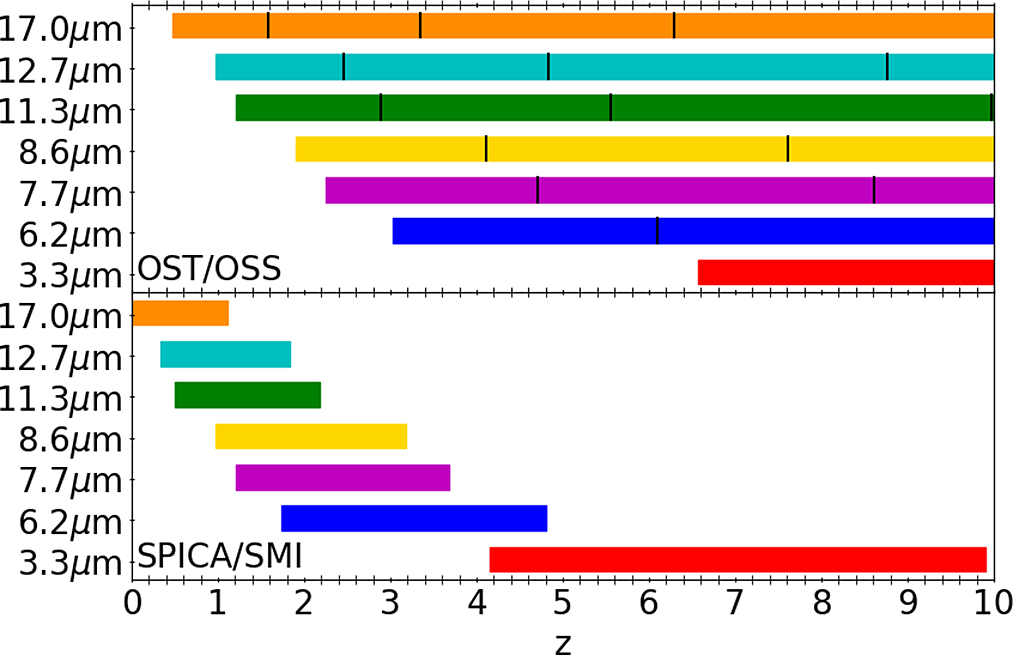
In Figure 10, we report, for both the SPICA UDS and DS, the expected redshift distribution per unit redshift interval of galaxies with detections in each PAH feature, where a detection means a $\mathrm{S/N}>3$
as derived by integrating the feature over its entire width. In the bottom panels of the same figure we report similar histograms, where we separate galaxies by the number of detected PAHs. This analysis allows us to verify for which and how many galaxies the redshift estimation would be solid, as multiple strong lines would be detectable inside the spectra.
$\mathrm{S/N}>3$
as derived by integrating the feature over its entire width. In the bottom panels of the same figure we report similar histograms, where we separate galaxies by the number of detected PAHs. This analysis allows us to verify for which and how many galaxies the redshift estimation would be solid, as multiple strong lines would be detectable inside the spectra.
In the SPICA UDS, we would expect more than ${\sim}17\%$
of galaxies at
${\sim}17\%$
of galaxies at ${z}=1$
–4.5 to have at least two detected PAH features, with a maximum of
${z}=1$
–4.5 to have at least two detected PAH features, with a maximum of ${\sim}60\%$
at
${\sim}60\%$
at $\textit{z}\sim2.5$
. These would be mainly star-forming galaxies without an AGN component (
$\textit{z}\sim2.5$
. These would be mainly star-forming galaxies without an AGN component ( ${\sim}40 \%$
) or composite systems (
${\sim}40 \%$
) or composite systems ( ${\sim}54\%$
). In particular, PAH detections would be extremely rare among dwarf irregular galaxies, that is less than 2% of all dwarf irregular galaxies detected in photometry at
${\sim}54\%$
). In particular, PAH detections would be extremely rare among dwarf irregular galaxies, that is less than 2% of all dwarf irregular galaxies detected in photometry at $\textit{z}= 1$
–4.5. The limited number of multiple PAH detections is largely limited by the wavelength coverage of the SPICA/SMI instrument, as seen in Figure 9.
$\textit{z}= 1$
–4.5. The limited number of multiple PAH detections is largely limited by the wavelength coverage of the SPICA/SMI instrument, as seen in Figure 9.
In the SPICA DS, the fraction varies from 7 to 40% in the same redshift range, with a maximum at $\textit{z}= 2.6$
. At
$\textit{z}= 2.6$
. At $\textit{z}>5$
, only the PAH at
$\textit{z}>5$
, only the PAH at $3.3\, {\rm{\mu }}\mathrm{m}$
would be covered by the SMI spectral range, thought it would be too faint to be detected for a large fraction (i.e.
$3.3\, {\rm{\mu }}\mathrm{m}$
would be covered by the SMI spectral range, thought it would be too faint to be detected for a large fraction (i.e. $>99\%$
) of the sample. Therefore, for these galaxies the redshift estimation would have to rely on other bright IR emission lines (see Sections 3.2.2–3.2.3) or on the additional information provided by the simultaneous photometric surveys.
$>99\%$
) of the sample. Therefore, for these galaxies the redshift estimation would have to rely on other bright IR emission lines (see Sections 3.2.2–3.2.3) or on the additional information provided by the simultaneous photometric surveys.
Top: Redshift distribution per unit redshift interval of galaxies in the SPICA UDS (left) and DS (right) with detected PAH lines (coloured lines), that is integrated $\mathrm{S/N}>3$
. We also report the complete sample of galaxies detected with SMI or B-BOP in photometry (black solid line). The shaded areas show the uncertainties due to the different empirical relation
$\mathrm{S/N}>3$
. We also report the complete sample of galaxies detected with SMI or B-BOP in photometry (black solid line). The shaded areas show the uncertainties due to the different empirical relation $L_{IR}{-}L_{line}$
, when present, and the extrapolation at
$L_{IR}{-}L_{line}$
, when present, and the extrapolation at $\textit{z}>3$
. Bottom: Redshift distribution per unit redshift interval of galaxies in the UDS (left) and DS (right). The sample is divided by the number of detected PAH features. The black solid line is the complete photometric sample. At
$\textit{z}>3$
. Bottom: Redshift distribution per unit redshift interval of galaxies in the UDS (left) and DS (right). The sample is divided by the number of detected PAH features. The black solid line is the complete photometric sample. At $\textit{z}<5$
, multiple PAH lines would be observed by SPICA in both surveys, for a sizeable amount of galaxies.
$\textit{z}<5$
, multiple PAH lines would be observed by SPICA in both surveys, for a sizeable amount of galaxies.
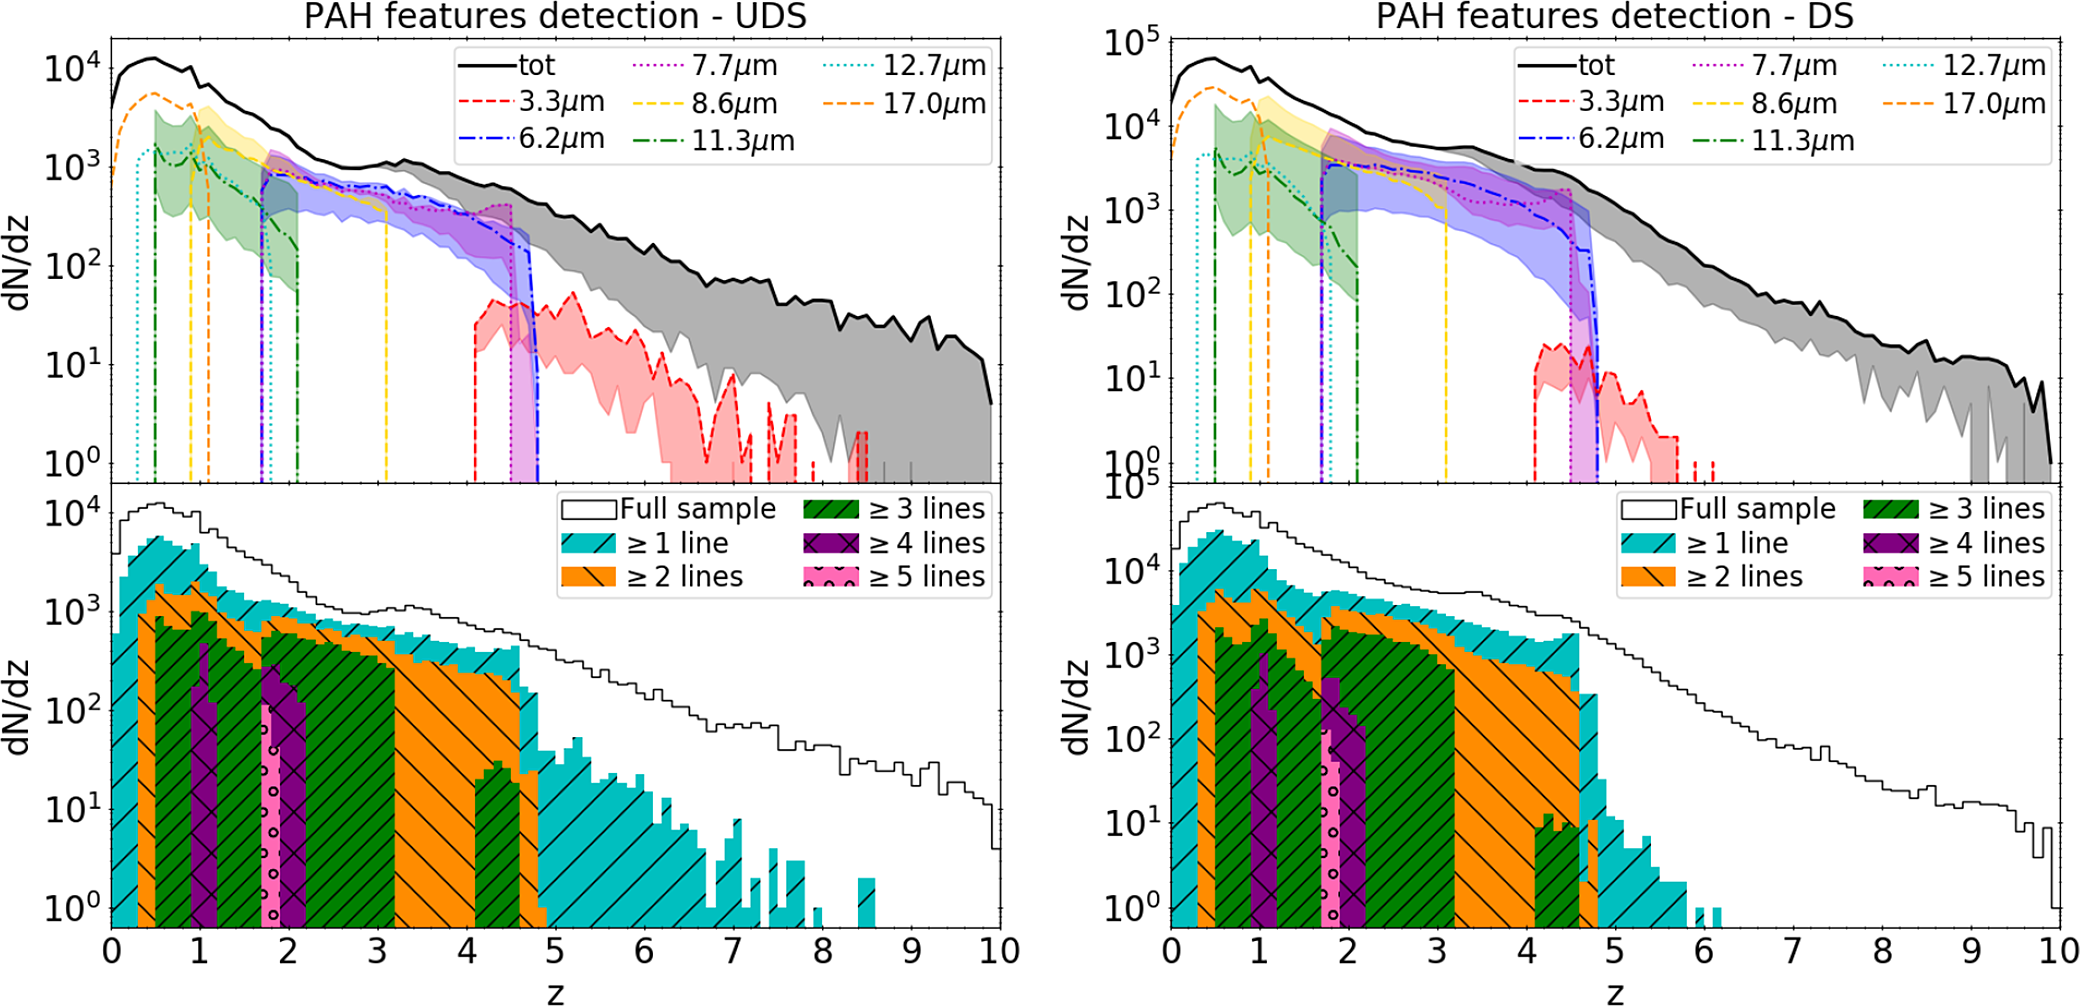
Same as Figure 10, but for OST. The complete sample (black solid line) consists of galaxies detected in at least one OST/OSS channel considering $R=4$
. PAH detections are instead derived considering
$R=4$
. PAH detections are instead derived considering $R=300$
. At
$R=300$
. At $\textit{z}>1$
, multiple PAH lines are expected to be observed by OST in both surveys, for a sizeable amount of galaxies.
$\textit{z}>1$
, multiple PAH lines are expected to be observed by OST in both surveys, for a sizeable amount of galaxies.
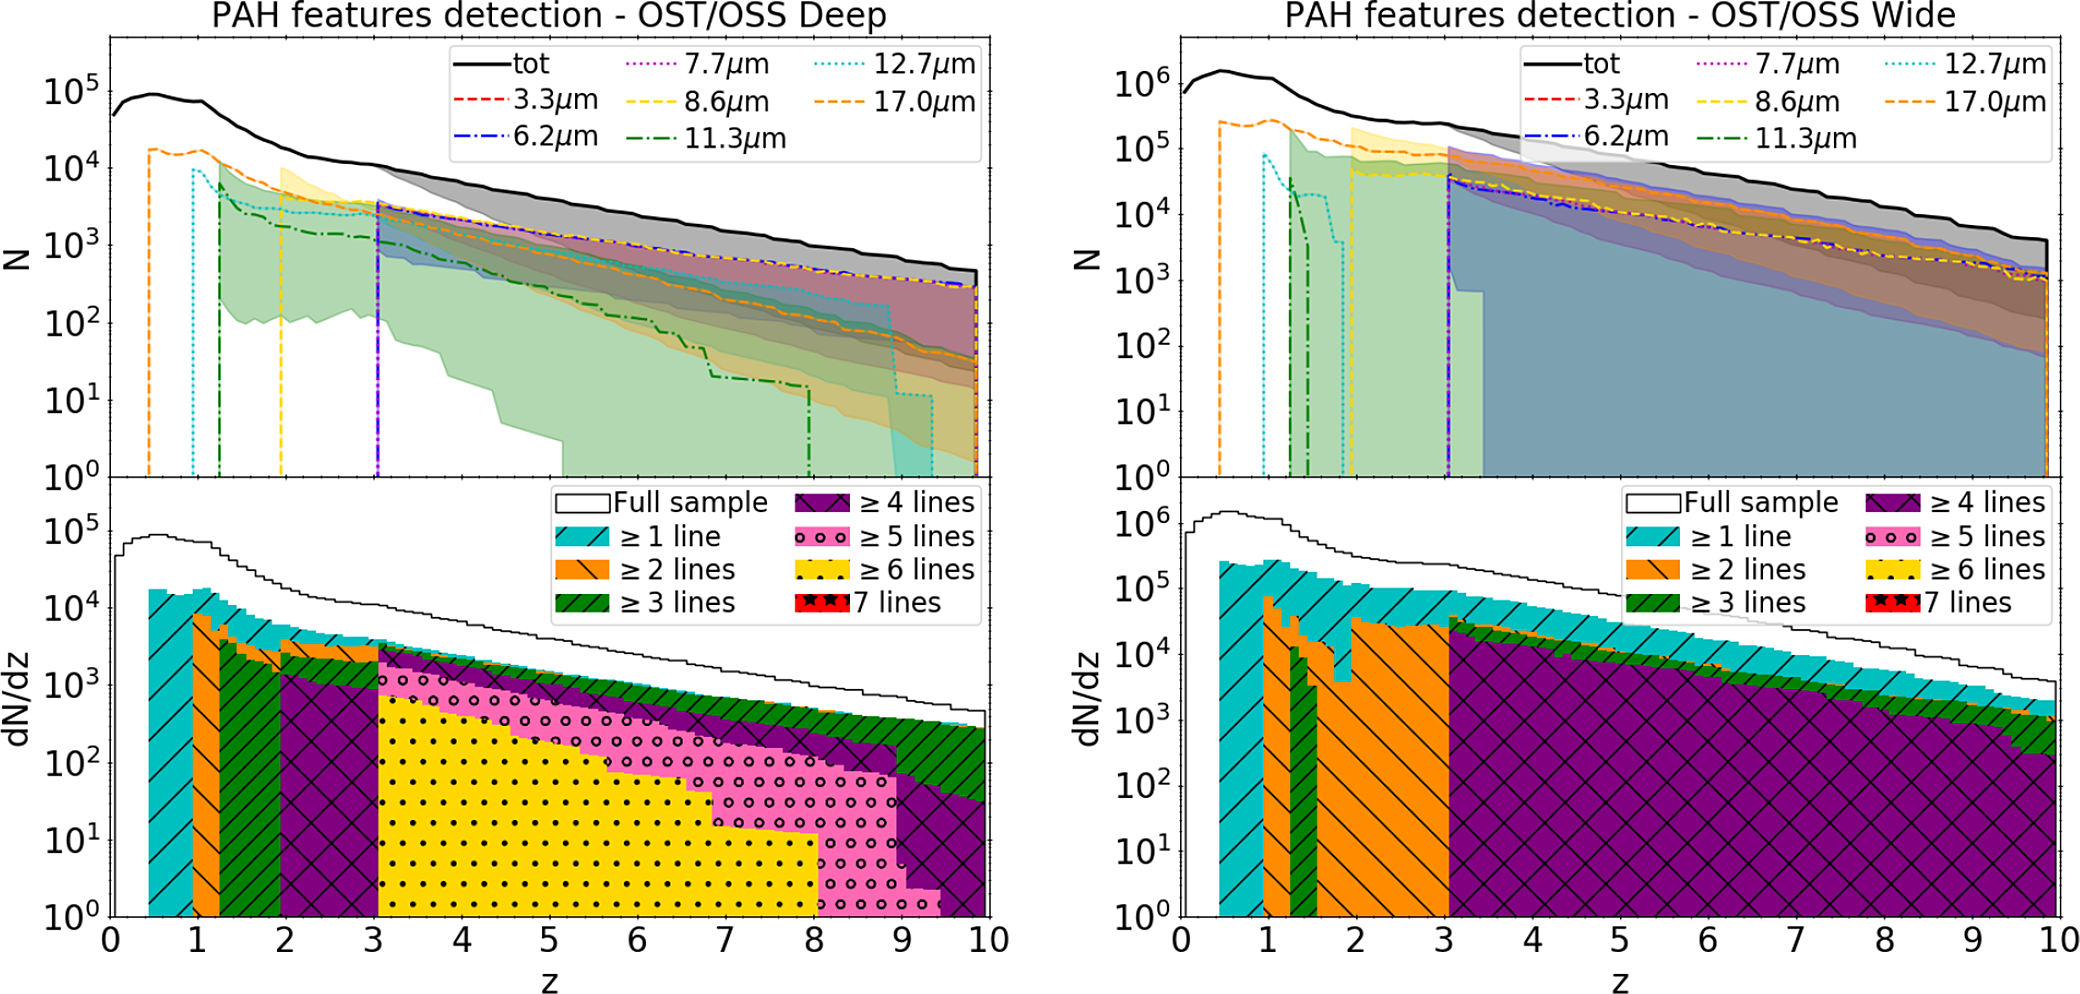
PAH features are not only important for deriving precise redshifts, but also for identifying potential AGN activity. It has indeed been shown that the equivalent widths of the 6.2 and $11.3\, {\rm{\mu }}\mathrm{m}$
PAH features anti-correlate with the dominance of AGN activity (Spoon et al. Reference Spoon, Marshall, Houck, Elitzur, Hao, Armus, Brandl and Charmandaris2007; Tommasin et al. Reference Tommasin, Spinoglio, Malkan, Smith, González-Alfonso and Charmandaris2008; Hernán-Caballero & Hatziminaoglou Reference Hernán-Caballero and Hatziminaoglou2011; Feltre et al. Reference Feltre2013). This technique to identify potential AGN would be feasible between redshift 0.5 and 5 for
$11.3\, {\rm{\mu }}\mathrm{m}$
PAH features anti-correlate with the dominance of AGN activity (Spoon et al. Reference Spoon, Marshall, Houck, Elitzur, Hao, Armus, Brandl and Charmandaris2007; Tommasin et al. Reference Tommasin, Spinoglio, Malkan, Smith, González-Alfonso and Charmandaris2008; Hernán-Caballero & Hatziminaoglou Reference Hernán-Caballero and Hatziminaoglou2011; Feltre et al. Reference Feltre2013). This technique to identify potential AGN would be feasible between redshift 0.5 and 5 for $10^{2}$
–
$10^{2}$
– $10^{3}$
galaxies per redshift bin (dN/dz) in the UDS and DS.
$10^{3}$
galaxies per redshift bin (dN/dz) in the UDS and DS.
The OST spectroscopic wavelength coverage is larger than the SPICA/SMI one, allowing the simultaneous detection of a significant number of PAH features and over a larger redshift range. This is visible in Figure 11, where we show the redshift distribution per unit redshift interval of galaxies with different PAH features detected in at least one of the six OST/OSS channels.
In the OST-Deep survey, it will be possible to detect six PAH lines, using the spectroscopic capability of all OST/OSS channels, at ${z}=3$
–8 for 4% of galaxies on average. The
${z}=3$
–8 for 4% of galaxies on average. The $3.3\, {\rm{\mu }}\mathrm{m}$
PAH feature is expected to be too faint to be detected with OST/OSS, but the application of some wavelength binning can boost the signal, reducing the wavelength resolution, but allowing for the detection of this feature similarly to what is predicted for SPICA/SMI.
$3.3\, {\rm{\mu }}\mathrm{m}$
PAH feature is expected to be too faint to be detected with OST/OSS, but the application of some wavelength binning can boost the signal, reducing the wavelength resolution, but allowing for the detection of this feature similarly to what is predicted for SPICA/SMI.
On average, around 37% of the galaxies above ${z}=1$
are expected to have at least two PAH features detected. This fraction changes to 11% in the OST-Wide survey, where we expect to be able to detect at maximum four PAH features at the same time. This happens, on average, for
${z}=1$
are expected to have at least two PAH features detected. This fraction changes to 11% in the OST-Wide survey, where we expect to be able to detect at maximum four PAH features at the same time. This happens, on average, for ${\sim}7\%$
of the galaxies at
${\sim}7\%$
of the galaxies at $\textit{z}>3$
. The difference is mainly due to the difficulties, given the planned OST-Wide survey observational depths, on detecting the 12.7 and
$\textit{z}>3$
. The difference is mainly due to the difficulties, given the planned OST-Wide survey observational depths, on detecting the 12.7 and $11.3\, {\rm{\mu }}\mathrm{m}$
features.
$11.3\, {\rm{\mu }}\mathrm{m}$
features.
The fraction of galaxies with a detected $11.3\, {\rm{\mu }}\mathrm{m}$
PAH feature is highly uncertain in the OST-Wide survey, depending on the relation considered to derive the flux of this feature, and its detection may be possible at
$11.3\, {\rm{\mu }}\mathrm{m}$
PAH feature is highly uncertain in the OST-Wide survey, depending on the relation considered to derive the flux of this feature, and its detection may be possible at $\textit{z}>1.5$
. Even the detection of the
$\textit{z}>1.5$
. Even the detection of the $6.2\, {\rm{\mu }}\mathrm{m}$
feature is very uncertain because, when considering the uncertainties in our prediction, it may not be possible to detect this feature at all above
$6.2\, {\rm{\mu }}\mathrm{m}$
feature is very uncertain because, when considering the uncertainties in our prediction, it may not be possible to detect this feature at all above $\textit{z}>3.5$
. As mentioned for the
$\textit{z}>3.5$
. As mentioned for the $3.3\, {\rm{\mu }}\mathrm{m}$
feature, wavelength binning could help on boosting the signal and increase the detection rates for this PAH feature.
$3.3\, {\rm{\mu }}\mathrm{m}$
feature, wavelength binning could help on boosting the signal and increase the detection rates for this PAH feature.
Redshift distribution per unit redshift interval of galaxies with detected ( $\mathrm{S/N}>3$
) hydrogen lines in the SPICA UDS (top) and DS (bottom). The list of considered lines is reported in the legend. The shaded areas show the uncertainties due to the extrapolation at
$\mathrm{S/N}>3$
) hydrogen lines in the SPICA UDS (top) and DS (bottom). The list of considered lines is reported in the legend. The shaded areas show the uncertainties due to the extrapolation at $\textit{z}>3$
.
$\textit{z}>3$
.
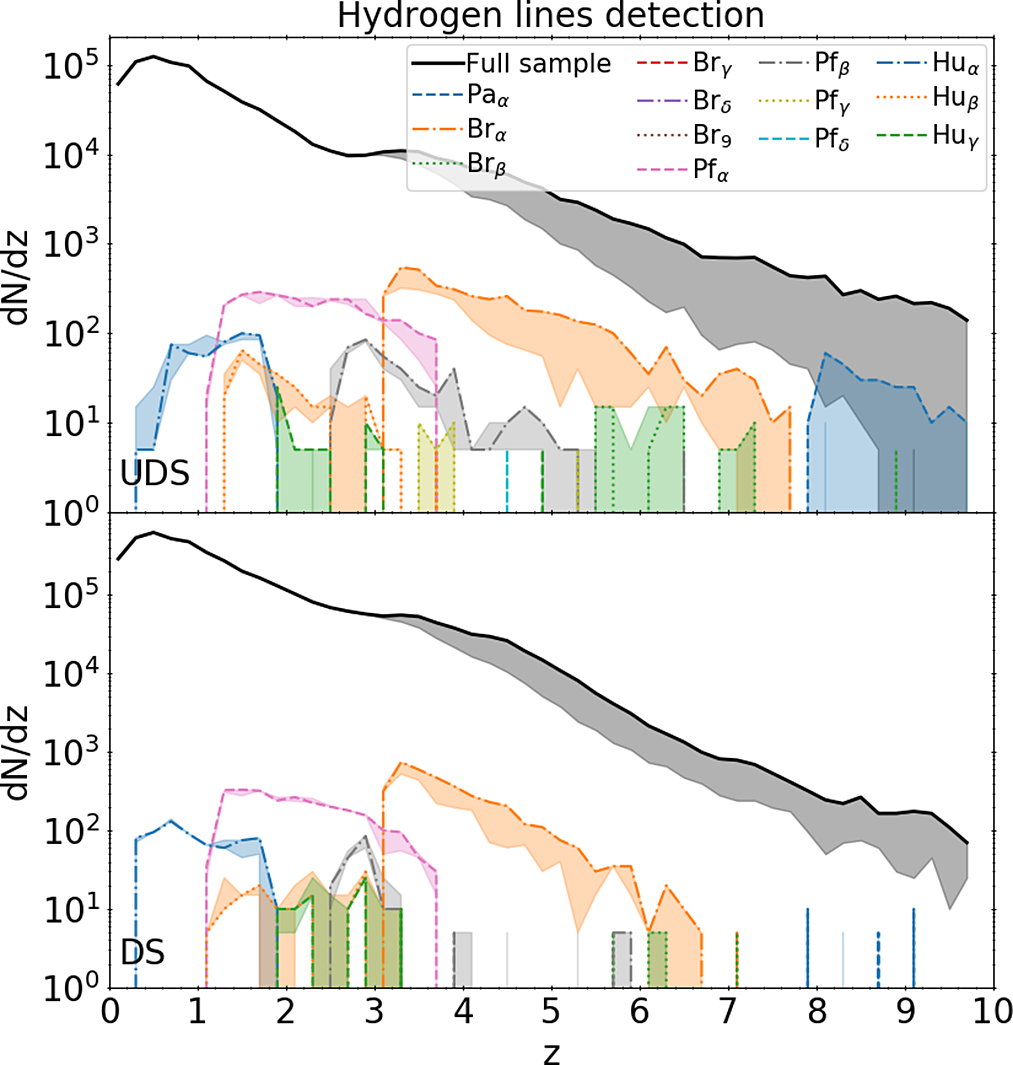
3.2.2. IR hydrogen recombination lines
We now focus on the detection of the main hydrogen nebular emission lines in the IR. In Figures 12 and 13, we plot the redshift distribution per unit redshift interval of galaxies with expected detection ( $\mathrm{S/N}>3$
) of different hydrogen recombination lines from the Paschen, Brackett, Pfund and Humphreys series. We do not consider hydrogen lines that are outside the SMI or OST wavelength coverage in the considered redshift range. Hydrogen lines include the contribution from both star formation and AGN activity. As the broad-line contribution has not been included in Spritz, the AGN nebular emission, which accounts only for the emission from the gas in the narrow-line regions, has to be considered as a lower limit to the total (broad+narrow) nebular emission.
$\mathrm{S/N}>3$
) of different hydrogen recombination lines from the Paschen, Brackett, Pfund and Humphreys series. We do not consider hydrogen lines that are outside the SMI or OST wavelength coverage in the considered redshift range. Hydrogen lines include the contribution from both star formation and AGN activity. As the broad-line contribution has not been included in Spritz, the AGN nebular emission, which accounts only for the emission from the gas in the narrow-line regions, has to be considered as a lower limit to the total (broad+narrow) nebular emission.
Same as Figure 12, but for galaxies detected in at least one OST/OSS channel in the OST-Deep (top) and OST-Wide survey (bottom). Only few galaxies are expected to have a detection in an Hydrogen line.
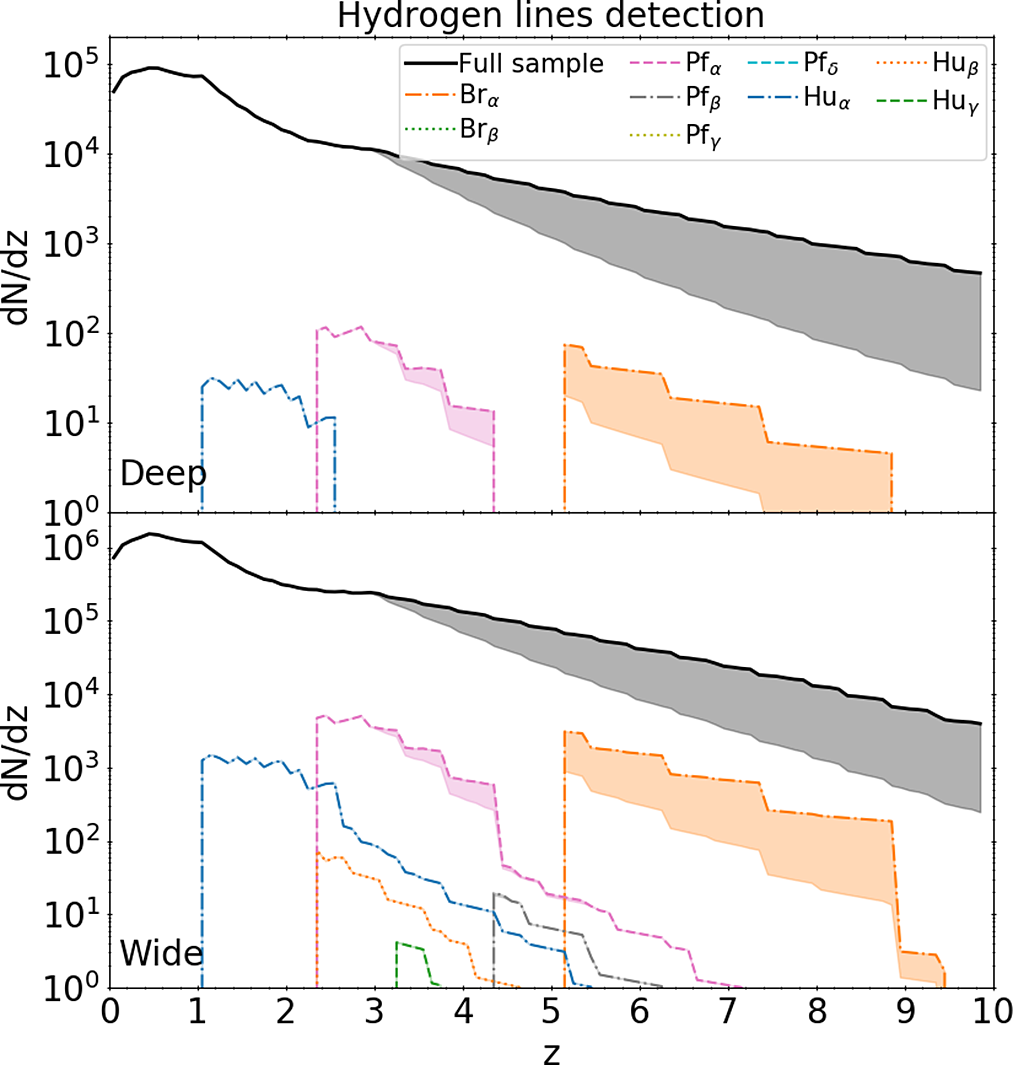
All the aforementioned hydrogen lines would be too faint to be detected with SPICA/SMI for the large majority of galaxies. In the UDS, only a few percent of galaxies would have detectable $\mathrm{Pa}_{\alpha}$
,
$\mathrm{Pa}_{\alpha}$
, $\mathrm{Br}_{\alpha}$
,
$\mathrm{Br}_{\alpha}$
, $\mathrm{Br}_{\beta}$
or
$\mathrm{Br}_{\beta}$
or $\mathrm{Pf}_{\alpha}$
, while all the other lines would be detected for less than
$\mathrm{Pf}_{\alpha}$
, while all the other lines would be detected for less than $1 \%$
of the total amount of observed galaxies at any redshift. In the DS, only
$1 \%$
of the total amount of observed galaxies at any redshift. In the DS, only $\mathrm{Pa}_{\alpha}$
would be detected for 4% of the galaxies, while the other hydrogen lines would be detected in less than 1% of the observed galaxies at any redshifts.
$\mathrm{Pa}_{\alpha}$
would be detected for 4% of the galaxies, while the other hydrogen lines would be detected in less than 1% of the observed galaxies at any redshifts.
In the range between ${z}=4.9$
and
${z}=4.9$
and ${z}=8.0$
, where only the
${z}=8.0$
, where only the $3.3\, {\rm{\mu }}\mathrm{m}$
PAH feature would be detectable (see Section 3.2.1), the few detections of the
$3.3\, {\rm{\mu }}\mathrm{m}$
PAH feature would be detectable (see Section 3.2.1), the few detections of the $\mathrm{Br}_{\alpha}$
and
$\mathrm{Br}_{\alpha}$
and $\mathrm{Br}_{\beta}$
lines could be used for the redshift estimation, for which only the
$\mathrm{Br}_{\beta}$
lines could be used for the redshift estimation, for which only the $3.3\, {\rm{\mu }}\mathrm{m}$
PAH feature is otherwise observable. At even higher redshifts (
$3.3\, {\rm{\mu }}\mathrm{m}$
PAH feature is otherwise observable. At even higher redshifts ( $\textit{z}>8$
), in the UDS only a few tens of galaxies would have a detection of the
$\textit{z}>8$
), in the UDS only a few tens of galaxies would have a detection of the $\mathrm{Pa}_{\alpha}$
, making the redshift estimation difficult for the rest of the sample. This task would be even more difficult in the DS, where the
$\mathrm{Pa}_{\alpha}$
, making the redshift estimation difficult for the rest of the sample. This task would be even more difficult in the DS, where the $\mathrm{Pa}_{\alpha}$
line would never be detected.
$\mathrm{Pa}_{\alpha}$
line would never be detected.
The OST-Deep survey is expected to have a similar depth to the SPICA/SMI UDS survey, but it covers a quarter of the area with a larger wavelength range. The shortest available wavelength is however $25\, {\rm{\mu }}\mathrm{m}$
, compared to
$25\, {\rm{\mu }}\mathrm{m}$
, compared to $17\, {\rm{\mu }}\mathrm{m}$
of the SPICA/SMI, moving
$17\, {\rm{\mu }}\mathrm{m}$
of the SPICA/SMI, moving $\mathrm{Pa}_{\alpha}$
outside the wavelength coverage at all analysed redshifts. These differences result in the expected detection of few lines, mainly
$\mathrm{Pa}_{\alpha}$
outside the wavelength coverage at all analysed redshifts. These differences result in the expected detection of few lines, mainly $\mathrm{Br}_{\alpha}$
,
$\mathrm{Br}_{\alpha}$
, $\mathrm{Pf}_{\alpha}$
and
$\mathrm{Pf}_{\alpha}$
and $\mathrm{Hu}_{\alpha}$
, for at maximum 2% of the galaxies detected in photometry (i.e. OST/OSS with
$\mathrm{Hu}_{\alpha}$
, for at maximum 2% of the galaxies detected in photometry (i.e. OST/OSS with $R=4$
), but around 1% on average.
$R=4$
), but around 1% on average.
On the OST-Wide survey, the situation is slightly better, given that brighter objects are observed in the OST-Wide survey than in the OST-Deep one. The maximum is reached at $\textit{z}\sim 5$
, where 4% of all galaxies observed in photometry have detected
$\textit{z}\sim 5$
, where 4% of all galaxies observed in photometry have detected $\mathrm{Br}_{\alpha}$
. In addition, in the OST-Wide survey few galaxies have also detected
$\mathrm{Br}_{\alpha}$
. In addition, in the OST-Wide survey few galaxies have also detected $\mathrm{Hu}_{\beta}$
,
$\mathrm{Hu}_{\beta}$
, $\mathrm{Hu}_{\gamma}$
and
$\mathrm{Hu}_{\gamma}$
and $\mathrm{Pf}_{\beta}$
, which are expected never to be observed in the Deep survey.
$\mathrm{Pf}_{\beta}$
, which are expected never to be observed in the Deep survey.
Overall, both for both a SPICA-like mission and OST the detection of hydrogen lines is expected to be very challenging and limited to the brightest galaxies. This needs to be taken into account when planning to derive the gas metallicity using the hydrogen lines, although metallicity determinations based only on the IR fine-structure lines have proven to be robust (e.g. Figure 7 in Fernández-Ontiveros et al. Reference Fernández-Ontiveros, Pérez-Montero, Vlchez, Amorn and Spinoglio2021).
Redshift distribution per unit redshift interval of galaxies in the SPICA UDS with IR fine-structure lines with $\mathrm{S/N}>3$
. The list of lines is reported on the right of each panel. The first panel show AGN lines while the other two panels show lines originated both by star formation and AGN activity. The complete sample of galaxies detected with SMI or B-BOP in photometry is shown in black, in the top panel we limit the sample to AGN only. We consider as reference the line luminosity derived from the
$\mathrm{S/N}>3$
. The list of lines is reported on the right of each panel. The first panel show AGN lines while the other two panels show lines originated both by star formation and AGN activity. The complete sample of galaxies detected with SMI or B-BOP in photometry is shown in black, in the top panel we limit the sample to AGN only. We consider as reference the line luminosity derived from the $L_{IR}$
considering the relation by Bonato et al. (Reference Bonato2019). The shaded areas show the uncertainties due to different empirical relations
$L_{IR}$
considering the relation by Bonato et al. (Reference Bonato2019). The shaded areas show the uncertainties due to different empirical relations $L_{IR}{-}L_{line}$
(i.e. Gruppioni et al. Reference Gruppioni2016; Mordini et al. Reference Mordini, Spinoglio and Fernández-Ontiveros2021), when present, and the extrapolation at
$L_{IR}{-}L_{line}$
(i.e. Gruppioni et al. Reference Gruppioni2016; Mordini et al. Reference Mordini, Spinoglio and Fernández-Ontiveros2021), when present, and the extrapolation at ${z}>3$
.
${z}>3$
.
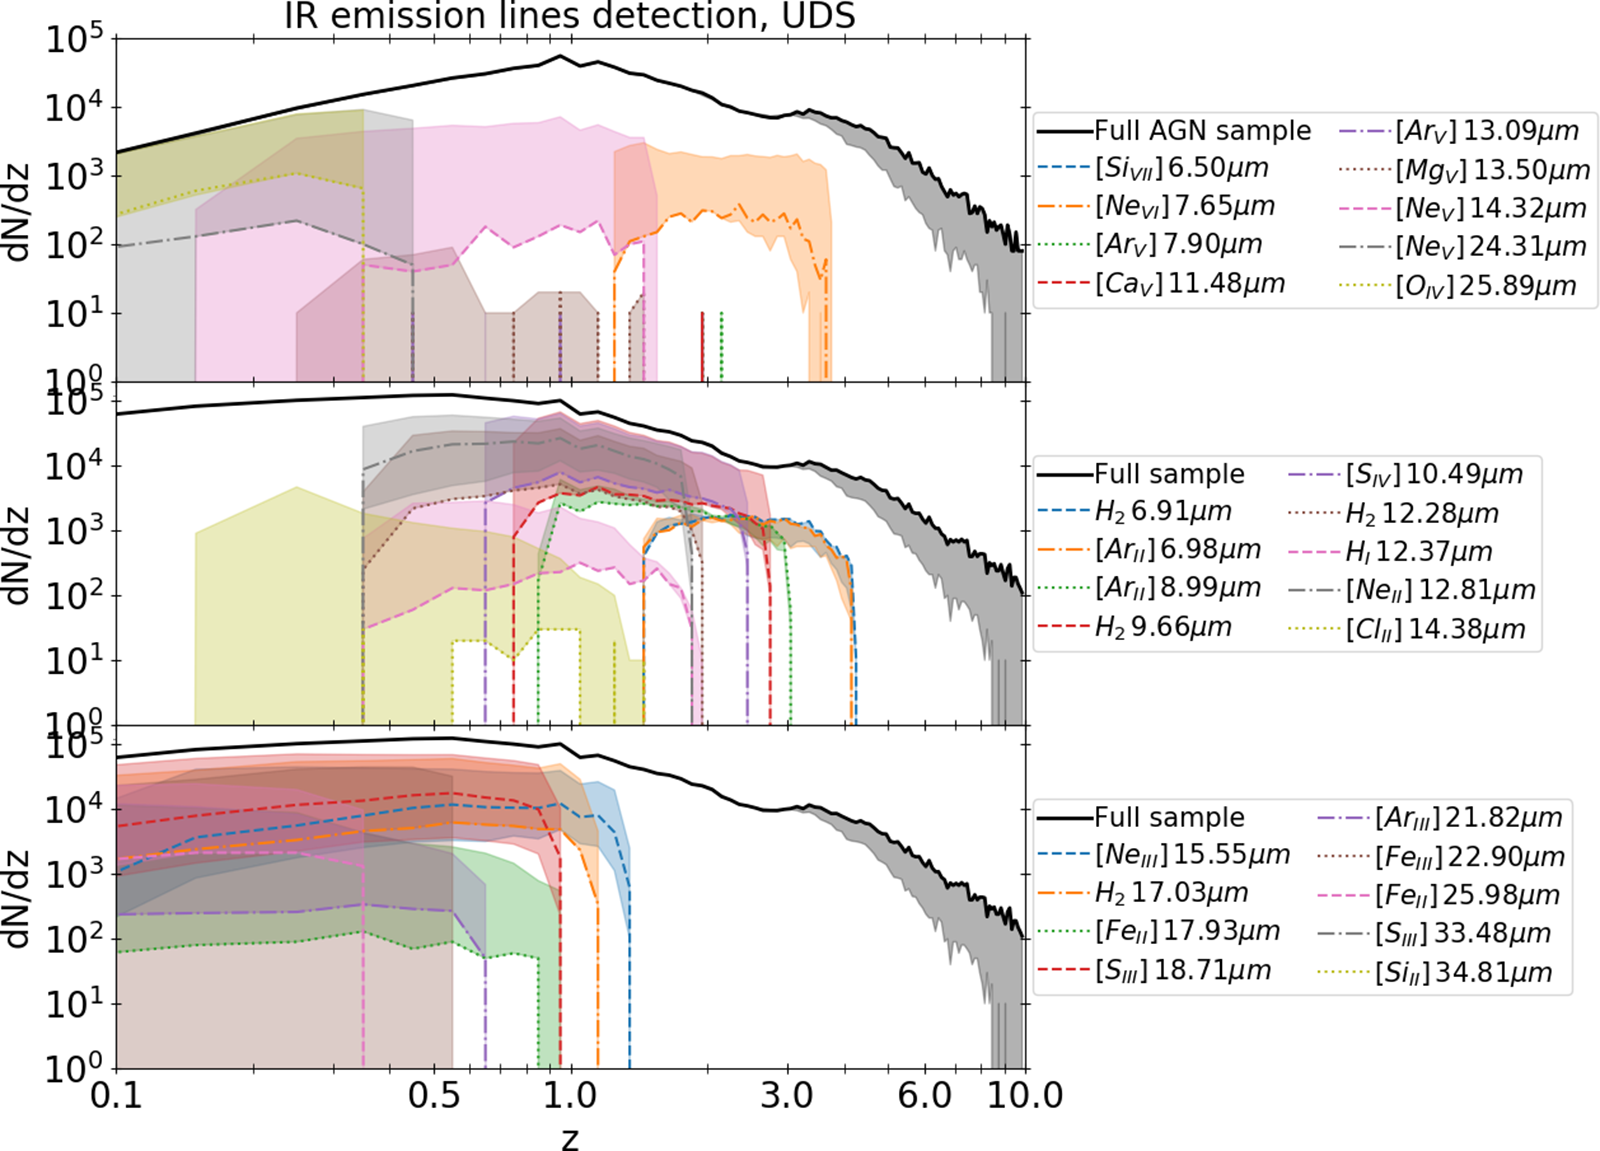
3.2.3. IR fine-structure lines
In this last section we report the predictions for the IR fine-structure lines as included in Spritz, due to star formation or AGN activity. These fine-structure lines can be used to analyse different physical properties. For example, the use of two lines of the same ionic species, like the two [S III] lines at 18 and $33\, {\rm{\mu }}\mathrm{m}$
, can be used to investigate the gas density. The use of two lines of the same element, but of two different ionisation levels, like [NeIII] at
$33\, {\rm{\mu }}\mathrm{m}$
, can be used to investigate the gas density. The use of two lines of the same element, but of two different ionisation levels, like [NeIII] at $15.55\, {\rm{\mu }}\mathrm{m}$
and [NeII] at
$15.55\, {\rm{\mu }}\mathrm{m}$
and [NeII] at $12.81\, {\rm{\mu }}\mathrm{m}$
(Thornley et al. Reference Thornley, FÖrster Schreiber, Lutz, Genzel, Spoon, Kunze and Sternberg2000), can instead be used to investigate the nature of the ionising source. In addition, the detection of specific fine-structure lines that need high ionising energies, like the [NeV] at 14.32 and
$12.81\, {\rm{\mu }}\mathrm{m}$
(Thornley et al. Reference Thornley, FÖrster Schreiber, Lutz, Genzel, Spoon, Kunze and Sternberg2000), can instead be used to investigate the nature of the ionising source. In addition, the detection of specific fine-structure lines that need high ionising energies, like the [NeV] at 14.32 and $24.31\, {\rm{\mu }}\mathrm{m}$
, is an indication of AGN activity (e.g. Spinoglio & Malkan Reference Spinoglio and Malkan1992; Genzel & Cesarsky Reference Genzel and Cesarsky2000; Meléndez et al. Reference Meléndez2008; Feltre, Charlot, & Gutkin Reference Feltre, Charlot and Gutkin2016). More details on the use of mid-IR lines to study the nature of ionising sources, the gas densities and the gas metal abundances can be found in Spinoglio et al. (Reference Spinoglio, Pereira-Santaella, Dasyra, Calzoletti, Malkan, Tommasin and Busquet2015) and Fernández-Ontiveros et al. (Reference Fernández-Ontiveros, Spinoglio, Pereira-Santaella, Malkan, Andreani and Dasyra2016); Fernández-Ontiveros et al. (Reference Fernández-Ontiveros2017).
$24.31\, {\rm{\mu }}\mathrm{m}$
, is an indication of AGN activity (e.g. Spinoglio & Malkan Reference Spinoglio and Malkan1992; Genzel & Cesarsky Reference Genzel and Cesarsky2000; Meléndez et al. Reference Meléndez2008; Feltre, Charlot, & Gutkin Reference Feltre, Charlot and Gutkin2016). More details on the use of mid-IR lines to study the nature of ionising sources, the gas densities and the gas metal abundances can be found in Spinoglio et al. (Reference Spinoglio, Pereira-Santaella, Dasyra, Calzoletti, Malkan, Tommasin and Busquet2015) and Fernández-Ontiveros et al. (Reference Fernández-Ontiveros, Spinoglio, Pereira-Santaella, Malkan, Andreani and Dasyra2016); Fernández-Ontiveros et al. (Reference Fernández-Ontiveros2017).
The redshift at which we would expect each fine-structure line to be observed is shown in Figures 14 and 15, for the SPICA UDS and DS, respectively. The detection of these lines with SMI-LR would be limited at $\textit{z}<4.5$
, because of the SMI wavelength coverage. At higher redshift, it would be necessary to search for emission lines in the rest-frame near-IR, precisely in the range
$\textit{z}<4.5$
, because of the SMI wavelength coverage. At higher redshift, it would be necessary to search for emission lines in the rest-frame near-IR, precisely in the range $1.5\, {\rm{\mu }}\mathrm{m}$ $<\lambda<$ $6.5\, {\rm{\mu }}\mathrm{m}$
that are not currently included in Spritz.
$6.5\, {\rm{\mu }}\mathrm{m}$
that are not currently included in Spritz.
Same as of Figure 14, but for the SPICA DS.
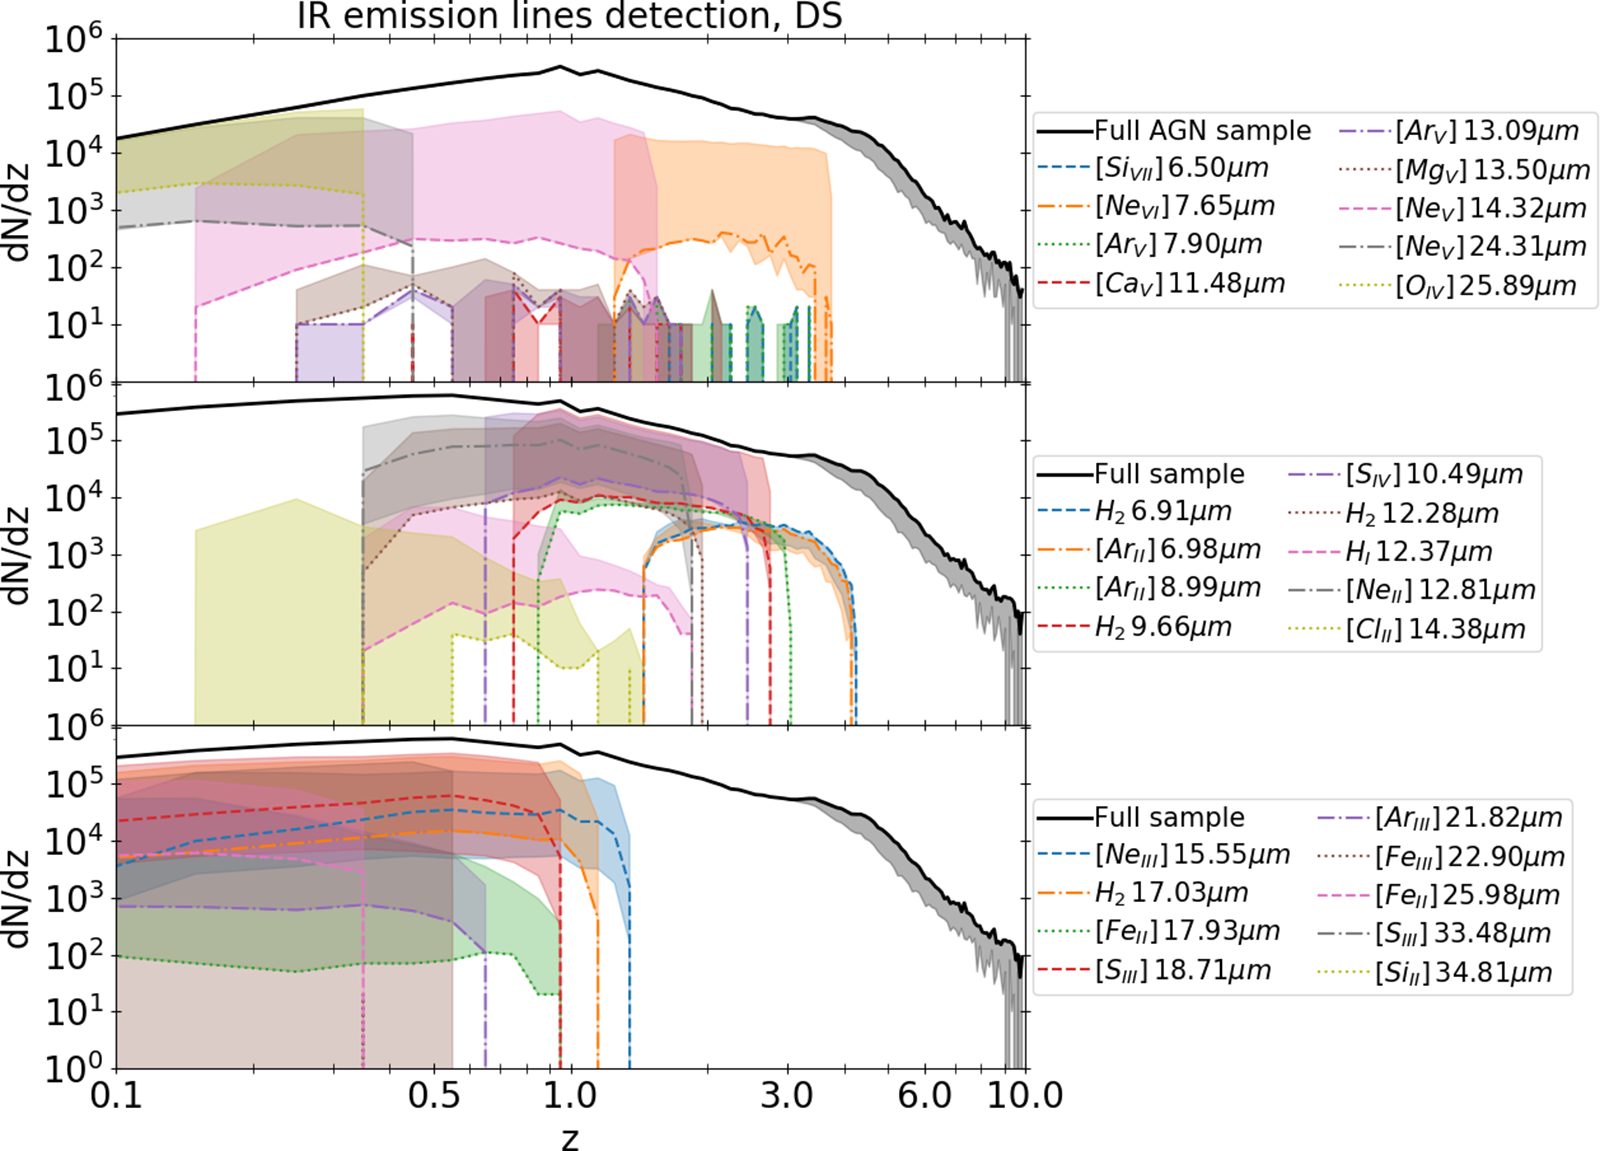
Same as of Figure 14, but for the OST-Deep survey. The complete sample refers to galaxies detected in at least one OST/OSS channel considering $R=4$
, while line detections are instead derived considering
$R=4$
, while line detections are instead derived considering $R=300$
.
$R=300$
.
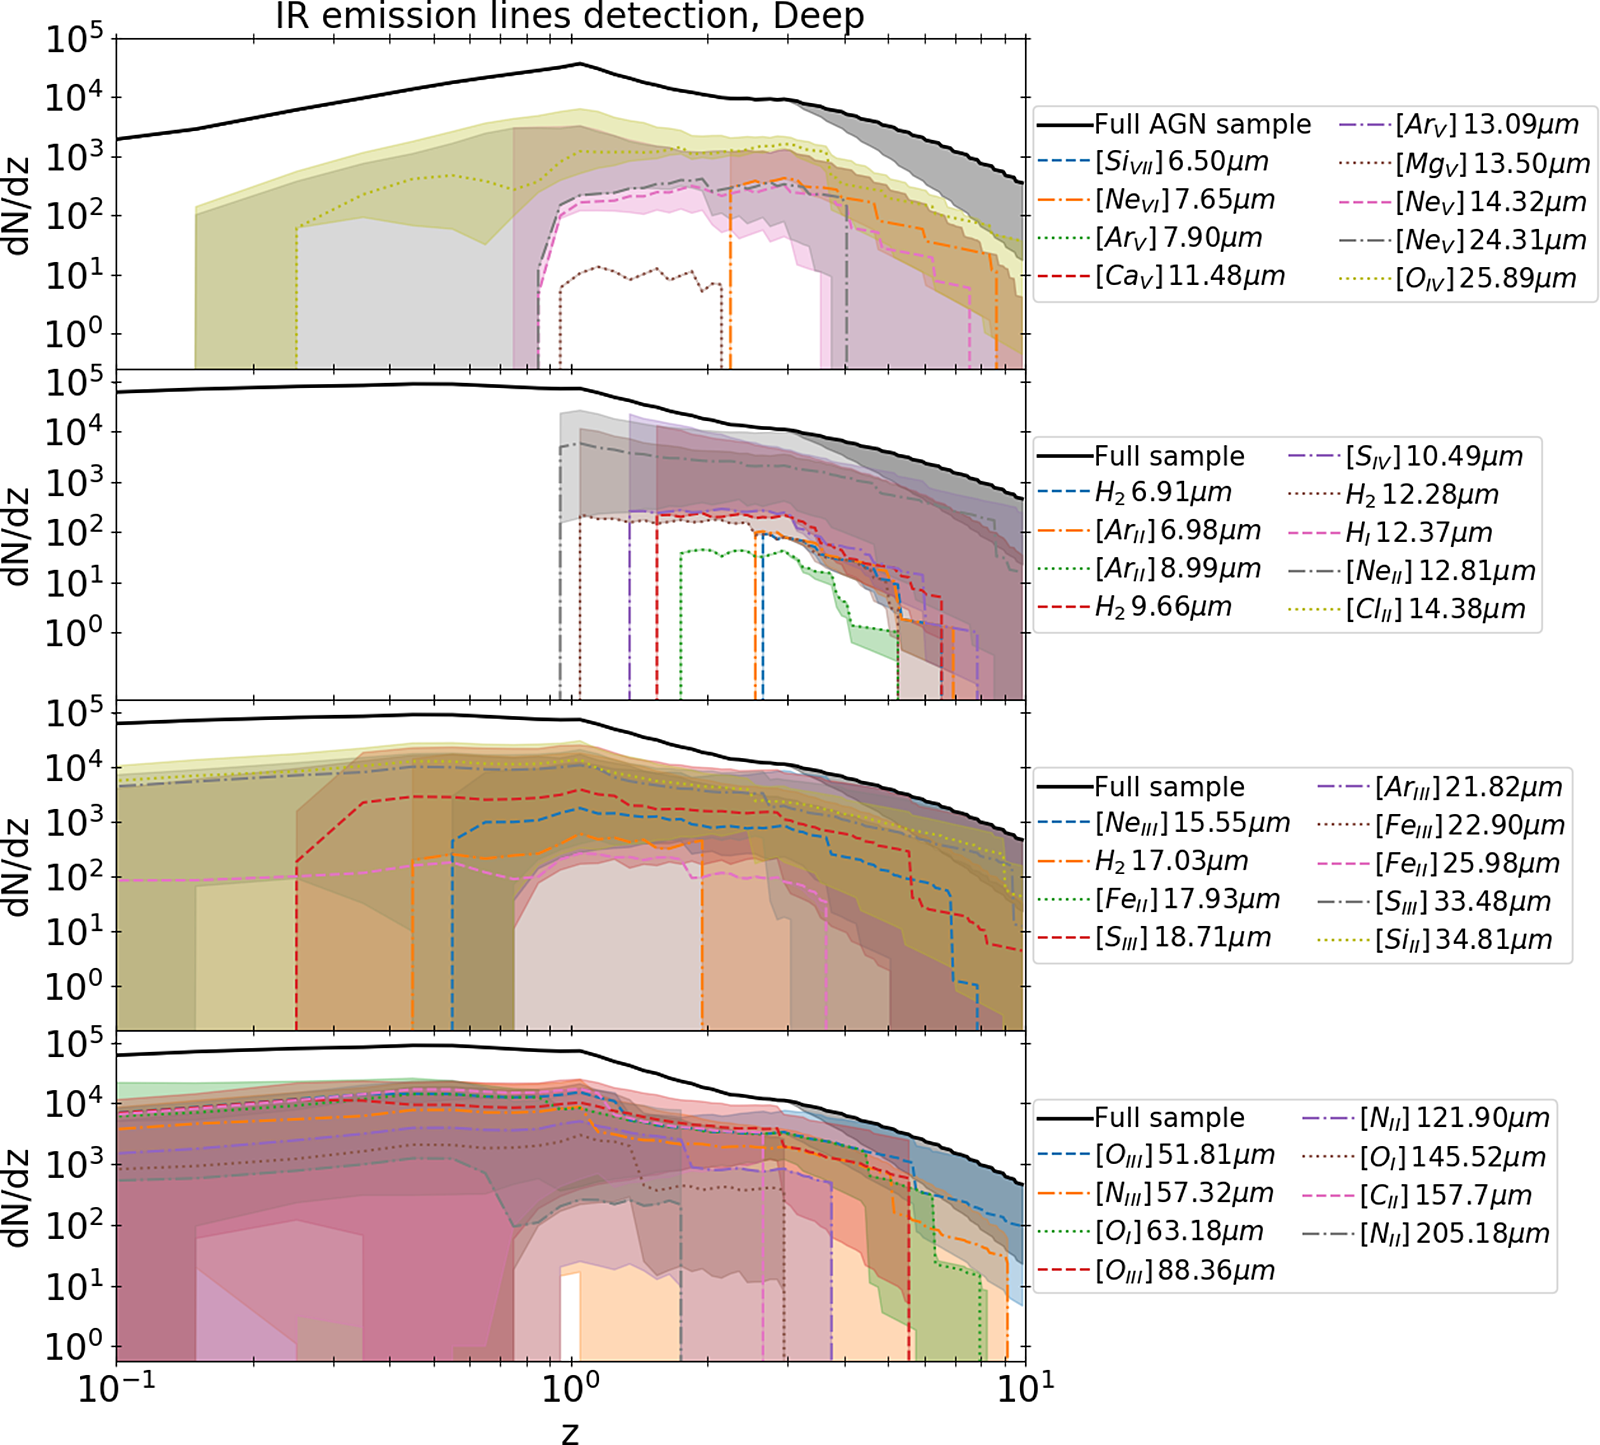
There would be no significant difference in the relative numbers of detections between the UDS and DS. The precise percentage of detections depends on the considered lines and redshift, ranging from less than 1% to almost all the galaxies. This gives an idea of the great power of such IR spectroscopy, offering a plethora of nebular emission lines not only to derive a precise redshift estimation, but also to study both star formation and AGN activity.
In Figures 16 and 17, we report results for the OST/OSS, considering all six available channels. We consider also additional fine-structure lines at wavelengths longer than what would be observed by SPICA/SMI, that is $\lambda>37\, {\rm{\mu }}\mathrm{m}$
, as OST/OSS covers up to
$\lambda>37\, {\rm{\mu }}\mathrm{m}$
, as OST/OSS covers up to $589\, {\rm{\mu }}\mathrm{m}$
. The number of galaxies with fine-structure-line detections varies with redshift, line and survey.
$589\, {\rm{\mu }}\mathrm{m}$
. The number of galaxies with fine-structure-line detections varies with redshift, line and survey.
Same as Figure 14, but for the OST-Wide survey. The complete sample refers to galaxies detected in at least one OST/OSS channel considering $R=4$
, while line detections are instead derived considering
$R=4$
, while line detections are instead derived considering $R=300$
.
$R=300$
.
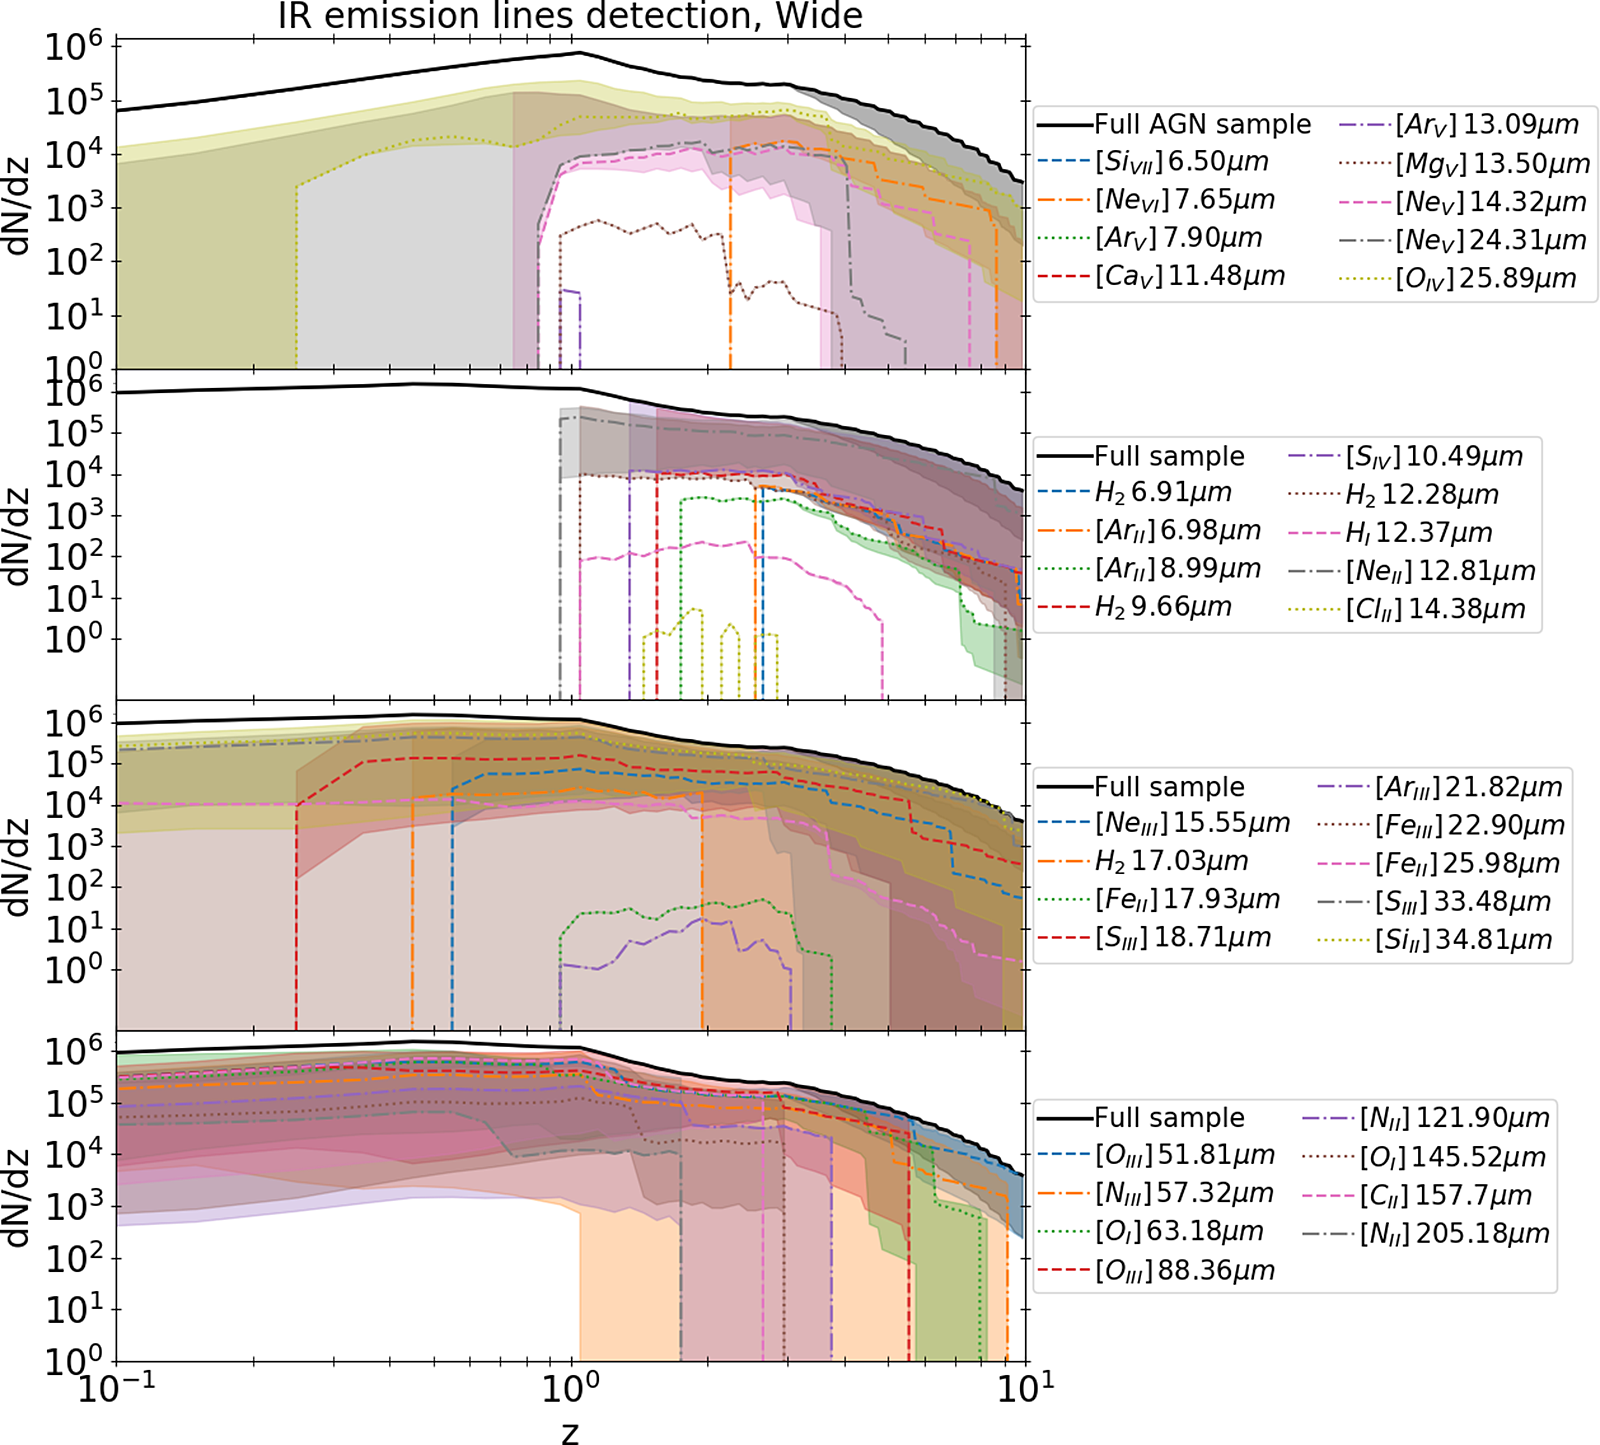
In the OST-Deep survey this number is generally below $10^{4}$
galaxies per redshift bin, while in the OST-Wide surveys some lines, like the [O I] at
$10^{4}$
galaxies per redshift bin, while in the OST-Wide surveys some lines, like the [O I] at $63\, {\rm{\mu }}\mathrm{m}$
, are expected to be detected in
$63\, {\rm{\mu }}\mathrm{m}$
, are expected to be detected in $5\times10^{5}$
galaxies per redshift bin, at least at very low-z (i.e.
$5\times10^{5}$
galaxies per redshift bin, at least at very low-z (i.e. $\textit{z}<0.8$
). The redshift range in which the different lines can be detected is very large, compared to what would have been possible with SPICA, thanks to the OST/OSS large wavelength range. Therefore, we expect that the analysis of many fine-structure lines, such as the [Ne V] at 14.32 and
$\textit{z}<0.8$
). The redshift range in which the different lines can be detected is very large, compared to what would have been possible with SPICA, thanks to the OST/OSS large wavelength range. Therefore, we expect that the analysis of many fine-structure lines, such as the [Ne V] at 14.32 and $24.3\, {\rm{\mu }}\mathrm{m}$
and [O IV] at
$24.3\, {\rm{\mu }}\mathrm{m}$
and [O IV] at $25.9\, {\rm{\mu }}\mathrm{m}$
, tracers of AGN activity, can be extended even at
$25.9\, {\rm{\mu }}\mathrm{m}$
, tracers of AGN activity, can be extended even at $\textit{z}>4.5$
with future OST/OSS observations.
$\textit{z}>4.5$
with future OST/OSS observations.
4. Conclusions
In this paper we presented a set of predictions for the spectro-photometric surveys planned for the SPICA mission concept, derived with the state-of-the-art simulation Spritz. Results are valid also for similar 2.5 m actively cooled space missions. We also present detailed predictions for NASA’s OST and GEP mission concepts, obtained with the same simulation.
In particular, we simulated the SPICA-like DS and UDS considering galaxies with detection in at least one of the broad-band filters centred at 34 (SMI) and $70\, {\rm{\mu }}\mathrm{m}$
(B-BOP) and observations with the simultaneous SMI-LR spectrometer ranging from 17 to
$70\, {\rm{\mu }}\mathrm{m}$
(B-BOP) and observations with the simultaneous SMI-LR spectrometer ranging from 17 to $36\, {\rm{\mu }}\mathrm{m}$
. We considered a
$36\, {\rm{\mu }}\mathrm{m}$
. We considered a $5\sigma$
depth of 3 and
$5\sigma$
depth of 3 and $13\, {\rm{\mu }}\mathrm{Jy}$
at
$13\, {\rm{\mu }}\mathrm{Jy}$
at $34\, {\rm{\mu }}\mathrm{m}$
and 60 and
$34\, {\rm{\mu }}\mathrm{m}$
and 60 and $100\, {\rm{\mu }}\mathrm{Jy}$
at
$100\, {\rm{\mu }}\mathrm{Jy}$
at $70\, {\rm{\mu }}\mathrm{m}$
, in the UDS and DS respectively. We also simulated two surveys for OST, a Deep one of
$70\, {\rm{\mu }}\mathrm{m}$
, in the UDS and DS respectively. We also simulated two surveys for OST, a Deep one of $0.5\, \mathrm{deg}^{2}$
and a Wide one of
$0.5\, \mathrm{deg}^{2}$
and a Wide one of $20\, \mathrm{deg}^{2}$
, and other two surveys of 3 and
$20\, \mathrm{deg}^{2}$
, and other two surveys of 3 and $30\, \mathrm{deg}^{2}$
for GEP.
$30\, \mathrm{deg}^{2}$
for GEP.
Our main findings are:
-
The most luminous galaxies would be observed up to
${z}=10$
, in the SPICA DS of
$15\, \mathrm{deg}^{2}$
, and, even considering the most conservative results, at least up to
${z}=8$
in the SPICA UDS. Similar conclusions apply also to OST and GEP. -
LIRGs would be observed at
$34\, {\rm{\mu }}\mathrm{m}$
up to
${z}=4.0$
in the UDS and up to
${z}=2.5$
in the DS, whereas ULIRGs would be detected at all redshifts in the both the UDS and DS. Observations of LIRGs would be mainly limited at
${z}<2$
at
$70\, {\rm{\mu }}\mathrm{m}$
in both surveys. The observational depth planned for the OST/OSS Chanel 2 in the OST-Deep survey should instead allow for detecting at least few LIRGS up to
${z}=4$
. -
On average, 26% (37%) of AGN detected at 34 or
$70\, {\rm{\mu }}\mathrm{m}$
in the SPICA UDS (DS) would have soft 0.5–2 keV X-ray fluxes above
$4\times10^{-17}\,{\rm erg\,s}^{-1}\,{\rm cm}^{-2}$
, that is corresponding to the observational depth of the Athena Deep Survey. The fractions are lower if we consider detections in the hard X-rays. This shows the complementary nature of X-ray and IR observations in the study of AGN in general, and obscured AGN in particular. -
The redshift estimation could be derived for SPICA/SMI using at least two PAH features from
${z}=1.0$
to
${z}=5$
, for 29% (19%) of the sample in the UDS (DS) on average. At
$\textit{z}\sim 5$
–8, the redshift estimation could be based on the
$\mathrm{Br}_{\alpha}$
and
$\mathrm{Br}_{\beta}$
lines at these redshifts, at least for the few galaxies for which these lines are detected. At higher redshifts, only few tens of galaxies could have a detection in an hydrogen recombination line. -
Considering all OST/OSS channels and galaxies detected in photometry (i.e.
$R=4$
) in the OST-Deep survey, we expect to detect six different PAH features for 4% of the galaxies at
${z}=3$
–8 and at least two PAH features for 37%, on average, of galaxies at
$\textit{z}>1$
. However, OST wavelength range, starting at wavelengths longer than SPICA/SMI, limits the number of observable bright hydrogen recombination lines. -
The AGN and host galaxy analysis could be performed with SPICA/SMI at
$\textit{z}<4.5$
and it will be possible at even higher redshfits with OST/OSS. This is possible using a large set of IR nebular emission lines originated from star formation or AGN activity, such as different neon lines like the [Ne V] at
$14.32\, {\rm{\mu }}\mathrm{m}$
and at
$24.31\, {\rm{\mu }}\mathrm{m}$
and the [Ne II] at
$12.81\, {\rm{\mu }}\mathrm{m}$
.





These results show the capability of SPICA, OST and GEP to detect galaxies up to $\textit{z}= 10$
without being affected by dust obscuration and also to study the physics of AGN and star formation for a large fraction of such objects.
$\textit{z}= 10$
without being affected by dust obscuration and also to study the physics of AGN and star formation for a large fraction of such objects.
Acknowledgements
This paper is dedicated to the memory of Bruce Swinyard, who initiated the SPICA project in Europe, but unfortunately died on 2015 May 22 at the age of 52. He was ISO-LWS calibration scientist, Herschel -SPIRE instrument scientist, first European PI of SPICA and first design lead of SAFARI. We acknowledge the whole SPICA Collaboration Team. LB, CG, LS and JAFO acknowledge financial support by the Agenzia Spaziale Italiana (ASI) under the research contract 2018-31-HH.0. LB would like to thank F. La Franca and M. Malkan for providing constructive comments. AF and FC acknowledges the support from grant PRIN MIUR2017-20173ML3WW_001. MPS acknowledges support from the Comunidad de Madrid through the Atracción de Talento Investigador Grant 2018-T1/TIC-11035 and PID2019-105423GA-I00 (MCIU/AEI/FEDER,UE). FJC acknowledges financial support from the Spanish Ministry MCIU under project RTI2018-096686-B-C21 (MCIU/AEI/FEDER/UE), cofunded by FEDER funds and from the Agencia Estatal de Investigación, Unidad de Excelencia MarÍa de Maeztu, ref. MDM-2017-0765.