


1. Introduction
Scientific motivations and responsively evolving instrumentation have recently greatly expanded the collection and analysis of high-quality seismic data from Antarctica and other remote polar regions, and have driven significant developments in glacial seismology (Podolskiy and Walter, Reference Podolskiy and Walter2016; Aster and Winberry, Reference Aster and Winberry2017). An element of this is the deployment of floating seismographs atop tabular icebergs (Okal and MacAyeal, Reference Okal and MacAyeal2006; MacAyeal and others, Reference MacAyeal, Okal, Aster and Bassis2008; Martin and others, Reference Martin2010) and ice shelves (Bromirski and Stephen, Reference Bromirski and Stephen2012; Heeszel and others, Reference Heeszel, Fricker, Bassis, O'Neel and Walter2014; Zhan and others, Reference Zhan, Tsai, Jackson and Helmberger2014). Floating seismograph deployments facilitate the study of a variety of physical and environmental phenomena, including direct measurements of elastic and elastigravity wave propagation in ice (Sergienko, Reference Sergienko2017; Chen and others, Reference Chen2018); detection of hydroacoustic radiation from iceberg–iceberg collisions and iceberg shoaling (Talandier and others, Reference Talandier, Hyvernaud, Reymond and Okal2006; Dowdeswell and Bamber, Reference Dowdeswell and Bamber2007; MacAyeal and others, Reference MacAyeal, Okal, Aster and Bassis2008; Martin and others, Reference Martin2010) and the monitoring and understanding of seismogenic fracture and other instability mechanisms that may lead to ice shelf weakening or collapse, particularly when preconditioned for failure by fracturing and englacial melt (e.g. MacAyeal and others, Reference MacAyeal, Scambos, Hulbe and Fahnestock2003; Bromirski and Stephen, Reference Bromirski and Stephen2012; Paolo and others, Reference Paolo, Fricker and Padman2015; Furst and others, Reference Fürst2016; Massom and others, Reference Massom2018; Olinger and others, Reference Olinger2018).
The ambient seismic wavefield of the Ross Ice Shelf (RIS) (i.e. in the absence of local, regional and teleseismic earthquake signals) is dominated by a broad spectrum of elastic and flexural-gravity waves that result from the coupling of the ice shelf with oceanic and atmospheric processes. At ultra-long periods (>100 s), flexural-gravity waves have been observed coincident with tsunami arrivals from the 2004 Sumatra earthquake (Okal and MacAyeal, Reference Okal and MacAyeal2006) and the 2015 Chile earthquake (Bromirski and others, Reference Bromirski2017). At long periods (10–40 s), flexural-gravity waves and fundamental symmetric mode (S0) Lamb waves have been observed in response to ocean swell events traced to storms in the northern Pacific, Southern and Indian oceans (Cathles and others, Reference Cathles, Okal and MacAyeal2009; Chen and others, Reference Chen2018). At short periods (<1 s), Rayleigh waves propagating within the near-surface firn/ice velocity gradient have been correlated with ocean waves interacting with the ice front (Diez and others, Reference Diez2016) and to the coupling of wind into seismic energy via interactions with surface features such as sastrugi and snow drifts (Chaput and others, Reference Chaput2018).
Using 2 years' continuous data from the RIS, we quantify the spatial and temporal variations in the seismic background state of the ice shelf in the context of oceanic excitation mechanisms. We focus on period bands that are typically associated with the global primary (10–20 s) and secondary (5–10 s) microseism signals (e.g. Hasselmann, Reference Hasselmann1966), and a short-to-intermediate period band (0.4–4.0 s) that we will show is strongly correlated with the absence of sea ice in the Ross Sea. Because the noise environment is strongly modulated by both oceanic forcing and ice shelf geometry, this study underpins background levels of seismic excitation that are relevant to potential long-term seismic monitoring of the RIS in the context of climate-driven environmental changes. For example, dispersion curve analysis of short period Rayleigh waves can provide depth estimates for meteoric firn layers (Diez and others, Reference Diez2016), while longer period flexural-gravity waves similarly sample the thickness of the entire ice column (Robinson, Reference Robinson1983). Strong spectral peaks are also associated with water column reverberations of P-waves (e.g. Diez and others, Reference Diez2016) and ice layer reverberations of SV- and SH-waves (Crary, Reference Crary1954); the peak periods of these signals also provide estimates of water and ice thicknesses, respectively. In the context of global seismology, the ambient spectral power within the 0.4–20 s period band additionally characterizes the background noise levels for observations of teleseismic earthquake P-waves (0.5–2.0 s), S-waves (10–15 s) and short-period surface waves (>17 s) that provide new constraints on the seismic structure of the Antarctic Plate in the Ross Embayment region (e.g. White-Gaynor and others, Reference White-Gaynor2019). Quantification of teleseismic earthquake signal-to-noise ratios will be presented in a future study.
2. Structure of the Ross Ice Shelf
The RIS has an area of ~500,000 km2 and a geographically-variable thickness generally in the range of 200–400 m. The RIS is structurally heterogeneous, being composed of varying proportions of advected onshore glacial, meteoritic and bottom and peripheral marine ice. The RIS overlies an ocean column of variable but approximately comparable thickness. Where ice delivered from tributary glaciers abuts, prominent suture zones are formed that persist to the terminus as shelf ice is transported to the ice edge at velocities of up to ~1 km a−1. The location of the ice edge is controlled by the balance between advection and calving, commonly via large tabular icebergs (e.g. MacAyeal and others, Reference MacAyeal, Okal, Aster and Bassis2008; Martin and others, Reference Martin2010). Subglacial and surface crevasses and rifts on the RIS are commonly semi-aligned with the calving front, reflecting a generally tensional stress environment in the seaward flow direction (e.g. LeDoux and others, Reference LeDoux, Hulbe, Forbes, Scambos and Alley2017). Shelf elastic structure is, on the largest scale, characterized by laterally extensive elastic components overlying the ocean and solid Earth that can produce strong guided-wave phenomena. The principal components are: (1) a meteoritic snow-firn layer that transitions to glacial ice over tens of meters; (2) a glacial ice layer, which varies in thickness from 200 to 1400 m at RIS station sites (median 330 m for floating ice and 925 m for grounded ice) and which may incorporate a frozen ocean layer at its base; and (3) an ocean water layer that varies in thickness from 100 to 700 m for RIS station sites (median 440 m). Significant lateral variations within the ice shelf include tensional rifts, suture zones, grounding point perturbations and shear zones associated with ice streams.
Nascent iceberg (NIB) is a semi-detached spur at the RIS ice front partially bounded by a 46 km long rift. Expansion of the rift – and eventual calving of NIB – has apparently been arrested by propagation of the rift into a suture zone with a higher fracture toughness than the surrounding ice shelf (Borstad and others, Reference Borstad, McGrath and Pope2017; LeDoux and others, Reference LeDoux, Hulbe, Forbes, Scambos and Alley2017; Lipovsky, Reference Lipovsky2018) and has been in near-steady-state since at least 2004 (Okal and MacAyeal, Reference Okal and MacAyeal2006; Lipovsky, Reference Lipovsky2018). By design, three stations located at the northern terminus of the array transected NIB for the purpose of studying ice front mechanics and cryoseismic signals. Our preliminary observations from these stations indicate that the RIS ice front experiences broadband, nonlinear, ocean-forced excitation during periods of especially energetic swell activity. These ambient processes are apparently closely bound to the ice front as they are not significantly observed even at the closest interior station located 50 km landward. Due to the complexities of the ice front spectra, we will focus the current work on the interior stations and will address the ice front signals in a future study.
3. Instrumentation and data
Thirty-four polar-engineered Incorporated Research Institutions for Seismology (IRIS) Polar Programs broadband seismic stations were installed during late 2014 for a ~2-year continuous deployment during the coordinated RIS (Mantle Structure and Dynamics of the Ross Sea from a Passive Seismic Deployment on the Ross Ice Shelf) and DRIS (Dynamic Response of the Ross Ice Shelf to Wave-Induced Vibrations) projects (Figs 1, S1) (Bromirski and others, Reference Bromirski2015) (doi:10.7914/SN/XH_2014).
RIS array station locations. DR stations not explicitly labeled here (DR05–DR14; unlabeled yellow triangles) were deployed in the vicinity of central station RS04, as shown in Fig. S1. High-resolution bathymetry is shown in Fig. S2. All RS and DR stations were deployed on ice and all were on the floating ice shelf with the exception of: RS08 and RS09 on Roosevelt Island; RS11–RS14 on the West Antarctic Ice Sheet in Marie Byrd Land and RS17 on an unnamed subglacial island within the RIS. Also shown is the bare-rock station VNDA (blue) in the Dry Valleys region, and Automatic Weather Station (AWS) WTL on Franklin Island. The RIS is outlined in red. Inset: Map of Antarctica at the standard Grid-North orientation, with the RIS highlighted in red. QSPA (orange) and VNDA (blue) are shown for reference.
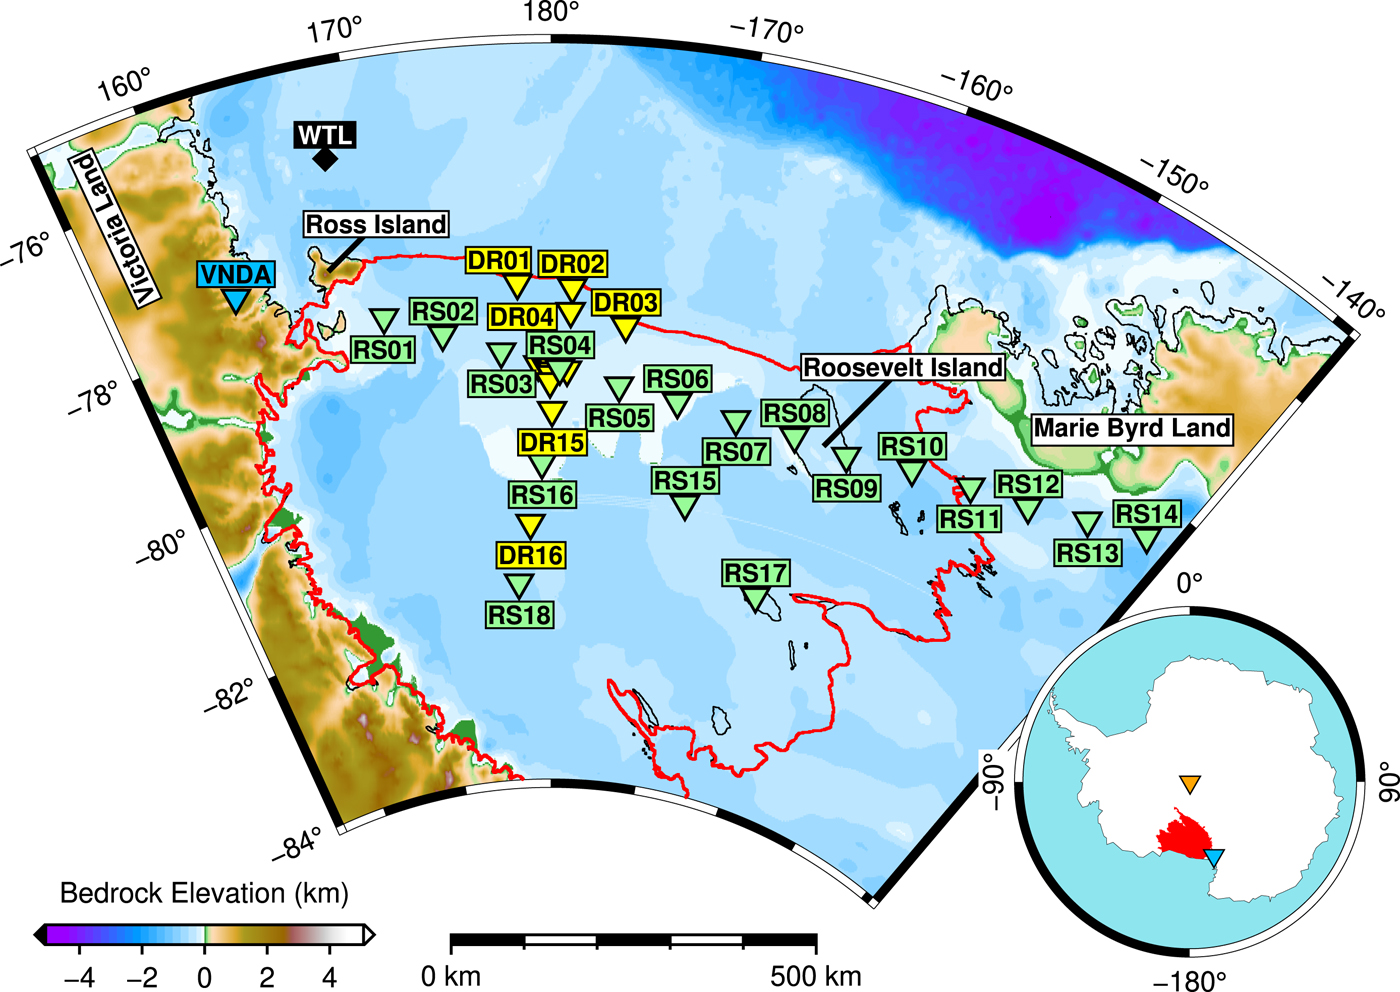
Seismographs were deployed in a ~1100 km-long ice-front-parallel transect bisected by a ~425 km long ice-front-perpendicular transect. The network consisted of (1) a shelf-spanning large aperture array (RS01–RS18) with an average spacing of 100 km; and (2) a central medium aperture array (DR01–DR16) with stations spaced at 20–50 km. All stations were sited on floating ice with the exceptions of RS08 and RS09 on Roosevelt Island, RS11–RS14 in Marie Byrd Land and RS17 on an unnamed grounded region of the southern RIS.
All RS and DR stations utilized Nanometrics Trillium 120PH posthole sensors buried at depths of 2–3 m below the snow surface at the time of installation, with the exception of RS09, RS11–RS14 and RS17, which were Nanometrics Trillium 120PA sensors installed on phenolic resin pads within shallow vaults. All DR stations and RS04 sampled at 200 Hz; all other RS stations sampled at 100 Hz. Stations ran on solar power during the Antarctic summer and lithium batteries during the winter. Due to Iridium satellite power and bandwidth constraints, only state of health information was telemetered, necessitating annual service visits to recover data. The noise analysis presented here incorporates data from the full 2-year deployment (approximately November 2014–November 2016). A subset of stations (RS10–RS14) remained deployed in Marie Byrd Land until early February 2017.
We also make use of the following supplemental datasets: (1) daily sea ice concentration measurements from the National Snow and Ice Data Center (NSIDC) for a region of the Ross Sea between longitudes 139° W and 155° E, and south of latitude 65° S (Cavalieri and others, Reference Cavalieri, Parkinson, Gloersen and Zwally1996); (2) wind speed measured at weather station Whitlock (WTL) on Franklin Island, from the University of Wisconsin-Madison Automatic Weather Station Program (AWS); (3) seismic data recorded by permanent stations VNDA (40 Hz) in the McMurdo Dry Valleys (Global Telemetered Seismograph Network, doi:10.7914/SN/GT) and QSPA (40 Hz, Location Code 70) at South Pole Station (Global Seismograph Network, doi:10.7914/SN/IU); (4) glacial ice thicknesses and water column depths for the RIS and Marie Byrd Land, from the BEDMAP2 survey (Fretwell and others, Reference Fretwell2013) and (5) bathymetry and topography data from the National Geophysical Data Center ETOPO1 Global Relief Model (doi:10.7289/V5C8276M).
We use data from supplemental sources 1–3 for a date range between 1 November 2014 and 31 March 2017. We note that features of the RIS from BEDMAP2 may be outdated as the model is based on data collected in 1996. However, based on observations of P- and S-wave reverberations in the water and ice layers, respectively, the BEDMAP2 thicknesses remain usefully accurate for our purposes as of 2016 (Diez and others, Reference Diez2016; Chaput and others, Reference Chaput2018). The northward extent of the RIS ice front, however, has advanced several kilometers since 1996 and is presently located ~3 km north of the ice front stations DR01–DR03. For the large-scale maps presented in this study, we have manually shifted the coordinates of the ice front stations south by ~23 km; profiles of the North-South transect show the unaltered positions.
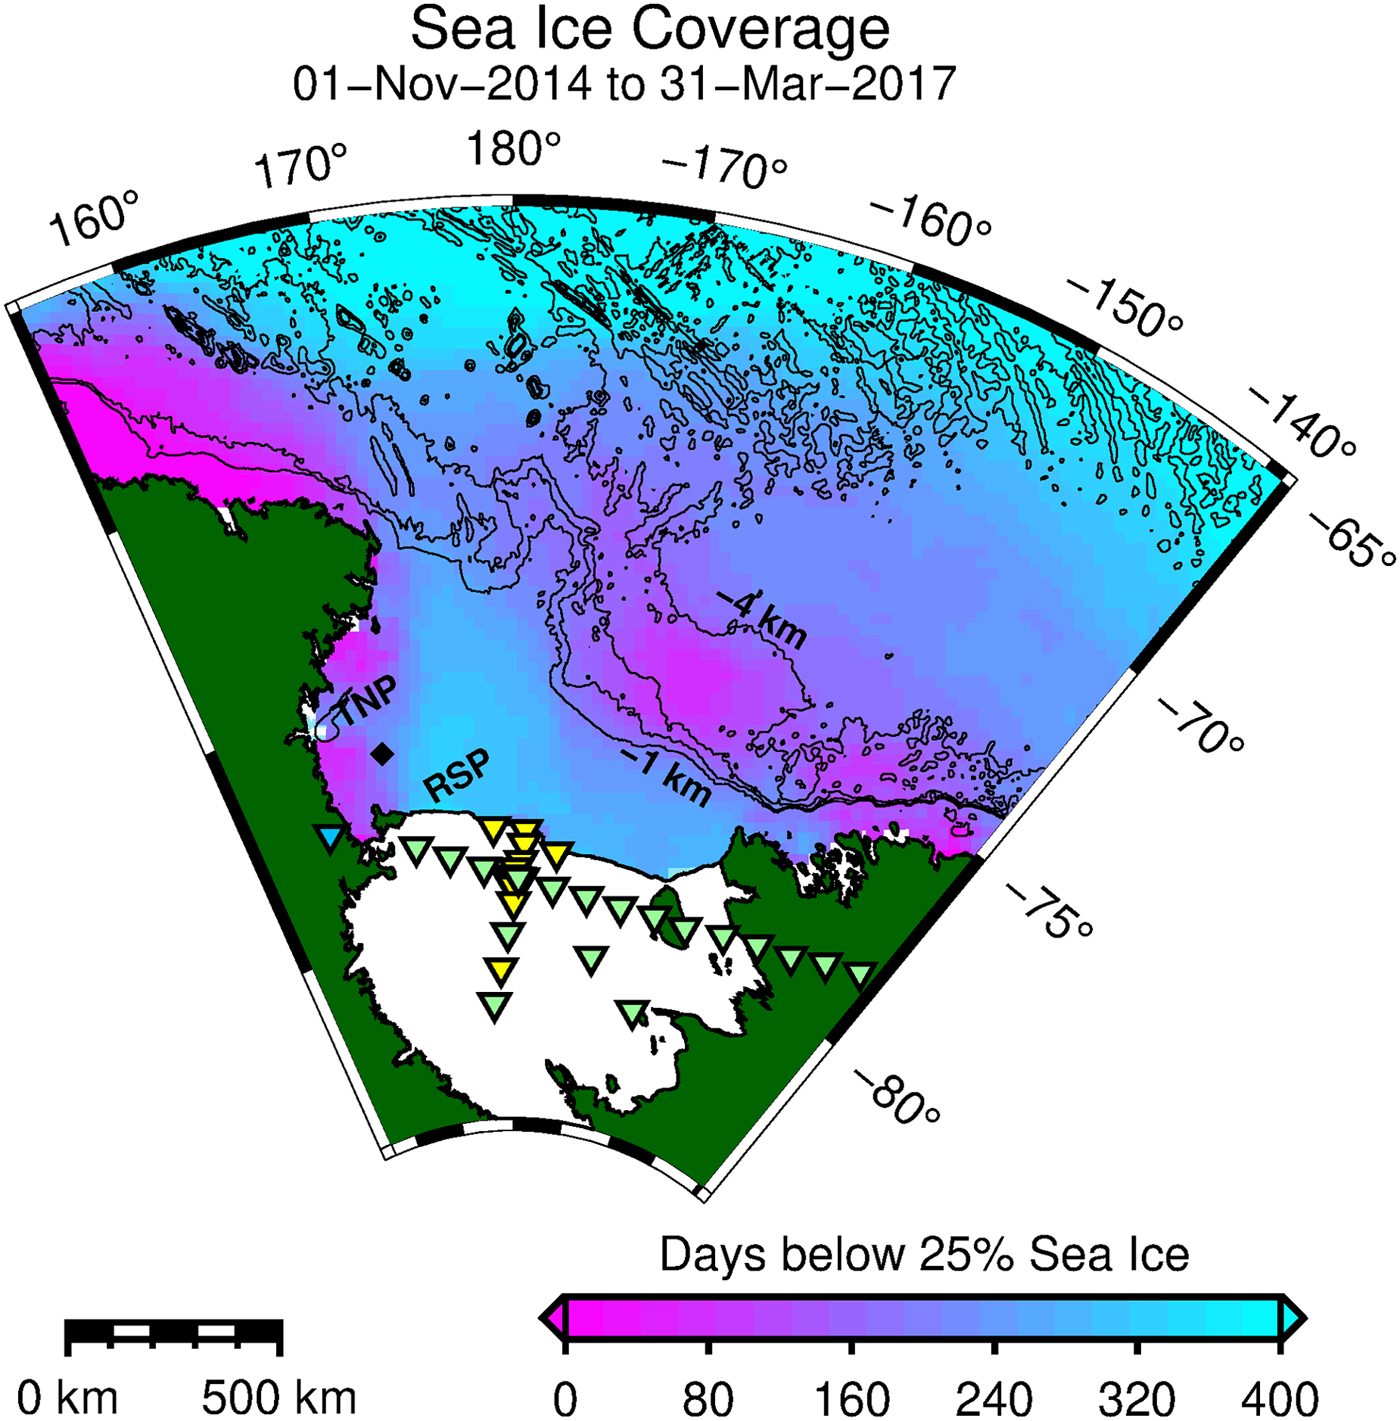
Sea ice concentrations are based on surface brightness temperatures amalgamated from satellite-based microwave imagers (Cavalieri and others, Reference Cavalieri, Parkinson, Gloersen and Zwally1996). Data are provided in 25 × 25 km grids at daily resolution. Sea ice concentration for each grid is specified by a fractional value ranging from 0.0 (open sea) to 1.0 (complete ice coverage). Accuracy is estimated to be ±0.05 during the winter and ±0.15 during the summer, with the latter being adversely affected by surficial melt ponds. Figure 2 maps the variations in the sea ice concentration data used in this study. We also define an open water concentration, O, as the complement of ice sea concentration, I (i.e. O=1−I); this is for clarity on plots where spectral power would otherwise be anticorrelated with sea ice concentration.
Sea ice concentrations in the Ross Sea (Cavalieri and others, Reference Cavalieri, Parkinson, Gloersen and Zwally1996), presented as the number of days that each 25 × 25 km cell recorded a concentration below 25%. Blue indicates portions of the Ross Sea where the sea ice is minimal during the summer, while fuchsia indicates areas of near-perennial sea ice coverage. Bathymetry contour lines are presented at 1 km intervals. RSP and TNP mark the approximate locations of the annual Ross Sea and Terra Nova Polynyas, respectively.
4. Methods
4.1 Spectral bands
We address three spectral bands defined by time-varying phenomenology observed by the RIS network (Table 1).
Ambient spectral bands referred to in this study
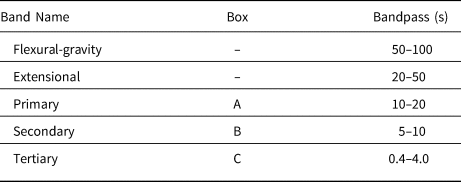
The lettered bands are specifically addressed in this study. The flexural-gravity and extensional bands are covered in other sources (see ‘Results and discussion’ section) and are listed here only for completeness.
We define the Primary (10–20 s) and Secondary (5–10 s) bands to coincide with the period bounds typically associated with the global primary and secondary microseism wavefields, respectively. For land-sited stations (i.e. not deployed on an ice shelf or iceberg), the Primary band is dominated by globally-observed, principally crustal, Rayleigh waves generated by wind-driven deep ocean waves shoaling on shallow continental shelves (e.g. Hasselmann, Reference Hasselmann1966). The Secondary band records Rayleigh waves generated by wave–wave interferences of ocean swells reflecting from coastlines or ice edges, or from wind and storm scenarios that otherwise create standing wave components (Longuet-Higgins, Reference Longuet-Higgins1950). Both microseism wavefields are principally sourced in shallow coastal waters but are easily observed at land-based stations hundreds or thousands of kilometers inland via Rayleigh wave propagation.
High-latitude extratropical cyclonic storm activity increases during winter, accompanied by an increase in primary and secondary microseism power observed globally at mid- to high-latitude seismic stations (Aster and others, Reference Aster, McNamara and Bromirski2008). However, primary and secondary microseism power observed at land-sited seismographs in polar regions is broadly anticorrelated with sea ice density and attendant near-continent ocean swell attenuation (Aster and others, Reference Aster, McNamara and Bromirski2008; Bromirski and others, Reference Bromirski, Sergienko and MacAyeal2010; Tsai and McNamara, Reference Tsai and McNamara2011; Anthony and others, Reference Anthony, Aster and McGrath2017), so that late-winter background levels in Antarctica, in particular, have been previously noted to be typically less than late summer levels in these bands (e.g. Aster and others, Reference Aster, McNamara and Bromirski2008, Reference Aster, McNamara and Bromirski2010).
We define the Tertiary band (0.4–4.0 s) based on a summertime ‘high-power state’ which we will show is strongly correlated with the seasonal break-up and formation of sea ice in the Ross Sea. Environmentally-forced excitation of this band has previously been identified by land-sited seismometers in proximity to coastlines (Kibblewhite and Ewans, Reference Kibblewhite and Ewans1985; Tsai and McNamara, Reference Tsai and McNamara2011) and lake shores (Xu and others, Reference Xu, Koper and Burlacu2017; Anthony and others, Reference Anthony, Ringler and Wilson2018; Smalls and others, Reference Smalls, Sohn and Collins2019). These studies have found that the amplitude of this signal is strongly correlated with regional wind-sea and regional swell, and is strongly attenuated by the formation of sea or lake ice. Also common among these studies is a spectral peak of ~1 s, regardless of lake or ocean dimensions. The source mechanism for this spectral band has not been conclusively identified, though it is generally hypothesized to relate to the same linear wave-seafloor interactions or nonlinear wave–wave interactions responsible for the primary and secondary microseism wavefields, respectively, operating at higher frequencies.
We emphasize a notational difference between the primary and secondary microseism wavefields, which consist solely of Rayleigh waves, and the Primary and Secondary bands defined for this study, which may include additional wave modes. We choose the name ‘Tertiary band’ as a logical progression of this naming scheme, in keeping with the aforementioned studies that have suggested that the attendant wavefield is a common component of the microseism spectrum. As with the Primary and Secondary bands, observations of the Tertiary band on an ice shelf may include wave modes other than Rayleigh waves.
4.2 Spectral characterization
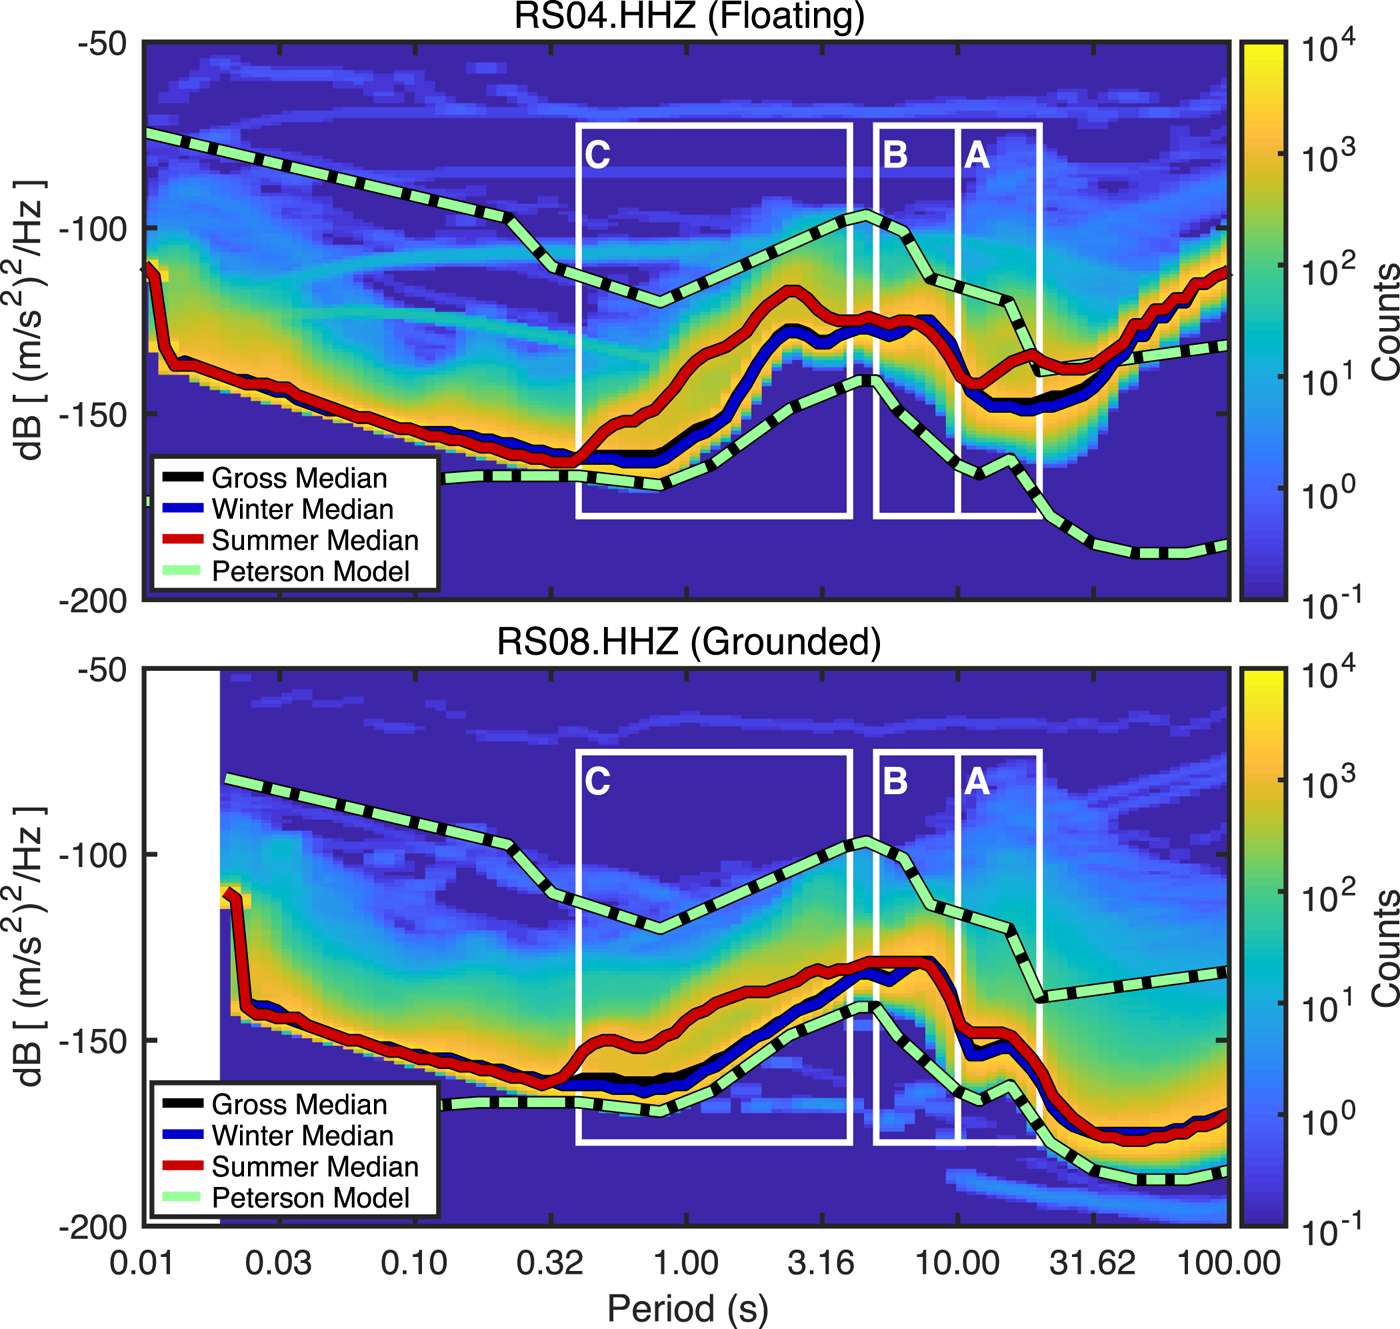
We visualize and quantify the background seismic noise environment using probability density function representations of the power spectral density (e.g. Fig. 3). These so-called power spectral density-probability distribution functions (PSD-PDFs) (McNamara and Buland, Reference McNamara and Buland2004) were constructed using the IRIS Noise Toolkit (doi:10.17611/DP/NTK.2). For PSD-PDF analysis, velocity time series data were segmented into hour-long time segments with 50% overlap. For each segment, acceleration PSDs were generated using Welch's subsection averaging method (Welch, Reference Welch1967) incorporating 15 Hanning-tapered subsegments. PSDs were smoothed by averaging over 1/8 octave intervals and rounded to the nearest dB. The resultant PSD-PDF is a two-dimensional histogram of observed power and period. We do not remove teleseismic earthquake or local icequake signals from the PSD data, as these events are sufficiently transitory so as to not significantly impact median PSD-PDF statistics for these windowing parameters, except in unusual circumstances (Aster and others, Reference Aster, McNamara and Bromirski2008; Anthony and others, Reference Anthony2015).
PSD-PDFs from representative floating and grounded stations. RS04 is situated near the intersection of the array transects and has the array-wide median ice thickness of 330 m. RS08 is on grounded ice at Roosevelt Island. Labeled boxes (A, B, C) outline the signal bands listed in Table 1 and discussed throughout the text. Green contours denote the Global Seismographic Network-derived New High and New Low Noise Models (Peterson, Reference Peterson1993). The high-power, low-probability broadband artifacts apparent on both stations are caused by transient sensor processes (e.g. McNamara and Buland, Reference McNamara and Buland2004).
4.3 Temporal and spatial variation
The vibrational excitation of the RIS by ocean waves is highly seasonally variable. Two critical seasonal factors affecting the interaction between ocean waves and the RIS are the presence or absence of the wind- and salinity-controlled polynya directly offshore of the ice front (Nakata and others, Reference Nakata, Ohshima, Nihashi, Kimura and Tamura2015), and the waxing and waning of circum-continental sea ice (Aster and others, Reference Aster, McNamara and Bromirski2008; Anthony and others, Reference Anthony2015). We categorize noise spectra here in terms of ‘seasons’ that are dictated by annually periodic sea ice variations. ‘Summer’ or ‘SMR’ denote the generally open-water ice front periods between 1 December and 31 March, while ‘Winter’ or ‘WTR’ denote the remainder of the year, during which sea ice is historically contiguous across the ice shelf front (e.g. Cavalieri and others, Reference Cavalieri, Parkinson, Gloersen and Zwally1996). To create inter-seasonal metrics for the 2 years of observation, distinct PSD-PDFs were computed for the summer and winter seasons.
We assess the spatial contributions of sea ice variability in the Ross Sea to the seismic power observed in each spectral band by calculating the time series correlations between the spectral band powers and the open water concentrations for each 25 × 25 km grid cell of NSIDC data.
We quantify spatial variations across the RIS by plotting the mean band powers at each station along the North-South and West-East network transects. We calculate the mean band power as the mean value of the median PSD curves (i.e. the average of the winter and summer median curves; Fig. 3) for the period bounds specified in Table 1. The North-South transect includes, in order, stations DR02, DR04–DR06, DR10, DR12–DR15, RS16, DR16 and RS18. The West-East transect includes, in order, stations RS01–RS03, DR07–DR10, RS04, DR11and RS05–RS14. Stations RS15 and RS17 do not align with either transect and are omitted from this spatial analysis. We qualitatively identify the predominant wavefield modes observed along each transect based on bandpass filtering (as detailed in the next section) and the mean band power horizontal-over-vertical ratios (HOV); because we report the mean band powers in decibels, the HOV values (also in dB) are calculated as the differences between the horizontal (HHN, HHE) powers and the vertical (HHZ) power (Fig. 4).
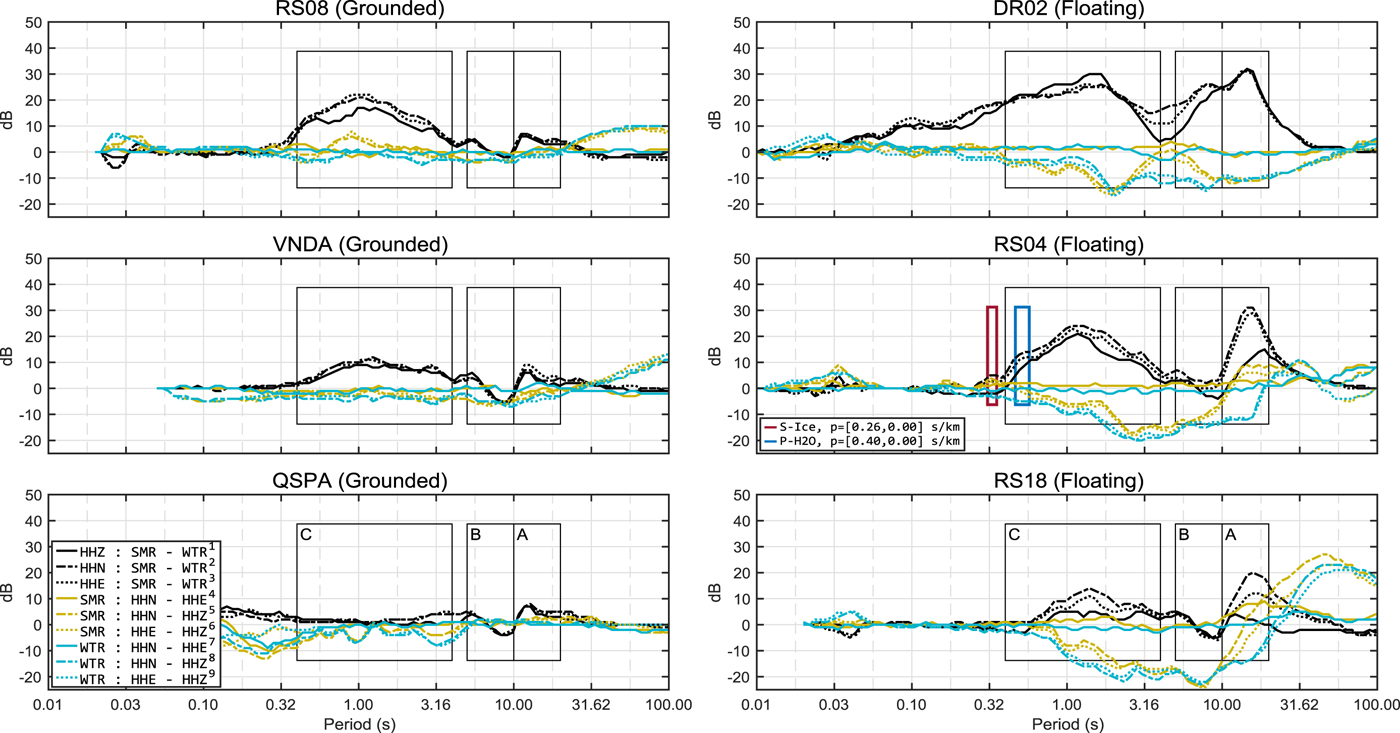
Differential PSDs for representative stations, showcasing the variations in seismic power for the disparate near-surface geometries. Traces are produced by subtracting the seasonal median PSD-PDF dB values. Black traces (1, 2, 3) show seasonal changes between for each component, with positive values indicating higher power during the summer. Solid yellow (4) and teal (7) traces show power differences in north versus east components for summer and winter, respectively, with positive values indicating higher power observed on the north component. Chain-dashed yellow (5) and teal (8) traces indicate north versus vertical HOV values; dotted yellow (6) and teal (9) traces indicate east versus vertical HOV values. RS08 is on grounded ice on the western shore of Roosevelt Island, ~7 km from the nearest grounding line and ~110 km from the RIS ice front. VNDA is a borehole sensor located in the ice-free McMurdo Dry Valleys, ~120 km from the RIS. QSPA is an ice-borehole sensor located 8 km from the Amundsen-Scott South Pole Station, ~600 km from the RIS, and is presented as a baseline for the Primary (A), Secondary (B) and Tertiary (C) bands. DR02 is ~3 km from the ice front and provides a reference near the ice front. RS04 is located at the intersection of the array transects (~135 km from the ice front) and is representative of RIS-interior floating stations. S-Ice and P-H2O in the RS04 panel highlight spectral peaks caused by reverberations of S-waves in the shelf ice and P-waves in the water column, respectively.
For this study, we will assume that the interior of the RIS is isotropic and steady-state; that is, we will ignore any potential effects associated with large-scale structural heterogeneities (e.g. crevasses, internal stress fields) or short-term variabilities in physical dimensions (e.g. calving, basal freezing and melting). We also limit our discussion to the interior stations of the RIS/DRIS array (i.e. excluding DR01–DR03), where we assume that the RIS uniformly behaves as a linear elastic plate floating on an isotropic water column. The unusual spectral properties arising from the nonlinear and other mechanics endemic to the ice front will be addressed in a future study. For this study, it should be noted that DR02 will often appear as a significant outlier as a result of these edge effects.
For comparative purposes, we will generally use RS04 as a proxy for all floating stations as it is located at the intersection of the array transects and displays spectral characteristics similar to most other floating stations (Fig. S27). RS08 on Roosevelt Island similarly exemplifies the grounded ice stations of the RIS array (Fig. S31). Other stations will be presented as necessary to highlight features of interest.
5. Results and discussion
Figure 4 presents the differential PSDs for a subset of stations chosen to highlight spectral details that will be of importance to this discussion. Table S1 in the Supplemental Material provides a summary of the elastic- and gravity-driven flexural modes found on a floating ice platform, and Fig. S3 illustrates the most relevant of these wavemodes. Other Supplemental Materials include three-channel PSD-PDFs and differential PSDs for all RIS stations, as well as equivalent plots for regional land-sited stations VNDA and QSPA for comparison (Figs S8–S43). Tables S2 and S3 tally the number of days per year that each station recorded mean spectral band powers above or below the global New High and Low Noise Models.
5.1 Long to very long period band (>20 s)
Long to very long period signals observed with floating seismometers have previously been extensively studied for the RIS array (Bromirski and others, Reference Bromirski2017; Chen and others, Reference Chen2018) and for semi-detached and free floating-icebergs (MacAyeal and others, Reference MacAyeal2006; Cathles and others, Reference Cathles, Okal and MacAyeal2009). Our own measurements of spatial and temporal distributions in this band are consistent with these sources and are included in the Supplemental Material for completeness (Figs S4, S5). We otherwise direct the reader to these detailed studies.
5.2 Primary band (10.0–20.0 s)
All floating and grounded stations recorded higher three-channel Primary power during the summer months (e.g. Fig. 5a). The temporal and spatial characteristics of this high-power state, however, vary substantially between grounded and floating stations.
(a) Daily average primary band powers for vertical (HHZ), north (HHN) and east (HHE) seismometer channels, compared to median open water concentrations for the entire mapped region (SEA), the mean open water concentration for the red-bounded region-of-interest (ROI) and the mean daily wind speed measured at Franklin Island (WTL). Wind velocity has been normalized to 20 m s−1. Primary band powers and wind velocity were smoothed with a ±5 day moving average; open water concentrations were not smoothed. The vertical yellow band marks the 10 January to 21 January 2016 RIS melt event; the gray vertical bars mark wind events that correlate with elevated spectral band powers. Red and blue backgrounds indicate summer and winter months, respectively. (b–d) Pearson's correlation coefficients for daily mean primary band north component power and daily open water concentration at each cell. Both time series were smoothed with a ±1 day moving average before correlation. Spatial distributions for vertical and east channels are similar. The red ROI overlaps a near-central portion of the Ross Gyre.
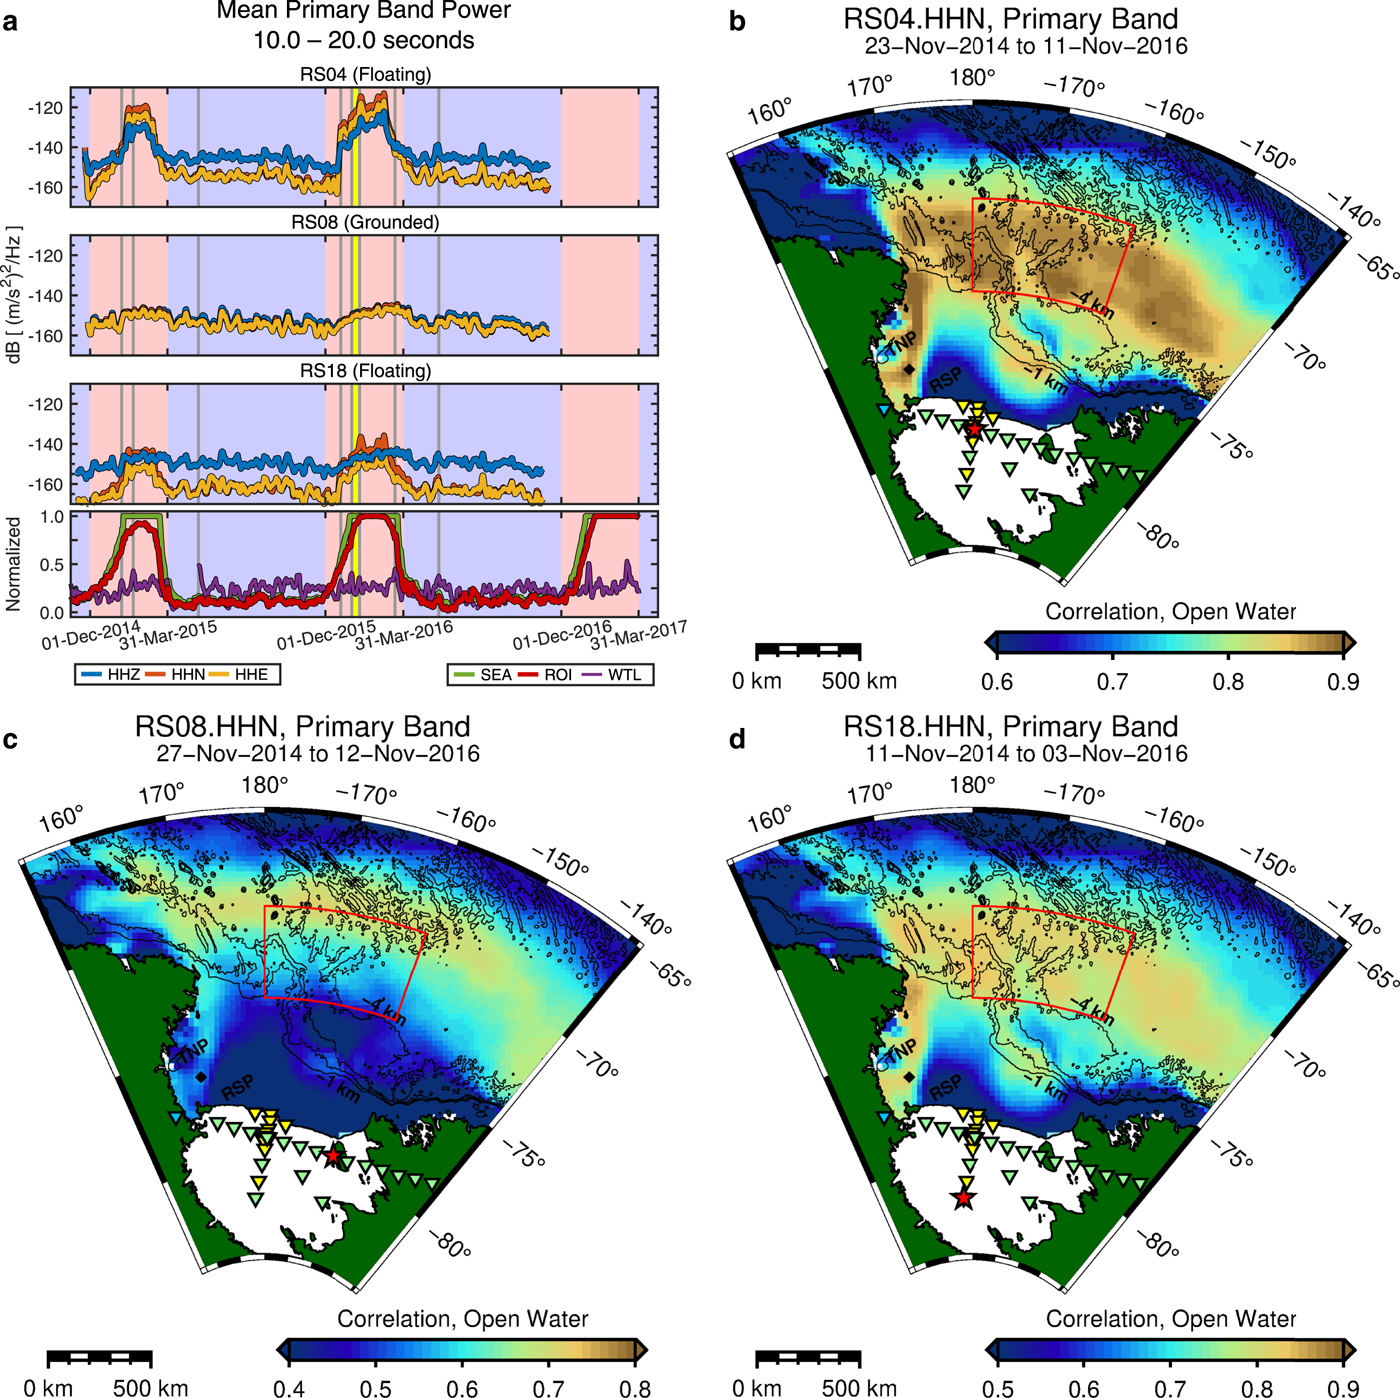
Grounded stations at Roosevelt Island and in Marie Byrd Land throughout the study period observed Primary band powers that were similar in amplitude, component distribution (i.e. HOV = 0 dB), and rates of change. For both summers, onset of the high-power state began when median open water concentration for the entire Ross Sea exceeded ~50% (Fig. 5a; SEA). A maximum of ~10 dB above winter background levels was reached and maintained coincident with a 100% open sea state. Notably, the high-power state persisted into early winter, unabated by the return of sea ice until open water concentrations had dropped to ~25%, at which time Primary band power returned to winter levels; this suggests that early-season thin sea ice does not substantially attenuate the ocean swell responsible for the primary microseism wavefield. For grounded stations, the Primary band high-power state was in effect for 5 January 2015 through 7 April 2015 and again for 21 December 2015 through 15 April 2016.
Floating ice shelf stations recorded Primary band powers with generally similar temporal variations, but with spatially-varying amplitudes and HOV distributions. For both summers, the high-power state was observed only while median open water concentrations were above ~50%. During the 2014–2015 summer, Primary band power at all floating stations reached a plateau coincident with a 100% open sea state. In contrast, the 2015–2016 summer continued to trend upward during 100% open waters and experienced several high-power excursions in the months following an unusual El Niño-linked RIS melt event from 10 to 21 January 2016 (Nicolas and others, Reference Nicolas2017; Chaput and others, Reference Chaput2018). The available data are insufficient to determine if the behavior of the Primary band during either of these summers could be classified as ‘normal’ for previous or successive summers. The high-power state was in effect from 5 January 2015 through 23 March 2015 and again from 21 December 2015 through 10 April 2016. We note that these dates are poorly aligned with our nominal ‘summer’ start and end dates; this phase delay causes a ~5 dB discrepancy between the calculated summertime median PSD and the high-probability, high-power path evident on the floating station PSD-PDFs (e.g. Fig. 3; RS04, box A).
Winter Primary band powers at all stations were generally highest in April and May and gradually trended to a minimum in November as sea ice continued to thicken throughout the winter and increasingly attenuated the ocean swell activity responsible for primary microseism generation.
Temporospatial correlations for grounded and floating stations (Figs 5b–d) indicate that Primary band power was strongly reduced (correlations >0.85) by high sea ice density beyond the continental shelf break (north of 72° S). This portion of the Ross Sea is dominated by the Ross Gyre, a cyclonic ocean current responsible for thermal and salinity exchange between the circumpolar deep water and the Ross Embayment. Accelerated melting of the West Antarctic Ice Sheet – due to contact with the warm circumpolar deep water – has resulted in significant freshening of the Ross Gyre over recent decades (Jacobs and others, Reference Jacobs, Giulivi and Mele2002). This decreased salinity likely explains the longevity of summertime sea ice within the Ross Gyre region (Figs 2, 5a; ROI). We therefore attribute the high correlation between Primary band power reduction and the freshening Ross Gyre to the modulation of ocean swell by melt-resistant sea ice.
High temporospatial correlations between Primary band power reduction and sea ice concentration are also evident in the western Ross Sea along the coast of Victoria Land. This feature is most prominent on floating-station north-channel correlations and is strikingly similar to the underlying bathymetric highs (e.g. the Mawson and Crary Banks, Fig. S2). It is unclear at this time if this region is (a) spuriously correlated with the causative regions associated with the Ross Gyre; (b) actively influences the Primary band through modulation of the sea ice or (c) if the relatively shallow depths (~400 m below sea level for the Mawson Bank, versus ~650 m for the adjacent Drygalski Trough) directly enhance Primary band powers, e.g. through the focusing or refracting of ocean swell. Notably, open water concentrations above the much larger Pennell Bank exhibit much lower correlations (0.6-0.8) with high Primary power, suggesting that the dynamics of sea ice melt are the controlling factors, rather than coupling between ocean swell and the sea floor.
Wind velocities recorded at Franklin Island (Fig. 5a, WTL) were inconsistently associated with Primary band power; that is, peaks in wind velocity were not always coincident with peaks in Primary band power, and vice versa. This is to be expected, as ocean swells are commonly driven by distant storm centers and are thus only weakly affected by local wind (Kibblewhite and Ewans, Reference Kibblewhite and Ewans1985; Apel, Reference Apel1987). Therefore, coherencies between Primary band power and wind velocity at WTL are likely indicative of the arrivals of swell-generating ocean storms.
Spatial variations in primary band power across the West-East and North-South transects are shown in Fig. 6. As previously mentioned, grounded stations generally observed a ~5 dB increase in Primary band power across all channels during summer. This appears to be independent of distance from the Ross Sea – to the extent of the available data – with similar increases observed at, for example, VNDA (~47 km), RS08 (~110 km) and QSPA (~1300 km) (Fig. 4). Stations RS11, RS13 and RS14 display notable variations in HOV values (Fig. 6a), which is also observed at longer periods (e.g. Figs S4a, S5a). Long period, horizontal-dominant noise is often a hallmark of sensor tilt, which can result from thermal or barometric fluctuations, or other factors (e.g. Wilson and others, Reference Wilson2002; McNamara and Buland, Reference McNamara and Buland2004; Aderhold and others, Reference Aderhold2015; Anthony and others, Reference Anthony2015). A qualitative examination of PSD-PDFs for periods longer than 20 s suggests that RS09, RS11–RS14 and RS17 suffered from seasonally modulated sensor tilt, with symptoms worsening during the winter months (Figs S32, S34–S37, S40). Notably, this is the complete subset of stations deployed with vault-buried Trillium 120PAs, rather than the direct-buried Trillium 120PHs deployed for the rest of the array. The sensor tilt at RS13 and RS14 extends to periods below 20 s and thus contaminates measurements of environmental noise in the Primary band at these stations. In the absence of transient sensor artifacts (e.g. at stations RS08, RS09, RS12, RS17) grounded station signal within this band is consistent with previous observations of the primary microseism wavefield for Antarctic stations (Anthony and others, Reference Anthony2015).
Seasonal and geographic variations in average seismic acceleration power in the Primary band, for the indicated seasonal PSD-PDF medians. DR02.HHZ summertime mean power was −90 dB. The dashed gray lines indicate the mean Global Seismic Network high- and low-noise model limits for the same band. Ice and water thickness profiles are based on outdated BEDMAP2 data. The RIS ice front currently sits ~3 km north of DR02. Gray backgrounds indicate approximate areas of grounded ice.
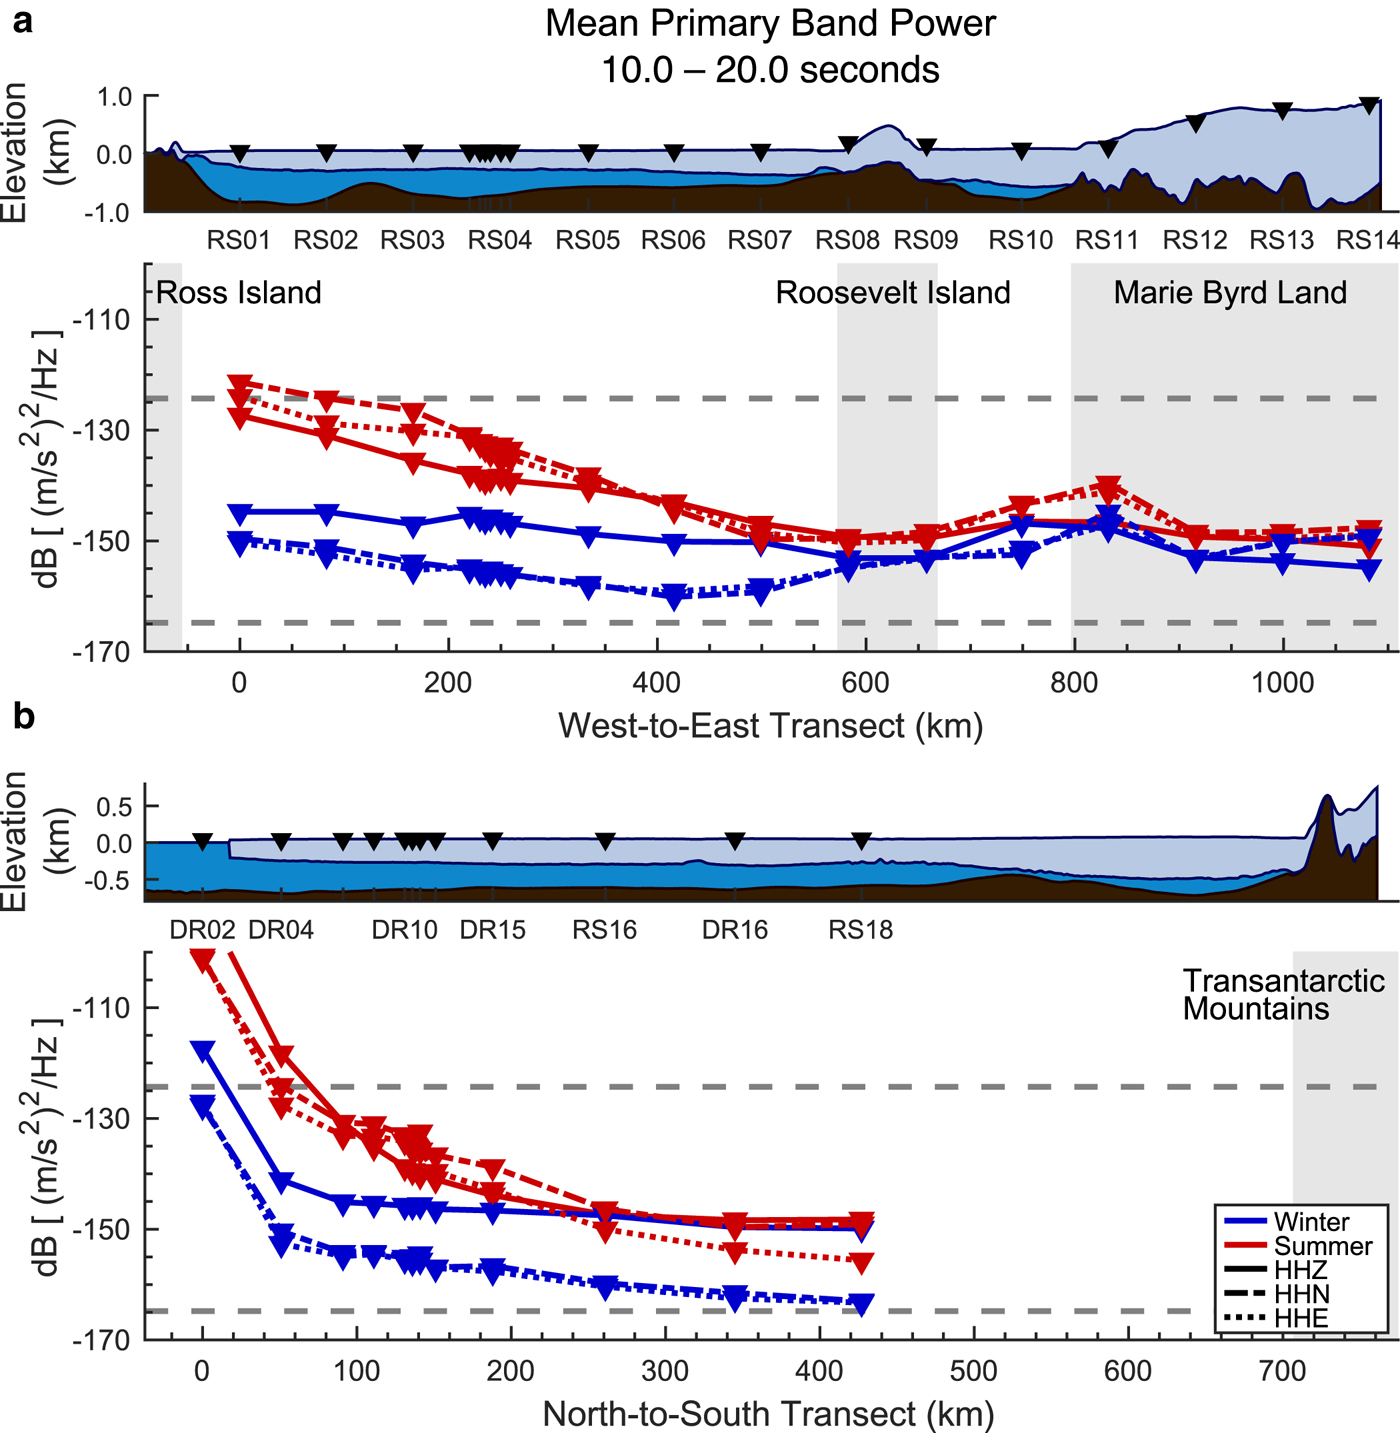
Floating stations showed more nuance in their spatial and seasonal variations relative to grounded stations, but were generally systemically consistent. Along the North-South transect (ice front perpendicular, Fig. 6b), Primary band power for both seasons and all three channels decreased nearly monotonically with distance from the ice front, with the greatest decreases observed within the first 100 km, between DR02 and DR05. During winter, three-channel Primary band power dropped by a remarkable 30 dB for DR02 through DR05; vertical power remained approximately consistent along the rest of the transect, while horizontal power continued to decrease at a rate of 0.03 dB km−1. Summer power levels for all components dropped by 42 dB (vertical) and 30 dB (horizontals) over the same initial 100 km; vertical power decayed to winter levels within 260 km (RS16), while the horizontals remained elevated by 14 dB (HHN) and 8 dB (HHE) over winter values at the transect terminus.
Notably, summer HOV values underwent two sign changes along the North-South transect, in contrast to winter HOV values which remained negative for the entire transect. These summer HOV sign changes indicate that signals recorded by the vertical (HHZ) and horizontal (HHN and HHE) channels have independent rates of change and are therefore the result of different excitation processes. Winter HOV values also decrease with distance from the ice front (i.e. horizontal power decreases more quickly than vertical power), again indicating that vertical and horizontal motions are decoupled during the winter.
Interpretation of Primary band energy
A qualitative analysis of these HOV distributions, in conjunction with a knowledge of the ocean-forced wave modes endemic to a floating ice platform (e.g. Table S1, Fig. S3), provides a consistent hypothesis for the composition of the Primary band ambient wavefield.
The vertical channel recorded flexural-gravity waves (i.e. buoyancy-coupled asymmetric mode (A0) Lamb waves, Fig. S3a) that are induced through a combination of two mechanisms: wind-driven ocean waves penetrating into the water column beneath the ice shelf (Chen and others, Reference Chen2018); and primary microseism Rayleigh waves which propagate in the crust and displace the water column via seismic-to-acoustic-gravity wave coupling (Yamamoto, Reference Yamamoto1982; Okal and MacAyeal, Reference Okal and MacAyeal2006). During open-water months, ocean-excited flexural-gravity waves are responsible for most of the vertical power at distances <100 km from the ice front (DR02–DR05); farther landward (i.e. RS16 and beyond), the RIS attenuates Primary band flexural-gravity waves, as evidenced by summer vertical power dropping to winter values. Consequentially, RS16 through RS18 were likely recording vertical motion generated solely by the aforementioned crustal Rayleigh waves; this is substantiated by the similarities between the summer vertical channel (HHZ) powers observed at RS08 (grounded) and RS18 (floating) on Fig. 5a. That these stations, and RS10, lack the +5 dB summertime differential observed at grounded stations may indicate that the Rayleigh-to-flexural-gravity wave conversion is inefficient. By this interpretation, the intermediate stations (i.e. between DR05 and RS16) observed a transitional wavefield resulting from both processes.
North channel power during summer recorded fundamental, symmetric mode (S0) Lamb waves (Fig. S3b) generated by the transfer of energy from ocean waves against the RIS front. This is consistent with Fig. 6b in that, beyond DR02, the north (HHN) channel recorded a greater increase in summer Primary band power than the east (HHE) channel, relative to winter levels. The positive HOV (beyond 100 km landward, where flexural-gravity amplitudes are sufficiently attenuated) and northward-polarized oscillations are consistent with S0 Lamb waves originating at the ice front. Consistent with this interpretation, Chen and others (Reference Chen2018) have previously derived and beamformed the generation of coherent S0 Lamb waves from discrete ocean swell events which arrived, on average, for 20 days out of each month during the summer. Our observations show that daily mean power within the Primary band remains elevated throughout the summer, with the only deviations of note being high-power spikes that presumably correspond to specific storm swells (e.g. Fig. 5a; RS18, HHN, HHE). We thus suggest that the summer ambient wavefield of the RIS includes a persistent (and likely incoherent) S0 Lamb wave component, independent of ocean storm conditions.
East component power during summer is consistent with a combination of scattered S0 Lamb waves (from their general N-S propagation direction) and shear-horizontal plate waves of converted-wave or other origin. Scattering is also inferred from the homogenization of north and east powers near the Roosevelt Island grounding zones (Fig. 6a), though this could also be influenced by the thinning water layer. Shear-horizontal waves are suggested from the apparent deviation in spectral content between the north and east channels. For example, the non-parallel track of traces 5 and 6 within box A for station RS18 in Figure 4 indicates that waves recorded on the north versus east channels have different dispersion relationships; if power measured on the east component were due entirely to the scattering of S0 Lamb waves, the east HOV curve (trace 6) would be expected to be lower than, but still parallel to, that of the north HOV (trace 5). Admittedly, this hypothesis is based on rather tenuous evidence and would require a more in-depth evaluation for substantiation.
Along the West-East transect (ice front parallel, ~130 km landward; Fig. 6a), three-channel powers during both seasons generally decrease with increasing ice thicknesses. For an elastic plate such as an ice shelf, the flexural rigidity is directly proportional to the cube of the plate thickness (e.g. Sergienko, Reference Sergienko2017), consistent with the observation of weaker plate mode powers as ice thickness increases between RS01 (222 m) and RS07 (404 m). Additionally, because flexural-gravity waves are generated by the coupling of ocean gravity wave energy with the base of the RIS (Fig. S3a), and because ocean gravity wave energy decreases exponentially with depth, the vertical channel power associated with flexural gravity waves is further reduced with increasing ice thickness (Chen and others, Reference Chen2018). A rigorous mechanical treatment of how three-dimensional RIS geometry affects the propagation of plate modes is, however, beyond the scope of this study. Alternatively, these geographic power distributions may also (or instead) be caused by unidentified oceanographic processes that modulate the propagation of ocean swell within the Ross Sea.
5.3 Secondary band (5.0–10.0 s)
The summer high-power state recorded by the Secondary band was generally similar across the array and notably less extreme than the Primary band. Secondary band powers increased coincident with increasing open water concentrations in the Ross Sea (Fig. 7a; SEA), and continued to climb approximately linearly throughout the summer, even after the development of 100% open waters. Similarly, the high-power state decreased coincident with the development of minimal sea ice densities and continued to drop linearly throughout winter. For both years, Secondary band power generally increased between 1 December and 15 March, and decreased throughout the rest of the year.
Temporal variations and temporospatial correlations for the Secondary band. See Fig. 5 for details.
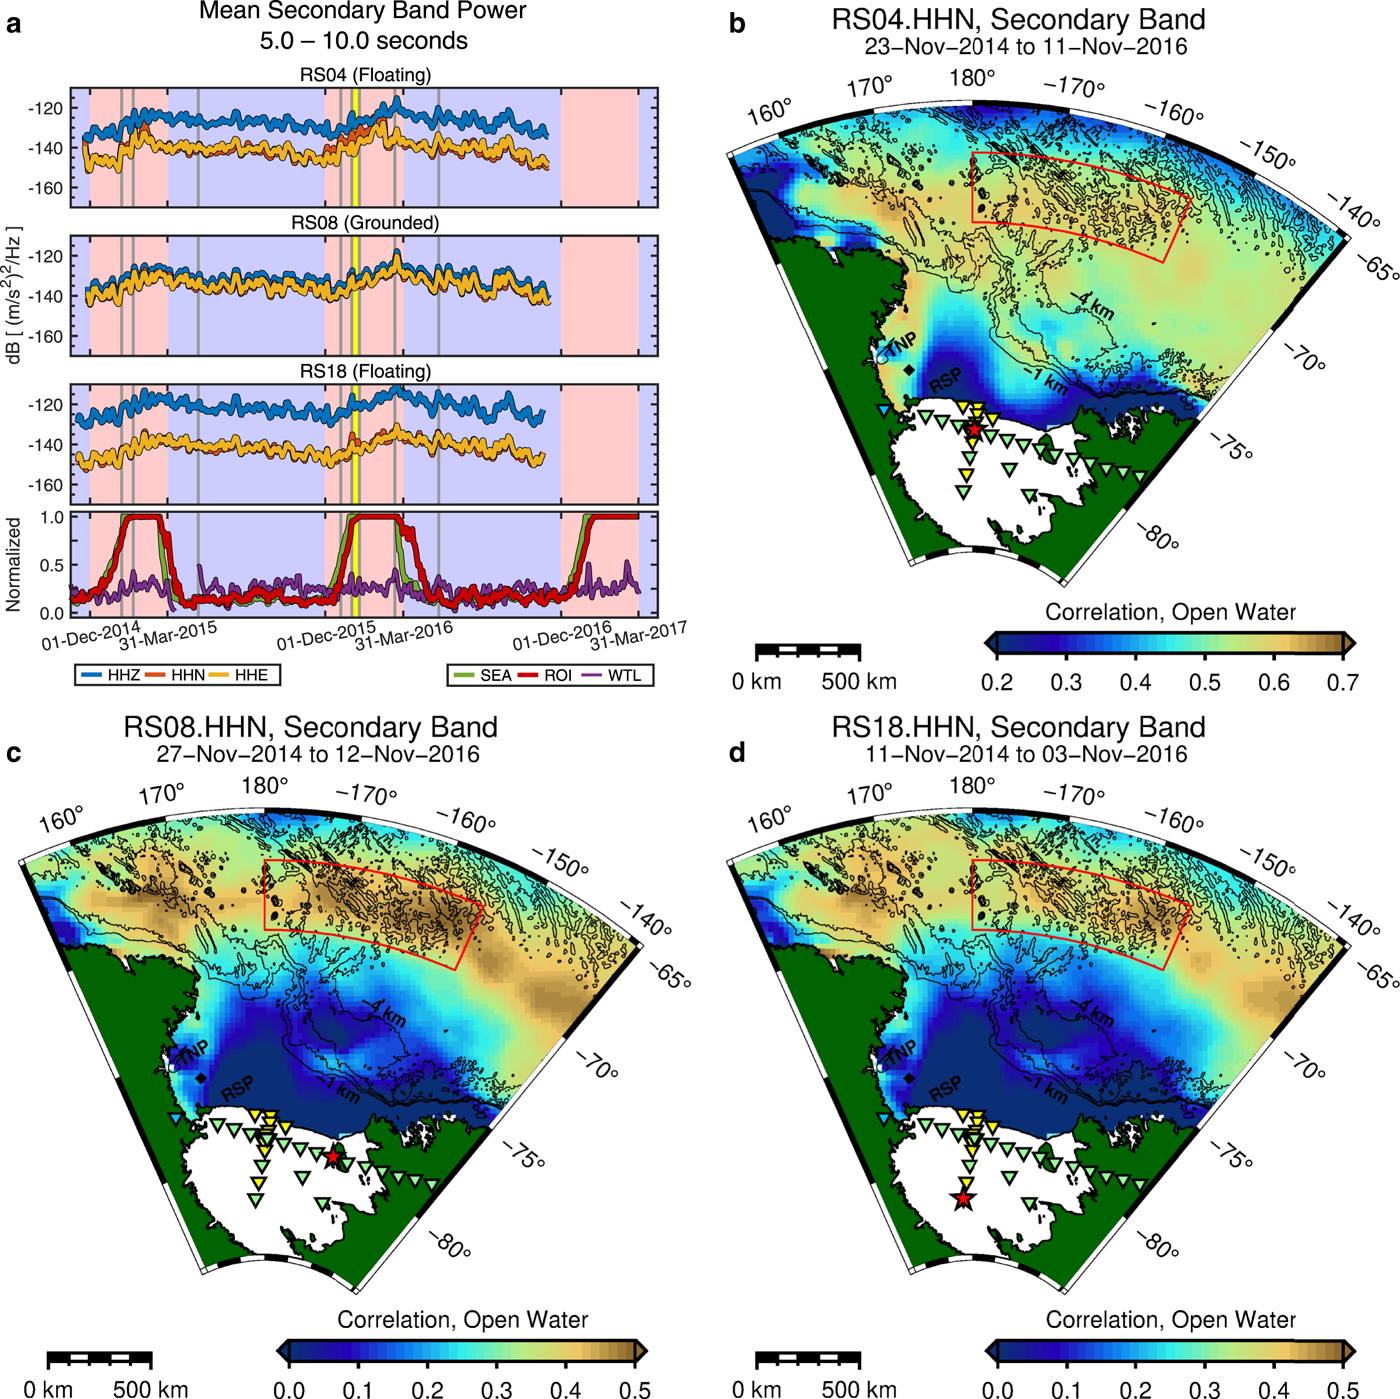
Temporospatial correlations for grounded and floating stations (Figs 7b–d) were similar to those for the Primary band, reflective of their common source mechanism: i.e. ocean storm-generated swell that enters the Ross Sea and shoals on the continental seafloor (primary microseisms) or rebounds from the coasts and – possibly – the ice front of the RIS (secondary microseisms).
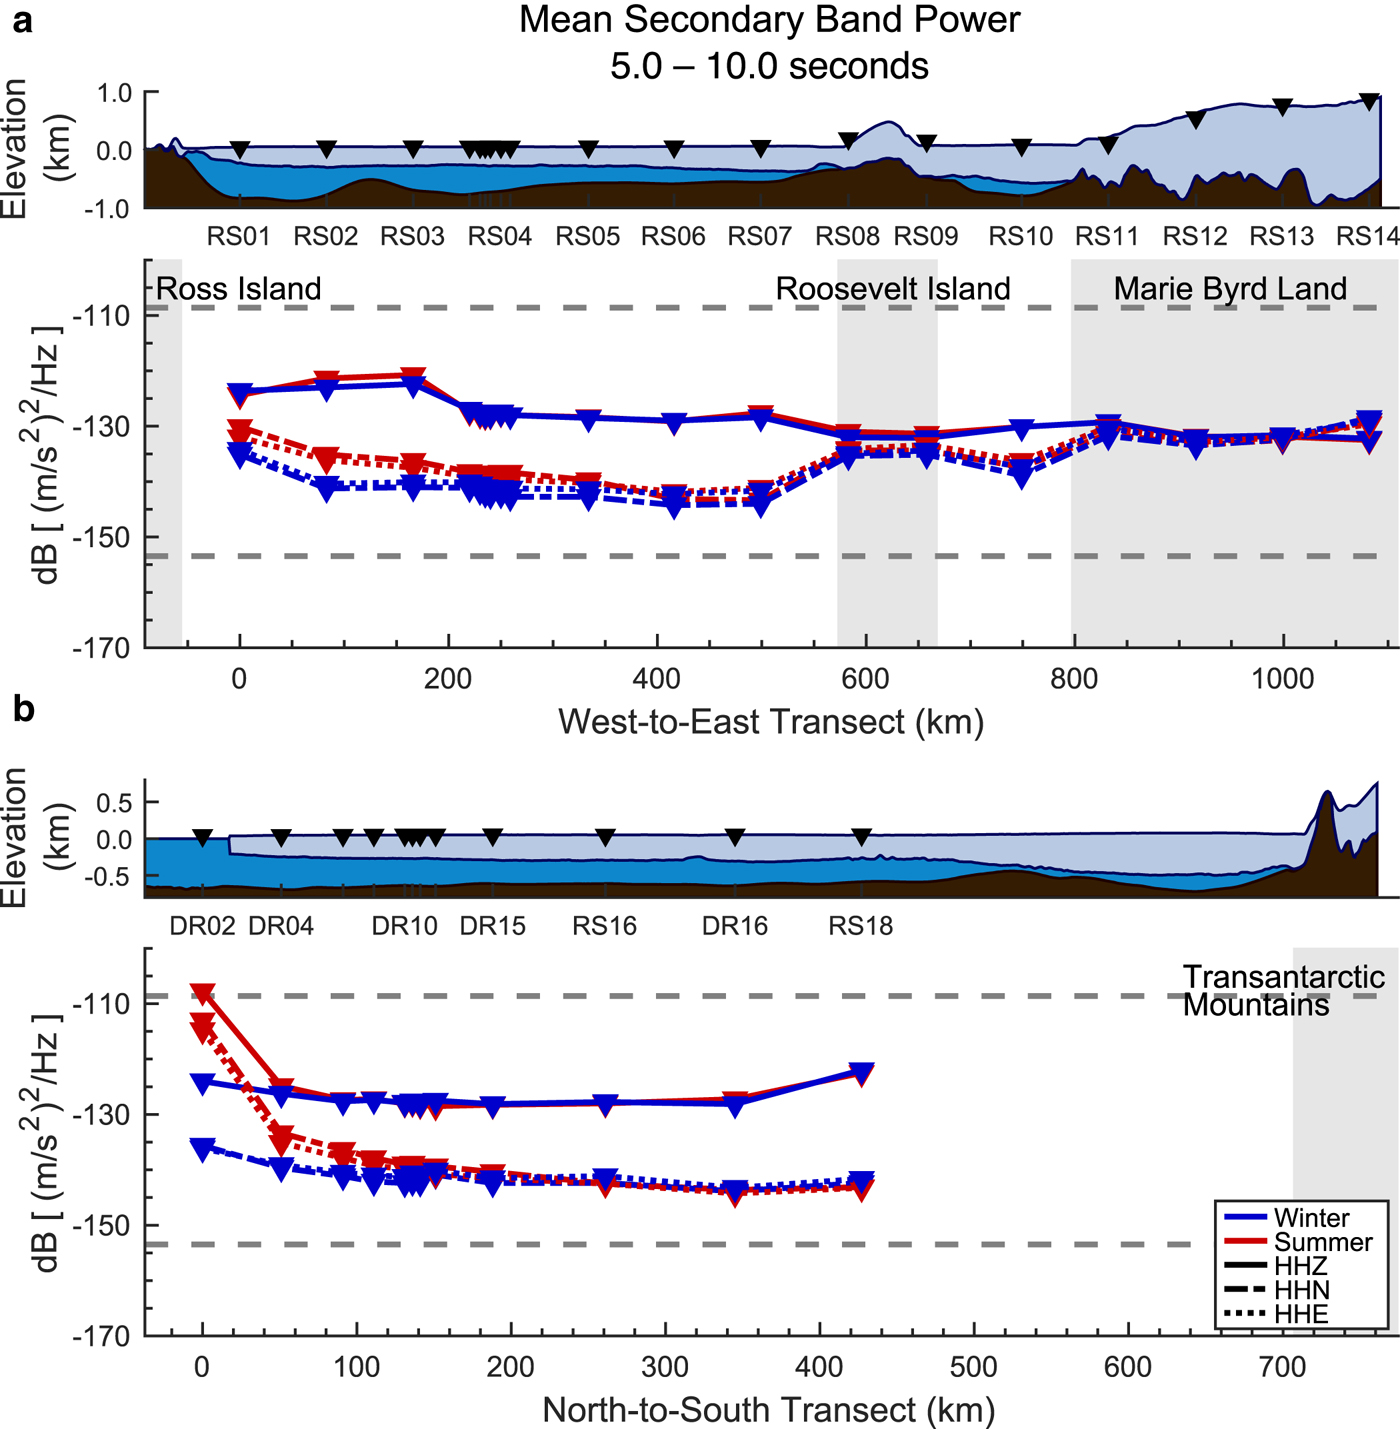
Variations in the observed Secondary band power for the West-East and North-South transects are shown in Fig. 8. Mean powers were generally equivalent for winter and summer due to the strongly linear seasonal trends (Fig. 7a). Exceptions to this are stations RS01–RS05 and DR04–DR10, which recorded higher horizontal powers during summer (Fig. 8). HOV values at grounded stations were slightly negative (> −5 dB), reflective of the crustal secondary microseism Rayleigh wavefield that is expected to dominate this band. Floating station HOV values were strongly negative (> −15 dB) and dependent on ice thickness and distance from the ice front.
Seasonal and geographic variations of the Secondary band mean acceleration power. DR02 may be observing nonlinear mechanical excitation of the RIS ice front; these edge effects are beyond the scope of this study. See Fig. 6 for details.
Interpretation of Secondary band energy
Based on these observations, we suggest that the composition of the Secondary band wavefield is mechanically similar to the Primary band wavefield, but is more strongly attenuated by distance from the ice front and ice thickness (i.e. compare Figs 6b, 8b).
The vertical component of the RIS wavefield is dominated by strong flexural-gravity modes (Fig. S3a) near the ice front, but transitions to a secondary microseism crustal Rayleigh wave regime at landward distances greater than 50 km (Fig. 8b). At this time, we have not evaluated the physical dependencies of this regime transition for this period band.
The horizontal wavefield has a significant S0 Lamb wave component (Fig. S3b) that is attenuated by some combination of distance from the ice front and ice thickness (Figs 8a and b, respectively); we do not at this time propose an exact mechanical description of this dependency. As noted in the discussion for the Primary band, the relatively thinner ice below the western RIS results in a lower flexural rigidity, which in turn allows for the excitation of shorter period S0 Lamb waves (Viktorov, Reference Viktorov1967) in response to the impact of shorter period ocean gravity waves at the RIS ice front. A comparison of the differential PSDs for the horizontal channels at, for example, RS01 and RS04 illustrates this ‘spectral leakage’ of the Primary band into the Secondary period range (Figs. S24, S27; traces 2 and 3). This is also evident in the daily Secondary band powers at, for example, RS04 (Fig. 7a), for which the horizontal channels recorded a dramatic, late-summer decrease coincident with a similar power drop in the Primary band (Fig. 5a). In the absence of S0 Lamb wave energy, the horizontal channels at floating stations also appear to record secondary microseism Rayleigh energy, as inferred from the similarities between the daily power plots at, for example, RS08 and RS18 during summer (Fig. 7a).
5.4 Tertiary band (0.4–4.0 s)
Summer excitation of the Tertiary band was strongly observed at all floating stations on the RIS (e.g. Fig. 9a). The Tertiary band is also well-observed at grounded stations in adjacent provinces: for example, at VNDA, located in the Dry Valleys of Victoria Land, 122 km west of Ross Island (see also, Fig. 4), and at RS14, located ~300 km east of the RIS in Marie Byrd Land (Fig. S37). The temporal behavior of the high-power state was generally similar for floating and grounded stations, with onset, termination and time spent at peak being generally correlated with open water concentrations for a region of the Ross Sea directly north of the eastern RIS (Figs 9a–c). The 10–21 January 2016 melt event (Nicolas and others, Reference Nicolas2017; Chaput and others, Reference Chaput2018) contemporaneously depressed Tertiary band power at all study locations but otherwise did not strongly influence season-long trends for 2015–2016. For both years and at all stations, this high-power state was generally active between 1 December and 31 March.
Temporal variations and temporospatial correlations for the Tertiary band. See Fig. 5 for details. (a) White vertical line marks the 16 September 2015 Mw 8.3 Illapel, Chile earthquake. (b–d) The red-bounded region-of-interest encompasses the Hayes and Houtz Banks (Fig. S2).
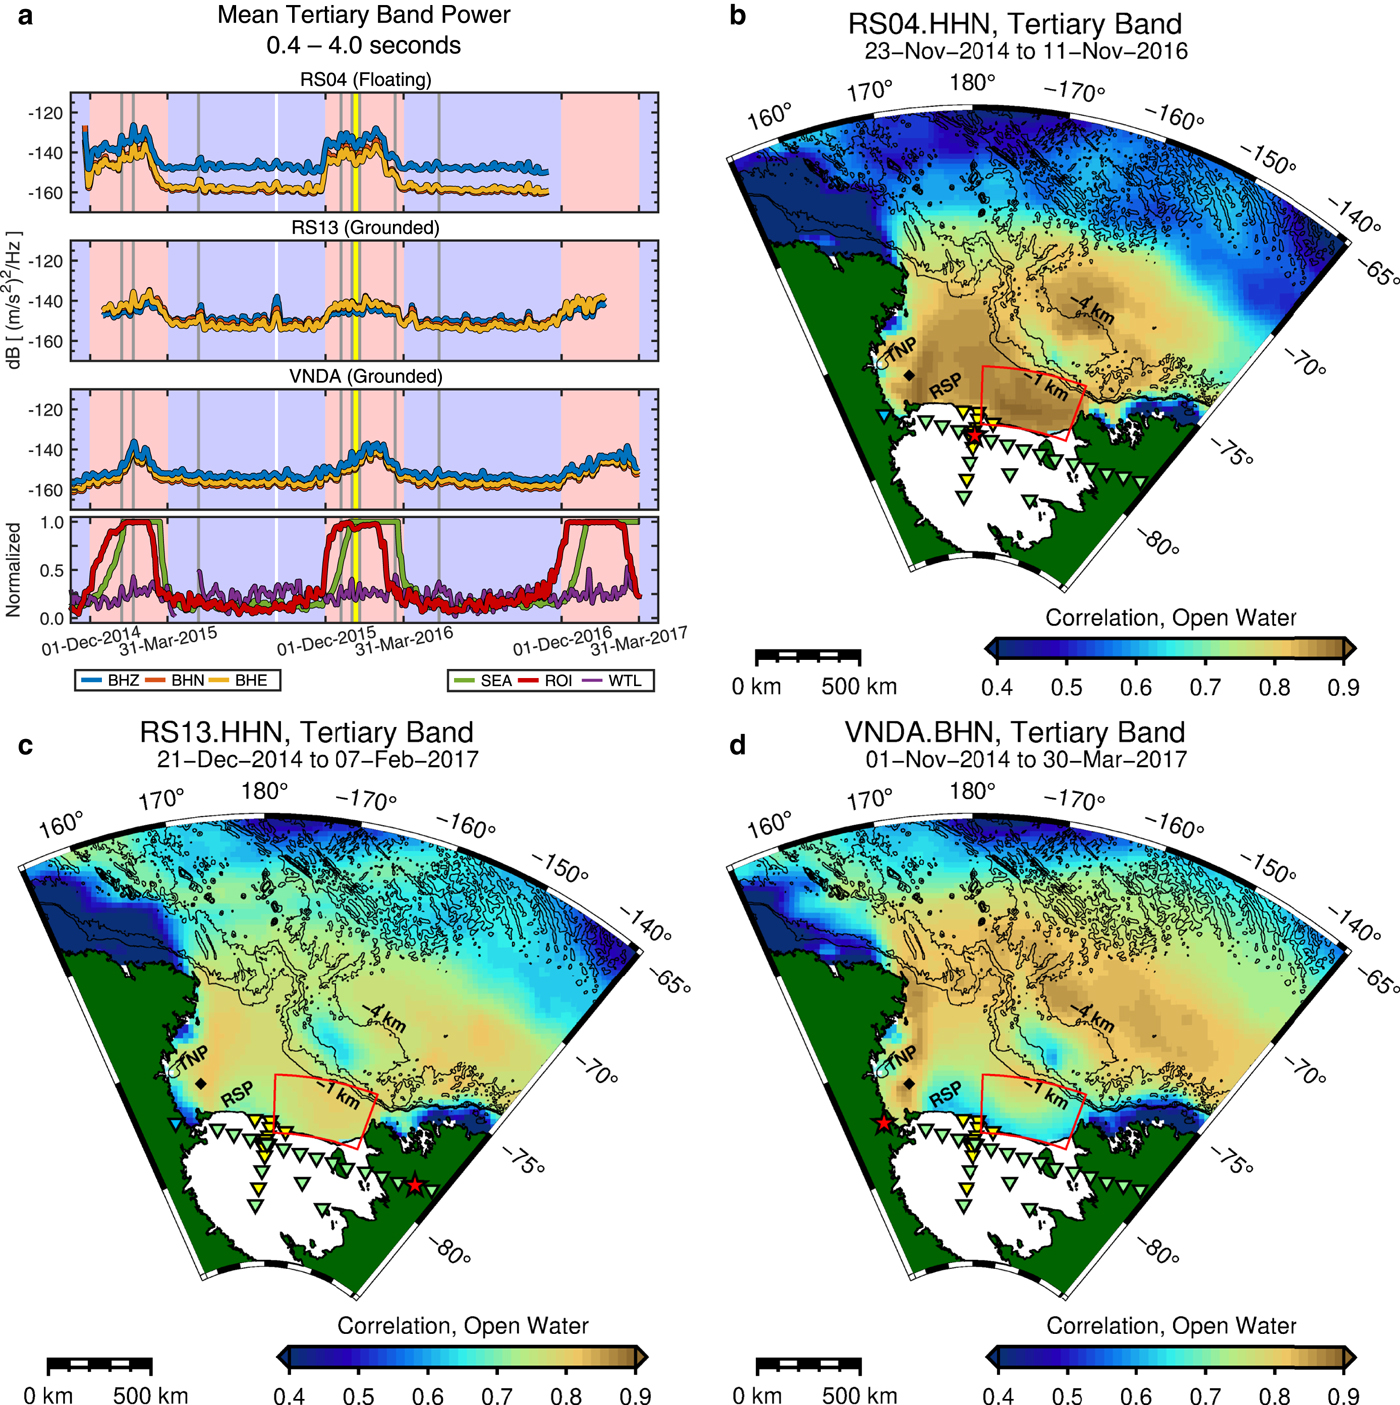
Temporospatial correlations at all stations suggest that the Tertiary band is sensitive to bathymetric features (Figs 9b–d, S2). Correlations were highest (>0.8) for open waters above the continental shelf break (with depths <1000 m). In particular, the region-of-interest outlined in the eastern Ross Sea (Figs 9a–c) overlies the Hayes and Houtz Banks, which range from ~400 to ~500 m below sea level, compared to the ~600 m for the adjacent basins (Fig. S2). High correlations in the western Ross Sea also display features reminiscent of the underlying Crary, Mawson and Pennell banks and the intervening troughs. The area corresponding to the Ross Sea Polynya (RSP) is surprisingly well-defined by relatively lower correlations. A high-correlation zone in the northeast Ross Sea – above the apparent continental rise at a depth of 4000 m below sea level – is not associated with any geophysical feature or process that we can identify, though it is adjacent to a region of anomalously melt-resistant sea ice (Fig. 2). VNDA, installed in a solid-rock borehole in the ice-free McMurdo Dry Valleys, recorded qualitatively dissimilar temporospatial correlations to the RIS array; for example, RS01 was highly similar to RS04, despite an interstation distance of 250 km, versus a distance of only 200 km to VNDA (Figs S6, S7).
Spatial power trends across the RIS for the Tertiary band are presented in Fig. 10. Floating station HOV values were generally uniform for both horizontal channels, independent of distance from the ice front, water column thickness or ice thickness. Compared seasonally, HOV values were slightly lower in winter (−12 dB) than summer (−10 dB), indicating a larger increase in horizontal channel power during the summer high-power state. Along the West-East transect (Fig. 10a), the summer band power increase was ~12 dB for vertical channels and ~14 dB for horizontal channels for all floating stations except for RS10, which observed an 8 dB increase for the vertical channel. For the North-South transect (Fig. 10b), the summer high-power state again decreased monotonically with distance from the ice front.
Seasonal and geographic variations of the Tertiary band mean acceleration power. See Fig. 6 for details.
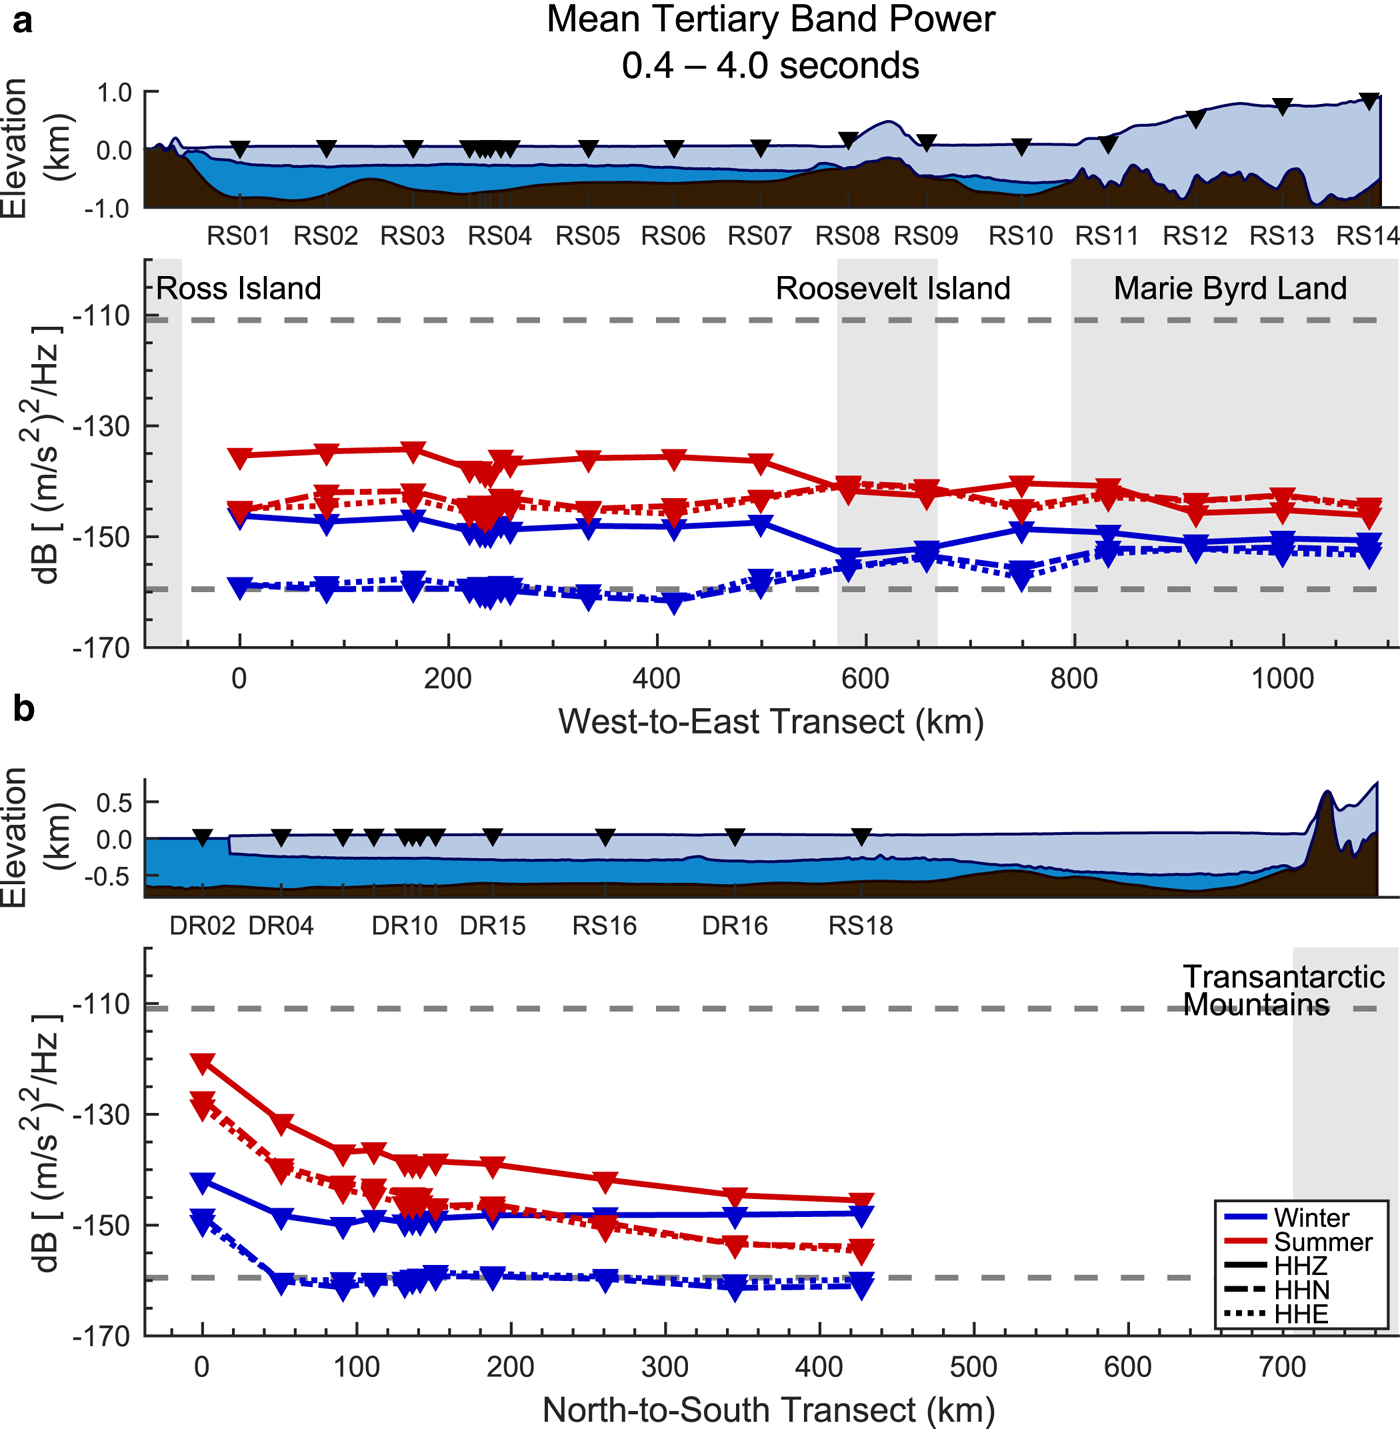
Grounded stations near the ice shelf margins (Fig. 10a; RS08, RS09, RS11) recorded a summertime vertical channel increase of 10 dB, compared to <6 dB for interior stations (RS12–RS14). As with the floating stations, all grounded stations observed a comparatively larger increase in horizontal powers during the summer, with HOV values increasing from −2 dB (winter) to +2 dB (summer). VNDA was again an outlier, with slightly negative HOV values all year (Fig. 4; traces 5, 6, 8, 9and Fig. 9a).
Interpretation of Tertiary band energy
The spectral peak for the summer high-power state was at ~1.2 s for both grounded and floating stations (Fig. 4; traces 1–3). At floating stations, local maxima were observed at periods consistent with P- and S-wave reverberations within the water and ice layers, respectively (Press and Ewing, Reference Press and Ewing1951; Crary, Reference Crary1954) (e.g. Fig. 4; RS04, Fig. S3c), but only during the summer (e.g. Fig. S27), indicating a strong excitation of ice and water layer reverberations by the high-power state wavefield. Other spectral features within this band may relate to flexural mode resonances between the RIS and the seafloor (e.g. Chen and others, Reference Chen2018) or to the long-period compressibility limit for a thin, hydrostatic water column (Yamamoto, Reference Yamamoto1982; Ardhuin and Herbers, Reference Ardhuin and Herbers2013).
High wind speeds measured at Franklin Island (Fig. 9a; WTL) were inconsistently associated with spikes in summer Tertiary band power, as was also observed for the Primary band (Fig. 5a; WTL). Prior studies of smaller waterbodies have found evidence for a causal relationship between local wind velocities and wave heights and Tertiary band power (e.g. Kibblewhite and Ewans, Reference Kibblewhite and Ewans1985; Xu and others, Reference Xu, Koper and Burlacu2017; Anthony and others, Reference Anthony, Ringler and Wilson2018). These studies had access to more spatially comprehensive data for wind velocities and wave heights; similar data are unfortunately not available for the Ross Sea for the deployment period of the RIS array. Nonetheless, we do observe a suggestive link between Tertiary band power and wind speeds (e.g. coincident peaks observed at RS04 and RS13 during the 2014–2015 summer, Fig. 9a) to motivate future investigations.
The scope of our current analysis cannot positively identify the source mechanism or propagation modes for the summer high-power state. We do, however, make two key qualitative interpretations: (1) the excitation source is to the north of the RIS, either immediately at the ice front or in the continental shelf waters of the Ross Sea, and is longitudinally homogenous when averaged over the entire summer. These points are evident from, respectively, the landward decay of Tertiary band power along the North-South transect (Fig. 10b), and the lack of azimuthal polarization on the horizontal channels (Fig. 10a). (2) The summer high-power state is clearly recording an open water process, rather than fractional sea ice processes such as thermal or mechanical fracturing or inter-ice collisions. If the latter were responsible, we would expect a dramatic decrease in daily Tertiary band power as sea ice concentrations approached zero. Instead we find that Tertiary band power was at a maximum during prolonged periods of 100% open water concentrations (Fig. 9a). Furthermore, fractional ice processes are typically observed in the 0.1–0.2 s (5–10 Hz) band (MacAyeal and others, Reference MacAyeal, Scambos, Hulbe and Fahnestock2003; Talandier and others, Reference Talandier, Hyvernaud, Reymond and Okal2006; Dziak and others, Reference Dziak2015) and would therefore be expected to contribute only minimal energy to the 0.4–4.0 s Tertiary band.
6. Conclusions
We characterize the seasonal and spatial trends of the 0.4–20 s seismic wavefield observed on the RIS and at nearby terrestrial seismic stations. We show that the ambient spectral power recorded across this period band is very strongly modulated by the annual growth and breakup of sea ice in the adjacent Ross Sea, and quantify this variability on a seasonal time scale. Coupling between the RIS and oceanic processes during the sea ice-free summer months results in the excitation of a persistent, multimode wavefield that may increase ambient seismic noise by up to 30 dB above wintertime background levels, dependent on local RIS geometry and distance from the ice front.
In the 10–20 s Primary band, we used spatial and temporal changes in HOV ratios to infer that ocean gravity waves in this period range excite multiple vibrational modes within the RIS and that the vertical and horizontal wavefields are the results of separate processes. Within 100 km of the ice front, summer power is predominantly vertical, consistent with flexural-gravity waves (i.e. buoyancy-coupled asymmetric Lamb waves); this wavefield attenuates rapidly (0.42 dB km−1) with landward distance due to an unknown combination of intrinsic and scattering attenuations. Farther landward, vertical power is attributed to incompressible displacement of the sub-shelf water column by primary microseism crustal Rayleigh waves traveling along the sub-shelf seafloor. This primary microseism-induced signal is minor in comparison to the flexural-gravity modes and can only be easily observed once the latter has decayed to the winter (i.e. sea ice-attenuated) background levels; our stations observe this to occur beyond 260 km from the ice front. Beyond 100 km from the ice front, north and east HOV values are strongly and persistently positive throughout the summer. This horizontal ambient wavefield is polarized to the north, consistent with symmetric mode Lamb waves generated at the ice front. East HOV values suggest some scattering of symmetric Lamb waves from grounding zones and the possible generation of shear-horizontal plate modes. Onset and termination of the high-power state within this band are strongly correlated with open water concentrations in the low-salinity Ross Gyre, suggesting that melt-resistant sea ice in this region is a particularly strong modulator of ocean swell in the Ross Sea.
In the 5–10 s Secondary band, spatial and seasonal variations in spectral power indicate a summer wavefield similar in composition to the Primary band. Flexural-gravity waves again dominate near the ice front but attenuate (0.35 dB km−1) to shelf-interior background levels within 50 km. S0 Lamb waves are evident at stations within 150 km of the ice front and are additionally attenuated in regions of increased ice thicknesses. We conclude that these flexural-gravity waves and S0 Lamb waves are merely a short-period extension of the same excitation processes identified in the Primary band. In the absence of these plate wave modes, floating stations indicate three-dimensional elastic coupling between the RIS and secondary microseism Rayleigh waves propagating in the sub-shelf crust. In comparison to nearby grounded stations, vertical channel power at floating stations is actually elevated by +5 dB, while horizontal channel powers are depressed by −10 dB.
In the 0.4–4.0 s Tertiary band, we make initial observations of a seasonal ambient signal that is strongly observed across the RIS and up to 250 km to the east in Marie Byrd Land. At all floating stations, summer power in this band is predominantly vertical (HOV< −10 dB), azimuthally symmetric (horizontal channel powers are equivalent), and decreases monotonically with landward distance from the RIS ice front; these observations indicate that the signal source is broadly distributed along the RIS ice front or across the Ross Sea. Onset and termination of the high-power state within this band are anticorrelated with sea ice densities in the waters above the continental shelf, particularly above local bathymetric highs (<400 m below sea level). Peak power is reached and maintained only during periods of minimal sea ice, indicating that the source mechanism is an open sea process, possibly related to the same linear and nonlinear ocean wave interactions that generate the primary and secondary microseisms, respectively.
For all three bands, we find that wintertime ambient noise levels recorded on vertical channels at floating stations were generally less than 10 dB higher than those recorded at the nearby grounded stations. Wintertime ambient noise levels recorded on horizontal channels at floating stations, however, were as much as 10 dB lower than those recorded at the grounded stations, reflective of the isolation of floating stations from solid-Earth shear motions. Tertiary band powers for floating station horizontal channels, in particular, were equal to or less than the Global Seismic Network New Low Noise Model.
Supplementary Materials
The supplementary material for this article can be found at https://doi.org/10.1017/jog.2019.64
Acknowledgments
This research was supported by NSF grants PLR-1142518, 1141916, 1142126, 1246151 and 1246416. JC was additionally supported by Yates funds in the Colorado State University Department of Mathematics. PDB also received support from the California Department of Parks and Recreation, Division of Boating and Waterways under contract 11-106-107. We thank Reinhard Flick and Patrick Shore for their support during field work, Tom Bolmer in locating stations and preparing maps, and the US Antarctic Program for logistical support. The seismic instruments were provided by the Incorporated Research Institutions for Seismology (IRIS) through the PASSCAL Instrument Center at New Mexico Tech. Data collected are available through the IRIS Data Management Center under RIS and DRIS network code XH. The PSD-PDFs presented in this study were processed with the IRIS Noise Tool Kit (Bahavar and others, Reference Bahavar2013). The facilities of the IRIS Consortium are supported by the National Science Foundation under Cooperative Agreement EAR-1261681 and the DOE National Nuclear Security Administration. The authors appreciate the support of the University of Wisconsin-Madison Automatic Weather Station Program for the data set, data display and information; funded under NSF grant number ANT-1543305. The Ross Ice Shelf profiles were generated using the Antarctic Mapping Tools (Greene and others, Reference Greene, Gwyther and Blankenship2017). Regional maps were generated with the Generic Mapping Tools (Wessel and Smith, Reference Wessel and Smith1998). Topography and bathymetry data for all maps in this study were sourced from the National Geophysical Data Center ETOPO1 Global Relief Model (doi:10.7289/V5C8276M). We thank two anonymous reviewers for suggestions on the scope and organization of this paper.


 Open access

