
Estimating the value of ground water resources and the services they provide is critical to formulating policies meant to protect and improve water quality. One of the most crucial services provided by ground water is that it is an important source of drinking water. In the United States, ground water is the source for 77 percent of community water systems, and about 15 percent of the population rely on private wells for water (Environmental Protection Agency (EPA) 2012a, 2012b). Private wells are particularly susceptible to potential contamination because they are not regulated under the Safe Drinking Water Act and are not required to undergo regular monitoring and treatment to ensure water quality standards are met. Furthermore, households that rely on private wells tend to be in rural areas where local aquifers are potentially vulnerable to contamination from nearby agricultural activities.
Hedonic property value methods are useful for estimating welfare impacts from changes in ground water quality. Private wells and the quality of the water in the local aquifer are inherently linked to the housing bundle—the collection of characteristics that contribute to the value of the property—so a change in quality, at least as perceived by buyers and sellers in the market, should be capitalized in the price of a home. In theory, any impacts on property values reflect changes in the present value of the future stream of expected utility derived from the housing bundle. Given the number of household activities that depend on safe water, a contaminated well could have a direct impact on home prices.
Although there are multiple applications of the hedonic property value approach to surface water quality, there are very few rigorous hedonic studies of ground water quality. We attribute this gap in the literature largely to a lack of appropriate data and difficulties associated with linking measures of ground water quality to individual homes. The results of well tests typically are not publicly available so most prior studies of ground water have used distance or spatially aggregated measures as proxies for contamination. We use a unique, comprehensive data set of ground water contamination tests conducted by the Florida Department of Health (FDH). We use the data set to link residential property transactions to home-specific levels of contamination in private potable wells and conduct a hedonic analysis to examine how property values respond to ground water pollution in Lake County, Florida, where a large proportion of such pollution stems from pesticide and fertilizer run-off from orange groves and other agricultural activities.
To our knowledge, this is the first hedonic study to link data on water quality in private potable wells to individual homes and to have a data set rich enough to examine the relationship between the concentration of pollution in ground water and residential property values. Furthermore, this is the most rigorous hedonic study to date to examine the impact of agriculture-related ground water pollution on residential property values.
Using a data set of residential transactions from 1990 through 2013, we empirically examine four primary questions. First, are home values systematically lower in the presence of ground water pollution? Second, if so, how does the price differential vary over time? Third, does the price differential vary with the type of contaminant? Finally, do home prices vary with the magnitude of pollutant concentration?
Literature Review
Since Rosen (Reference Rosen1974) first established the underpinnings that connect hedonics to welfare analysis, there has been a flurry of hedonic studies of the relationship between property values and a variety of environmental amenities and disamenities.Footnote 1 Studies of the link between water quality and property prices date back to the 1960s (David Reference David1968), but water quality monitoring has only recently begun to be comprehensive enough to facilitate widespread analysis. Since 2000, federal, state, and local monitoring efforts have increased significantly and expanded the amount of available data.
Several earlier studies found a significant relationship between water quality and property values (Michael, Boyle, and Bouchard Reference Michael, Boyle and Bouchard2000, Poor et al. Reference Poor, Boyle, Taylor and Bouchard2001, Gibbs, Halstead, and Boyle Reference Gibbs, Halstead and Boyle2002). Many of the studies from that time used available data on water clarity in northeastern U.S. lakes. Recent studies have expanded the types of waterbodies analyzed (Artell Reference Artell2013, Netusil, Kincaid, and Chang Reference Netusil, Kincaid and Chang2014), the water quality parameters used (Bin and Czajkowski Reference Bin and Czajkowski2013, Walsh and Milon Reference Walsh and Milon2015), and the populations affected (Poor, Pessagno, and Paul Reference Poor, Pessagno and Paul2007, Walsh, Milon, and Scrogin Reference Walsh, Milon and Scrogin2011) but have focused almost exclusively on surface water. Surface waters provide numerous services to local residents, including aesthetics, recreation, and potable water. The results of hedonic studies of surface water quality can reflect improvements in any of the services provided.Footnote 2 Ground water, on the other hand, provides a much more limited set of services to local residents with the primary (and sometimes exclusive) service being a source of potable water.
The literature on the effects of ground water quality on residential property values consists of only a few rigorous studies.Footnote 3 Contamination of ground water is often difficult to detect, and its impacts on health are often negligible for individuals whose homes rely on public water supplies. In early studies, Malone and Barrows (Reference Malone and Barrows1990), Page and Rabinowitz (Reference Page and Rabinowitz1993), and Dotzour (Reference Dotzour1997) found no significant relationship between contaminated ground water and property prices. Those studies make valuable contributions, but their econometric identification strategies—simple case study comparisons, two-sample t-tests of mean prices, and limited regression analyses of cross-sectional data—are now fairly dated. In addition, the ground water data available at the time were relatively scant, leading to issues associated with small sample sizes and coarse measures of water quality.
More recently, Case et al. (Reference Case, Colwell, Leishman and Watkins2006) used a hybrid repeat-sales/hedonic technique and found an average decrease of 4.7 percent in prices for residential condominiums impacted by ground water contamination but only after knowledge of the contamination was public. Boyle et al. (Reference Boyle, Kuminoff, Zhang, Devanney and Bell2010) found a temporary but significant 0.5–1.0 percent decline in home values for each 0.01 milligrams per liter (mg/l) of arsenic above the regulatory standard at the time of 0.05 mg/l. Due to data constraints, both studies relied on spatially aggregated measures of contamination.
In contrast, Guignet (Reference Guignet2013) compiled a unique set of data on tests of private ground water wells and linked the tests to individual home sales. The water quality tests serve as a clear signal to households and provide a clean home-specific measure of the disamenity. Guignet found that simply testing a home's well for contamination reduced the value of the home by an average of 11 percent regardless of whether contamination was found. A somewhat-larger 13 percent depreciation was found when the tests revealed levels of contamination that exceeded the regulatory standard, but caution is warranted when interpreting this result because there were only ten such transactions.
The current study builds on past works by using a rich data set of well-contamination tests conducted and compiled by FDH for the state of Florida from the 1980s through 2013. These data allow us to link ground water contamination levels in private wells to individual homes and thus conduct a detailed investigation into how home prices vary with home-specific pollutant concentrations. To our knowledge, this is only the second hedonic study (the other is Malone and Barrows (Reference Malone and Barrows1990)) of how total nitrate and nitrite, along with other contaminants associated with surrounding agricultural activities, affects home values.
Background: Agriculture and Ground Water in Florida
Approximately 90 percent of Florida residents depend on ground water for drinking water (Southern Regional Water Project (SRWP) 2015). Florida is also particularly vulnerable to ground water contamination because the hydrology of the state is characterized by a high water table and thin layer of surface soil (SRWP 2015). Contributing to the risk are numerous point and nonpoint sources of pollution throughout the state, including a considerable threat posed by agriculture-related activities (SRWP 2015).
Florida is an important contributor to overall agricultural production in the United States and ranks among the top states in production of citrus crops and other fruits and vegetables (Florida Department of Agriculture and Consumer Services (FDACS) 2012). We analyze Lake County, which has a long history of citrus farming and other agricultural activities (FDACS 2012, Furman et al. Reference Furman, White, Cruz, Russell and Thomas1975). The county sits in the central region of the state, which produces the majority of Florida's citrus crops (FDACS 2012). In 2012, Lake County produced the tenth largest volume of citrus crops in Florida and ranked eleventh in terms of acres devoted to commercial citrus production (FDACS 2012). About 5% of the land area (32,207 acres) in Lake County is devoted to citrus groves and another 5% (30,956 acres) to row/field crops.Footnote 4 Although the county's soils are suitable for citrus groves, they do not offer enough nutrients to citrus crops without heavy fertilization and, as in surrounding counties, the soils are highly permeable and allow ground water to percolate quickly into the aquifer (Furman et al. Reference Furman, White, Cruz, Russell and Thomas1975).
According to the FDH's database of potable-well tests, the most common pollutants found in ground water in Lake County are total nitrate and nitrite (N + N), ethylene dibromide (EDB), and arsenic (see Figure 1), all linked to use of agricultural fertilizers, pesticides, herbicides, and/or soil fumigants (Chen et al. Reference Chen, Ma, Hoogeweg and Harris2001, Harrington, Maddox, and Hicks Reference Harrington, Maddox and Hicks2010, Solo-Gabriele et al. Reference Solo-Gabriele, Sakura-Lemessy, Townsend, Dubey and Jambeck2003, EPA 2014a, 2014b), as well as other sources.
Most Frequent Ground Water Contaminants Detected in Lake County, Florida
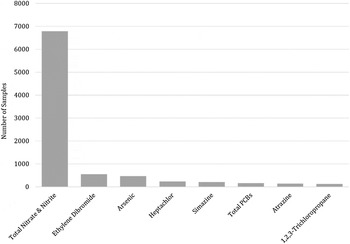
Sources of N + N in ground water include human wastewater and animal manure but fertilizer use is the most prominent contributor (Harrington, Maddox, and Hicks Reference Harrington, Maddox and Hicks2010). Infants exposed to high levels of N + N in drinking water can suffer from blue baby syndrome, a blood disorder that leads to low oxygen levels and can be fatal (EPA 2014b). Consequently, EPA and the State of Florida have set a health-based maximum contaminant level (MCL) for N + N in drinking water of 10,000 parts per billion (ppb).
Sources of arsenic in Lake County include run-off from agriculture, production of electronics, and erosion of natural arsenic deposits. EDB enters ground water through spills of leaded gasoline, leaking storage tanks, and wastewater from chemical production; but EDB was also used at one time as a pesticide (EPA 2014a) and incidents of EDB contamination in the county are often attributed to agricultural activities (Florida Department of Environmental Protection (FDEP) 2014). Consumption of water contaminated with high levels of EDB and arsenic increases the risk of a number of adverse health conditions, including cancer, skin damage, and circulatory, digestive, and reproductive problems (FDH 2014, EPA 2014a). Florida's current MCLs are 10 ppb for arsenic and 0.02 ppb for EDB (stricter than the 0.05 ppb standard for EDB set by EPA).
If contamination in a well is found to exceed the MCL or Florida's health advisory level (HAL) for any contaminant, households are advised not to consume the water, and FDEP's Water Supply Restoration Program takes actions to expeditiously restore or otherwise provide safe potable water and covers the cost of those actions, which include temporary provision of bottled water followed by more-permanent solutions such as installation of a filter or provision of a connection to the public water line (FDEP 2014).
Empirical Model
We estimate hedonic regression models of property values in which the dependent variable is the natural log of the transaction price for home i in neighborhood j when it was sold in period t (p ijt ). The hedonic price is estimated as a function of characteristics of a house's structure (e.g., its age, interior square footage, and number of bathrooms), the parcel (e.g., lot acreage), and its location (e.g., the distance to urban centers and agricultural sites and whether it is located on the waterfront), all denoted by x ijt . The price of a home also depends on overall trends in the housing market, which are accounted for by annual and quarterly dummy variables (M t ). Of particular interest are measures of contamination in the potable well at home i, which are denoted by f(test ijt , ppb ijt ), a function of an indicator variable for whether the well at home i was recently sampled and tested (test ijt ) and the vector of pollutant concentration results (measured in ppb) from those tests (ppb ijt ). The equation to be estimated is
 $$\ln p_{ijt} = {\bf x}_{ijt} {\bf \beta} + {\bf M}_t {\bf \alpha} + f\lpar {test_{ijt}, \; {\bf ppb}_{ijt}} \rpar + v_j + {\rm \varepsilon} _{ijt} $$
where ε ijt is a normally distributed error term. In some specifications, we include block-group-level spatial fixed effects (v j ) to absorb all of the time-invariant price effects associated with neighborhood (the block group) j and allow ε ijt to be correlated within each block group. The coefficients to be estimated are β, α, and v j and coefficients related to test ijt and ppb ijt , which vary depending on the functional form.
A common criticism of hedonic applications is that it is not always clear whether home sellers and buyers actually consider or are even aware of the environmental disamenity of interest and the measure employed on the right-hand side of the hedonic price equation (Guignet Reference Guignet2013). If they are not, there is no reason to think that prices capitalize the disamenity. In our context, however, at least some households are aware of ground water pollution in private wells through cases identified by FDH. When FDH suspects the presence of contamination, it asks for permission from homeowners to test the wells in person and mails the results of the tests to the homeowners, along with a letter that explains how to interpret the results. In addition, sellers in Florida who obtain drinking water from a private well are required by law to disclose the source of the home's drinking water, the date of the last water test, and the results of that test (Florida Association of Realtors 2009). Thus, test ijt and ppb ijt are directly observed by sellers and likely by buyers as well.
Previous studies have found that regulatory standards for contaminants can serve as points of reference for households and that property values respond to the level of contamination in ground water relative to the standards (Boyle et al. Reference Boyle, Kuminoff, Zhang, Devanney and Bell2010, Guignet Reference Guignet2012, 2013). When FDH sends the results of a well test to a homeowner, it categorizes the results as (i) exceeding either the federal MCL or Florida's HAL, (ii) exceeding Florida's secondary drinking-water standards, which reflect nuisance-based concerns unrelated to health, and (iii) exceeding the detectable limit but falling below the current standards.
In our base models, we therefore model f(·) following a similar categorization scheme involving a series of indicator variables:
 $$\eqalign{ f\lpar {test_{ijt}, \; {\bf ppb}_{ijt} \;} \rpar = test_{ijt} {\rm \theta} _{test} + {\rm \theta} _{DL} { {\opf 1}} \lpar {{\bf ppb}_{ijt} \gt 0} \rpar + {\rm \theta} _{MCL} { {\opf 1}}\lpar {{\bf ppb}_{ijt} \gt {\bf MCL}} \rpar} $$
where (ppb ijt > 0) is an indicator variable equal to one when any contaminants were found to be present (exceed the detectable limit) and zero otherwise and (ppb ijt > MCL) denotes whether any contaminants were at levels that exceeded the corresponding MCL or HAL.Footnote 5 The variables test ijt , (ppb ijt > 0), and (ppb ijt > MCL) are based on all tests taken within a temporal window of Δt years before the transaction, and the variations of θ are coefficients to be estimated.
We calculate the percent change in home sale price associated with testing of wells and the results of those tests asFootnote 6
 $$\% \Delta p_{test} = \lpar {e^{{\rm \theta} _{test}} - 1} \rpar \times 100.$$
 $$\% \Delta p_{DL} = \lpar {e^{{\rm \theta} _{test} + {\rm \theta} _{DL}} - 1} \rpar \times 100.$$
 $$\% \Delta p_{MCL} = \lpar {e^{{\rm \theta} _{test} + {\rm \theta} _{DL} + {\rm \theta} _{MCL}} - 1} \rpar \times 100.$$
The hedonic analysis focuses on all homes that had been tested at any point prior to the sale. Therefore, %Δp test is the percent change in the price of homes for which wells had been recently tested and no contamination had been found relative to homes for which the wells had been tested in the more distant past, all else constant. Similarly, %Δp DL and %Δp MCL are the percent changes in prices associated with tests that found that at least one contaminant exceeded the detectable limit or the MCL/HAL, respectively. Again, this is relative to homes for which wells had been tested for contamination in the distant past but not recently. When contamination is found, FDH continues to test until the situation is resolved (i.e., the levels remain below the MCL/HAL for an extended period of time or a permanent uncontaminated water supply is provided). Consequently, we argue that tests are no longer warranted for this counterfactual group of homes because ground water contamination is no longer a concern.
We can also change the counterfactual for the price comparison—for example, the impact on property values of contamination exceeding the detectable limit relative to homes that had been tested recently and no contamination had been found:
 $$\% \Delta p_{test \to DL} = \lpar {e^{{\rm \theta} _{DL}} - 1} \rpar \times 100$$
Equations 1 through 6 are estimated using several variants of the hedonic regression. One specification incorporates spatial (block group) fixed effects and another distinguishes between contamination that exceeds the minimum detectable limit and contamination that exceeds the MCL/HAL.
As with most hedonic applications, there is concern that there may be spatially dependent unobserved influences that affect property values. For example, many neighborhoods are built within a particular time period with several set home configurations, using similar building materials, and where the housing bundles are defined by similar local amenities and disamenities. Additionally, lenders use recent comparable sales of nearby homes to determine the value of a property for mortgage purposes. Failure to control for such spatial dependence can result in potentially biased or inconsistent estimates.
To test for spatial dependence, we use the robust Lagrange multiplier test of both the spatial error and the lag format (LeSage and Pace Reference LeSage and Pace2009). The spatial lag of the dependent variable takes the following form:
 $$\; \ln p_{ijt} = {\rm \rho} wp_{[{ijt}]} + \; {\bf x}_{ijt} {\bf \beta} + {\bf M}_t {\bf \alpha} + f\lpar {test_{ijt}, \; {\bf ppb}_{ijt}} \rpar + v_j + \varepsilon _{ijt} $$
where ρ is a spatial lag parameter to be estimated and wp [ijt] is the corresponding element from the n × 1 vector obtained after multiplying the spatial weight matrix (SWM), W, by the price vector, P. In other words, wp [ijt] is the spatially and temporally weighted average of neighboring prices allowed to influence the price of home i sold in period t. The spatial error model instead models unobserved spatial dependence in the error term as
 $$\eqalign{& \ln p_{ijt} = {\bf x}_{ijt} {\bf \beta} + {\bf M}_t {\bf \alpha} + f\lpar {test_{ijt}, \; {\bf ppb}_{ijt}} \rpar + v_j + {\rm \varepsilon} _{ijt} \cr & {\rm where}\; {\rm \varepsilon} _{ijt} = {\rm \lambda} w{\rm \varepsilon} _{[{ijt}]} + u_{ijt}.} $$
In this specification, λ is the spatial autocorrelation parameter to be estimated, wε[ijt] is the corresponding element from the n × 1 vector obtained after multiplying W by the vector of error terms ε, and u ijt ~ N(0, σ2).Footnote 7
Robust versions of the spatial lag and error Lagrange multiplier tests were used to test for spatial dependence and to choose between the lag and error models. In all cases, the null hypothesis of no spatial dependence was rejected and the spatial error models in each format had significantly larger Lagrange multiplier coefficients, supporting use of the spatial error format. Due to concern about simultaneous lag and error dependence, we also estimated the general spatial model (LeSage and Pace Reference LeSage and Pace2009), which includes both a spatial lag of the dependent variable and a spatially correlated error term. In all cases, the spatial lag parameter ρ was insignificant while the spatial error parameter λ was significant at the 99 percent level. Together, these tests demonstrate that the spatial error model best reflects the spatial nature of the underlying data-generation process.Footnote 8
Data
We analyze transactions of single-family homes in Lake County (just west of Orlando) from 1990 through 2013. Lake County was chosen because concerns there about ground water pollution relate primarily to the run-off of chemicals associated with agricultural activities, and a preliminary examination of the data suggested that Lake County provided a sufficient number of well tests for the regression analysis.
Well Test Samples
FDH regularly tests ground water wells for contamination and maintains a database of all wells identified and tested and the results of those tests. The tests are conducted for a variety of reasons, but in most cases FDEP notifies FDH of potential contamination caused by human activities.Footnote 9 FDH then asks for permission from the property owner to test the well and cannot test it without the owner's consent. Given these procedures, testing of wells in the sample may potentially be endogenous. Owners who plan to put their houses on the market and believe that contamination exists, for example, could refuse to allow the wells to be tested because they would then have to disclose contamination to potential buyers. If this is a common occurrence, the hedonic estimates could be biased since the level of contamination and probability of a test would be correlated. Some owners have refused, but the vast majority of them have agreed to have their wells tested.Footnote 10
Our analysis focuses only on homes that were tested at some point prior to being sold, which essentially circumvents selection concerns. The comparisons in our regressions are of homes that FDH had already identified in terms of potential contamination, and the owners had an incentive to continue to allow testing until the water was found to be clean or an alternative clean water supply was provided.
In any case, it is clear that the well test data used in this study are not random and should not be interpreted as a representative sample of ground water quality. Nonetheless, these data are useful for identifying how property values may respond to contamination in private wells.
We carefully matched tests at private potable wells to corresponding residential parcels and transactions. The data-matching procedure relied on both an address-matching algorithm that linked wells to parcels based on similar address fields and spatial matching that exploited the relationship between well coordinates and parcel boundaries. The techniques were used together to provide the most accurate links possible. Using this procedure, we were able to match 6,619 private potable wells to a home.Footnote 11 A total of 6,652 water samples had been taken from those wells, the earliest in 1983 and the most recent in 2013 (several wells were sampled more than once). As shown in Figure 1, N + N, EDB, and arsenic were the three most commonly detected contaminants.
Residential Transactions
There were 124,859 arms-length transactions of single-family homes in Lake County from 1990 through 2013.Footnote 12 Of those unique sales, 5,738 involved parcels for which a well had been tested at any time. Our final data set was comprised of the 1,730 transactions where a well had been tested prior to the sale. We use this subset rather than the broader set of transactions for two reasons. First, there is an observed level of contamination, even if zero, for every transaction in the sample. Testing under other programs could reveal contamination, but that information was not available and could otherwise confound the results. Prior hedonic studies of ground water contamination have taken a similar approach (Malone and Barrows Reference Malone and Barrows1990). Second, a series of t-tests comparing the sample means across all of the observed house and parcel characteristics suggested that the tested homes were significantly different from the homes where wells had never been tested. Similar, but slightly less stark, differences were found when we compared our sample of home sales to those that were tested only after they were sold. If such differences also exist with respect to unobserved attributes, the results could be biased. Our sample of 1,730 sales consisted of a relatively homogenous set of homes.Footnote 13
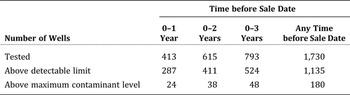
Table 1 shows that 1,135 of the 1,730 transactions had tests that revealed concentrations of contaminants that exceeded the detectable limit (denoted as above DL). The concentration of at least one of the contaminants exceeded the applicable MCL or HAL (hereafter denoted simply as above MCL) for 180 of those transactions. The number of identifying observations decreases when we consider shorter temporal windows in terms of the number of years prior to the transaction (0 ≤ Δt ≤ 1, 2, or 3 years). The main hedonic analysis focuses on ground water pollution found within three years (0 ≤ Δt ≤ 3) of the transaction date. This timeframe was chosen based on the number of identifying sales available for statistical analysis versus the amount of time one can reasonably expect contamination information to remain available and relevant to buyers and sellers.Footnote 14 Nonetheless, we also investigated the most appropriate temporal window. Descriptive statistics for the maximum concentrations of the three most common contaminants found three years prior to the sale dates are shown in Table 2.
Number of Sales in which Private Wells Were Tested
Summary of Pollutant Concentrations in Parts per Billion
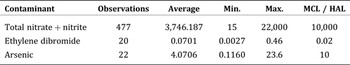
Note: These figures consider transactions in which the potable well was tested within three years prior to the sale date and concentrations of the corresponding contaminant were detected.
To identify impacts on property values properly, we must control for other characteristics of the housing bundle that may influence price. We include the following home structure characteristics: age and quality of the home, number of bathrooms, interior square footage, land area of the parcel, and whether the house has a pool and air conditioning. Recognizing that a home's location relative to amenities and disamenities also explains variations in home values, we include several location characteristics: the number of gas stations within 500 meters; distances to the nearest primary road, golf course, and protected open space; whether the home is a lakefront property; and whether it is located in a floodplain. To control for confounding factors associated with proximity to likely sources of pollution, we include the inverse distance to two types of agricultural land—citrus groves and row/field crops.Footnote 15 We also account for whether a home is located in the service area of an existing public water system.Footnote 16 Descriptive statistics for the housing-structure and spatial characteristics are presented in Table 3.
Descriptive Statistics for Home and Location Characteristics
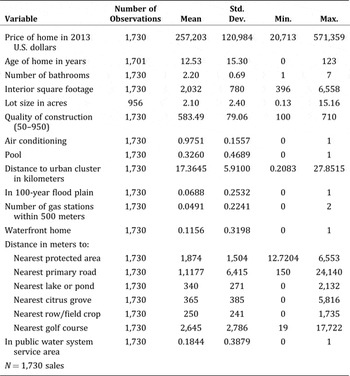
Notes: All characteristics are dummy variables unless otherwise noted. Construction quality is based on county assessor gradings in which 50 is poorest quality and 950 is best quality.
Results
We estimated hedonic regressions using all 1,730 transactions from 1990 through 2013 where data on potable well contamination prior to the sale were available. This is a rather long period over which to impose a single hedonic surface (and thus a constant equilibrium), but we viewed it as an acceptable tradeoff given the relatively small size of our sample. All regressions included year and quarter dummy variables to account for overall housing market trends.
Impacts of Ground Water Contamination on Property Values
The results of the base hedonic model for wells tested within three years prior to sale are presented in Table 4. All of the variables from Table 3 were included in the regressions but we report only the estimates of interest.Footnote 17 The other coefficient estimates all displayed the expected sign or were insignificant. The adjusted R-square ranged from 0.770 to 0.822, indicating a fairly good overall statistical fit.
Base Hedonic Regression Results: Tested Zero to Three Years Prior to Sale
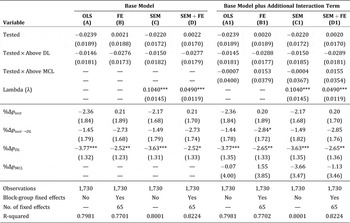
Note: The dependent variable is the natural log of the real transaction price (2013 U.S. dollars). Only coefficients of interest are shown, including Tested and interaction terms capturing the incremental impact of contamination levels above the detectable limit (Tested × Above DL) and above the MCL (Tested × Above MCL). *** denotes p < 0.01, ** denotes p < 0.05, and * denotes p < 0.1. Robust standard errors are provided in parentheses. In the block-group FE models, standard errors are clustered at the block-group level. Models C, D, C1, and D1 are spatial error models (SEMs) in which the error terms are allowed to be spatially correlated based on inverse-distance SWMs with a distance radius of 3,200 meters and a time constraint of twelve months (see the empirical model for details).
In the ordinary least squares (OLS) model (A), testing for contamination within three years prior to the sale (tested) and contamination exceeding the detectable level (above DL) are negatively correlated with home prices, but both coefficients are small and statistically insignificant.
The second panel in Table 4 shows the estimated percent changes in price (%Δp) as calculated in equations 3 through 6. Testing for (%Δp test ) and finding (conditional on testing) contamination (%Δp test→DL ) do not individually have significant effects on homes prices. When considered jointly (%Δp DL ), however, their impact is statistically significant. Testing and finding contamination within three years prior to the sale suggests a 3.77 percent decline in price. Similar results are generated by the second model (B), which incorporates block-group fixed effects (FE) to account for all time-invariant price effects associated with a particular neighborhood (block group). In both models, the only significant price differential is for %Δp DL , which points to a depreciation of 2.52 percent and 3.77 percent.Footnote 18 Multiplying %Δp DL by the mean price of $258,238 for homes that were tested more than three years prior to being sold and thus where any past contamination issues had since been resolved (since FDH no longer deemed it necessary to continue to monitor the well) suggests an average loss of $6,505 and $9,746.
Model C is a spatial error model (SEM) that better controls for the spatial nature of the underlying data-generation process (LeSage and Pace Reference LeSage and Pace2009). It incorporates a SWM with a distance constraint of 3,200 meters and a time constraint of twelve months. The coefficients from this model are comparable to the ones from the OLS model with minor differences in magnitude. The significant spatial-autocorrelation coefficient λ demonstrates that the error terms are spatially correlated. In this model, the combined impact of a well being tested and contamination found (above the detectable level) is a 3.63 percent reduction in value, which amounts to a mean loss of $9,374 and is significant at the 99 percent level. Model D adds block-group fixed effects to model C, and the results are similar to those from the nonspatial FE specification in model B.Footnote 19
In models A1 through D1, we add an interaction term to investigate whether contamination that exceeds the MCL/HAL is associated with an additional decrease in value.Footnote 20 We find no statistically significant impacts from contamination levels above the MCL/HAL. This is not necessarily surprising since mitigating and averting actions can be taken, and are often performed by FDEP at no cost to the homeowner when the MCL/HAL is exceeded (FDEP 2014). That said, the lack of significant results could be partially due to the small number of transactions where the MCL/HAL was exceeded (48).
In all four models (A1 through D1), we find that %Δp DL equals a depreciation of 2.65 percent to 3.77 percent, again suggesting that recent testing and detection of contamination in a private well corresponds to a small but significant decrease in home values. Since the estimates from the spatial models are similar to, and fall within the range of, the estimates from the nonspatial OLS and FE models, we focus on the OLS and FE models in the remainder of the analysis.
Impacts on Property Values over Time
We next investigate whether impacts of ground water testing and contamination are permanent or diminish over time. We re-estimate models A and B, and instead of including one effect for testing of zero to three years, we include tested and above DL indicators for each of eight years prior to the sale date. By accounting for the indicators in one-year increments using the same hedonic regression, we examine how %Δp DL varies over time. The estimates are calculated following equation 4 and the results are presented in Figure 2.
Price Impacts of Testing and Contamination over Time
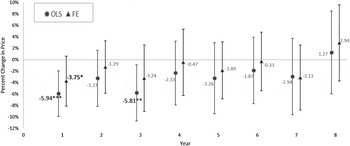
The OLS and FE models suggest that a test and finding of contamination within one year of the sale is associated with a 5.94 percent and 3.75 percent reduction in the value of a home, respectively. In addition, we find a significant 5.81 percent decline associated with testing and contamination within two to three years prior to the transaction in the OLS model. Otherwise, none of the price impacts are statistically significant. The estimates are also not generally statistically different across the years. Only one difference is significant. Pairwise nonlinear Wald tests of the %Δp DL estimates in year 1 in both models and year 3 in the OLS model suggest that those estimates are statistically different from the insignificant estimates in year 8. In general, as Figure 2 illustrates, the point estimates gradually tend toward zero and the 95 percent confidence intervals widen when considering testing and contamination found more than three years prior.Footnote 21
As previously noted, FDH generally continues to test private wells until the level of contamination remains below the MCL/HAL for an extended period of time or, in some cases, until a permanent clean water supply is provided (such as by a connection to the public water system). Our results suggest that property values are 3–6 percent lower for homes where recent tests revealed contamination and provide some evidence that the decreases are not permanent and potentially dissipate within a few years. The fact that any price effects seem to diminish over time suggests that prices may rebound once contamination issues have been resolved and perhaps that information about contamination becomes less relevant and/or available to buyers and sellers over time.
Heterogeneity across Contaminants
To examine whether impacts on property values vary based on the type of contaminant, we re-estimate the OLS and FE models with a series of additional interaction terms to allow the individual price effect of each of the most common pollutants (N + N, EDB, and arsenic) to vary from the price effect of contamination in general. The results are omitted for brevity, but in short we find no statistically significant differences in the price impacts of N + N, EDB, and arsenic relative to contamination in general. These results must be interpreted with caution, however. As shown in Table 2, the number of transactions available for statistical identification when looking at individual contaminants is quite small, at least for EDB and arsenic.
Concentration of Total Nitrate and Nitrite
The data set included a relatively large number of transactions in which detectable levels of N + N were found in tests within three years before the sale dates (see Table 2), which allowed us to explicitly examine how the impacts on price might vary with increasing levels of N + N in wells. We re-estimated models A and B to include the maximum concentration of N + N found within three years before a transaction $ \big ({ppb_{ijt}^{NN}} \big )$
. Different functional forms of the relationship between ln p
ijt
and
$ \big ({ppb_{ijt}^{NN}} \big )$
. Different functional forms of the relationship between ln p
ijt
and $ppb_{ijt}^{NN} $
are assessed, including linear and piecewise-linear models.
$ppb_{ijt}^{NN} $
are assessed, including linear and piecewise-linear models.
Building on equations 3, 4, and 5, we use the coefficients from the re-estimated models to calculate the corresponding percent change in price $\left({\percnt \Delta p_{ijt}^{NN}} \right)$
as a function of ppb of N + N. First, consider a hedonic model in which the concentration of N + N enters linearly. The percent difference in price for a home with a recently tested well in which N + N was detected relative to a home with no recent test and no contamination detected is
$\left({\percnt \Delta p_{ijt}^{NN}} \right)$
as a function of ppb of N + N. First, consider a hedonic model in which the concentration of N + N enters linearly. The percent difference in price for a home with a recently tested well in which N + N was detected relative to a home with no recent test and no contamination detected is
 $$\% \Delta p_{ijt}^{NN} = \left( {e^{\left\{ {{\rm \theta} _{test} \,+ \,{\rm \theta} _{DL}\, +\, \big( {{\rm \theta} _{NN} \,\times\, ppb_{ijt}^{NN}} \big)} \right\}} - 1} \right) \times 100$$
where θ NN denotes the slope coefficient corresponding to the concentration of N + N.
Figure 3 presents the estimated percent change in price as a function of N + N $\left({ppb_{ijt}^{NN}} \right)$
for the OLS and FE models. The linear specifications provide mixed results. There is a generally insignificant price effect and, if any, a counterintuitive positive relationship in the OLS model. The linear FE model, on the other hand, suggests the expected negative relationship, but the change in price does not become statistically different from zero until roughly the 10,000 ppb MCL.
$\left({ppb_{ijt}^{NN}} \right)$
for the OLS and FE models. The linear specifications provide mixed results. There is a generally insignificant price effect and, if any, a counterintuitive positive relationship in the OLS model. The linear FE model, on the other hand, suggests the expected negative relationship, but the change in price does not become statistically different from zero until roughly the 10,000 ppb MCL.
Percent Change in Price and Concentration of Total Nitrate and Nitrite: Tests and Contamination Zero to Three Years Prior to Sale
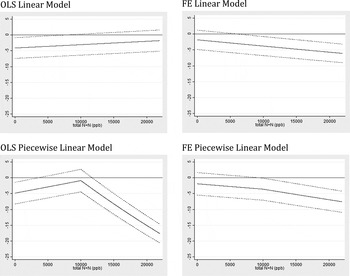
To examine whether the 10,000 ppb health-based standard serves as a point of reference for buyers and sellers, we estimate piecewise-linear models where the slope coefficients at concentrations of N + N below and above the MCL are allowed to differ.Footnote 22 The percent change in price in this case is estimated as
 $$\eqalign{\% \Delta p_{ijt}^{NN} & = \left( {e^{\left\{ {{\rm \theta} _{test}\, +\, {\rm \theta} _{DL} + \left( {{\rm \theta} _{NN} \,\times\, ppb_{ijt}^{NN}} \right) +\, \left( {{\rm \theta} _{NN\_MCL} \,\times\, \left( {ppb_{ijt}^{NN} - MCL} \right) \times {{\opf 1}}\left( {\,ppb_{ijt}^{NN} \gt MCL} \right)} \right)} \right\}} - 1} \right)\cr & \quad \times 100} $$
where the additional parameter to be estimated, θ
NN_MCL
, captures the change in the slope once the 10,000 ppb MCL is exceeded, which is denoted by the dummy variable ${{\opf 1}}\big({ppb_{ijt}^{NN} \gt MCL} \big)$
. As shown in Figure 3, the price differential is generally insignificant when the N + N level remains below the MCL, but once it exceeds the MCL home values decline significantly. When the N + N level is twice the MCL, for example, the average loss in value is $38,900 in the OLS model and $17,900 in the FE model.
${{\opf 1}}\big({ppb_{ijt}^{NN} \gt MCL} \big)$
. As shown in Figure 3, the price differential is generally insignificant when the N + N level remains below the MCL, but once it exceeds the MCL home values decline significantly. When the N + N level is twice the MCL, for example, the average loss in value is $38,900 in the OLS model and $17,900 in the FE model.
Conclusion
As regulatory actions required by the Clean Water Act have further reduced point-source pollutants, attention has increasingly shifted to contamination from nutrients and other chemicals associated with agricultural fertilizers and pesticides.Footnote 23 Our hedonic study examines data for Lake County, Florida, where significant concern about pollution of ground water stems from run-off of chemicals associated with production of oranges and other agricultural activities. The most frequently detected contaminants observed in the data are total nitrate and nitrite (N + N), ethylene dibromide (EDB), and arsenic, which have been linked to agricultural fertilizers, pesticides, herbicides, and soil fumigants (Chen et al. Reference Chen, Ma, Hoogeweg and Harris2001, FDEP 2014, Harrington, Maddox, and Hicks Reference Harrington, Maddox and Hicks2010, Solo-Gabriele et al. Reference Solo-Gabriele, Sakura-Lemessy, Townsend, Dubey and Jambeck2003, EPA 2014b). Human exposure to these contaminants can increase infant mortality and the risk of developing a number of adverse health conditions, including blue-baby syndrome, cancer, and liver, stomach, circulatory, and reproductive issues (EPA 2014b).
Only a few hedonic studies have rigorously examined how home values are affected by changes in ground water quality (Boyle et al. Reference Boyle, Kuminoff, Zhang, Devanney and Bell2010, Guignet Reference Guignet2013). We attribute this gap in the literature largely to a lack of appropriate data and difficulties associated with linking measures of ground water quality to individual homes and transactions. We use a comprehensive data set of contamination tests of potable wells conducted by the Florida Department of Health. Our dual data-matching procedure uses property and well address fields with spatial coordinates and parcel boundaries to establish accurate matches and ultimately link residential transactions to well tests and contaminant levels relative to the sale dates. This unique data set allows us to investigate how property values vary with home-specific levels of contamination in private potable water wells, thus providing insight for benefit-cost analyses of policies meant to improve and protect ground water quality.
We compare sales for homes where the private wells have been tested for contamination at some point prior to being sold using hedonic regressions. We find that identification of contamination in a well within three years of a sale is associated with a 2–6 percent reduction in home values. The decrease in value is not permanent, however, and seems to diminish a few years after the contamination issue is resolved. This conclusion may also reflect, at least partially, that information about the contamination becomes less relevant and/or less available to buyers and sellers as time passes. Boyle et al. (Reference Boyle, Kuminoff, Zhang, Devanney and Bell2010) identified a similar rebound effect a few years after public information about ground water contamination was released.
We analyzed the three most common contaminants individually (N + N, EDB, and arsenic) and found no significant heterogeneity in how the housing market responds. However, those results are confounded by the small number of identifying transactions available. Further study of the individual effects of various contaminants could be valuable. If the price impacts are in fact similar across different pollutants and perhaps even sources, this would facilitate benefit transfer to other ground water contamination contexts, such as leaking underground storage tanks, hydraulic fracturing and natural gas extraction, and hazardous chemicals from superfund sites.
The significant number of wells in our data set that had been identified as contaminated with N + N allowed us to explicitly model how changes in home values vary at different concentrations of the contaminant. We found no significant impacts from relatively low concentrations. Once the health-based regulatory limit was exceeded, however, prices declined significantly. At twice the regulatory limit, we estimated a reduction in value of 7–15 percent, which translates to an average loss of $17,900 to $38,900. These results are in line with prior risk communication and valuation studies (Boyle et al. Reference Boyle, Kuminoff, Zhang, Devanney and Bell2010, Guignet Reference Guignet2012, Johnson and Chess Reference Johnson and Chess2003, Smith et al. Reference Smith, Desvousges, Johnson and Fisher1990), supporting the notion that given little knowledge of how pollution maps into health risks, households use the regulatory standard as a reference when forming their perceptions of risk. This finding also supports our overall analysis by demonstrating that households respond to information provided by regulators.
Our study adds to the small body of literature examining how residential property values are affected by ground water pollution by using more sophisticated statistical methods, exploiting both spatial and temporal variations in contamination, including a more-exhaustive set of control variables, and incorporating property-specific measures of contamination. Still, as in past studies, some statistical issues remain, and caution is warranted when interpreting the results. First, some of the conclusions are based on a relatively small number of identifying sales. Second, the analysis is limited to homes that were tested at some point prior to being sold. Our data diagnostics suggested that this sample of homes may differ from homes where the wells were never tested. Consequently, the external validity of our results is unclear, and extrapolation of the results to a broader population of homes may not be appropriate. Future studies could examine the potential endogenous selection of private well tests and establish a more viable causal link.
Despite its limitations, this study provides evidence of how home values might be impacted by ground water contamination and an estimated magnitude of those effects. Our results are consistent with findings from other recent studies in terms of magnitude and permanence (Guignet Reference Guignet2013, Boyle et al. Reference Boyle, Kuminoff, Zhang, Devanney and Bell2010). With the preceding caveats in mind, our results provide useful information for policymakers considering actions to remediate ground water contamination or employ alternative mitigating and averting actions.


 Open access