


Nomenclature
- ABL
-
Atmospheric Boundary Layer
- ACP
-
Airload Computation Points
- ADV
-
Acoustic Doppler Velocimetry
- CFD
-
Computational Fluid Dynamics
- DDES
-
Delayed Detached Eddy Simulation
- DIPES
-
Deck Interface Pilot Effort Scale
- HMS
-
Her/His Majesty’s Ship
- LES
-
Large Eddy Simulation
- MTE
-
Mission Task Elements
- QEC
-
Queen Elizabeth Class
- SHOL
-
Ship-Helicopter Operating Limits
- SRVL
-
Shipborne Rolling Vertical Landing
- STOVL
-
Short Take-off and Vertical Lift
- UoL
-
University of Liverpool
- URANS
-
Unsteady Reynolds-Averaged Navier-Stokes
- VTOL
-
Vertical Take-off and Landing
- WOD
-
Wind-Over-Deck
Greek symbol
- $k$
$k$
-
turbulent kinetic energy
-
$Ti$
-
turbulence intensity
-
$Ti\;w$
-
vertical turbulence intensity
-
$u$
-
longitudinal velocity
-
$U$
-
freestream velocity magnitude
-
${U_{ref}}$
-
reference wind speed
-
$v$
-
lateral velocity
-
$w$
-
vertical velocity
-
$\sigma $
-
standard deviation
-
$\omega $
-
specific turbulence dissipation rate


1.0 Introduction
UK naval ships and helicopters undergo clearance trials to determine the limiting wind speeds for launch and recovery. These Ship-Helicopter Operating Limits (SHOL) trials are normally conducted when a new ship or aircraft enters service. The trials are complex with success determined by the ability to achieve a wide range of wind speeds, wind azimuths and sea states, often within a constrained trial window.
To assist in this clearance process, the University of Liverpool (UoL) has developed a synthetic environment in which time-accurate airflow simulations are combined with flight simulation to provide initial flying and pilot workload ratings for combinations of wind speed, wind direction and helicopter mass.
A key factor in the viability of this approach is the accurate simulation and understanding of turbulence and wind shear around the ship, with turbulent air flow over the flight deck of an aircraft carrier presenting a hazard to aircraft during launch and recovery. From the earliest days of the development of aircraft carriers, during World War I, it was apparent that turbulent air was a significant threat to the safety of the aircraft, particularly when landing [Reference Burt1]. At the time, the concern over the effect of hot boiler gases and turbulent wakes shed from the superstructure above the flight deck led to experimental sea trials using full-length flat-deck ships with no superstructure, and with horizontal exhaust ducts and extractor fans. However, the impracticality of these ships (notably HMS Furious and Argus) led designers to revert to the already emerging concept of placing the superstructure, or ‘island’ on the extreme starboard side of the flight deck. Therefore, all subsequent aircraft carriers arrange the superstructure along the starboard edge of the ship so that, when facing into wind, the superstructure does not shed its turbulent wake across the flight deck.
1.1 Queen Elizabeth Class (QEC) configuration
The Queen Elizabeth Class (QEC) aircraft carriers, shown in Fig. 1, are unusual in design in that they have two islands: the forward island is used for ship control, while the aft island is used to control flight operations. Each island also contains the exhaust ducting for the ship’s fore and aft engines. The other notable characteristic of the QEC is the rounded take-off ramp, or ‘ski-jump’ at the bow. The primary aircraft operating from the QEC is the F-35B, the Short Take-Off and Vertical Lift (STOVL) version of the Lockheed Martin Lightning II. The purpose of the ramp is to facilitate the short take-off [Reference Fry, Cook and Revill2]. The ship also operates with rotary-wing assets such as Merlin, Wildcat, Chinook and Apache helicopters. Like the helicopters, the F-35B is capable of Vertical Take-Off and Landing (VTOL). The preferred method of operation is for the take-off to be via the ramp and the recovery to be via VTOL; although, for landings with a greater payload, the F-35B can also use an approach known as Shipborne Rolling Vertical Landing (SRVL). SRVL is a new recovery method unique to the UK F-35B/QEC and involves the aircraft recovering along a 7˚ glideslope over the stern of the ship, at a low forward speed, and stopping on deck using the wheel-brakes [Reference Cook, Atkinson, Milla, Revill and Wilson3].
HMS Queen Elizabeth with embarked F-35B and Merlin (© Crown).

HMS Queen Elizabeth, the first of two of the United Kingdom’s new aircraft carrier class, was commissioned in 2017; she has a displacement of 65,000 tonnes, with a length of 280 m, a beam of 73 m and a flight deck approximately 18 m above the waterline. Her sister ship, HMS Prince of Wales, was commissioned in 2019. The aerial view in Fig. 1 shows HMS Queen Elizabeth with thirteen F-35Bs on the deck and two Merlin helicopters stowed towards the stern.
1.2 Aircraft carrier airwake
When possible, during aircraft launch and recovery, an aircraft carrier is turned into the wind to minimise crosswinds [Reference Rudowsky, Cook, Hynes and Heffley4] and to assist the fixed-wing aircraft by increasing the relative wind speed while minimising the turbulence generated over the flight deck. Figure 2, extracted from a study by Watson et al. into the air flow over the QEC [Reference Watson, Kelly, Owen, Hodge and White5], shows an image generated by Computational Fluid Dynamics (CFD) of the relatively undisturbed air flow passing over the five VTOL recovery spots (spots 1–5) as well as the disturbed air passing over the islands and over another designated landing spot (spot 6) aft of the islands; the wind is from ahead. The air flow over much of the flight deck has low turbulence intensity (less than 5% of freestream), unlike the flow aft of the islands and at spot 6, which can reach turbulence intensity levels of up to 30% of freestream. The inset image of the streamlines over the front of the ship also shows that, in a headwind, the radiused profile of the ramp and the bow is effective in minimising flow separation and turbulence along the fixed wing take-off path.
CFD image of the air flow over QEC in a headwind [Reference Watson, Kelly, Owen, Hodge and White5].

Although it is desirable to steer the ship into the wind, there will be occasions when that is impractical and the aircraft and pilot will have to operate with oblique winds. If the wind approaches the ship from starboard, then turbulence will be generated over the deck by the air flowing over and between the islands, thereby adversely affecting the flying conditions [Reference Watson, Kelly, White and Owen6]. From an operational perspective, while there may be a strong case for turning the ship into the wind when deploying the fixed-wing aircraft, the same logic does not necessarily apply to the rotary-wing aircraft, which are less sensitive to wind direction and can turn into the wind once airborne.
The disturbed air flow over a ship is commonly referred to as the ‘airwake’ and is caused by a combination of the prevailing wind and the forward speed of the ship. The airwake is typically characterised by unsteady shear layers and vortices shed from the superstructure and deck edges. When the airwake interacts with an aircraft, it imposes unsteady aerodynamic forces and moments that can make it difficult for the pilot to maintain control [Reference Watson, White and Owen7, Reference Watson, Owen and White8]. The severity of the airwake is affected by the wind speed and direction relative to the ship (i.e. the Wind-Over-Deck, WOD) and the shape and size of the ship and its superstructure [Reference Forrest, Owen, Padfield and Hodge9].
Prior to HMS Queen Elizabeth embarking on her first of class flight trials with the F-35B, several thousand simulated launch and recovery missions had been performed in the F-35B/QEC integration simulator at BAE Systems, Warton [Reference Kelly, Watson, Hodge, White and Owen10]. This hugely successful simulated trials programme was a world first in using modelling and simulation to prepare crews and inform at-sea clearance trials. A key aspect of the fidelity of the simulation was the inclusion of unsteady air flow over and around the ship for a wide range of wind speeds and directions. The airwakes were created at the UoL using time-accurate unsteady CFD; a description of the CFD method and the experimental validation can be found in Ref. (Reference Watson, Kelly, Owen, Hodge and White5). Although the preparation for the fixed-wing trials was greatly assisted by simulation, the opportunity did not arise to similarly prepare for the rotary-wing trials. However, the authors did take the opportunity to independently deploy the QEC airwakes in the UoL HELIFLIGHT-R full-motion helicopter flight simulator, and to conduct piloted deck landings of a generic helicopter to the QEC [Reference Watson, Owen and White8].
1.3 QEC Aircraft lifts
Having developed the capability to create full-scale unsteady airwakes for the QEC and to integrate them with flight simulation, the results presented in this paper have been obtained by applying the same modelling and simulation process to the case where the aircraft lifts on the QEC are in use. The lifts are used to transfer aircraft from the hangar to the flight deck. There are two lifts, both on the starboard side: one behind the forward island and one behind the aft island. Scrutiny of Fig. 1 shows the two lifts, in the raised position, marked by yellow lines; the forward lift has two F-35B aircraft on it, and the aft lift is just ahead of the parked Merlin helicopters. A photograph of the forward lift in its lowered position is shown in Fig. 3. Each lift is large enough to carry two F–35B, or two Merlin helicopters with their main rotor blades folded, or one Chinook tandem helicopter with the rotors unfolded. Each lift moves a vertical distance of about 11 m, is about 24 m long at the deck edge, and extends about 15 m inboard; the lowered lift door also reveals a large opening into the hangar.
Lowered forward lift on HMS Queen Elizabeth (© Crown).

As shown in Fig. 3, lowering the lifts significantly changes the geometry of the ship, effectively moving the deck edge inboard about 15 m and creating an opening in the side of the hull. The lowered lifts may therefore change the air flow over the deck, particularly when the wind is from starboard and, consequently, may have an impact on the flying conditions and on the safe wind limits determined during the flight trials.
1.4 Modelling and simulation
As discussed above, there will be occasions when the relative wind will approach the ship from the starboard side and will pass over, around and between the two islands, producing a highly turbulent and non-uniform air flow across the flight deck. The flow over the flight deck of the QEC was modelled using both experiment and time-accurate CFD. A series of experiments (described in Section 2.2) was conducted to measure the unsteady velocities in the flow over the flight deck of a 1:200 scale model of the QEC, with the lifts in both the raised and lowered positions. Furthermore, recognising that when the lifts are raised there is a possibility that they may have aircraft on them, a third configuration was included with two Merlin helicopters on each raised lift. The wind directions considered were from headwind to 120° starboard in 30° increments, as well as a 90° wind from port. The same geometrical configurations, for the full-scale ship, were used in the CFD analysis.
To assess how the air flow and the different lift configurations will affect a recovering helicopter, a simulated flight trial was conducted in the HELIFLIGHT-R flight simulator by an experienced former Royal Navy test pilot. The purpose of this paper, therefore, is to present the results of both the air flow study and the flight simulation trials and to assess whether the configuration of the lifts affects an aircraft, specifically a helicopter, when landing on the ship.
2.0 Airwake modelling
The CFD method is the same as that used previously to create QEC airwakes for BAE’s F–35B/QEC integration simulator. In that study, the airwakes for winds from ahead and 10° off the bow, were also compared with experimental measurements, as reported in Ref. (Reference Watson, Kelly, Owen, Hodge and White5). However, the new geometrical configuration was sufficiently different to warrant a dedicated experiment to give additional confidence in the CFD simulations. The computational and experimental modelling studies are presented in the following sections; because the methodologies have already been described in detail in Ref. (Reference Watson, Kelly, Owen, Hodge and White5), the descriptions have been kept brief.
2.1 CFD airwake modelling
To produce the mesh required for CFD, three geometry models of the aircraft carrier were created with the lifts in their two positions, and in the raised position with two Merlin helicopters as shown in Figure 4. The Merlin helicopters are brought up from the hangar with their blades folded, and it was therefore decided not to include the blades in the geometry models as they would have little aerodynamic impact and would significantly increase the complexity of the CFD mesh. Typically, when the lifts are in a raised position, the hangar doors are closed; and when the lifts are lowered, they are open. To account for any effect on the air flow due to the open hangar doors, an internal hangar cavity was also included in the geometry model of the ship with the lifts in the lowered position. Although the lifts can be operated independently, they were modelled with either both raised or both lowered.
Geometry model of a twin island aircraft carrier with (a) lifts raised, (b) lifts lowered, (c) lifts raised with two Merlin helicopters.

The airwakes were computed using Delayed Detached Eddy Simulation (DDES), a time-accurate CFD method suitable for modelling unsteady flow dominated by both quasi-periodic large-scale structures and chaotic small-scale turbulent features typical of bluff body geometries [Reference Spalart, Deck, Shur, Squires, Strelets and Travin11]. DDES uses a hybrid approach to turbulence modelling, employing Large Eddy Simulation (LES) away from the surfaces of the body to directly resolve (compute) the larger-scale turbulent structures, while Unsteady Reynolds-averaged Navier-Stokes (URANS) is applied closer to the surface [Reference Spalart, Jou, Strelets and Allmaras12].
The DDES airwake analysis was carried out using ANSYS Fluent with a Shear Stress Transport k–ω based turbulence model and third-order accuracy momentum discretisation. This hybrid method of computation is particularly suited to modelling of ship airwakes because, in regions of interest such as over the flight deck of the aircraft carrier or in the vicinity of the lifts, the turbulent features of the flow are explicitly resolved with a reduction in computational time required compared with ‘pure’ LES. To adequately resolve the turbulent length scales within the airwake using LES, and to reduce artificial dissipation, it is necessary for the mesh size in the CFD region of interest, or ‘focus region’, to be sufficiently refined. During mesh generation, the cell size on the surface of the ship, in the region of aircraft operations and within the hangar cavity was constrained to 1 m to provide sufficient resolution of turbulence. A mesh with a cell count of about 50 million was generated to compute the flow over the ship and within the hangar.
A horizontal slice of the mesh at hangar mid-height is shown in Fig. 5, where the region of dense cells in the vicinity of the lifts and within the internal hangar can be seen. The aircraft carrier geometry with each lift configuration was placed in a cylindrical domain with a radius of 1260 m and a height of 210 m. At the inlet to the CFD domain, a velocity profile was applied to represent a steady oceanic Atmospheric Boundary Layer (ABL) over the sea surface [Reference Garrat13]; the addition of an ABL is widely used when creating ship airwakes using CFD, e.g. Ref. (Reference Forrest and Owen14). Figure 6 shows the ABL ahead of the ship on a plane through the centreline of the islands; the airwake is illustrated by the mean normalised velocity component $U/{U_{ref}}$
where
$U/{U_{ref}}$
where $U$
is the freestream velocity and
$U$
is the freestream velocity and ${U_{ref}}$
is the desired reference wind speed at the mean height of the ship’s anemometers. For the CFD analysis,
${U_{ref}}$
is the desired reference wind speed at the mean height of the ship’s anemometers. For the CFD analysis, ${U_{ref}}$
was set to 40 kt (20.6 m/s). During computation, a settling period was required after which the three-dimensional velocity components were sampled for 30 seconds to provide the unsteady airwake data to be integrated with the helicopter flight dynamics model used in the flight simulation (described in Section 3). The unsteady velocity data was also used to calculate the mean and turbulent statistics of the airwakes (described in Section 2.3).
${U_{ref}}$
was set to 40 kt (20.6 m/s). During computation, a settling period was required after which the three-dimensional velocity components were sampled for 30 seconds to provide the unsteady airwake data to be integrated with the helicopter flight dynamics model used in the flight simulation (described in Section 3). The unsteady velocity data was also used to calculate the mean and turbulent statistics of the airwakes (described in Section 2.3).
A horizontal plane at mid-height of the hangar through the hangar cavity showing the CFD mesh.

Time-averaged airwake in headwind showing ABL ahead of ship.

2.2 Experimental airwake modelling
To provide a source of CFD validation evidence, water tunnel experiments were performed for the QEC configuration with lifts deployed and aircraft in place. Of principal interest was the experimental verification that changes to the extent and magnitude of the cross-deck flow structures and turbulence were adequately captured by the CFD.
To achieve this, experiments were carried out in the UoL water channel on an existing 1:200 scale model of the QEC. The experiments were performed with a uniform inlet velocity profile. The Reynolds number based on the length of the QEC was about 106 for the model scale, compared with about 108 for the full-scale aircraft carrier; both values are high enough for the flow characteristics to be independent of Reynolds number [Reference Healey15].
In the study reported in Ref. (Reference Watson, Kelly, Owen, Hodge and White5) the airwakes were computed at both model scale with a uniform inlet velocity profile for direct comparison with the experiments, and at full-scale with an ABL for implementation in the flight simulator. Notwithstanding the differences in scale and inlet conditions, the two computed flow fields agreed well with each other and with the experimental measurements. In the present study, therefore, the decision was made to directly compare the full-scale CFD results with the model-scale experiments.
To enable experimental measurements of the flow with the lifts lowered and the hangar doors open, modifications were made to an existing above-waterline water tunnel model of the QEC. Consistent with the CFD model, the physical model has an internal cavity to represent the hangar, and the doors were open when the lift was lowered and closed when raised. The modified model with the lifts in a lowered position with the hangar doors open is shown in Fig. 7; also shown is the interchangeable lift platform with the fuselages of two Merlin helicopters.
1:200 3D printed scale model of QEC showing lift modifications.

Experimental measurements of the flow over the submerged aircraft carrier were performed in the recirculating water channel shown schematically in Fig. 8. The model was secured to the floor of the 3.7 m long, 1.4 m wide working section of the channel with the variable floor height set to a water depth of 0.85 m; the ship was rotated to create the different wind directions. The water channel is capable of inlet speeds up to 6 m/s. To minimise the disturbance to the generally smooth water surface, an inlet speed of 1 m/s was applied. A brass honeycomb flow-straightener in combination with a contraction upstream of the open channel working section ensures a uniform velocity profile at the section entry, while a water jet injection at the start of the working section adds flow to the free surface to maintain the uniform velocity profile at the surface. Mean and unsteady velocity measurements were obtained at predetermined points above and along the flight deck using Acoustic Doppler Velocimetry (ADV), a technique which detects small variations in the acoustic signal frequency arising from the Doppler effect to measure the velocity in three components [Reference Voulgaris and Trowbridge16]. The cylindrical sampling volume for each probe has a diameter of 6 mm and a length of 7 mm, with the mid-point located 50 mm from the acoustic transmitter. It is recognised that this may introduce small errors in flows with very steep velocity gradients.
Schematic of water channel showing QEC model submerged in working section.

2.3 Airwake modelling results
The experimental results indicated that the flow over the flight deck was most disturbed for a 60° starboard wind. Therefore, the study has focused on this wind direction and created full-scale CFD airwakes for implementation in the flight simulator for a wind direction that is conventionally referred to as a Green 60, or G60, WOD. This section will first present an overview of the air flow over the QEC for the different lift configurations, as predicted by the CFD, and will then present a subset of the experimental data to demonstrate the level of agreement between experiment and CFD.
2.3.1 Air flow over flight deck
Figure 9 shows contours of computed turbulence intensity on a plane 10 m above the flight deck (the approximate height at which the helicopter will be brought across the deck by the pilot), the contours are overlaid by in-plane streamlines. Turbulence intensity throughout the paper is defined as the root mean square of the turbulent velocity fluctuations divided by the freestream flow velocity, i.e. not the local velocity. The turbulent velocity fluctuations are resolved for each timestep and recorded over the 30 seconds sampling period to provide the resolved turbulence intensity. The most noticeable features in Figure 9 are the recirculation zones within the wakes created by the two islands, indicated by the circulating streamlines, and the turbulent shear layers formed by the air flow separating from the vertical edges of the islands. Each of the six landing spots are indicated by a circle, which represents the helicopter rotor. Looking carefully at the three images in Fig. 9, it can be seen that the turbulence levels in the plane are generally lower when the lifts are down, and the presence of the Merlins on the raised lift platform also appear to reduce the turbulence levels compared with the raised platform without the Merlins.
Contours of normalised turbulence intensity overlaid by in-plane streamlines on horizontal plane 10 m above flight deck.

Another view of the overall air flow over the deck is presented in Fig. 10, this time the flow field is shown on a vertical plane passing through spots 1–5. The contours of turbulence show how, by the time the flow reaches the line of landing spots, the levels of turbulence are more intense when the lifts are up, consistent with Fig. 9. Additional information on how the lift configurations affect the air flow is given in Fig. 11 where the flow on the vertical plane through the landing spots is now shown as contours of total velocity magnitude. The slower-moving air flow (blue) indicates the size of the recirculation zone in the wake of each island, and it can be seen that the wakes are smaller when the lifts are down.
Contours of turbulence intensity on vertical plane through spots 1–5.

Contours of normalised velocity magnitude on vertical plane through spots 1–5.

How the different air flows impact a helicopter hovering over the landing spots is influenced by both the turbulent fluctuations and the air speed. Looking across the spots it can be seen that spots 2 and 4 are particularly affected by the lift configurations, with spot 4 being the most affected. Although the study considered the air flow over all the landing spots, because spot 4 appears most affected, the paper will focus more on the results of the air flow and helicopter response at spot 4.
2.3.2 Comparison of CFD and experiment
CFD-generated airwakes for the QEC have previously been validated through experimentation when the ship is exposed to winds from ahead and from 10° off the bow [Reference Watson, Kelly, Owen, Hodge and White5]. The ship geometry in this study was sufficiently different to the previous configuration that it was considered necessary to conduct a new validation activity to provide additional confidence in the present CFD analysis. Measurements made at point locations along a set of horizontal lines across the deck at a height of 50 mm above the deck (equivalent to 10 m full-scale) were compared between CFD and experiment. These lines passed over spots 2–6 with measurements made for a range of flow directions; measurements were also made along vertical lines above each landing spot. The ADV probe was configured to measure three mean components of velocity at each point location, as well as the turbulence intensity in the vertical direction. As discussed previously, the lift configuration is likely to affect landing spot 4 the most. The CFD-experimental comparison is therefore only presented for spot 4.
To provide a visual context for the measurement locations, Fig. 12 shows the measured and computed vertical turbulence intensity superimposed on the ship outline; computed contours of vertical turbulence intensity (Ti w) are also shown. The scale of the ship in Fig. 12 is full-size, the horizontal axis of the graph is 10 m above the deck and passes over spot 4, which is at y = −17.6 m; the axis zero is on the longitudinal centreline of the ship.
Comparison between experimental and computed vertical turbulence intensity on lateral line passing over spot 4.

The agreement between the measured and computed vertical component of turbulence intensity is reasonably good in that the magnitudes of each velocity component are similar for the majority of compared points. It is worth noting that the experimental method averages the flow within a cylindrical volume over the ship deck, which may result in poorer agreement with the CFD results in regions of steep velocity gradients such as shear layers. It can also be seen from the contours that the turbulence is predicted to be highest when the lifts are up, lowest when lifts are down and somewhere in between when the Merlins are on the raised lifts, consistent with the data in Figs. 9 and 10. More comparisons between experiment and CFD along the same lateral line are provided in Figs. 13, 14 and 15, respectively, for the mean velocity components with lift up, lifts down and Merlins on lifts up. Again, the agreement is seen to be reasonably good. As acknowledged earlier, the inflow conditions were different for the CFD and the experiment, but taken together with the extensive validation data provided in Ref. (Reference Watson, Kelly, Owen, Hodge and White5), there is good agreement across the board between the averaged unsteady CFD analysis and the water tunnel experiments, thereby giving confidence in the CFD-generated airwakes that were to be implemented in the flight simulation.
Comparison between experimental and computed mean velocity components for lifts up.

Comparison between experimental and computed mean velocity components for lifts down.

Comparison between experimental and computed mean velocity components for Merlins on lifts up.

3.0 Piloted simulated flight trials
A comparison of the results of the CFD analysis for a G60 40 kt wind with the three lift configurations shows that when the lifts are down, the turbulence over the deck is generally lower than when the lifts are up, particularly in the areas around spots 2 and 4, and the size and location of the recirculation zones behind the islands is also affected. To assess the effect of the modified air flow on helicopter recovery, piloted flight trials were performed in the UoL HELIFLIGHT-R flight simulator in which a test pilot conducted deck landings in G60 wind speeds up to 40 kt. The following sections describe the flight simulation facility, the trial procedure and the results.
3.1 The HELIFLIGHT-R flight simulator
The HELIFLIGHT-R fully reconfigurable research simulator [Reference White, Perfect, Padfield, Gubbels and Berryman17], shown on the left of Fig. 16, consists of a twin-seat crew station housed within a 12 ft diameter visual display dome mounted on a six degree-of-freedom hexapod motion platform with six electric 24-inch stroke actuators. The visual environment, generated by Presagis’ VEGA Prime software, is projected onto the inside of the dome using four digital light processing projectors, each with a resolution of 2,560 × 1,600 pixels, as shown on the right of Fig. 16. The blended images provide a vertical field-of-view of 100° (+30°/-70°) and a horizontal field-of-view of 230° (+120°/-110°). The cockpit instrument panels are displayed via two widescreen monitors, which allow ease of reconfiguration for a variety of aircraft models. The cyclic, collective and pedal controls within the cockpit can also be reconfigured to represent a wide range of aircraft types due to a four-axis electronic control loading system that varies the force-feedback characteristics of each control axis. Loudspeakers are distributed throughout the cabin to provide audio cues to the pilot.
The HELIFLIGHT-R flight simulator.

A generic rotorcraft flight dynamics model, configured to be representative of the SH-60B Seahawk, was integrated with the HELIFLIGHT-R simulator using Advanced Rotorcraft Technology’s FLIGHTLAB software [Reference Du Val and He18]. The Seahawk helicopter model has been employed extensively in past ship-aircraft research at UoL [Reference Watson, Owen and White8, Reference Hodge, Forrest, Padfield and Owen19, Reference Owen, White, Padfield and Hodge20], mainly due the strong validation data available [Reference Howlett21]. The helicopter flight dynamics model within FLIGHTLAB allows local air velocities to be applied at multiple locations, known as Airload Computation Points (ACPs), around the body of the aircraft and the main rotor blades, thereby allowing the CFD-generated airwakes to be integrated with the aircraft’s aerodynamic model. Figure 17 illustrates the process by which the unstructured CFD airwake is integrated with the helicopter flight dynamics model. The raw CFD airwake data, computed at 100 Hz, is first down-sampled to 25 Hz, and interpolated onto a structured grid with 1 m spacing in the region of aircraft operations. The structured airwake is then converted into a series of lookup tables, which allows the time-varying velocities within the airwake to be read by the helicopter model at each of the ACPs. The thirty seconds of airwake data is continuously looped within the simulation. Figure 17 shows the distribution of the ACPs along the main rotor and helicopter body. The airwakes were computed for a wind speed of 40 kt (20.6 m/s) at the height of the ship’s anemometers (as indicated on Fig. 6). The airwake velocities were scaled for the different wind speeds required for the flight trials using a method described in Ref. (Reference Scott, White and Owen22). Real-time flight data was monitored and recorded through FLIGHTLAB during testing which, together with in-cockpit video and audio recordings, were used for post-trial analysis.
Integration of CFD airwake with helicopter flight dynamics model.

3.2 Simulated flight trial
Once the unsteady airwakes for each lift configuration had been integrated into the simulation environment, a series of flight trials were conducted in which an experienced former Royal Navy test pilot performed recovery manoeuvres to the aircraft carrier in a G60 wind to assess the effect of each lift configuration on pilot workload and aircraft performance. The pilot was instructed to land to spots 2, 4, 5 and 6 for each lift configuration using a port-side forward-facing recovery, as shown in Fig. 18, at an initial wind speed of 10 kt. The wind speed was then increased in 5 kt increments until the limits of either pilot workload or aircraft performance were reached. The recovery task was divided into four contiguous Mission Task Elements (MTEs). The mission was initiated with the helicopter positioned off the port side edge of the flight deck and aft of the ship. MTE 1 required the pilot to come up along the port side edge of the flight deck to match the longitudinal position of the landing spot. MTE 2 comprised the lateral translation from off the port side to over the landing spot. For MTE 3 the pilot was instructed to perform a 30-second hover, and MTE 4 was the descent and touch-down onto the flight deck. Having completed the recovery task, the pilot was asked to provide a quantified rating of perceived workload for each of the four MTEs using the Bedford Workload Rating scale [Reference Roscoe and Ellis23], and to provide a rating for the difficulty of the overall landing task using the Deck Interface Pilot Effort Scale (DIPES) [Reference Carico24]. For convenience, the two scales are included in the Appendices.
Port side helicopter recovery to spot 2.

The Bedford Workload Rating Scale (Appendix A) is used to determine the pilot’s perceived workload, defined as the integrated physical and mental effort generated by the perceived demands of a specified piloting task. When considering workload, test pilots naturally think in terms of their spare capacity. In the Bedford Workload Rating scale, the pilot is assessing how much spare capacity they have to complete secondary tasks, such as listening to radio communication or monitoring aircraft systems, in addition to their primary mission task of flying the aircraft. Lower spare capacity results in higher Bedford Workload Ratings. A rating of 1–3 indicates that workload was satisfactory without reduction in spare capacity during the task. Ratings of 4–6 are awarded where although the workload was tolerable for the task, the workload was unsatisfactory leaving little spare capacity for the pilot to conduct additional tasks. A workload rating of 7–9 shows that, while the pilot was able to complete the task, they had little or no spare capacity for additional tasks. A rating of 10 indicates the pilot was unable to provide sufficient effort to the task and it had to be abandoned.
The DIPES (Appendix B) is used to assess the amount of effort required to complete the overall launch and recovery task (note only recovery tasks were considered in this work) and is widely used by the navies of NATO member countries for helicopter/ship clearance trials. As well as pilot workload, DIPES also accounts for aircraft physical control margins and identifies environmental factors such as deck motion and turbulence that affect the amount of pilot compensation required during launch and recovery. It can be used to identify conditions where, although pilot workload may be low, limits in control authority and aircraft performance may be reached. The DIPES is a five-point rating scale, banded into three levels, with higher ratings awarded for more difficult conditions. A DIPES rating of 1–3 indicates an increase in compensation from slight to the highest tolerable for the average fleet pilot. A rating of 4 indicates that the task requires an excessive amount of compensation, making it unacceptable for fleet pilots who would not be able to consistently execute the manoeuvre. A DIPES rating of 5 is reserved for a task in which extreme pilot compensation is required even under controlled test conditions with fully proficient crews. A list of suffixes is also provided with the DIPES, which allows the pilot to specify the causes of increased workload e.g. ‘T’ for turbulence, ‘P’ for pitch control, ‘L’ for lateral positioning.
3.3 Flight trial results
For each recovery, and for G60 wind speeds increasing from 10 to 40 kt, the pilot was asked to award Bedford workload ratings for the four MTEs, and a DIPES rating for the overall landing task. The results presented will first give an overview for several spots and then provide more detailed results for the recovery of spot 4.
3.1.1 Pilot ratings for helicopter recovery
Tables 1–4 summarise the pilot ratings awarded for the landing task to spots 2, 4, 5 and 6. Ratings awarded by the pilot in Tables 1–4 are coloured according to the corresponding DIPES and Bedford workload ratings scales provided in Appendices A and B. Table 1 presents the overall DIPES ratings and the Bedford workload ratings awarded for each MTE when recovering the helicopter to spot 2, for each of the three lift configurations. In a 10 kt wind, the pilot awarded a DIPES rating of 1 for each configuration; however, a decrease in Bedford workload ratings was observed for each MTE when the lifts were raised. In a 20 kt wind, a DIPES rating of 2 was awarded for the lifts raised with the Merlins on deck, in contrast to the DIPES rating of 1 awarded for the lifts raised and lowered, indicating that less effort was required by the pilot when there were no helicopters on the flight deck. At this wind speed, the highest Bedford workload ratings were awarded during hover and landing with the Merlins on deck. A DIPES rating of 3 was awarded by the pilot during recovery to spot 2 in a 30 kt wind for each lift configuration. At 35 kt, a DIPES rating of 4 was awarded, indicating that the operational limit for an average fleet pilot for each configuration for spot 2 in a G60 WOD was 30 kt. Looking across the Bedford workload ratings at 35 kt, it can be seen that while the highest ratings of 9 were awarded for hover and landing with the lifts up, with and without Merlins, the highest rating with the lifts down was awarded during the approach MTE.
Bedford workload and DIPES ratings at spot 2 in a Green 60 WOD (see Appendix B for suffix definitions)

Bedford workload and DIPES ratings at spot 4 in a Green 60 WOD

Bedford workload and DIPES ratings at spot 5 in a Green 60 WOD
Bedford workload and DIPES ratings at spot 6 in a Green 60 WOD

Table 2 presents the results for recovery to spot 4. A DIPES rating of 1 was awarded by the pilot during recovery to each lifts configuration in 10 and 20 kt wind; little variation is also observed for each of the Bedford workload ratings. In a 30 kt wind, the pilot awarded a DIPES rating of 3 with the lifts raised and a rating of 2 for the lifts down and with the lifts raised and Merlins on deck. A DIPES value of 4 was awarded with the lifts up in a 35 kt wind indicating that the wind speed limit for operating to spot 4 with the lifts up is 30 kt. Table 2 shows that a DIPES rating of 4 was awarded by the pilot during recovery to spot 4 with the lifts down and Merlins on deck configurations in a 40 kt wind, indicating a 5 kt increase of acceptable wind speed over the lifts up configuration. Figures 9 and 10 show higher levels of turbulence intensity over spot 4 with the lifts raised compared with the other two configurations, which is consistent with the DIPES ratings awarded. Figure 12 also shows a higher turbulence intensity across the flight deck at spot 4 with the lifts raised and is consistent with the Bedford Workload ratings awarded for MTEs 2 and 3. The Bedford workload ratings show that for each lift configuration, the MTE at which the highest rating was awarded varied, suggesting that the highest contributing factor for the DIPES rating, which limits the operating conditions, occurred at different points along the flight path.
Table 3 shows the results for spot 5. In a 10 kt wind, the DIPES rating of 1 awarded by the pilot was consistent for each configuration; the Bedford workload ratings were also similar across each configuration. While a DIPES rating of 1 was awarded for each configuration in a 20 kt wind, the Bedford workload ratings were consistently higher with the lifts lowered and with the Merlins on deck, compared with the lifts raised. At 30 kt, Table 3 shows that a DIPES rating of 2 was awarded by the pilot for the lifts raised with and without the Merlins on deck compared with a DIPES rating of 3 with the lifts lowered. The corresponding Bedford workload ratings are the same at 30 kt for the lifts raised and lowered while the Merlins on deck resulted in lower Bedford workload ratings during MTEs 3 and 4. In a 35 kt wind, a DIPES of 4 was awarded for the lifts down, while a DIPES rating of 3 was awarded for the other two configurations. The Bedford workload ratings awarded for Merlins on deck were lower than for the lifts up and down during MTEs 1, 3 and 4. At 40 kt, a DIPES rating of 4 was awarded by the pilot for the lifts up, with and without the Merlins on deck, while with the lifts down the task was abandoned as it exceeded the safe limit. The MTEs for which the highest Bedford workload ratings were awarded were MTEs 2 and 3 for the lifts raised, with and without Merlins on deck, and MTEs 3 and 4 with the lifts lowered. Table 3 shows that the maximum operating wind speed at spot 5 in a G60 wind was 35 kt with the lifts raised with and without the Merlins on deck, and 30 kt with the lifts lowered.
Table 4 shows the results for spot 6, located behind the aft island. In a 10 kt wind, a DIPES rating of 1 was awarded for each configuration; however, higher Bedford Workload ratings were awarded for MTEs 3 and 4 with the lifts down compared with the two configurations with the lifts up. At 20 kt, a DIPES rating of 1 was awarded for each configuration. Table 4 shows that in a 30 kt wind, the pilot gave a DIPES rating of 3 during landings with the lifts both raised and lowered, and a DIPES rating of 2 with the Merlins on deck. A DIPES rating of 3 was awarded at 35 kt with the lifts raised. While Bedford Workload ratings of 9 were awarded for both the lifts down and Merlins on deck configurations for MTEs 2 and 4 in a 35 kt wind, a DIPES rating of 4 was awarded with the lifts down and a rating of 3 awarded with the Merlins on deck. At 40 kt, a DIPES rating of 4 was awarded for the lifts up with and without the Merlins on deck. The limiting wind speed with the lifts down was 5 kt lower at 30 kt than when the lifts were raised with and without the Merlins on deck. The Bedford Workload ratings across Table 4 suggest that MTEs 2 and 4 required the highest workload during the total manoeuvre for each lift configuration. A lack of visual cues was identified as a contributing factor for the DIPES rating for each recovery to spot 6 in Table 4 because the front of the ship and the horizon were obscured by the aft island for the latter stages of the manoeuvre. The pilot did not attribute visual cues as a factor for DIPES rating during recoveries to spots 2, 4 and 5.
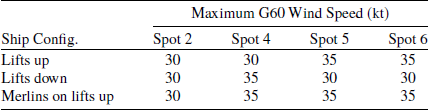
There is a lot of data contained in Tables 1–4, but, as a reminder, the purpose of the study was to assess whether the limiting wind speeds for a safe helicopter landing would be significantly affected if the lifts were lowered, or raised with two helicopters on each lift, compared with the case when the lifts were raised and empty. The limiting wind speed is determined by the DIPES ratings, and the results for the four spots and three lift configurations are summarised in Table 5. While spot 2 appears unaffected, the lifts configuration does affect the limiting wind speeds for spots 4, 5 and 6, by 5 kt. The lower maximum wind speed is for the lifts up configuration at spots 4, while, at spots 5 and 6, it is for the lift down configuration. The DIPES ratings therefore show that the lift configuration does affect the landing task, but this has to be set against other variables, such as local weather conditions, aircraft on deck and pilot judgement. Therefore, although a difference in wind speed limits has been found, this is only one factor in deciding whether the SHOL should be changed for the different lift configurations. The Bedford workload ratings show that the effect of the different lift configurations on the air flow vary along the flight path and are different at each spot. Taken as a whole, therefore, the distribution of the workload experienced by the pilot along the flight path can be expected to change depending on the lift configuration, but the overall difficulty of the landing task is not significantly affected. As can be seen, the limiting wind speeds in a G60 wind have been determined by simulation to be 30 or 35 kt; this can be compared with previous simulated trials results reported in Ref. (Reference Watson, Owen and White8) where, in the headwind, the pilot awarded only a DIPES 2 in a 45 kt wind. Regardless of lift configuration, the G60 wind creates an aggressive airwake and a significantly reduced limiting wind speed compared with a headwind.
Summary of Green 60 wind speed limits for different lift configurations

Additional information on the effect of the airwakes on the helicopter for the three lift configurations can be extracted from the flight test data recorded during each recovery. This process generates a large amount of information, so only the results for spot 4 and a 35 kt wind are presented below, noting that a DIPES rating of 4 was awarded when the lifts were up, and 3 was awarded for the other two lift configurations.
3.3.2 Helicopter flight path for recovery to spot 4
Figure 19 shows the loci of the helicopter’s longitudinal, lateral and vertical positions during recovery to spot 4 for each lift configuration, beginning at MTE 1 aft of and off the port side of the ship through to touchdown on the flight deck. The diamond point on each locus shows the beginning of the traverse across the deck (MTE 2), which occurred approximately 30 s before the hover. The position is recorded at the aircraft’s centre of gravity. It can be seen that while the pilot was able to maintain a relatively smooth traverse across the flight deck to the hover position with the lifts down or with the Merlins on deck, abrupt changes in height were observed during the traverse to the hover position with the lifts raised. During the 30 s hover over spot 4, there are smaller deviations from the chosen hover position with the lifts lowered and with the Merlins on deck. Larger deviations from the chosen hover point are observed with lifts raised, suggesting that the pilot had difficulty maintaining position over spot 4 in the more turbulent air, shown earlier in Figs. 9, 10 and 12.
Helicopter position in a Green 60 wind during recovery to spot 4.

3.3.3 Helicopter attitudes during recovery to spot 4
Figure 20 shows the roll, pitch and yaw displacements of the aircraft during recovery to spot 4 for the three ship geometries in the 35 kt G60 wind. In each graph, the time histories are split by two vertical dashed lines that indicate the start and end of the 30 s hover task (MTE 3). The diamond point on each time history shows the beginning of the traverse across the deck (MTE 2). The traces show how the aircraft experiences higher angular displacements in roll and yaw as it enters the turbulent airwake on approach to the portside station–keeping point at the end of MTE 1, at about −50 s. In contrast, there is much less variation in pitch during all the MTEs. The standard deviations, $\sigma $
, show that highest variation in roll and yaw during hover is for the case with the lifts raised, which is consistent with the increased level of turbulence intensity shown in Figs. 9, 10 and 12, as well as the workload ratings in Table 2 and the flight paths shown in Figure 19.
$\sigma $
, show that highest variation in roll and yaw during hover is for the case with the lifts raised, which is consistent with the increased level of turbulence intensity shown in Figs. 9, 10 and 12, as well as the workload ratings in Table 2 and the flight paths shown in Figure 19.
Aircraft attitudes in a Green 60 wind during recovery to spot 4.

3.3.4 Cyclic control inputs during hover over spot 4
Figure 21 shows the cyclic control activity during the hover task, MTE 3, for which the pilot was asked to maintain a hover position for 30 s over spot 4 in the 35 kt G60 wind for each of the lift configurations. The central graph shows the lateral and longitudinal cyclic displacement from the trim position, while the time histories below and beside show the lateral and longitudinal inputs, respectively; the full cyclic range is ±50% in each axis. To highlight the maximum displacements from the trim position, a broken line box has been used to bound the edge of each dataset. A maximum longitudinal displacement of about ±10% is seen during hover over the spot for the cases when the lifts are lowered and raised with the Merlins on board. In contrast, there is a significantly larger displacement in the lateral cyclic when the lifts are raised. The data are again consistent with the more turbulent air over spot 4 when the lifts are raised, although the recorded longitudinal cyclic displacements are less informative.
Longitudinal and lateral cyclic inputs in a Green 60 wind during recovery to spot 4.

3.3.5 Pedal inputs during helicopter recovery to spot 4
Figure 22 shows the pedal control inputs during the recovery to spot 4 in the 35 kt G60 wind for each lift configuration; full right and left pedals are defined as +50% and -50%, respectively, with the 10% pedal margins shown as horizontal dashed red lines. The pedal input is used to control the yaw of the aircraft by varying the tail rotor thrust and is therefore biased to one side due to the oblique starboard wind. As in Fig. 20, the time histories in Fig. 22 are split by two vertical dashed lines that represent the start and end of the 30 s hover task (MTE 3) and the diamond marker shows the start of the traverse (MTE 2). The standard deviation of the pedal input during the 30 s hover (MTE 3) is also shown in the legend. It can be seen that as the helicopter enters the turbulent airwake, the pilot is required to apply large left pedal inputs of 30% to 40% to maintain heading. During the approach (MTE 1) to spot 4 with the Merlins on deck, the pilot was required to apply larger pedal inputs than the other two ship configurations, which is consistent with the Bedford workload ratings in Table 2. Figure 22 shows that the pilot met the limit of the left pedal during the traverse across the flight deck to the ship with the lifts raised. The pedal input during the 30 s hover shows a larger variation for the ship with the lifts up over the ship with the lifts lowered and the Merlins on deck, which is consistent with the cyclic inputs (Fig. 21), the aircraft roll and yaw attitudes (Fig. 20), and the pilot workload (Table 2) during the hover task (MTE 3). Overall, the higher variation of pedal input during hover, and the excursion into the 5% pedal margin, is consistent with the turbulence intensity in Figs. 9, 10 and 12, and the DIPES ratings presented in Table 2.
Pedal position in a Green 60 wind during recovery to spot 4.

3.3.6 Torque response during helicopter recovery to spot 4
Figure 23 shows the rotor torque response to the pilot’s collective input during the helicopter recovery task to spot 4 for each lift configuration. The pilot uses the collective control input to vary the pitch of the rotor blades to achieve the required thrust from the main rotor. Fluctuations in incident air speed and direction will affect the lift generated by the rotor blades, and the power input must be adjusted accordingly, thus affecting the rotor torque. The two vertical dashed lines again denote the start and end of the 30 s hover task, MTE 3, while the horizontal dashed line indicates the 100% torque limit. The diamond markers show when the pilot began the translation across the flight deck to the hover position, MTE 2, and the legend shows the standard deviations of the torque time histories during the 30-second hover, MTE 3. Figure 23 shows that when the aircraft encounters the airwake as it comes along the portside edge of the flight deck, there is an increased variability in the rotor torque. The recovery to spot 4 with the lifts raised produced significantly greater variations in torque throughout the manoeuvre, and an over-torque is observed just before the start of the translation across the flight deck, MTE 2. While significant variations in torque were also observed with the lifts down and the Merlins on deck, no over-torque was observed, and the standard deviations of the fluctuating torque were lower. The larger variation in torque response with the lifts raised is consistent with the higher values of turbulence intensity shown in Figs. 9, 10 and 12, as well as the DIPES ratings in Table 2 and the pilots’ cyclic (Fig. 21) and pedal control inputs (Fig. 22).
Torque pilot inputs in a Green 60 wind during recovery to spot 4.

4.0 Concluding comments
Every combination of UK naval ships and helicopters undergoes clearance trials to determine the limiting wind speeds for launch and recovery. The SHOL trials are normally conducted when a new ship or aircraft enters service. They are time-consuming, expensive and onerous to organise; they cannot easily be repeated, and it is important that they can be relied upon. The concern behind the research presented in this paper was that because the lift configurations on the Queen Elizabeth class aircraft carriers can significantly alter the geometry of the starboard side of the ship, there was a possibility that the established SHOL could be affected, particularly for starboard winds, which, because of the two large islands, are also the winds that create the most turbulence over the flight deck. Therefore, the air flow over the flight deck of the QEC was investigated through a small-scale experiment and CFD. Of the oblique winds tested, G60 winds were deemed to be the most likely to affect a helicopter during its recovery to the designated landing spots, so a detailed CFD study of the air flow in a 40 kt G60 wind was conducted. To assess how the air flows for the different lift configurations affect a helicopter landing on the flight deck, piloted flight simulation trials were carried out in which a test pilot conducted deck landings for a generic helicopter in G60 winds with speeds from 10 to 40 kt.
Of the three lift configurations tested, it was shown that when the lifts are in the raised position, with no aircraft on the lifts, the turbulence over the flight deck was generally higher than when the lifts were lowered, or when the lifts were raised with two helicopters on the platform, particularly in the areas around spots 2 and 4. The DIPES ratings awarded by the pilot showed that the G60 wind speed limit across all spots and lift configurations was 30 or 35 kt. Putting this result alongside the results of a previous simulated trial in which DIPES ratings of 2 were awarded by a test pilot for landings in a 45 kt headwind [Reference Watson, Owen and White8], it can be seen that G60 is a challenging wind direction. Overall, the distribution of the workload experienced by the pilot along the flight path was different for the different lift configurations, but the difficulty of the landing task was not deemed to be sufficiently affected to require different limiting wind speeds for the different lift configurations.
Acknowledgements
The authors acknowledge the ongoing support from ANSYS U.K., Ltd. The authors acknowledge the support of QinetiQ in developing the experimental program. The authors would like to thank Charlie Brown, a former Royal Navy test pilot, for professionalism, skill and input during the simulation flight trials.
Appendix A. The Bedford Workload Rating Scale

Appendix B. The Deck Interface Pilot Scale (DIPES)


 Open access