

Introduction
In the United States, motor vehicle crashes are a leading cause of death for young people, accounting for approximately one-third of all fatalities for youth ages thirteen to nineteen. 1 In 2023 — the most recent year data are available — 2,148 fifteen- to twenty-year-olds died in traffic crashes, a 5 percent increase from 2022. 2 Young drivers accounted for 8.9 percent of all drivers in fatal traffic crashes in 2023 but represented only 5.1 percent of all licensed drivers in 2023. 3 Teenage drivers are not only a risk to themselves but are responsible for the largest proportion of deaths to passengers, occupants of other vehicles, and pedestrians and cyclists relative to any other age group.Reference Tefft 4 Further, injuries and deaths resulting from crashes involving a teenage driver account for an estimated $4.6 billion in lifetime medical costs and productivity losses.Reference Blincoe 5
To address these risks, US states require teenagers to complete three distinct but related steps. The first is driver education, which is required for teenagers below the age of eighteen in most states.Reference Ehsani 6 This is typically completed before a teenager receives a permit to begin driving under supervision. The second is to progress through a graduated driver licensing (GDL) system, which introduces driving privileges in three stages: (1) Learner’s Permit — supervised driving with a licensed driver for a required number of hours; (2) Intermediate License — unsupervised driving with restrictions on nighttime driving and passengers; and (3) Full Licensure — unrestricted driving privileges. 7 The third step requires passing both a knowledge and skills examination before obtaining their driver’s license. The purpose of this paper is to discuss the potential of these examinations to prepare young drivers to drive safely and describe the progression of a cohort of new drivers in Washington State as they advanced through the driver examination process.
Driver examinations are a state responsibility and were first introduced in the United States in Rhode Island in 1913. 8 In the following decades other states begin requiring them, with the knowledge and skills exams becoming law in Washington in 1937. 9 Prior to this, obtaining a driver’s license in Washington required ten days of driving experience and two signatures verifying that the driver was “experienced, careful and free from any infirmities or personal habits that would impair his ability to drive safely.”Reference Sermonti 10 Currently, the Washington knowledge and skills examinations are conducted sequentially, in two steps. The first step is a knowledge exam that assesses understanding of laws of the road and how to safely respond to challenging road situations. For example, in Washington, this includes items such as “Approaching an intersection with a ‘Yield’ sign you should:” with multiple-choice responses. The second phase is the skills exam, which typically involves a driving examiner assessing a driver’s ability to maneuver a vehicle and drive safely in traffic. In Washington, this includes assessing maneuvers such as a driver’s ability to park and stop on a hill, as well as a drivers’ ability to safely navigate common traffic situations, such as travel through an uncontrolled intersection. In Washington, both the knowledge and skills exams incur a fee, which varies depending on the location and the services being provided. At the time of writing, the knowledge exam ranges between $35 and $40, and the skills exam could cost $60–$100, depending on whether the applicant uses their own car or a school car. 11
Given that all states require the passing of the knowledge and skills exam in some form,Reference Ehsani 12 there is a surprising lack of evidence that these exam requirements improve new driver safety and reduce crash risk. A search of the literature revealed only one peer-reviewed publication related to the knowledge exam: an evaluation conducted over forty years ago in Virginia that found a revised version of the state’s knowledge exam was associated with a slight reduction in crashes.Reference Boufous 13 Although more recent, the only research identified focusing on the skills exam is a 2011 study that found no correlation between the perceived difficulty of a state’s exam and fatal crash outcomes. 14 Driving exams have been adopted and continue to be required despite little to no research to understand the progression of individuals through the system or support that should be included. Rather, the state of practice related to driver examination policies in the United States appears to be the face validity of their current approaches and the legacy of having always conducted the exams in this way.Reference Ehsani 15 This may also reflect a lack of consensus about the purpose of driving exams. While the public health community might demand or expect some evidence of effectiveness in terms of safety outcomes, state officials may perceive the primary role of the exams as enabling mobility, as they serve as the gateway to independent driving.Reference Ehsani 16 This is partly a legacy of a car-centric transportation system that has evolved in the United States.Reference Norton 17
Despite knowledge and skills exams being required for all new drivers in the United States, little is known about the progression of people through the driver examination process. To date, no research has been conducted on the proportion of individuals who pass from one stage of the driver examination process to the next compared to those who fail and are required to be reexamined. The following study looks at the progression of a cohort of new drivers in Washington State as they advance through the driver examination process.
Methods
From July 15 to September 30, 2024, teenagers enrolled in driver education courses at seven driver training schools in Washington state, where driver education is a prerequisite for eligibility to complete the knowledge and skills exam. In Washington, driver education includes 30 hours of classroom instruction and 6 hours of in-car training and observation time with an instructor. 18 Study participants gave consent to researchers to access their driving records through the Washington Department of Licensing, Endorsements, and Traffic Safety. Participants also completed a baseline where they provided demographic and household information. The analysis was limited to students who took the knowledge exam at least once. Based on this, the proportion of those who passed the knowledge and skills exams in relation to their attempts were calculated. Differences in proportions across demographic groups were examined using chi-squared tests. All analysis was completed using R 4.5.1. 19 The Johns Hopkins Bloomberg School of Public Health Institutional Review Board approved this study (IRB00025991).
Results
Out of 3,069 eligible students, 2,604 participated in the study, resulting in a linkage rate of 85 percent. Of these, 2,393 students took the knowledge exam, the first step towards licensure. Our results below are limited to this sample of 2,393 students.
The knowledge exam was the component with the highest failure rate and highest number of repeat completions. 2,393 students completed the knowledge exam at least once, with a total of 3,447 exams recorded. Two-thirds (67 percent or 1,610 students) passed the knowledge exam on their first attempt compared with 74 percent passing the skills exam on the first attempt (1,768 students). Table 1 presents the counts of students based on their number of attempts. The knowledge exam exhibited higher mean and standard deviation values for the number of attempts, suggesting greater variability in the number of times the exam was taken, and a right-skewed distribution indicating a higher frequency of students failing exams and needing to retake them. This is further reflected in the proportion of participants who attempted the exams multiple times — nearly 4 percent of those who completed the knowledge exam required 4 or more attempts to pass compared to less than one percent of those completing the skills exam.
Participant-Level Distribution Statistics of Knowledge and Skills Exam Attempts

Pass Rates by Demographic Characteristic and by Exam
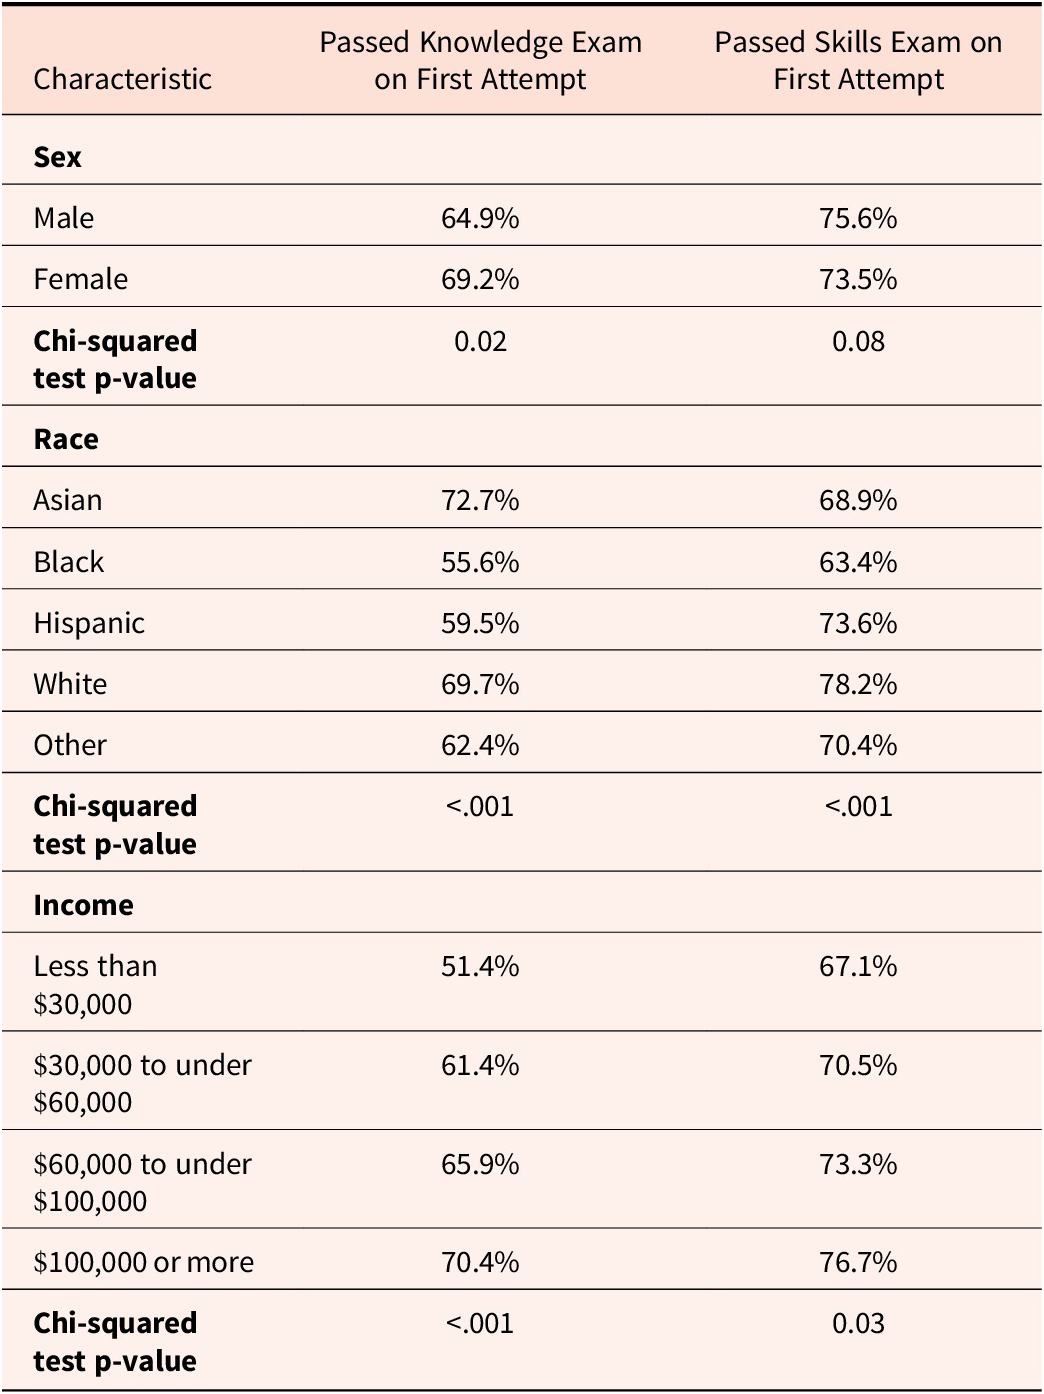
Figure 1 presents the distribution of exam attempts for students who passed, using a cumulative frequency plot. The figure illustrates the incremental increase in the proportion of students passing after each successive attempt, highlighting differences in performance between the two exam types. Nine out of ten students (90%) passed the knowledge exam within the first two attempts. For the skills exam, the cumulative proportion of students passing rises sharply after the first and second attempts, with 98% passing within two attempts.
Cumulative frequency plot for exam attempts, by exam type.

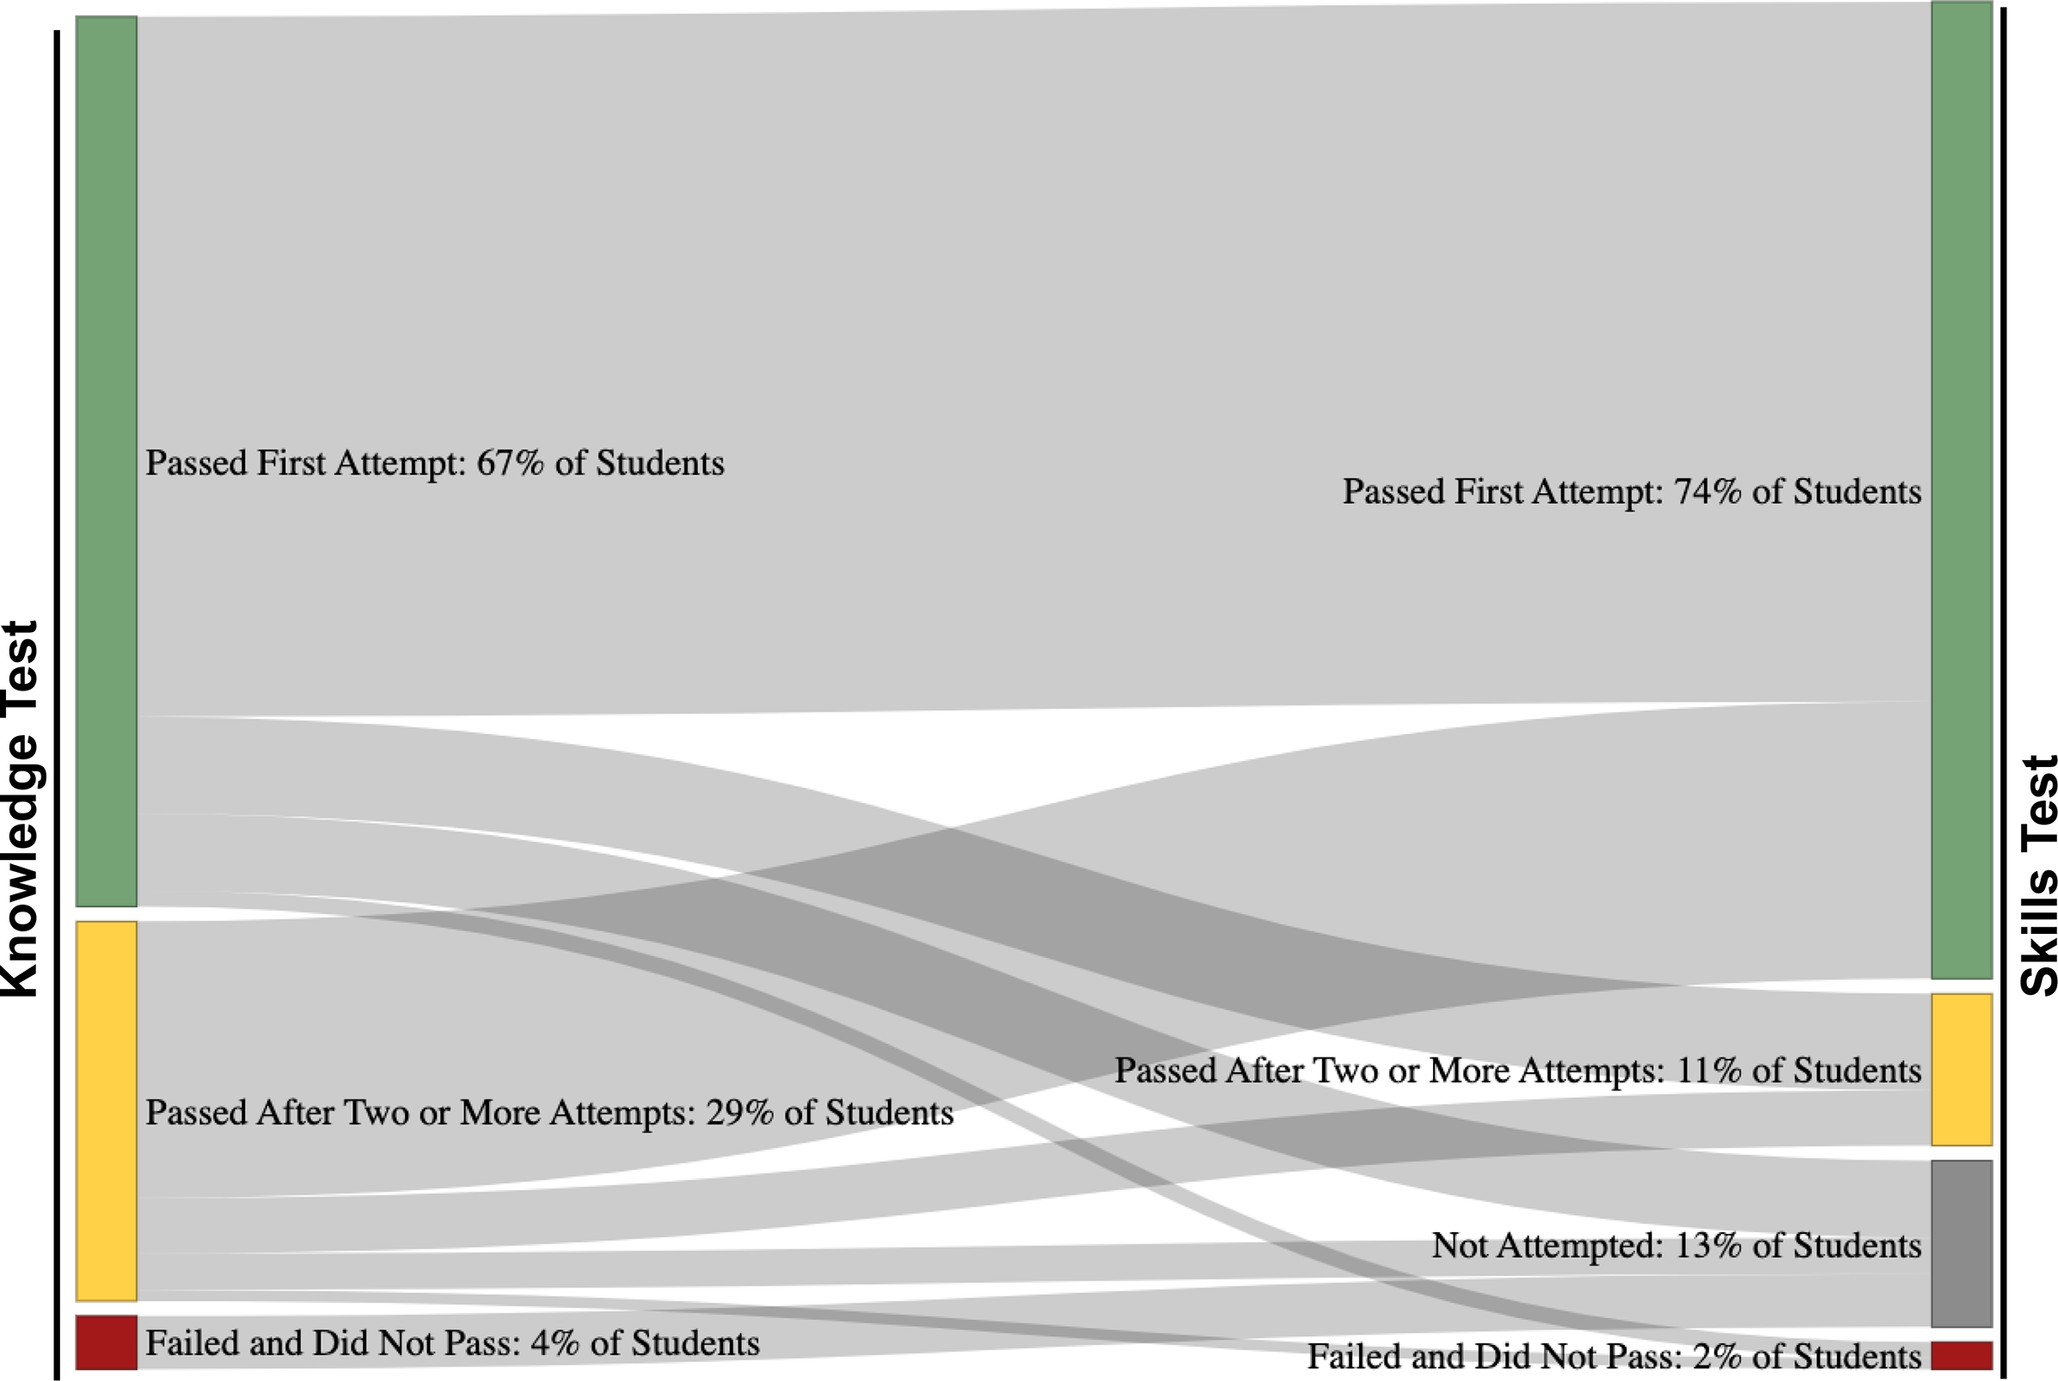
A total of 1,267 students passed the knowledge and skills exam without repeating any step, representing 53 percent of participants. Of those who passed the knowledge exam on their first attempt and subsequently took the skills exam, 86 percent passed the skills exam on their first attempt. The pass rate declined to 81 percent for students who failed the knowledge exam at least once before completing the skills exam. Figure 2 illustrates the flow of participants through the driver licensing process, including the knowledge and skills exams, using a Sankey diagram.
The proportion of participants who passed, failed, or did not attempt the knowledge or skills exam.
Analysis of the pass rates by demographic characteristics revealed significant differences in the knowledge test pass rates by gender, race, and income as well as significant differences in the skills exam by race and income. The proportion of those who passed the knowledge test on the first attempt was significantly higher among females (69.2%) compared to males (64.9%). For the skills exam, males (75.6%) had a slightly higher pass rate compared to females (73.5%), although this did not reach statistical significance. For both the knowledge and skills exam, the pass rate was significantly higher for those identifying as white compared to nonwhite (69.7% and 64.1% for the knowledge exam, and 78.2% and 69.9% for the skills exam, respectively). When considering additional race categories, Asian students had significantly higher pass rates than other groups for the knowledge test while Black students had significantly lower pass rates than other groups for both the knowledge and skills test. By income level, the proportion of those passing on the first attempt for both the knowledge and skills exam significantly increased as household income increased. Comparing the lowest income level (households earning less than $30,000) to the highest (households earning $100,000 or more), the difference in pass rates on the first attempt for the knowledge exam was 51.4% compared to 70.4% respectively. For the skills exam, the proportion of those who passed on the first attempt was 67.1% for the lowest income level compared to 76.7% among the highest income level.
Discussion
The purpose of this study was to describe the progression of a cohort of new drivers in Washington State as they advance through the driver examination process. Slightly over half the participants pass both the knowledge and skills exams on their first attempt. The remainder fail each step one or more times. Notably, the skills exam has a higher rate of teens passing within the first two attempts (98%) compared to the knowledge exam (90%). This corresponds to data from Australia where 97% of teenagers pass their skills exam after two attempts.Reference Boufous 20 To the best of the authors’ knowledge, this is the first time pass and fail rates have been documented from a US state.
The data from Washington suggest that the overwhelming majority of new drivers pass both the knowledge and skills exams after two attempts. The fact that approximately one-third of new drivers crash in their first year of drivingReference Chapman 21 suggests that the full safety potential of the knowledge and skills exams are not being realized. Skills and knowledge exams could advance safety in several ways. First, they could serve a gatekeeping function to keep the highest risk drivers from advancing to licensure. Second, challenging exams could motivate increased study and practice, as reflected in the adage, “you practice to the test.” Consequently, revisions to the licensure exam process would require changes in how driver education is structured and delivered. Third, the exams can serve as a developmental opportunity, where failing either the knowledge or skills exam could represent an opportunity for novice drivers to identify their strengths and weaknesses, guiding improvement.Reference Ehsani 22
The specific ways to update the exams should begin with the scientific evidence of what is effective at reducing crash risk, while being grounded with pragmatic considerations such as exam duration. Safety advocates have argued that more challenging driving exams will require more preparation and practice and lead to licensure delay. 23 More difficult skills exams may also be able to identify people not yet ready to drive on public roads and require them to retake the on-road exam after a set period. Accommodations need to be in place for those requiring practice examinations or driving instruction to prepare for the new exams. Recent legislation in Washington that provides vouchers for students who are below a certain income level to receive subsidized driver education is one example of policies that could be implemented to address the needs of these populations. 24
A challenging exam with a lower pass rate cannot be an end in itself, as introducing a more challenging exam that does not result in safety outcomes will unnecessarily create barriers to getting a driver’s license. For example, a hazard perception test is required in several Australian states and the United Kingdom.Reference Ehsani 25 Well-designed hazard perception tests can discriminate between high- and low-risk road-user groups,Reference Horswill 26 and failing the test will therefore restrict an individual who is a higher-risk road user from independent driving. Hazard perception training has been shown to improve novices’ performance,Reference Grayson and Sexton 27 and should be encouraged not only to practice for passing the hazard perception test, but to improve safety outcomes. Boufous et al (2011) found that failures on the hazard perception exam were significantly associated with an elevated crash risk.Reference Boufous 28 These findings highlight an opportunity to incorporate evidence-based examinations that are associated with safety outcomes. If effective tools such as hazard perception testing are identified and integrated into the licensing process, they could become key components of driver education curricula and areas of focused preparation for students seeking a license.
To design and implement knowledge and skills exams that are scientifically sound and related to safety outcomes, it will be essential to engage an array of key stakeholders in the process of change. These include state regulators, the driver instructor and educator community, public health professionals, law enforcement, safety advocates, and the public — including teenagers and their families, but more generally all road users who are impacted by driving and safety standards that states require for novice drivers. Designing a driver licensing exam that is predictive of safety outcomes is a formidable challenge. Expertise is needed in theories of learning and skill development, driving exam development, and scoring methods. Collaboration between practitioners and researchers in these fields — other key stakeholders in the driver education and licensing process — is essential for designing, piloting, evaluating, implementing, and continuously monitoring and reassessing the existing standards and exams for licensure. This includes researchers with detailed knowledge of experimental methods, particularly of longitudinal designs that can assess long-term post-exam behavioral outcomes.
Future research on this topic will need to assess the relationship between performance on knowledge and skills exams and their relationship to safety outcomes, including crashes and citations. Linking safety data to performance on individual knowledge exam questions and specific driving maneuvers in the skills exam will be critical to generating recommendations for establishing evidence-based exam components. Hazard perception testing also represents an opportunity to integrate scientifically sound driver assessments into the driver examination process. The time to rethink how the knowledge and skills exams can be more directly linked to safety outcomes is now.
Disclosures
The funding to conduct the primary data collection that this manuscript is based on was supported by the Behavioral Traffic Safety Cooperative Research Program of the Transportation Research Board (BTS 16-SUB0001773).


 Open access