


Introduction
Magnetite, (Fe3O4), is typical of the early potassic alteration stages of evolution in iron-oxide copper-gold (IOCG) deposits (Barton, Reference Barton2014 and references therein). Several genetic models, in which fluids are derived from diverse sources (magmatic, surficial/basinal, metamorphic and combinations thereof) have been proposed (Barton, Reference Barton2014). A subclass of the IOCG deposit clan, containing magnetite and apatite, so-called iron oxide apatite (IOA) deposits, was proposed as a Cu-poor member of the Kiruna-type deposit group (Williams et al., Reference Williams, Barton, Johnson, Fontbote, De Haller, Mark, Oliver and Marshik2005).
Magnetite is a member of the spinel group (Biagioni and Pasero, Reference Biagioni and Pasero2014) which forms over a wide range of temperatures spanning almost all geological environments. Magnetite is also a refractory mineral that displays an extensive range of textures, mineral inclusions and geochemical trends. When studied across different scales of observation, magnetite represents a powerful tool to recognise igneous versus hydrothermal signatures and thus provide insights for interpretation of deposit evolution in space and time. In Precambrian terranes with protracted geological histories, distinguishing between protolith- and IOCG-derived signatures of magnetite is of paramount importance.
Recent studies of magnetite from IOCG deposits worldwide have shown that correct interpretation of geochemical trends is a far from trivial task. The ranges of trace and minor elements present at measurable concentrations in Fe-oxides are typically varied, typically reflecting the transition from a magmatic to a hydrothermal regime (Knipping et al., Reference Knipping, Bilenker, Simon, Reich, Barra, Deditius, Wälle, Heinrich, Holtz and Munizaga2015). The presence of sub-micron scale inclusions in magnetite can lead to misinterpretation of geochemical trends, necessitating detailed nanoscale characterisation (Deditius et al., Reference Deditius, Reich, Simon, Suvorova, Knipping, Roberts, Rubanov, Dodd and Saunders2018; Ciobanu et al., Reference Ciobanu, Verdugo-Ihl, Slattery, Cook, Ehrig, Courtney-Davies and Wade2019, Reference Ciobanu, Verdugo-Ihl, Cook, Ehrig, Slattery and Courtney-Davies2022; Huang and Beaudoin, Reference Huang and Beaudoin2021; Verdugo-Ihl et al., Reference Verdugo-Ihl, Ciobanu, Cook, Ehrig, Slattery, Courtney-Davies and Dmitrijeva2021; Huang et al., Reference Huang, Beaudoin and Yang2022; Campo-Rodriguez et al., Reference Campo-Rodriguez, Ciobanu, Slattery, Cook, Schutesky, Ehrig, King and Yao2024a).
Magnetite is the dominant Fe-oxide throughout the Neoarchean IOCG deposits from the Carajás Province, Brazil (Schutesky and Oliveira, Reference Schutesky and Oliveira2020). The Carajás Province comprises Archean greenstone-granite terranes formed during multiple tectonothermal events (Fig. 1a) and hosts many IOCG deposits with complex magmatic-hydrothermal evolution. In this context, magnetite is one of the key pathfinders for decrypting mineralising history. For example, polysomatic intergrowths between amphibole and non-classical pyriboles (NCPs) in magnetite from the Jatobá IOCG deposit, SE Carajás Province, were interpreted as evidence for a prolonged geological history from a mafic-ultramafic protolith to superimposed alkali-calcic, REE-bearing alteration (Campo-Rodriguez et al., Reference Campo-Rodriguez, Ciobanu, Slattery, Cook, Schutesky, Ehrig, King and Yao2024a). Several other studies have emphasised the importance of microtextural and geochemical signatures in magnetite from IOCG deposits in the Carajás Province (Huang and Beaudoin, Reference Huang and Beaudoin2019; Reference Huang and Beaudoin2021; Campo-Rodriguez et al., Reference Campo-Rodríguez, Schutesky, de Oliveira and Whitehouse2022; Huang et al., Reference Huang, Beaudoin and Yang2022; Mansur et al., Reference Mansur, Dare, Ferreira, Miranda and Monteiro2023).
(a) Geological map of the Carajás Domain indicating the main tectono-structural units (modified from Tavares et al., Reference Tavares, Trouw, da Silva, Justo and Oliveira2018). Location of the Carajás Domain within the Amazonian Craton shown in inset. (b) Simplified geological map of the Jatobá-Sossego-Sequeirinho-Pista orefield (modified after Veloso et al. (Reference Veloso, Monteiro and Juliani2020). (c) Geological cross-section A–B depicting drillhole DH00032 intersecting copper mineralisation. MS – magnetic susceptibility.

In this contribution, we link micron- to nano-scale observations to constrain textural and geochemical changes recorded by magnetite from mafic/ultramafic host rocks to sulfide mineralisation. The objective is to decipher the protracted history of the fluid–rock interaction that defines the IOCG system in a shear-zone setting at Jatobá. The results have implications for understanding the role and utility of magnetite in other IOCG systems from the Carajás Province or elsewhere.
Geological background
The Carajás Province (CP) is part of the Amazonian Craton and comprises two tectonostratigraphic domains: the Carajás Domain (CD) to the north; and the Rio Maria Domain (RMD) to the south, collectively making up the Carajás Mineral Province (CMP; Vasquez et al., Reference Vasquez, Rosa-Costa, Silva, Ricci, Barbosa, Klein, Lopes, Macambira, Chaves, Carvalho, Oliveira, Anjos and Silva2008; Fig. 1a). Distinct metallogenic trends are recognised in each domain, whereby the RMD comprises Mesoarchean lode-Au deposits, Neoarchean IOCG deposits and Paleoproterozoic Cu-Au ores are the main expression of mineralisation in the CD (e.g. Costa et al., Reference Costa, Santos, Serafim, Costa and Roopnarain2020). Further detail of the geochronology, metallogeny and tectonic evolution of the CMP was given by Trunfull et al. (Reference Trunfull, Hagemann, Xavier and Moreto2020).
The Mesoarchean basement of the CD has a Neoarchean volcano-sedimentary cover and Paleoproterozoic sedimentary cover (Fig. 1a; e.g. Tavares et al., Reference Tavares, Trouw, da Silva, Justo and Oliveira2018; Costa et al., Reference Costa, Santos, Serafim, Costa and Roopnarain2020). The basement comprises TTG (Trondhjemite–Tonalite–Granodiorite) rocks (mainly gneisses, migmatites and granulite from the 3–2.83 Ga Xingu Complex) and greenstone belts of the Sequeirinho Group (3–2.9 Ga); these units are intruded by calc-alkaline granitoids such as the Cruzadão Granite (ca. 2.87 Ga) (Tavares et al., Reference Tavares, Trouw, da Silva, Justo and Oliveira2018 and references therein). The Neoarchean cover is made up of volcano-sedimentary sequences of the Itacaiúnas Supergroup (2.76 and 2.73 Ga; DOCEGEO, 1988), for which many divisions are described, but with the stratigraphic correlation between them, at present, only poorly resolved.
One of the major divisions in the Itacaiúnas Supergroup is the Grão Pará Group, host to the Jatobá deposit. The Parauapebas Formation of the Grão Pará Group is constrained by U-Pb zircon age determination of rhyodacites/rhyodacite (ID-TIMS; 2759 ± 2 Ma; Machado et al., Reference Machado, Lindenmayer, Krogh and Lindenmayer1991) and basaltic rocks (SHRIMP; 2745 ± 5 Ma; Martins et al., Reference Martins, Toledo, Silva, Jr, Santos and Assis2017).
Both an intra-plate rift model (Olszewski et al., Reference Olszewski, Wirth, Gibbs and Gaudette1989; Tavares et al., Reference Tavares, Trouw, da Silva, Justo and Oliveira2018 and references therein) and a subduction-related setting (Costa et al., Reference Costa, Santos, Serafim, Costa and Roopnarain2020 and references therein) are proposed for deposition of the Itacaiúnas Supergroup. Although Martins et al. (Reference Martins, Toledo, Silva, Jr, Santos and Assis2017) showed petrological evidence to support a back-arc continental basin, those authors conclude that a rift setting is more plausible, suggesting slab breakoff and subsequent asthenosphere upwelling.
Completing Neoarchean igneous activity in the CD are bimodal intrusions comprising: (1) mafic-ultramafic rocks of the Luanga Complex (2763 ± 6 Ma; Machado et al., Reference Machado, Lindenmayer, Krogh and Lindenmayer1991) and its equivalents; and (2) syn-tectonic/A-type granites of the Estrela Granite and equivalents (Tavares et al., Reference Tavares, Trouw, da Silva, Justo and Oliveira2018).
The Carajás Domain has a linear E–W-trending belt-like morphology (also called the Itacaiúnas Belt; Araújo et al., Reference Araújo, Maia, João and Costa1988), thus contrasting with the dome-and-keel structure of the RMD (Costa et al., Reference Costa, Santos, Serafim, Costa and Roopnarain2020). The prominent Cinzento Shear Zone, a strike-slip system in the north of the CD, which branches into the Carajás Shear Zone (Fig. 1a), outlines a central sigmoid domain, defined by formations of the Carajás Basin. The Canaã dos Carajás Shear Zone is the main tectonic structure in the south of the CD and links with the Carajás Shear Zone. IOCG mineralisation is distributed across two belts, northern and southern (Xavier et al., Reference Xavier, Monteiro, Moreto, Pestilho, de Melo, da Silva, Aires, Ribeiro, Silva, Hedenquist, Harris and Camus2012), with most deposits clustering along the major tectonic structures.
The succession of multiple deformation regimes throughout extensional–compressional cycles from the Archean to Neoproterozoic-Cambrian is extensively debated in the Brazilian literature (Tavares et al., Reference Tavares, Trouw, da Silva, Justo and Oliveira2018). Nevertheless, most authors agree that the Itacaiúnas Belt inherits Mesoarchean structural patterns and was overprinted during the 2.14 to 1.94 Ga Transamazonian Orogeny and again by brittle reactivation at 1.88 Ga associated with emplacement of the Uatumã Supergroup (Antonio et al., Reference Antonio, D'Agrella-Filho, Nédélec, Poujol, Sanchez, Dantas, Dall'Agnol, Teixeira, Proietti, Martínez Dopico, Oliveira, Silva, Marangoanha and Trindade2021).
Deposit geology
Jatobá is one of four IOCG deposits within an orefield, 10 km2 in area, along the southern Copper Belt (Fig. 1b). All four deposits are located along E–W structures belonging to the Canaã dos Carajás shear-zone system, but only Jatobá is hosted within the Neoarchean Grão Pará Group. Pista (historical mine), Sossego and Sequeirinho (355 Mt @ 1.1% Cu, 0.29 g/t Au) are open pits along an E–W alignment, each with distinctive morphology and structure. Jatobá, located 3 km north of Sossego Mine, comprises 30 orebodies containing Cu-Ni mineralisation. No resource estimate is available for the Jatobá deposit, which remains under evaluation (Veloso, Reference Veloso2017). Copper-Au ore zones of the Sequeirinho-Pista system are located at the contact between Neoarchean gabbronorite and Mesoarchean granitoids/felsic metavolcanics. Mineralisation age has been determined to be between 2712 Ma (U-Pb monazite; Sequeirinho) and 2710–2685 Ma (Re-Os molybdenite; Pista) (Moreto et al., Reference Moreto, Monteiro, Xavier, Creaser, Dufrane, Melo, Silva, Tassinari and Sato2015). The Sossego orebody, at 1904–1879 Ma (U-Pb monazite) is hosted within older (2740 Ma) granites (Moreto et al., Reference Moreto, Monteiro, Xavier, Creaser, Dufrane, Melo, Silva, Tassinari and Sato2015).
The Jatobá deposit lies north of a major fault/thrust zone between Mesoarchean mafic/ultramafic rocks and Neoarchean bimodal volcanic sequences of the Grão Pará Group (Fig. 1b). At this location, a 1–2 km-thick interval of felsic volcanic rocks (rhyolite and dacites) is separated from the main body of dominantly mafic lithologies hosting the Jatobá deposit by a major E–W fault. Several gabbroic lenses occur throughout the volcanic rocks following lineaments orientated similarly to the faults (Fig. 1b). Other subdivisions in the mafic sequence include diabase and tuffs. The contacts between lithologies are sub-vertical and the orebodies occur as narrow zones up to ∼20 m in thickness roughly parallel to such contacts (Fig. 1c).
Orebodies can be located within the basalt/diabase sequence (0.5% Cu) (samples studied here) and/or within andesites (0.33–0.775% Cu). In both cases, Cu grades correlate with the presence of magnetite, which, as the mineralisation contains only minor pyrrhotite, is proven by magnetic susceptibility that is highest in the basalt-hosted mineralisation (Fig. 1c). Nanoscale characterisation of magnetite from the basalt-hosted orebody (samples from drillhole DH00032, the same as studied here; Fig. 1c) shows various degrees of brecciation and mottling with respect to chain-silicate inclusions (Campo-Rodriguez et al., Reference Campo-Rodriguez, Ciobanu, Slattery, Cook, Schutesky, Ehrig, King and Yao2024a). The authors show that these inclusions consist of Mg-(Fe)- and (Ce)-calcic amphiboles, both displaying complex polysomatic intergrowths with non-classical pyriboles (NCP). The formation of Mg-(Fe)-amphiboles + NCPs is attributed to ocean floor metamorphism whereas calcic amphiboles are ascribed to the onset of the IOCG system. Ferro-tschermakite (no NCPs) is also identified among the calcic amphibole inclusions in magnetite. High-pressure conditions at ∼7.5 kbar are suggested for magnetite formed during main ore deposition based on ferro-tschermakite geobarometry.
The discovery of platinum-group minerals (PGM) associated with Ni-bearing sulfides in a basalt-hosted orebody at Jatobá is linked to either an initial VHMS-mineralisation in the host basalts or to IOCG-type fluids that leached Ni + PGE from komatiites within the sequence/ultramafic rocks in the basement (Campo-Rodriguez et al., Reference Campo-Rodríguez, Cook, Ciobanu, Schutesky, King, Gilbert and Ehrig2024b). Deformation during metamorphism is inferred based on annealing textures in pyrite and other microtextural fabrics. Lu-Hf age determination of apatite from the Jatobá orebody supports this interpretation. These new data (Campo-Rodriguez et al., Reference Campo-Rodriguez, Ciobanu, Gilbert, Wade, Cook, Schutesky and Ehrig2025) indicate metamorphism at ∼2.5 Ga associated with deep shear zones in the southern Copper Belt of the Carajás Domain.
Previous work on a suite of samples from eight drillholes (Veloso, Reference Veloso2017; Veloso et al., Reference Veloso, Monteiro and Juliani2020) used mineral compositions to address the link between “hydrothermal nickel mineralisation and IOCG systems in the Carajás Province”. Veloso et al. (Reference Veloso, Monteiro and Juliani2020) described the deposit as hosted by “Itacaiúnas rhyodacites and felsic volcaniclastic breccias in the footwall zone and amygdaloidal basalts associated with mafic tuffs in the hanging wall”. It is, however, unclear where the felsic lithologies referred to as metarhyodacites occur because the cross-section through a ∼250 m wide ore zone is not located.
Veloso et al. (Reference Veloso, Monteiro and Juliani2020) interpreted eleven hydrothermal alteration stages overprinting host lithologies, a protolith defined by an assemblage of andesine + actinolite and accessory Ti-rich magnetite. These stages are considered in a generic zonal IOCG footprint (Barton, Reference Barton2014) but with index mineralogy following the scheme introduced for the Great Bear zone, Canada (Corriveau et al., Reference Corriveau, Montreuil and Potter2016). The proposed stages are divided into pre-tectonic and syn- to late-tectonic, with a range of ductile to brittle structures spanning all stages. The resultant model shows a lateral zonation centred on the mineralised zone with potassic alteration (biotite). Two spatially distinct parts are identified: (i) upper epidote-chlorite + Cu-mineralisation; (ii) lower (actinolite) + Cu-Ni mineralisation. Veloso et al. (Reference Veloso, Monteiro and Juliani2020) define two lateral zones of sodic alteration: proximal (scapolite + hastingsite) and distal (albite + scapolite + quartz + magnetite + biotite). We note that magnetite occurs throughout, except in the proximal scapolite + hastingsite zone. Seven amphibole species are recognised: actinolite; hornblende; hastingsite; ferro-tschermakite; cannilloite; and pargasite from the calcic group and cummingtonite from the Fe-Mg amphibole group. These amphiboles are claimed to form commencing with actinolite in the precursor rock and continuing through to the hydrothermal stages. Other minerals, such as Cl-bearing fluorapatite, are products of both the pre-tectonic and mineralisation stages. Potassic feldspar appears in the pre-tectonic and late tectonic stages, whereas chlorite is produced by late, retrograde alteration concentrated in the upper part of the mineralised zone. Altogether, the mineralisation style evolved from replacement fronts, such as amphiboles showing replacement as core–rim zonation, generation I by generation II or biotite, etc., controlled by the mylonitic foliation, to hydraulic breccia zones.
Samples and analytical methods
The sampled interval from drillhole DH00032 (10 samples across ∼ 400 m) comprises micro-folded, fine-grained metabasalts intercalated with diabase units (Fig. 1c). Common fabrics range from foliated, thinly banded to massive, where banding is chiefly expressed by the relative abundances of sulfides (e.g. Jt4, Jt7) and magnetite ± apatite (Supplementary Materials Fig. S1). Salt-and-pepper textures occur in the orebody in samples with dense disseminations of sulfides within altered mafic rocks (e.g. Jt9b). Deformation associated with micro-folding is accompanied by formation of coarser (cm-sized) lenses of quartz (e.g. Jt9a). Twelve polished thin sections (Supplementary Fig. S2) were prepared from the ten core samples. Selection was based on textures relevant for magnetite and associated alteration. Sample characterisation included reflected light optical and scanning electron microscopy (SEM) using an FEI Quanta 450 instrument operated in back-scattered electron (BSE) mode. Microbeam scanning X-ray fluorescence maps were obtained using a Bruker Tornado desktop scanner at the National Institute of Criminalistics, Brasilia, Brazil. Automated Mineralogy (AM) mapping on a Hitachi SU3800 SEM instrument was undertaken to provide the concentrations of component phases in two representative thin sections.
Compositions of amphibole and magnetite were obtained using a JEOL JXA-8230 SuperProbe electron probe microanalyser (EPMA) equipped with five spectrometer crystals and located in the Crti Laboratory, Federal University of Goiás, Brazil. Analytical details are given in the Supplementary Materials. Quantitative measurement of trace-element concentrations in magnetite were determined using a RESOlution-SE 193 nm Excimer laser coupled to an Agilent 8900x quadrupole ICP-MS. Full details of analysis, reference materials and data reduction procedures are given in Supplementary Material. Laser ablation-inductively coupled plasma mass spectrometry (LA-ICP-MS) trace-element mapping was conducted on three representative magnetite grains.
Magnetite was studied at the nanoscale using five S/TEM (<100 nm) foils prepared on a FEI-Helios nanoLab Dual Focused Ion Beam-SEM platform. High-angle annular dark field (HAADF) scanning transmission electron microscopy (STEM) imaging and energy-dispersive X-ray spectrometry (EDS)-STEM mapping were carried out using an ultra-high resolution, probe-corrected, FEI Titan Themis S/TEM operated at 200 kV. Diffraction pattern indexing was conducted with WinWulff© (JCrystalSoft) and using publicly available data from the American Mineralogist Crystal Structure Database (http://rruff.geo.arizona.edu/AMS/amcsd.php). Crystal-structure models were produced using CrystalMaker® and image simulations using STEM for xHREM TM software. Unless otherwise stated above, analysis was undertaken at Adelaide Microscopy, The University of Adelaide, Australia.
Results
Petrography
The lithologies and distribution of magnetite and its association with apatite and sulfides throughout the drillhole are shown in Fig. 2. A schematic stratigraphic column (Fig. 2a) shows that the dominant lithologies are green rocks (metabasalt and diabase) intercalated with one another and hosting a ∼50 m-thick orebody towards the lower part of the drillhole. Copper-(Ni)-Fe-sulfide mineralisation occurs as disseminations, larger clots, bands and/or veinlets with highest concentration within the orebody (Campo-Rodriguez et al., Reference Campo-Rodríguez, Cook, Ciobanu, Schutesky, King, Gilbert and Ehrig2024b).
(a) Schematic stratigraphic column for the sampled interval. (b) XRF map and (c–h) transmitted (c–g) and reflected light (h) photomicrographs showing key petrographic aspects of ores and host lithologies. White circles in parts d and f show locations of FIB cuts for trellis magnetite. Abbreviations: Ab – albite; Aln – allanite; Amp – amphibole; Ap – apatite: Bt – biotite; Chl – chlorite; Ep – epidote; Mag – magnetite; Pl – plagioclase; Py – pyrite; Pyh – pyrrhotite; Qz – quartz; Scp – scapolite.

The lithologies are intensely folded (Supplementary Fig. S2) and display mm-scale banded (Fig. 2b) or foliated to mylonitic fabrics (Fig. 2c). The banding comprises rhythms of magnetite, apatite and mica (mainly biotite) (Fig. 2b). Apatite in the same sample is coarse-grained, fractured and clustered with inclusions of quartz and allanite.
Magnetite, ubiquitous throughout all lithologies, decreases in abundance within the scapolite-bearing intervals that are common in the upper part of the drillhole. Sigmoidal scapolite, dominantly marialite, is embedded within a foliated matrix of biotite + amphibole-chlorite (Fig. 2c). Coarse-grained (mm-sized) magnetite, which is embayed within quartz is observed in metabasalt that otherwise displays fine-grained disseminations of magnetite and sulfides (Fig. 2d). Domains of plagioclase laths occur within the groundmass of mafic rocks, albeit altered to albite (Fig. 2e). Some textures, notably ‘pinch-and-swell’ and pressure shadows (biotite + quartz) are indicative of syn-metamorphic deformation. Pressure shadows are widely observed around some of the coarsest magnetite grains (Fig. 2f). Larger aggregates of epidote ± allanite occur together with apatite in samples close to the upper boundary of the orebody (Fig. 2g). Fine intergrowths of magnetite and sulfide patches that contain abundant pyrrhotite are typical of massive ore samples (Fig. 2h; Fig. S2).
To understand the changes in mineralogy and implicitly the context for the contained magnetite, automated mineralogy mapping was performed on thin sections, representative of lower and upper contacts with the orebody (Fig. 3). At the lower contact of the orebody (Jt10), magnetite is the main component (51.5 wt.%), followed by apatite (16 wt.%) and sulfides (19.6 wt.% pyrite + chalcopyrite), quartz (6.4 wt.%) and minor amphibole (3.4 wt.%). Chlorite, ilmenite and epidote/allanite occur only as traces (Fig. 3a). The area surrounding the magnetite in sample Jt10 analysed at the nanoscale was mapped at higher resolution (Fig. 3b). This shows a local increase in sulfide content (45.7 wt.%), with a predominance of chalcopyrite over pyrite. Ilmenite and allanite are present in comparable proportions (0.7 and 0.8 wt.%), but the former is finer grained (Fig. 3b, c). Higher-resolution mapping of the area surrounding magnetite in sample Jt7 analysed at the nanoscale shows that this is closely associated with increased proportions of pyrite (52.3 wt.%) and chalcopyrite (4 wt.%) (Fig. 3d).
Automated mineralogy maps showing constituent minerals in thin sections from the orebody as labelled. Mineral proportions (wt.% basis) are given in associated tables. Abbreviations: Aln – allanite; Amp – amphibole; Ap – apatite; Bt – biotite; Ccp – chalcopyrite; Chl – chlorite; Ep – epidote; Ilm – ilmenite; Mag – magnetite; Py – pyrite; Qz – quartz.

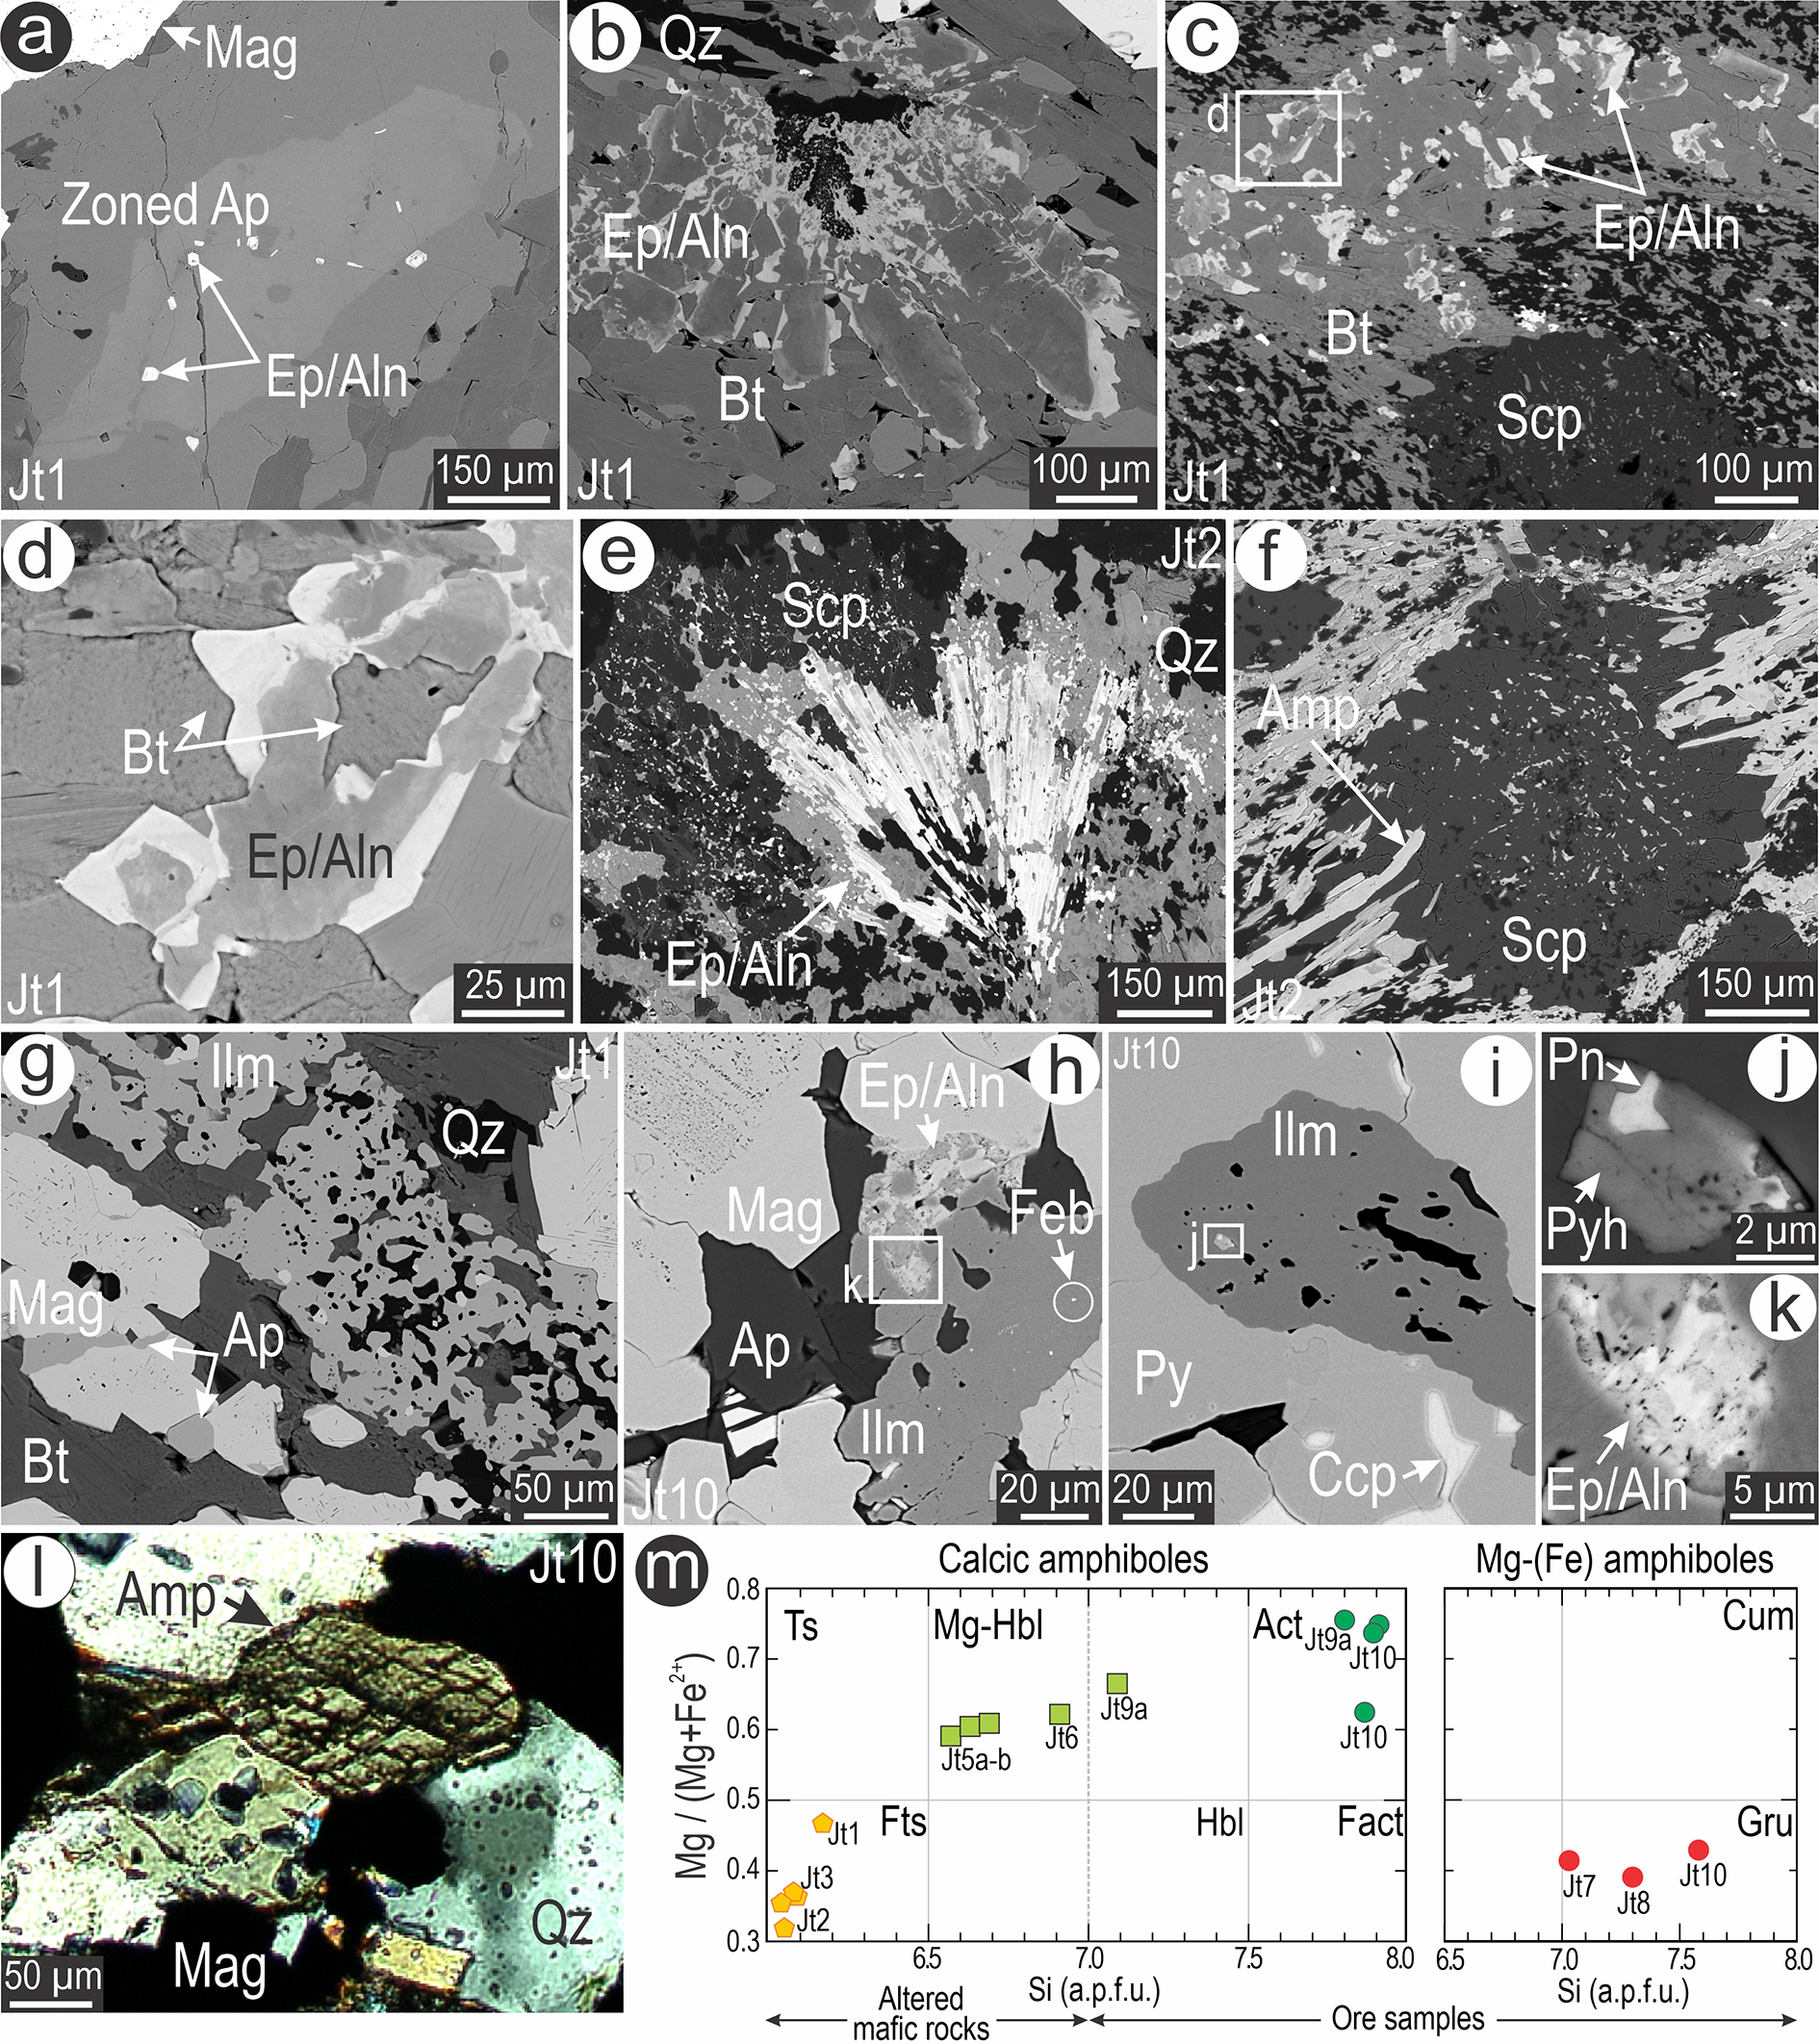
Textural and mineralogical aspects of alteration species, apatite, epidote-group minerals and scapolite, from the upper part of the studied interval (Jt1-2) are illustrated in Fig. 4a–f. Coarser crystals of apatite show patchy zoning with the brighter areas on BSE images corresponding to elevated REE content, as well as trails of allanite inclusions (Fig. 4a). Epidote-group minerals are abundant and display a marked marginal enrichment in REE, corresponding to allanite in some cases (Fig. 4b–d). In the same sample, epidote can form either large radial aggregates (Fig. 4b) or clusters of small grains within biotite at the contact with scapolite (Fig. 4c). Allanite forms well-developed haloes around the epidote at the contact to biotite (Fig. 4d). In contrast, acicular aggregates of allanite form at the centre of epidote aggregates in the scapolite-rich intervals (Fig. 4e). Scapolite aggregates with inclusion-rich cores and clear margins, like those shown in Fig. 2c, are marginally intergrown with actinolite and/or hornblende (Fig. 4f).
SEM-BSE images showing textural details of (a–f) apatite (Ap), epidote-group minerals (Ep) and scapolite (Scp) associated with biotite (Bt) and amphiboles (Amp), (g–k) Fe-Ti-oxides, sulfides and trace-mineral inclusions. (l) Crossed-polars transmitted light image showing a basal section of an amphibole preserved within quartz (Qz). (m) Plots of amphibole composition (classification after Leake et al., Reference Leake, Woolley, Arps, Birch, Gilbert, Grice, Hawthorne, Kato, Kisch and Krivovichev1997) from various samples as labelled. Data from Supplementary Material Table S1a. Other abbreviations: Act – actinolite; Aln – allanite; Ccp – chalcopyrite; Cum – cummingtonite; Fact – ferro-actinolite; Feb – ferberite; Fts – ferro-tschermakite; Gru – grunerite; Hbl – hornblende; Ilm – ilmenite; Mag – magnetite; Pn – pentlandite; Py – pyrite; Pyh – pyrrhotite; Ts – tschermakite.

Elongated patches of ilmenite, each several hundred microns in length, display a pseudopoikilitic texture (biotite and quartz) and coexist with magnetite (Fig. 4g) from the same apatite-rich sample (Jt1) at the upper part of the studied interval (see Fig. 2b). Trellis ilmenite lamellae and apatite veinlets are observed in the adjacent magnetite. In contrast, smaller bodies of ilmenite (tens of µm) occur in the lower part of the sequence at the contact with the orebody (Jt10; Fig. 4h, i). Magnetite displays mottled silicate inclusions (see below). Ilmenite also contains dusty inclusions of W-minerals (ferberite or scheelite) throughout the sampled interval. Blebby inclusions of pyrrhotite, in turn hosting pentlandite are observed (Fig. 4j). Clastic deformation of ilmenite along the contact to magnetite is accompanied by formation of epidote/allanite (Fig. 4h, k).
Although minor, amphiboles (Fig. 4l) are also preserved throughout the lithologies and correspond to two main compositional groups: calcic- and Mg/Fe-amphiboles (Supplementary Table S1a; Fig. 4m). Aside from hornblende and actinolite, the calcic amphiboles also include Al-rich-species, notably ferro-tschermakite. Actinolite is dominant in the mineralised samples, e.g. Jt10 at the contact with the orebody.
Magnetite composition and textures
Microprobe analysis of magnetite from across the sampled interval (Table S1b) shows varying amounts of minor elements (wt.%); 0.01–0.04 SiO2, 0.01–0.04 CaO, 0.004–0.02 MgO, 0.03–0.07 TiO2, 0.007–0.01 NiO, 0.03–0.1 Cr2O3 and 0.03–0.09 Al2O3, but relatively constant and high concentrations of V2O3 (0.24–0.39 wt.%). Such compositions only partially reflect magnetite chemistry as they are characterised by various textures related directly to the presence of (sub)micron-sized inclusions of various types, particularly ilmenite and silicates (Fig. 5a–f).
SEM-BSE images showing the main textures and a range of inclusions within magnetite (Mag). (a) Typical trellis textures as <111> ilmenite (Ilm) lamellae. Rare (b) and dense (c) mottled textures with silicates in magnetite. (d–e) Transition from trellis to blebby-mottled textures. Five of the eight foils extracted from locations as marked are presented here (see later). Other abbreviations: Aln – allanite; Bt – biotite; Ccp – chalcopyrite; Ep – epidote; Eux – euxenite; Feb – ferberite; Mol – molybdenite; Py – pyrite; Tho – thorianite; Ttn – titanite; Urn – uraninite; Sch – scheelite.

Two main textural types of magnetite are defined: (1) trellis – comprising lamellar networks of ilmenite with preferential orientation in magnetite, e.g. <111> (Fig. 5a); and (2) mottled – displaying silicate inclusions of variable density (Fig. 5b, c). Trellis magnetite displays contrasting sizes of lamellar networks (Jt4; Fig. 5a) and typifies magnetite within lithologies outside the orebody (metabasalt/diabase). The mottled magnetite is common at the contact with the orebody and shows inclusions, mostly silicates (Campo-Rodriguez et al. Reference Campo-Rodriguez, Ciobanu, Slattery, Cook, Schutesky, Ehrig, King and Yao2024a), resembling the ilmenite-trellis in addition to blebby morphologies (upper orebody contact; Jt7; Fig. 5b). An exceptional case of dense mottling is observed in wedges/sectors of preserved magnetite cores (Jt10; Fig. 5c). In such cases, the inclusions also display a concentric distribution away from the wedge apex. Micron-sized patches of ilmenite are also present, either within the mottled areas (Fig. 4c) or along the trellis-free margins of magnetite (Jt1, Fig. 5d).
An outstanding case of magnetite from sample Jt6 (Fig. 5e, f) shows transitional textures combining trellis and mottled. Overlap between the two inclusion types shows that the blebby morphology comprises binary inclusions of ilmenite and Al-bearing phases (see below) attached to ilmenite lamellae (Fig. 5e). These types of textures have been sampled using in situ FIB-SEM slicing (transects marked in red on Fig. 5a–c, e) for nanoscale study.
Titanite (CaTiSiO5), associated with sulfides and biotite, can spatially co-exist with ilmenite veinlets in silicate-mottled magnetite from the orebody (Jt10, Fig. 5g). An eclectic range of different inclusion species, defining a REE-Th-Mo-W-U geochemical association, is spread throughout magnetite from the sampled interval (Fig. 5h–n). In ore samples, unusually coarse grains of euxenite occur interstitial to magnetite and aggregates of pyrite. Fine particles of thorianite cluster around the contacts between epidote and allanite and blebby uraninite is noted as inclusions within some mottled magnetite grains (Fig. 5h–k). Trails of REE-mineral fine-grained particles, scheelite and ferberite are common in magnetite from the altered metabasalts outside the orebody (Fig. 5l–n). Large (micron-size) pores host inclusions of molybdenite (Fig. 5l).
Trace-element geochemistry: concentrations and distributions
Element concentrations and trends in magnetite
Trace-element concentration data (Table S3a,b) reflect the different textural types of magnetite. We divide the dataset into ‘trellis’ magnetite (samples Jt1, Jt3 and Jt4) and ‘mottled’ magnetite, which is in turn sub-divided into ‘rare mottled’ (Jt7) and ‘dense mottled’ (Jt8, Jt9b). The two sub-divisions are based on the density of silicate inclusions in magnetite which increases from the upper to the lower contact of the orebody.
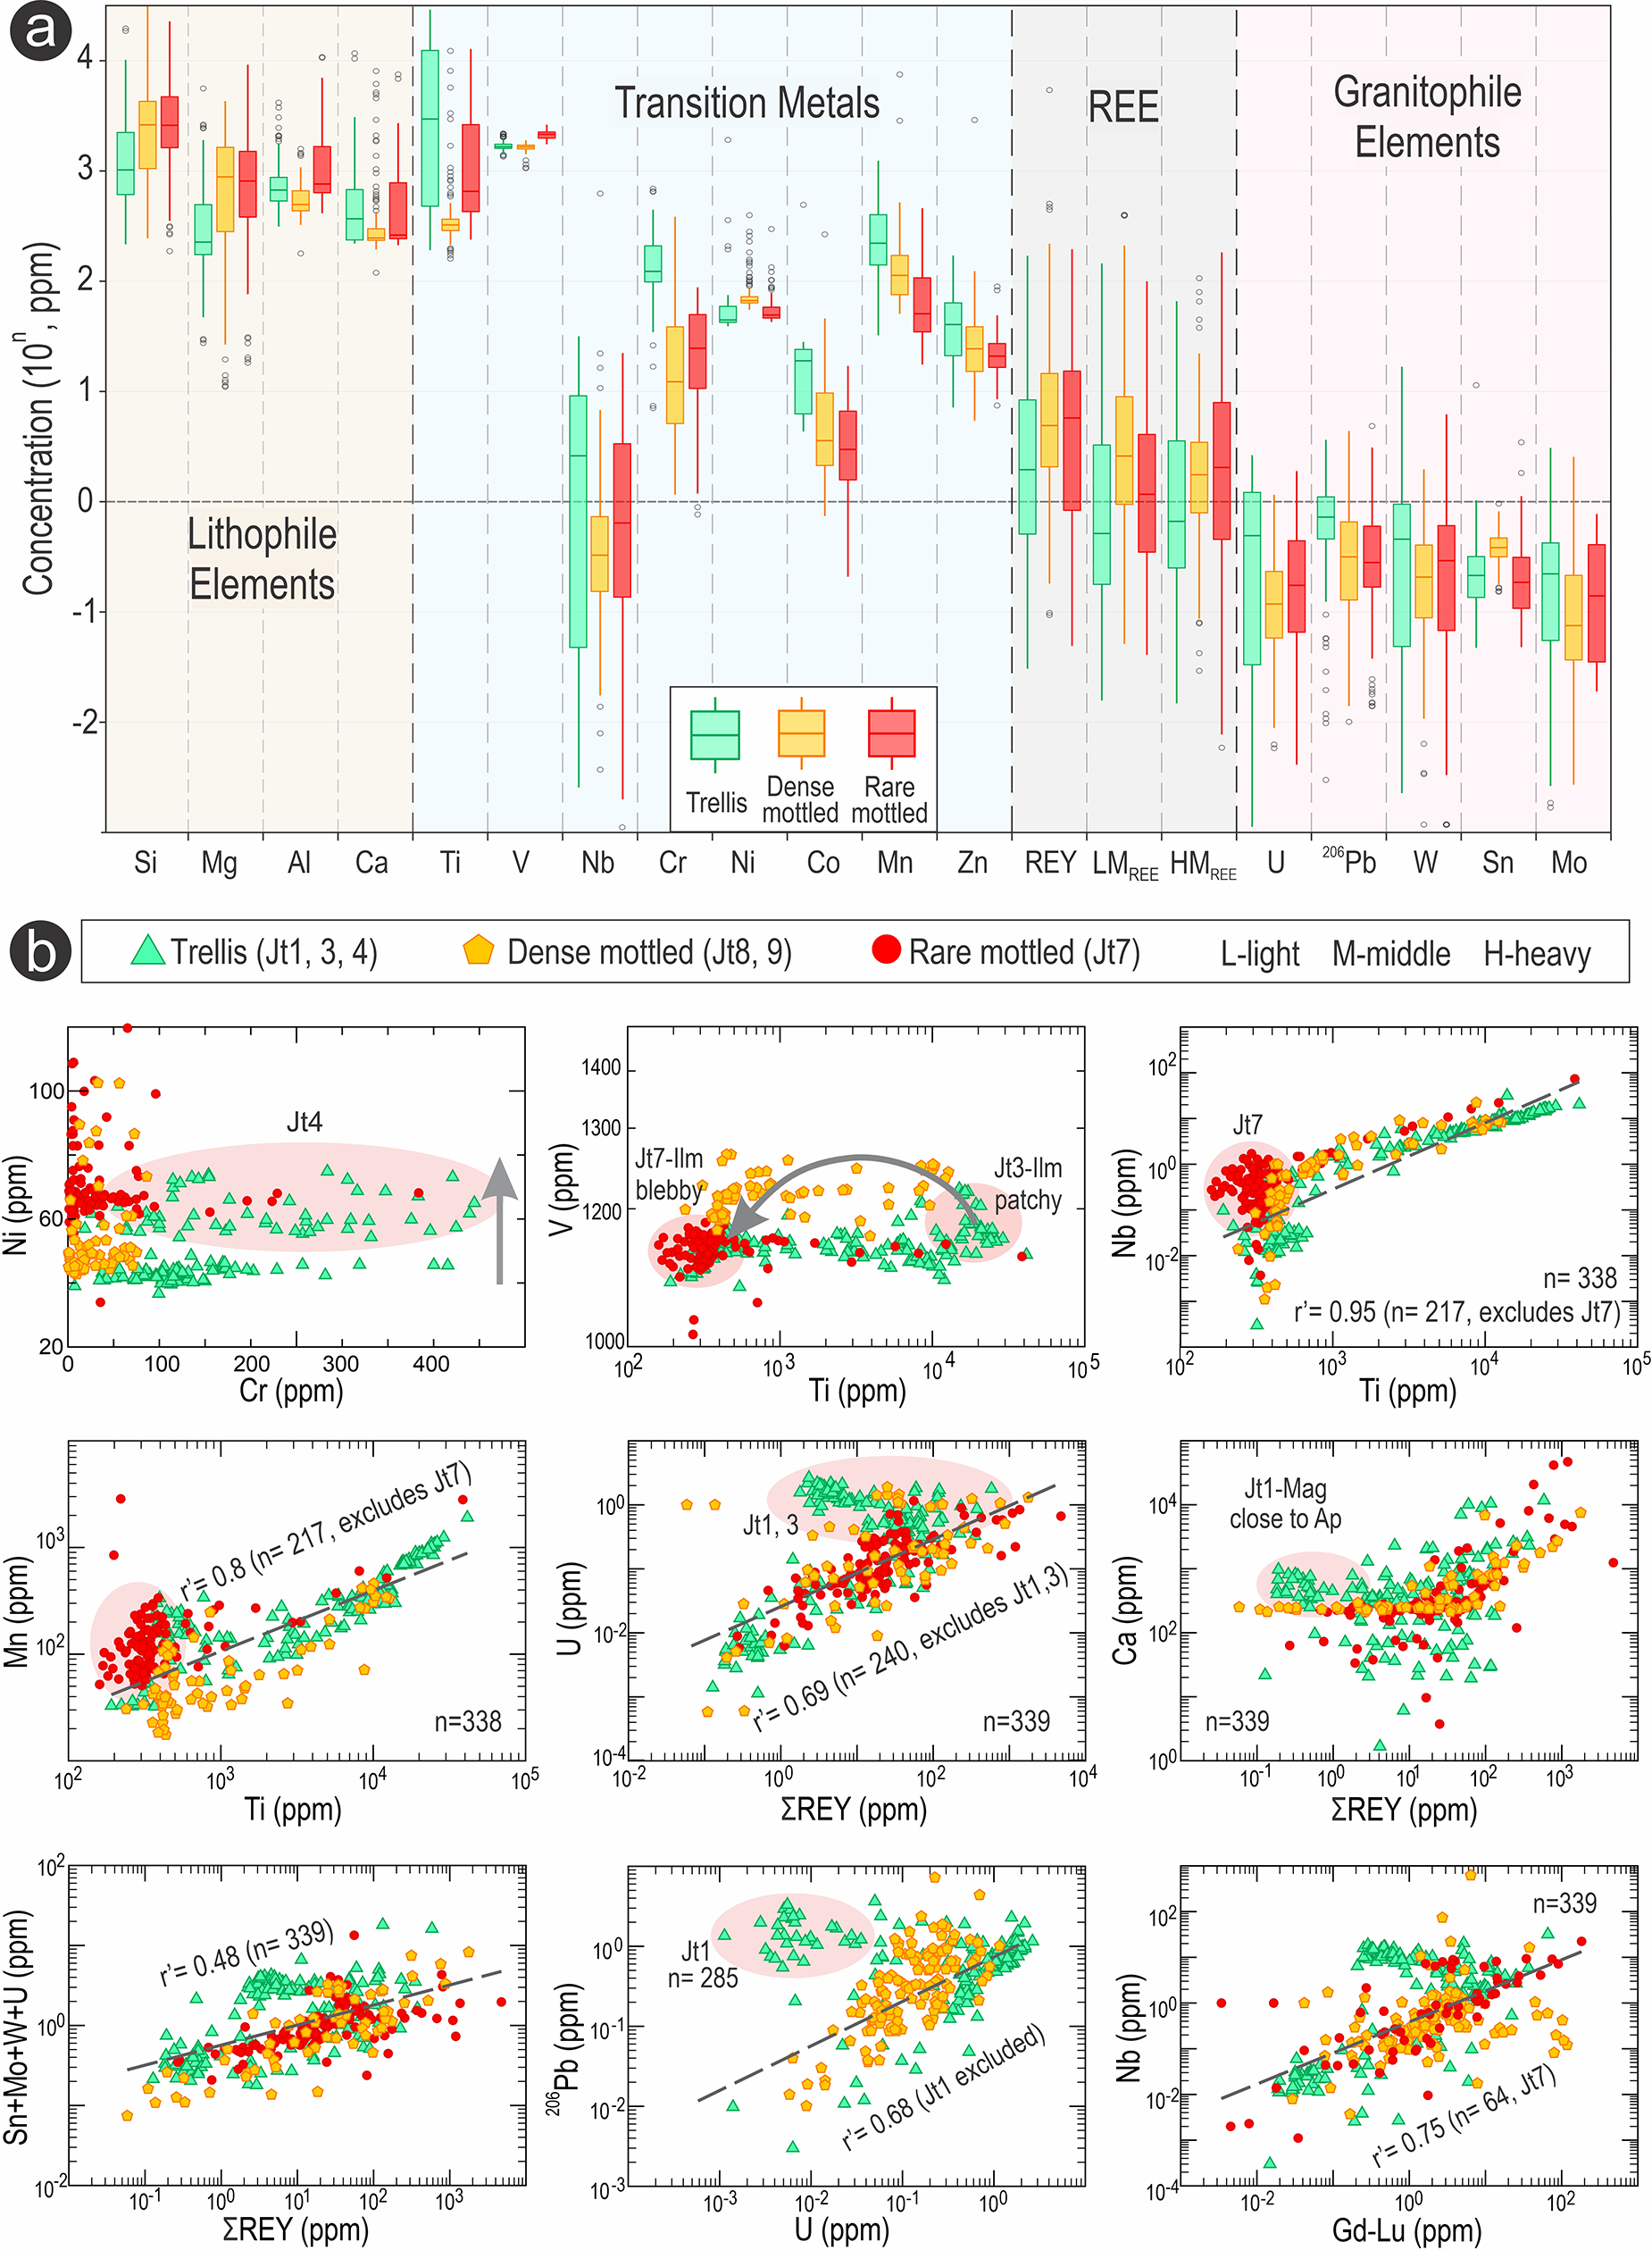
Four broad groups of analysed elements and their measured concentrations are shown on a boxplot sub-divided into the three textural categories (Fig. 6a; Table S3c).
LA-ICP-MS trace-element concentration data for magnetite presented as: (a) box-and-whiskers plots showing ranges for groups of elements; and (b) as binary plots for selected element/group pairs sub-divided by sample and textural type. Solid lines within the box on (a) represent median values. Abbreviations: Ap – apatite; Mag – magnetite.

Except for Ti and V, the concentrations of all lithophile elements are typically in the hundreds to thousands of parts-per-million (ppm) range. Among these, Si and Mg are lower in trellis magnetite, whereas there is no statistical difference in the concentrations of Al and Ca across the different textural categories. Titanium concentrations are highest in trellis magnetite (mean 7100 ppm), where they also show the widest concentration range. The lowest contents are noted in dense mottled magnetite (mean 3017 ppm). In contrast, V is relatively constant across the dataset (means of 1682, 1633 and 2167 ppm in trellis, dense and rare mottled magnetite, respectively). Niobium is never more than a few ppm, albeit with relatively wide concentrations ranges. Chromium concentrations are higher in trellis magnetite (mean 170 ppm) than in mottled magnetite (mean ∼30 ppm). Nickel concentrations are relatively constant across the dataset (mean concentrations of 87, 80 and 60 ppm for trellis, dense and rare mottled magnetite, respectively). Cobalt concentrations are markedly lower than those of Ni, although slightly higher in trellis magnetite (mean 19 ppm) vs. 4 ppm in mottled magnetite. Manganese is highest in trellis magnetite (mean 342 ppm) and slightly lower in mottled magnetite (means of 101–230 ppm). Zinc concentrations are some tens of ppm across the dataset.
The mean total REE+Y concentrations, hereafter termed ΣREY are 9, 19 and 62 ppm in trellis, rare mottled and dense mottled categories of magnetite, respectively. There are subtle differences in the relative concentrations of light and middle REE (La-Tb) relative to heavy REE (Dy-Lu, including Y) in that densely mottled magnetite from the ore samples not only contains more ΣREY, but also a greater proportion of HREE. The U-Pb-W-Sn-Mo group of elements, hereafter referred to as ‘granitophile’, are present in only low concentrations (means <1 ppm) across all magnetite categories.
The variation in trace-element concentrations is illustrated on a series of binary plots (Fig. 6b). No correlation is seen between Ni and Cr throughout the dataset, although we note that Cr has a far greater variability in the trellis magnetite (highest values in Jt4) than nickel. This contrasts with the mottled varieties in which the range of Ni concentration does not correlate with Cr (<100 ppm). Whereas the V content is relatively constant, Ti displays variation, in which the highest Ti is noted in the lamellar trellis magnetite (e.g. Jt3) and the lowest concentrations in the rare mottled type (Jt7), even though some higher concentration values attributable to blebby ilmenite inclusions are noted in the latter. Pairs of transition elements that show very good correlations with one another include Nb-Ti (r΄= 0.95) and Mn-Ti (r΄ = 8) if we exclude data for the rare-mottled magnetite sample (Jt7). There is also a relatively good correlation between U and ΣREY (r΄ = 0.69) across the dataset, excluding trellis magnetite in Jt1 and Jt3. The plot of Ca versus ΣREY depicts data clusters representing low ΣREY magnetite adjacent to high ΣREY, correlating to trellis sample Jt1. Otherwise, the plot shows greater concentrations of ΣREY, but with noisy distribution, so little evidence for Ca as a proxy for the presence of apatite inclusions. The correlation between ΣREY and granitophile elements is relatively low across the dataset (r΄ = 0.48). A better correlation is obtained for U versus 206Pb (r΄ = 0.68), if we exclude magnetite close to apatite in sample Jt1. Notable is the good correlation (r΄ = 0.75) between Nb and middle to HREE (Gd-Lu) across the dataset, excluding rare mottled (Jt7).
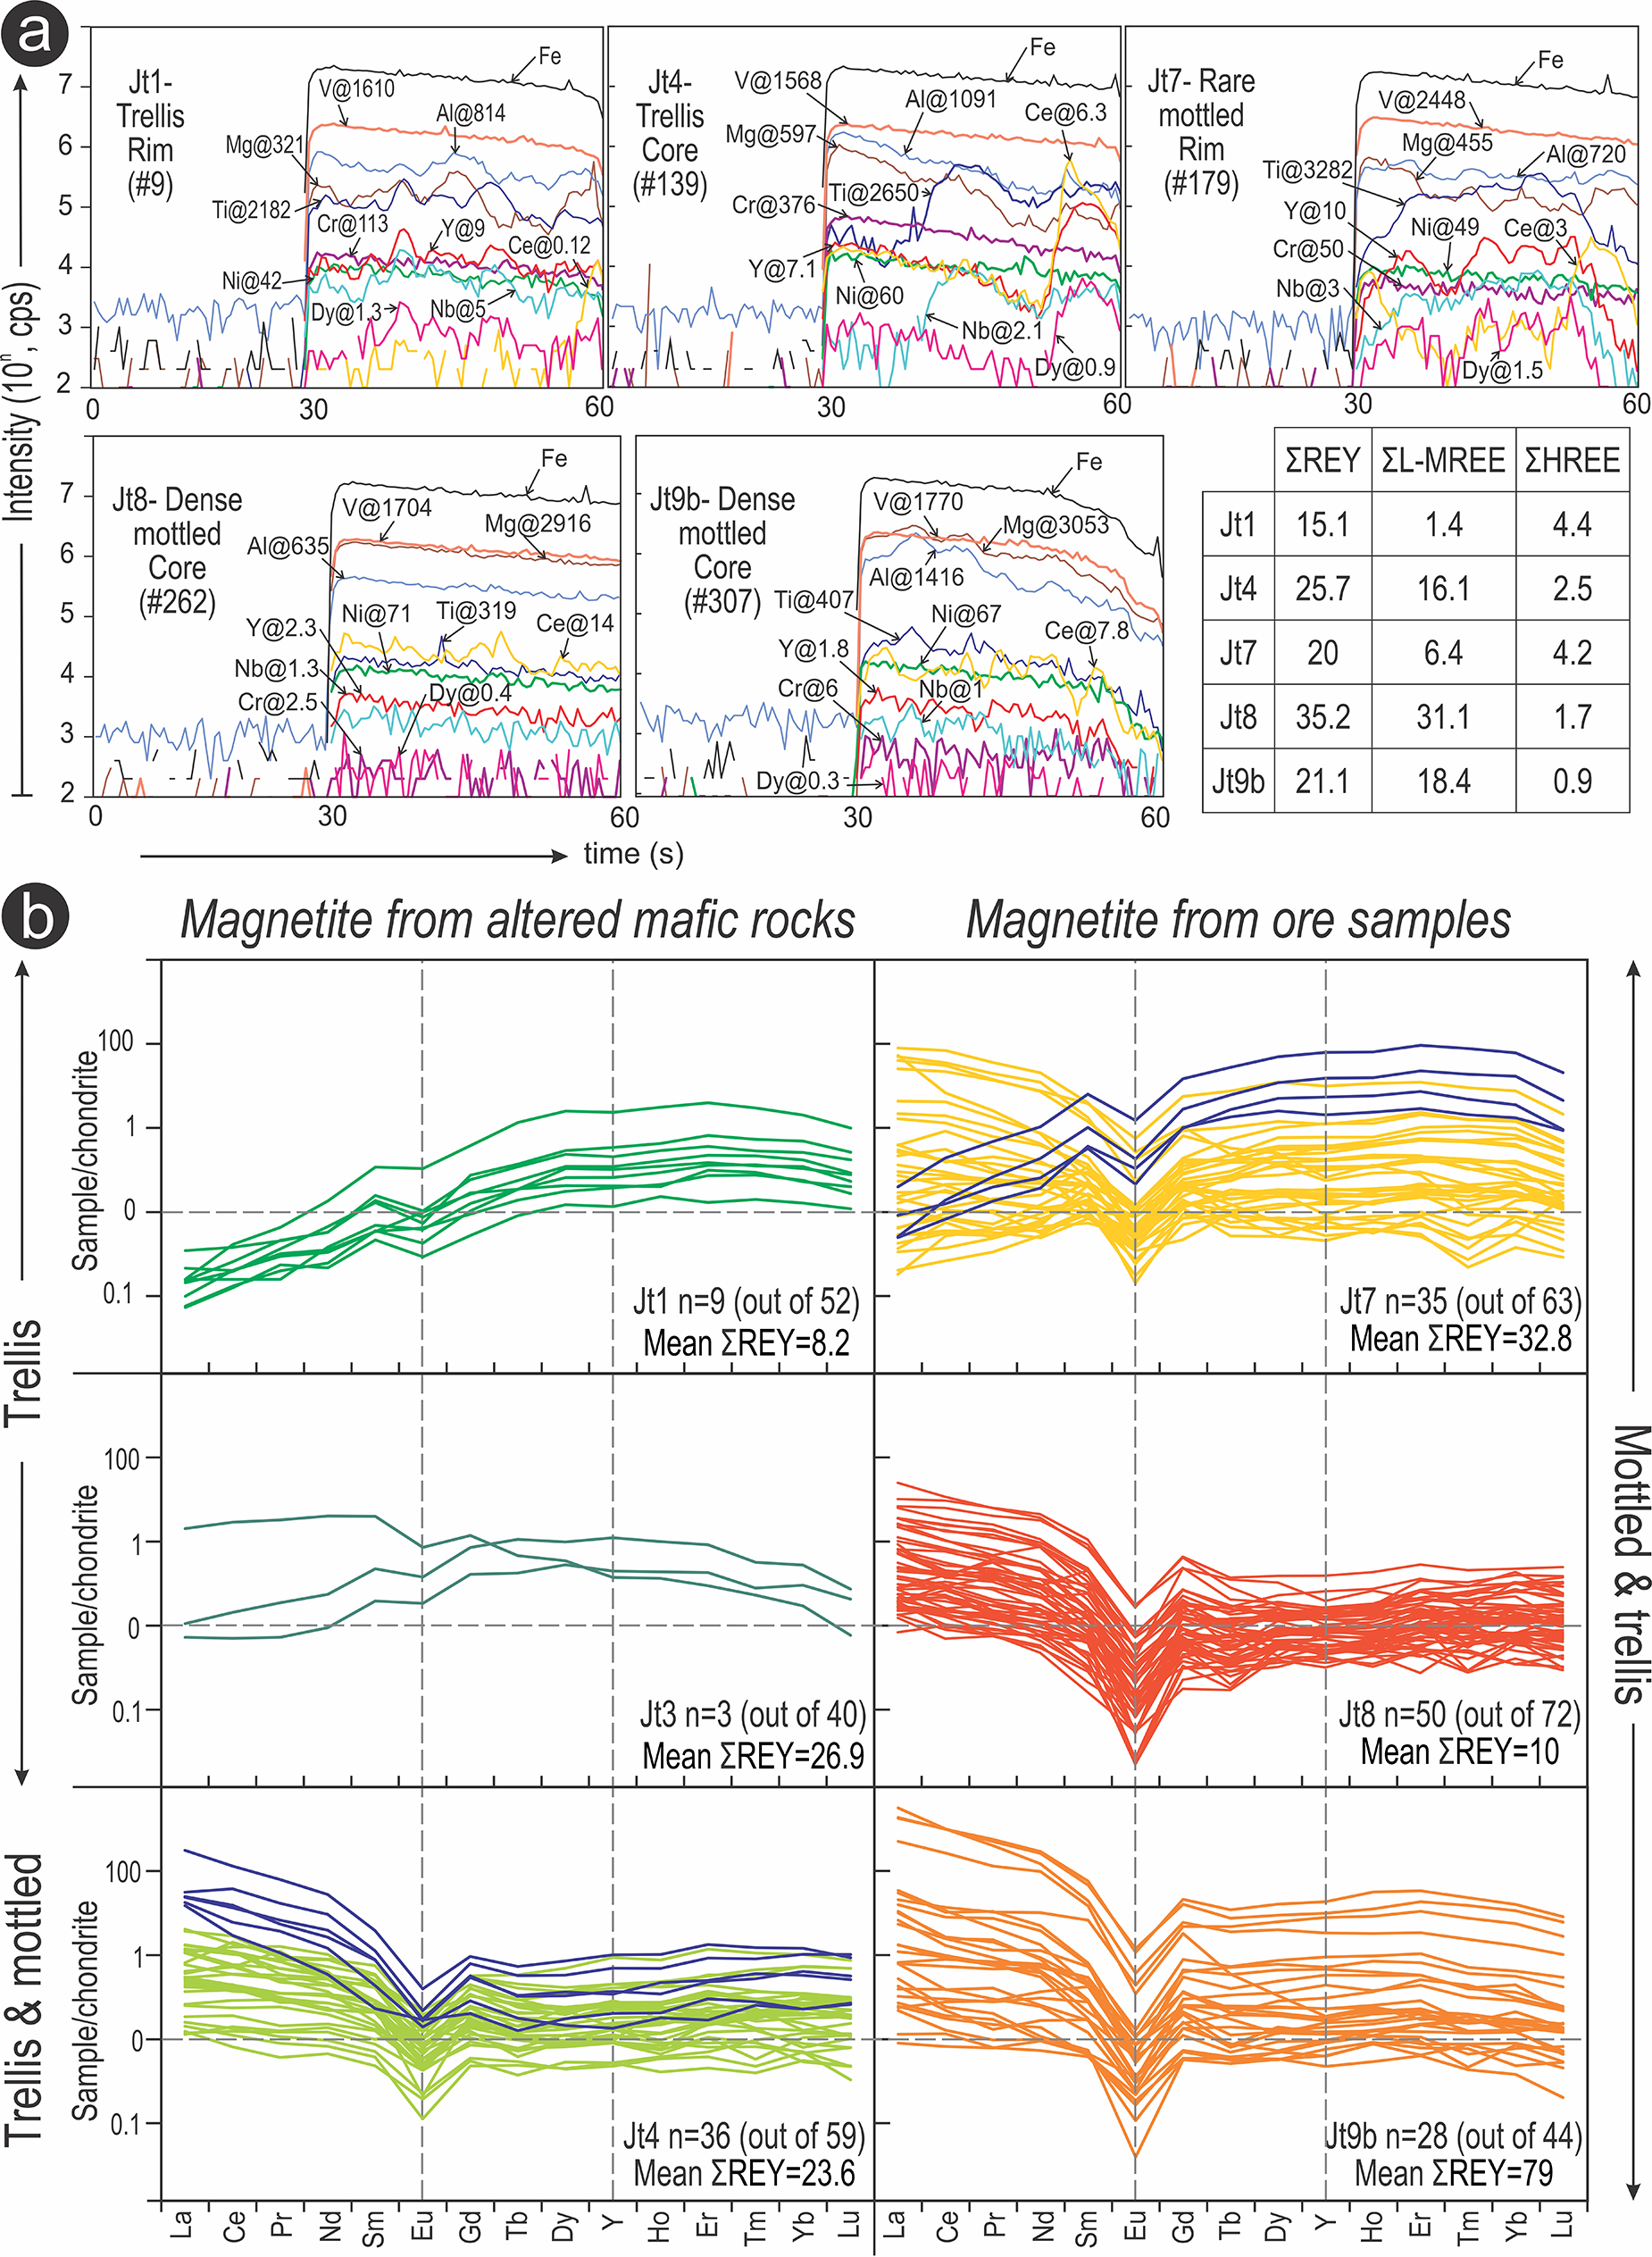
Time-resolved downhole LA-ICP-MS profiles show relatively smooth signals for V, Ni and Cr, whereas Ti, Al and Mg can be either smooth or ragged with smaller or large amplitude variation (Fig. 7a). This indicates the presence of sub-micron sized mineral inclusions containing Ti, Al and Mg within the analysed magnetite. In contrast, V, Ni and Cr appear to be incorporated within the magnetite structure (solid solution). Cerium (as a proxy for LREE) either displays small-amplitude variation (e.g. Jt8, Jt9b) or high-amplitude irregularities typical of a mineral containing micron-size inclusions of REE-minerals (e.g. Jt4, Jt7). Yttrium and Dy, as proxies for HREE, mostly display smooth signals but occasionally also show high-amplitude irregularities (e.g. Jt4, Jt7). Interestingly, Nb, which generally correlates with signals for HREE, may also show decoupling (e.g. sample Jt4). A Nb-HREE correlation implies the presence of (sub)-micron-sized inclusions of REY-minerals, some of which are Nb-bearing (e.g. euxenite).
(a) Representative time-resolved downhole LA-ICP-MS depth profiles illustrating features as labelled and discussed in text. Trace element concentration data in ppm. Table compares REY concentrations in different samples broken down as LREE+MREE and HREE. (b) Selected chondrite-normalised REY fractionation patterns for magnetite in various samples as labelled (data from Supplementary Material Table S2d. Note difference between the fractionation patterns for magnetite from altered mafic rocks and ore samples. Chondrite values from McDonough and Sun (Reference McDonough and Sun1995).

Chondrite-normalised REY fractionation patterns
After eliminating data attributable to obvious REE-mineral inclusions (Supplementary Table S2d), chondrite-normalised REY fractionation patterns display a spectrum of trends that reflect the different categories of magnetite (Fig. 7b). Although the noisiest, a selection of trellis magnetite from sample Jt1 displays upwards-sloping chondrite-normalised fractionation patterns. A flatter REY fractionation pattern is seen in a subgroup of analyses from sample Jt3. Sample Jt4, representing trellis and mottled magnetite, displays trends featuring modest enrichment in LREE. Ore samples in which mottled magnetite is dominant are typified by REY trends with slightly LREE-enriched to flat patterns (Jt7, Jt8, Jt9b). A sub-group of REY trends in sample Jt7 show a tendency towards patterns more characteristic of trellis magnetite as in sample Jt1. All REY patterns show negative Eu anomalies, although this anomaly is less pronounced in trellis magnetite.
Trace-element distributions in magnetite
LA-ICP-MS element maps of magnetite grains representing each of the three categories are shown in Fig. 8 (extended map sets are given as Supplementary Figs S3, S4). One of the largest trellis magnetites (Fig. 2d) shows the core enriched in Ti, Mn, Nb and U when compared to the grain margin (Fig. 8a). We note that ilmenite lamellae cannot be picked out on the Ti map as they are narrower than the map resolution. Chromium appears relatively depleted within parts of the magnetite margin that are porous, whereas V is homogenous throughout the grain.
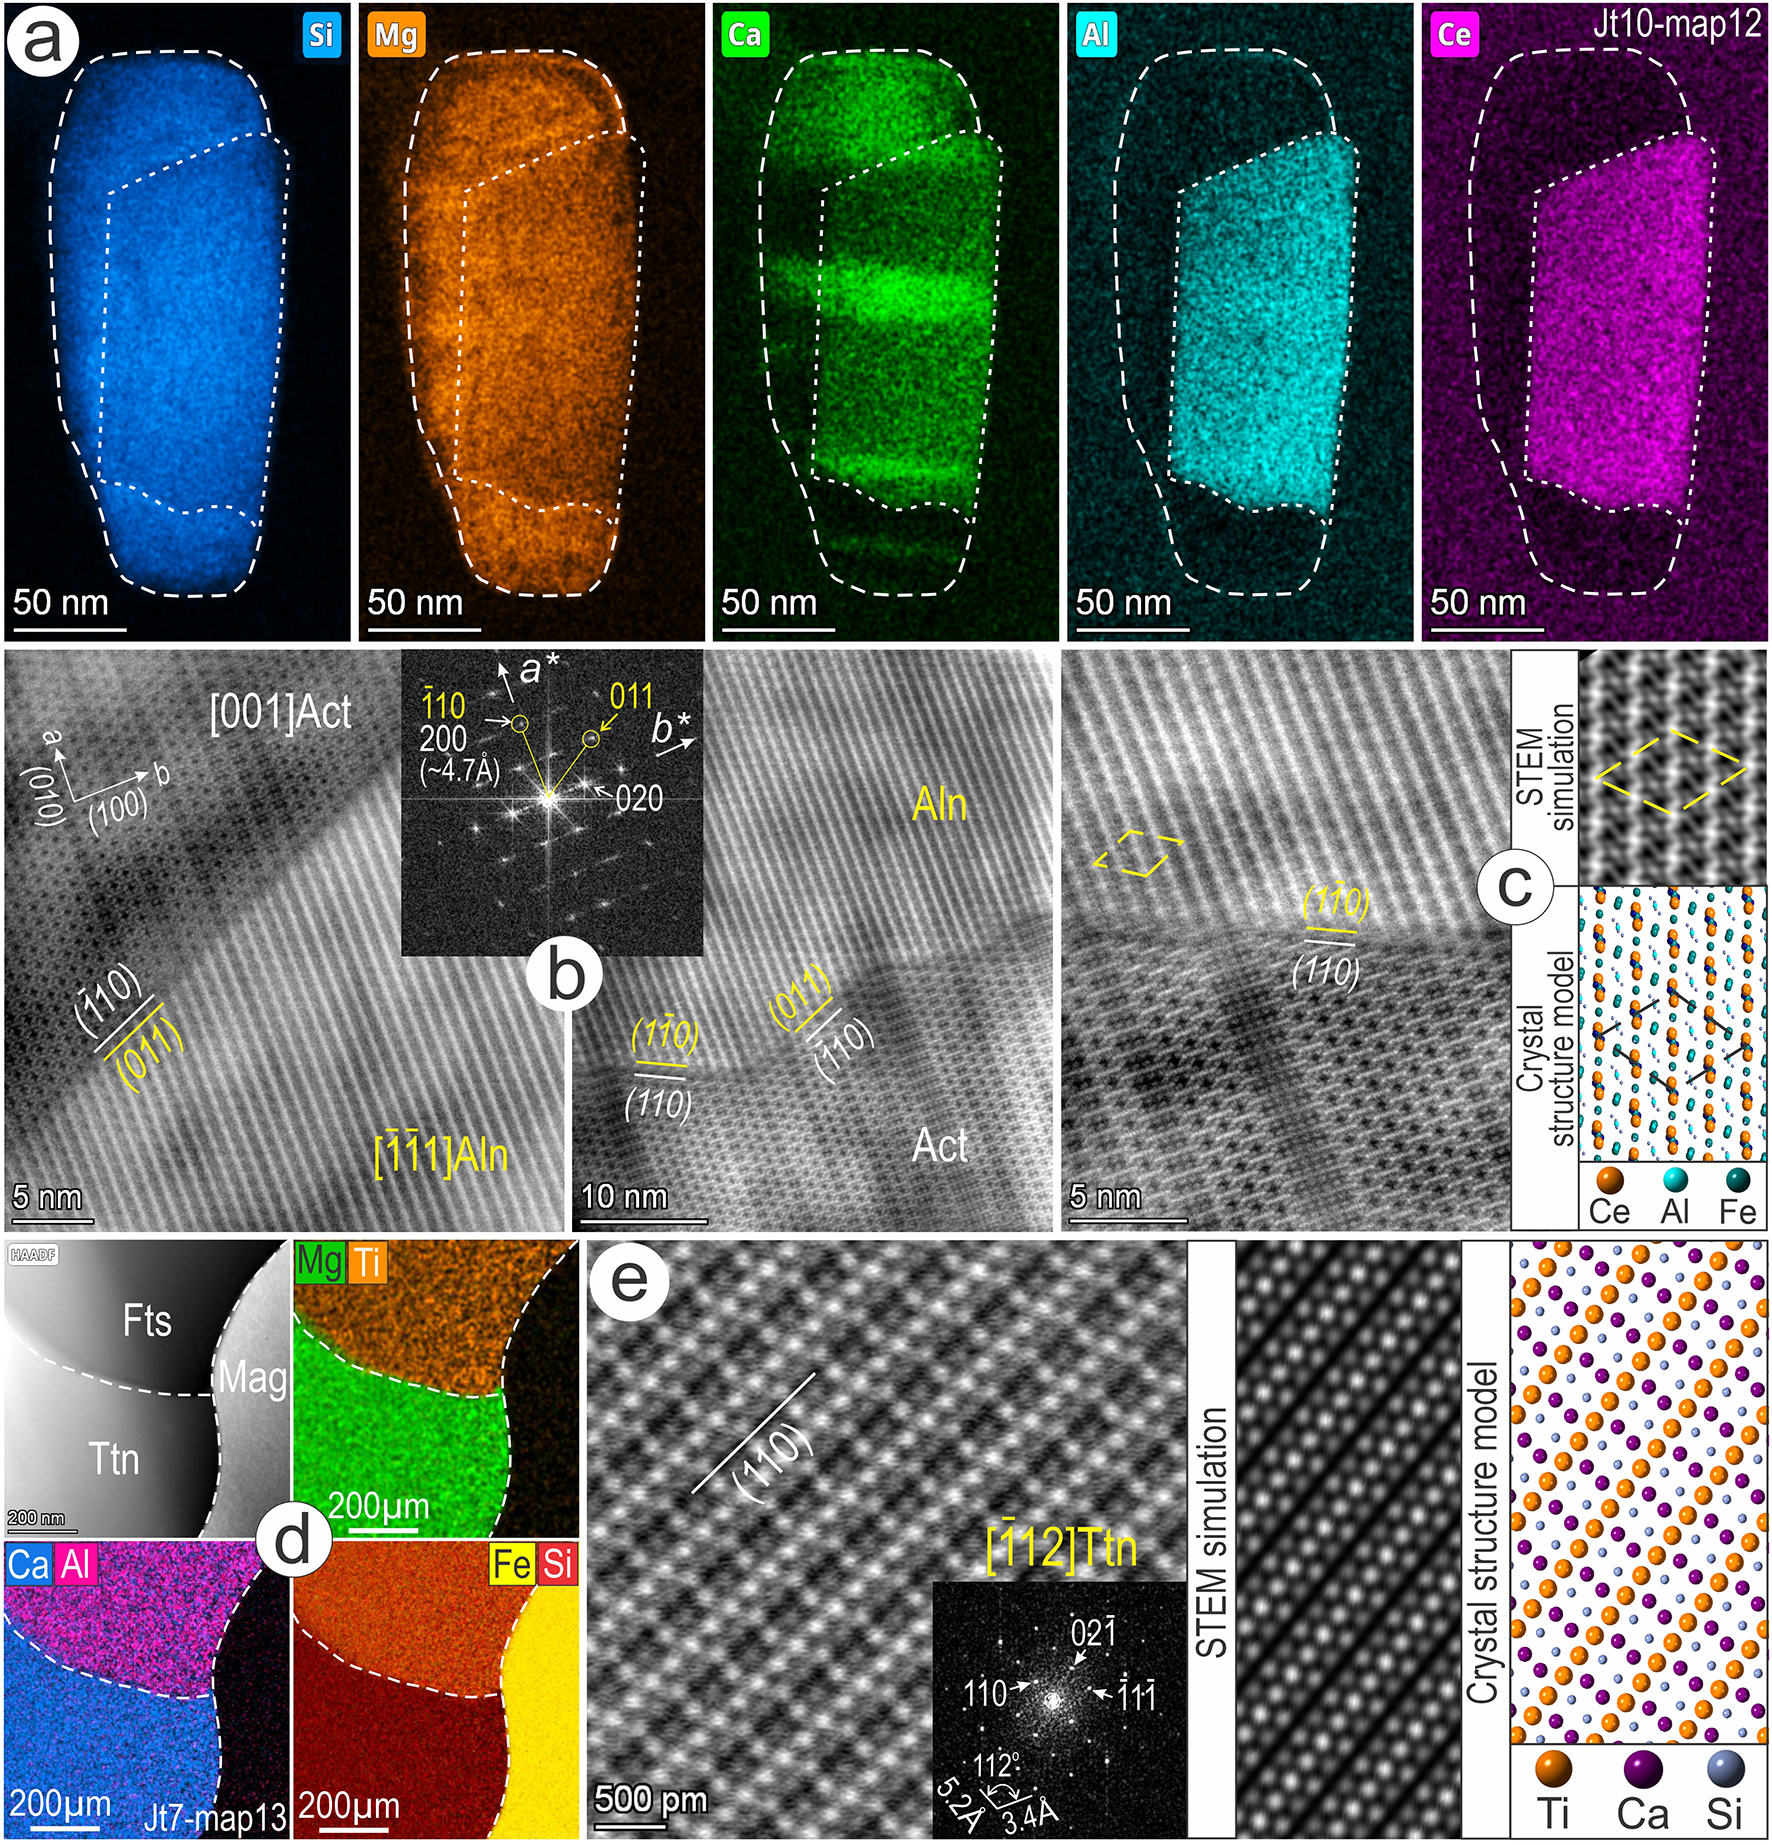
LA-ICP-MS element maps and corresponding reflected light images of selected magnetite (Mag) grains annotated to highlight internal features. (a) Trellis magnetite (Jt4; Figure 2d) shows core enriched in Ti, Mn, Nb and U, whereas V is distributed homogenously. Chromium is depleted in porous parts of the grain margin. SEM-BSE image shows ilmenite (Ilm) lamellae are too small (1–2 µm-thick) for map resolution. (b) Rare-mottled magnetite (Jt7) with homogenous concentrations of Fe, Al and Mg and a porous part being depleted in Ti, V, Cr and Ni. Note preferential enrichment of Ti, V, Cr and Ni in mica and sulfides surrounding magnetite. (c) Dense mottled magnetite (Jt10) with amphibole-NCPs-rich core depicted by higher concentration of Si, Mg, Al and to some extent, and Ce. Titanium shows ilmenite inclusions whereas V is distributed homogenously throughout the grain. Scales on all maps in counts-per-second (cps). Other abbreviations: Ap – apatite; Bt – biotite; Ccp – chalcopyrite; Py – pyrite; Qz – quartz.

Rare-mottled magnetite (Fig. 8b) with homogenous concentrations of Fe, Al and Mg show a porous part of the grain that is depleted in Ti, V, Cr and Ni (local remobilisation?). However, preferential partitioning of Ti, V, Cr and Ni in mica and sulfides surrounding magnetite is suggested by enrichment of these elements.
The mottled core of the inclusion-rich magnetite, from which amphibole and NCPs were described by Campo-Rodriguez et al. (Reference Campo-Rodriguez, Ciobanu, Slattery, Cook, Schutesky, Ehrig, King and Yao2024a), is picked out on the element maps by higher concentration of Si, Mg, Al and, to some extent, Ce (Fig. 8c). Titanium shows ilmenite inclusions, whereas V is homogenously distributed throughout the grain.
Nanoscale characterisation
Complementing the nanoscale study of Campo-Rodriguez et al. (Reference Campo-Rodriguez, Ciobanu, Slattery, Cook, Schutesky, Ehrig, King and Yao2024a), which focused on inclusions of amphiboles and associated NCPs in mottled magnetite, here we target other types of mineral inclusions using additional S/TEM foils (Fig. 9). STEM EDS spectra for such inclusions are shown in Fig. S5.
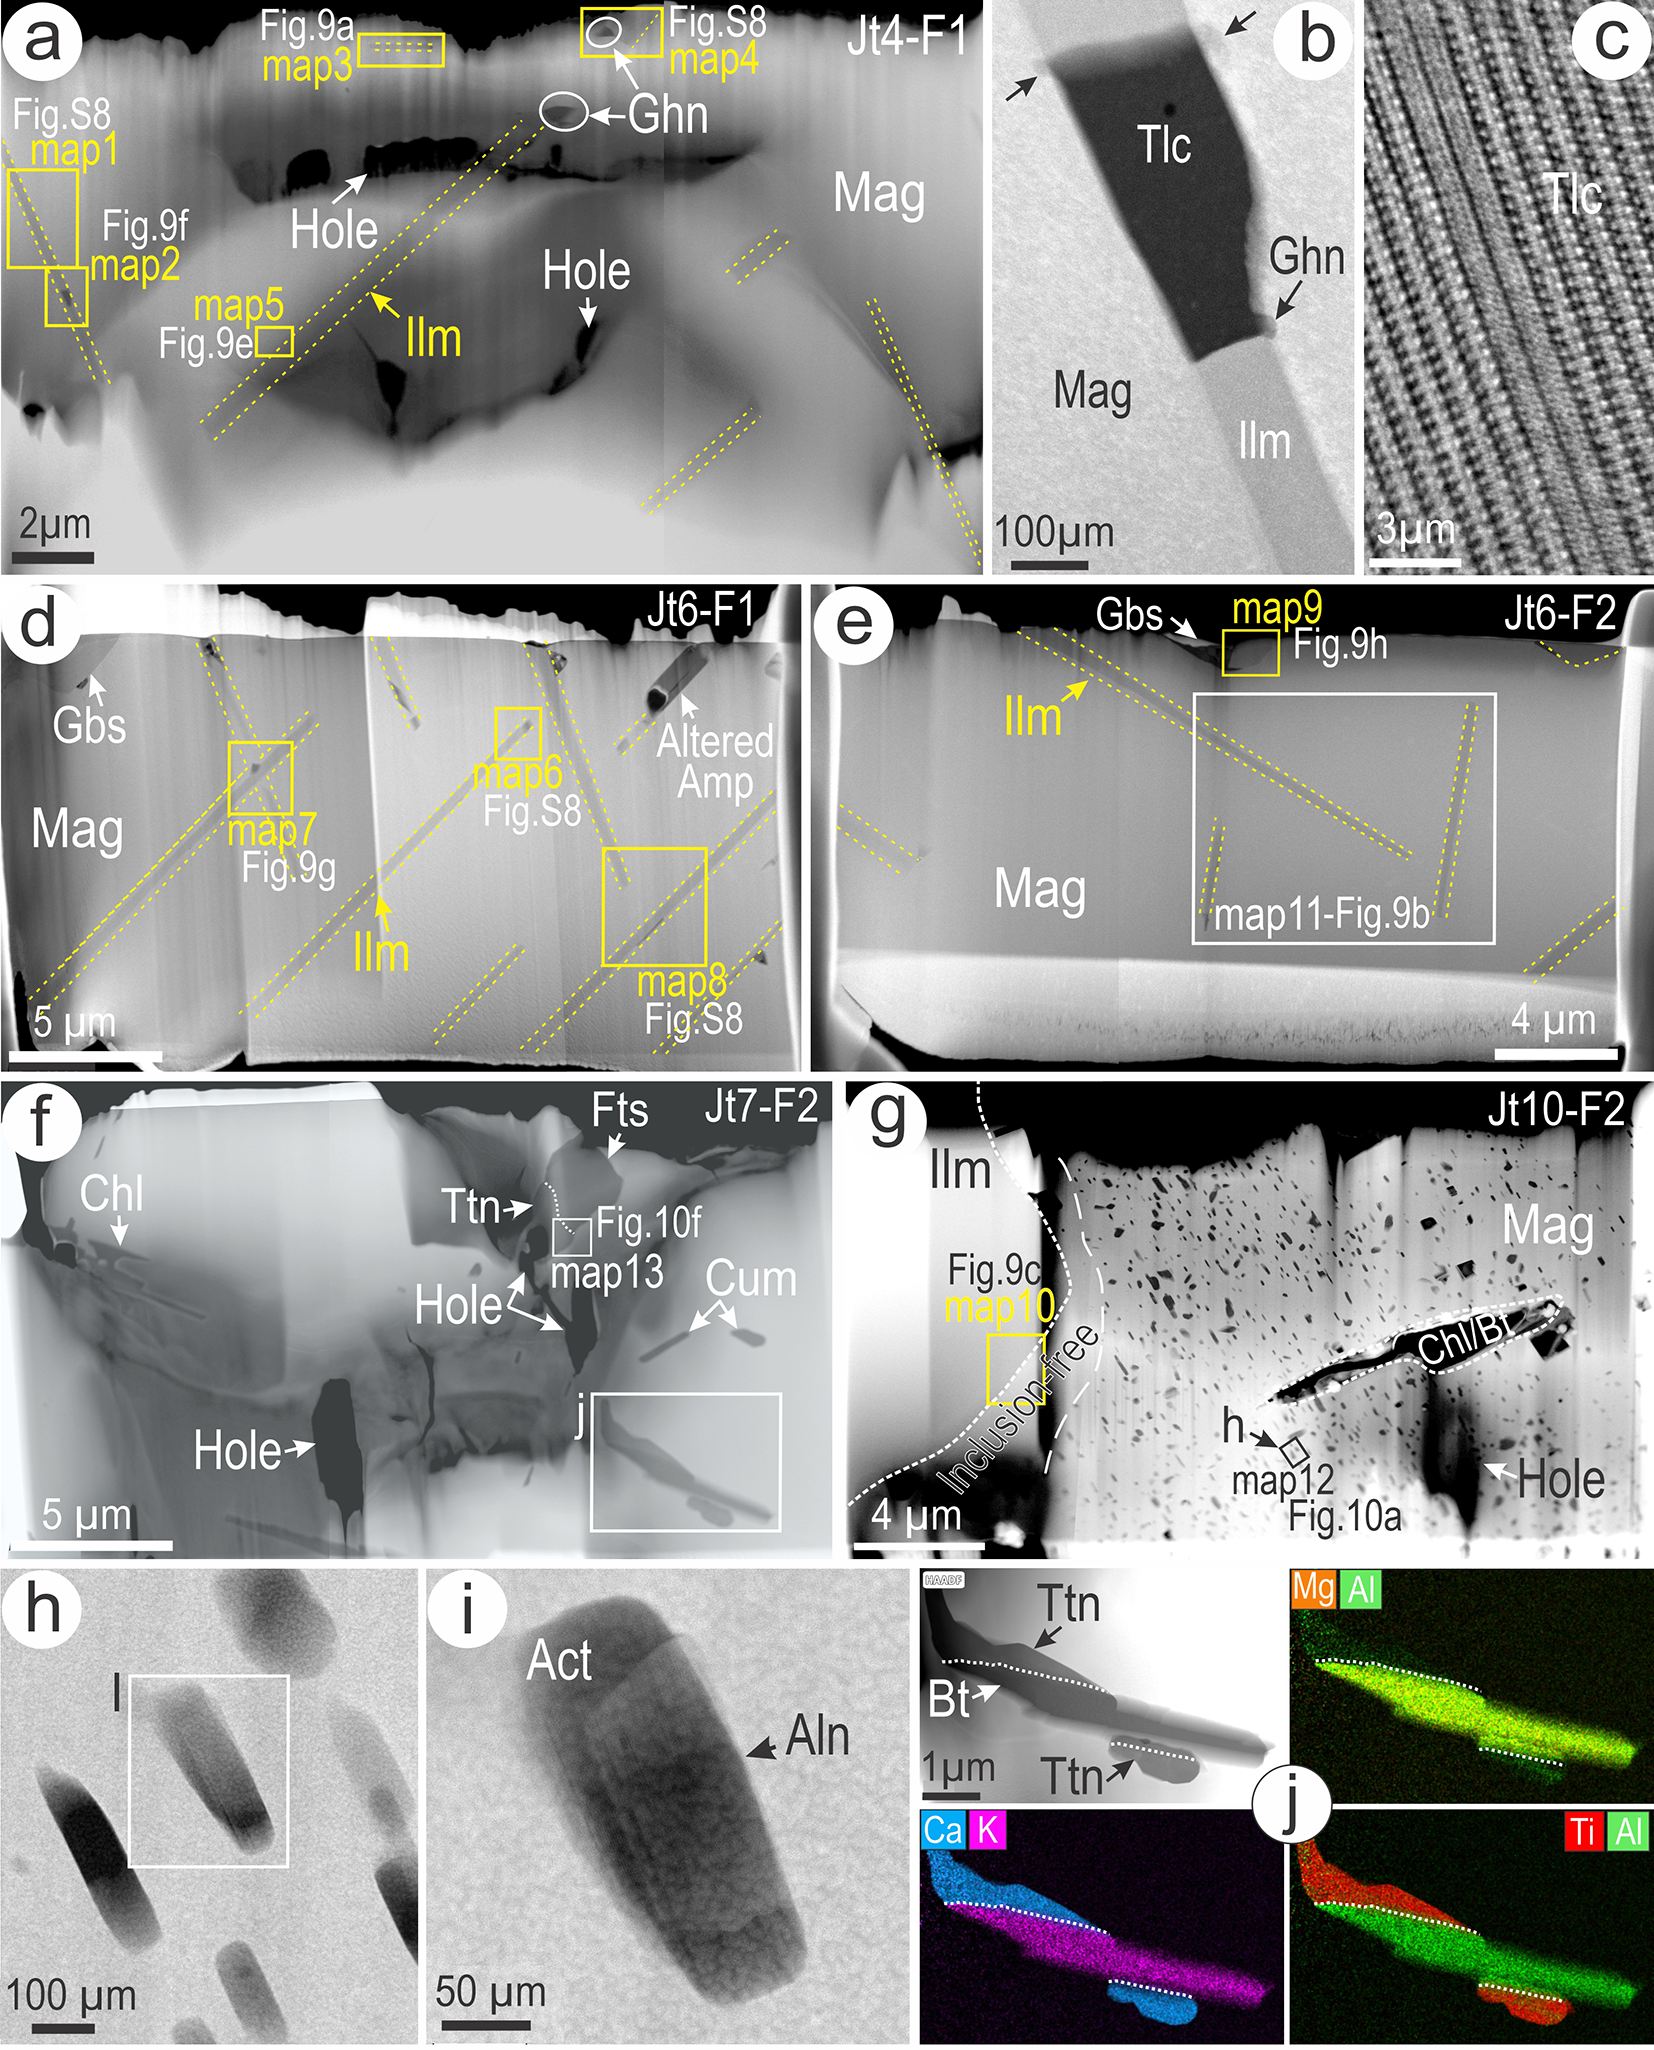
Overall images of the five foils analysed from magnetite (Mag) samples as labelled. Details of talc (Tlc) along ilmenite (Ilm) lamellae in (b, c) and the field of actinolite (Act) with attached allanite (Aln) in (h, i). STEM EDS maps for titanite (Ttn) associated with biotite (Bt) in part j. Abbreviations: Bt – biotite; Chl – chlorite; Cum – cummingtonite; Gbs – gibbsite; Ghn – gahnite; Fts – ferro-tschermakite.

Relationships between magnetite and ilmenite across the transition from trellis to mottled types were assessed from three samples, Jt4, Jt6 and Jt10. Ilmenite occurs as oriented lamellae (widely spaced and each up to several hundred nm wide) along <111> directions in magnetite and as patchy bodies, several microns wide, in mottled magnetite (Figs 9a, d, e, g; 10a–c). The Mn content in ilmenite decreases with changes in the morphology and association. It is greatest in the best-preserved trellis lamellae (Jt4) and lowest in blebby (Jt6) to patchy ilmenite (Jt10).
STEM EDS maps (a–c, e–h) and HAADF STEM images (i–l) showing nanoscale aspects of trellis (Jt4), transition to blebby (Jt6) and patchy ilmenite (Ilm) as inclusions in the dense silicate-mottled magnetite (Mag). STEM simulation for gibbsite as overlap in part (l). FFT patterns for the full images as insets in parts i,j,l. (d) logfO2–T plot showing results of nano-thermobarometry for ilmenite-magnetite pairs. Data from Supplementary Material Table S3. Mineral buffers plotted: MH – magnetite–hematite; FMQ – fayalite–magnetite–quartz; WM – wüstite–magnetite; QIF – quartz–iron–fayalite. Other abbreviations: Ghn – gahnite; Gbs – gibbsite; Tlc – Talc.

Nano-thermobarometry for ilmenite-magnetite pairs was employed using the calculation template of Lepage (Reference Lepage2003 and references therein) to estimate the temperature (T)–fO2 formation conditions (Fig. 10d, Table S3). The wide range of temperature and logfO2 (from 728°C at logfO2= –12 to 414°C at logfO2 = –31) corresponds to re-equilibration between magnetite and ilmenite from initial trellis to the trellis + blebby and to densely mottled magnetite.
The highest temperatures, 728–500°C, were obtained from pairs in which ilmenite lamellae have tiny crystals of gahnite, ZnAl2O4, attached to their edges (Jt4; Figs 9b, 10a,e,f). This corresponds to trellis magnetite as shown in Fig. 5a. Some ilmenite lamellae also feature segments that are filled by a Mg-bearing silicate identified from HR STEM imaging (Figs 9b,c; 10f) and STEM EDS spectra as talc. Estimated temperatures plot at the lowest end of the range (∼500°C) suggesting that the talc is an alteration product of a pre-existing, higher-temperature Mg-amphibole.
Temperatures in the range from 482°C to 556°C are obtained for magnetite–ilmenite pairs where blebs or acicular inclusions of an Al-hydroxide are attached to ilmenite lamellae (Jt6; Fig. 10g). This phase represents the darker tips of blebby ilmenite inclusions in magnetite with textural transition from trellis to mottled (see Fig. 5e,f). Temperatures obtained from one such blebby ilmenite inclusion also in sample Jt6 (Fig. 10h) are within the lowest part of the estimated interval (∼484°C).
The lowest temperatures (414–443°C) were obtained from pairs of patchy ilmenite-magnetite (Jt10, Fig. 10c) in the dense mottled magnetite (see Fig. 5c).
In closer detail, blebby ilmenite and magnetite features a stepwise mutual boundary (Fig. 10i). Nonetheless, the two oxides display epitactic relationships with one another in which (111)magnetite and (0001)ilmenite planes are parallel. The fast Fourier transform (FFT) pattern shows their coherent intergrowth between [ $\textstyle\overline1$01]magnetite and [01 $\textstyle\overline1$0]ilmenite where the distance of ∼4.8 Å corresponds to the same distance along the lattice vectors ( $\textstyle\overline1$1 $\textstyle\overline1$) and (0003)* in magnetite and ilmenite, respectively (inset in Fig. 10i). Likewise, epitactic relationships between [11 $\textstyle\overline2$]magnetite and [11 $\textstyle\overline2$0]ilmenite are observed between trellis ilmenite and host magnetite (Fig. 10j and FFT in inset). In this case, straight mutual boundaries are typical with parallel alignment between (111) and (0001) planes in magnetite and ilmenite, respectively.
Nanometre-scale inclusions of Al-hydroxide species occur along the stepwise boundary between blebby ilmenite and magnetite (Fig. 10k). The Al-hydroxide phase from a larger area at the end of one ilmenite lamella (Fig. 10l) was identified as gibbsite, Al(OH)3, from high-resolution imaging and an FFT pattern. The STEM simulation of [100]gibbsite matches the image for this species, albeit imperfectly.
STEM EDS maps of allanite (Aln) attached to actinolite (Act) in (a) and titanite (Ttn)-ferro-tschermakite (Fts) in (d) as inclusions in magnetite (Mag). HAADF STEM images of boundaries between allanite and actinolite in (b, c) and of titanite in (e). FFT patterns representing the images as insets in (b, e).

Apart from amphiboles and ilmenite, the most abundant inclusions in magnetite, we also observe allanite and titanite within mottled magnetite (Figs 9h–j and 11 foils Jt7-F2 and Jt10-F2). Allanite, (CaCe)(AlAlFe2+)O[Si2O7][SiO4](OH), is associated with actinolite within a field also containing other Ca- and Mg-amphiboles (Fig. 9h,i) within the dense mottled magnetite (JT10). STEM EDS element maps (Fig. 11a) show intragranular banding with respect to Ca, which is probably attributable to the actinolite (see also Campo-Rodriguez et al. Reference Campo-Rodriguez, Ciobanu, Slattery, Cook, Schutesky, Ehrig, King and Yao2024a) and a clear Al and Ce distribution reproducing allanite grain morphology. The identity of this species was obtained from high-resolution HAADF STEM imaging of the grain and its marginal contacts with the amphibole (Fig. 11b, c). The upper and lower contacts on Fig. 11b are characterised by straight and scalloped boundaries between allanite and actinolite tilted on the same zone axes, i.e. [ $\textstyle\bar1\bar1$1]and [001], respectively. Coherent relationships are documented for both types of contacts from the parallel alignment between (110)*allanite and (100)*actinolite lattice vectors (with spacings at ∼4.7 Å) on the FFT pattern (Fig. 11b inset) representing both images in Fig. 11b. The straight contact is between (011)allanite and (110) and a second set of planes (110) and (110)actinolite in the scalloped boundary. The image of allanite shows densely packed arrays of Ce atoms as brighter arrays that are reproduced by STEM simulations matching the crystal structure model (Fig. 11c).
Titanite, identified from the foil exposing the rare-mottled magnetite (Jt7-F2; Figs 9j, 11d,e), occurs as inclusions associated with ferro-tschermakite (Figs 9f; 11d) and along laths of biotite (Fig. 9j), but no ilmenite is observed. High-resolution imaging combined with STEM simulation and a crystal structure model on the [112] zone axis of titanite confirm its identity (Fig. 11e).
Discussion
How many generations of magnetite?
Characteristics observable down to the nanoscale (textures, inclusions and geochemical trends; Figs 2, 3, 5–9) indicate at least two distinct generations of magnetite: (1) trellis type, of mafic igneous affiliation; and (2) mottled type. The transition from trellis to mottled magnetite is marked by a change in ilmenite inclusions from trellis to blebby, the appearance of patchy ilmenite textures during episodes of brecciation and a pronounced mottling with silicates (Fig. 5a–f). Although overprinting can also be invoked for the trellis-type magnetite during subsequent events (textural and chemical re-equilibration, inclusion formation; Figs 5, 9) preservation of trellis magnetite throughout the entire sequence, albeit with variable abundance, supports the hypothesis that this generation is an inherited accessory mineral from the host lithologies.
Trellis magnetite records a range of temperatures and fO2 conditions attributable to re-equilibration during temperature decrease from 720°C to 400°C and increasingly reduced conditions (from logfO2= –12 to –31) from under the magnetite–hematite to above iron–wüstite stability curves (Fig. 9d; Supplementary Table S3). Importantly, such evolution corresponds to the formation conditions of magnetite as this evolves from trellis to mottled types (Fig. 5a–f). The occurrence of secondary phases including Mg-silicates and gibbsite (Fig. 9) records an intermediate stage of the same cooling event (∼550–480°C) during which ilmenite is also redistributed as blebs followed by patchy inclusions at still lower temperature (440–420°C) rather than as lamellae throughout magnetite.
The silicate inclusions typical of the mottled magnetite vary in speciation and abundance with early associations of NCPs and Mg-Fe-amphiboles attributed to metamorphism of an initial mafic-ultramafic sequence followed by calcic amphiboles formed during the IOCG system at Jatobá (Campo-Rodriguez et al., Reference Campo-Rodriguez, Ciobanu, Slattery, Cook, Schutesky, Ehrig, King and Yao2024a). However, most outstanding is the discovery of allanite growing epitaxially with actinolite within host magnetite (Fig. 11a–c). We interpret the allanite as having formed from Ce-bearing amphibole described from dense mottled magnetite (Campo-Rodriguez et al., Reference Campo-Rodriguez, Ciobanu, Slattery, Cook, Schutesky, Ehrig, King and Yao2024a) via the diffusion/percolation of waning-stage fluids. The disappearance of ilmenite and the formation of titanite (Fig. 11d,e) is associated with an increase in the abundance of mica and chlorite inclusions (Fig. 9i) within the rare-mottled magnetite.
Magnetite trace-element signatures
Trellis magnetite is not exclusive to mafic/ultramafic host rocks as comparable textures are reported from igneous magnetite in granitoids and hydrothermal magnetite from IOCG systems hosted by sequences of felsic magmatic rocks (Ciobanu et al., Reference Ciobanu, Verdugo-Ihl, Slattery, Cook, Ehrig, Courtney-Davies and Wade2019; Hu et al., Reference Hu, Li, Harlov, Lentz, McFarlane and Yang2020; Verdugo-Ihl et al., Reference Verdugo-Ihl, Ciobanu, Cook, Ehrig, Slattery, Courtney-Davies and Dmitrijeva2021; Zeng et al., Reference Zeng, Zhao, Spandler, Hu, Hu, Li and Hu2022). IOCG magnetite can contain as much as 3 wt.% TiO2; Verdugo-Ihl et al., Reference Verdugo-Ihl, Ciobanu, Cook, Ehrig, Slattery, Courtney-Davies and Dmitrijeva2021), comparable with the highest Ti (∼30,000 ppm) reported here from Jatobá magnetite. A mafic/ultramafic origin for the Jatobá magnetite is, however, supported by the conspicuous Cr-enriched signature of Ti-rich trellis magnetite (Fig. 6). The modest, relatively steady Ni concentrations of ∼40–70 ppm in magnetite is explained by the presence of Ni-bearing sulfides (Campo-Rodriguez et al., Reference Campo-Rodríguez, Cook, Ciobanu, Schutesky, King, Gilbert and Ehrig2024b) and preferential partitioning of these elements, as well as V and Ti, into sulfides and mica adjacent to magnetite (Fig. 8b, c).
Contrasting with trellis magnetite, mottled magnetite is relatively enriched in lithophile elements, even if these are, in part, due to the presence of amphibole inclusions. Importantly, the same inclusions and associated allanite also account, to some extent, for the prominent REY signature (Fig. 6a). Nonetheless, magnetite can also structurally incorporate up to several hundreds of ppm ΣREY, as shown by a micron- to atomic-scale study of Fe oxides (Cook et al., Reference Cook, Ciobanu, Ehrig, Slattery and Gilbert2022).
Discrimination between the two generations of magnetite is further facilitated by their distinct chondrite-normalised REY fractionation patterns (Fig. 7). The upwards-sloping HREE segment seen in trellis magnetite contrasts with the markedly LREE-enriched signature of the mottled magnetite, the latter probably mirroring fractionation trends of the contained nano-inclusions of allanite.
Enrichment of REY in magnetite from mean <10 ppm ΣREY to ∼100 ppm accompanying the transition from trellis to rare- and dense mottled textures (Fig. 7) indicates additional metal source(s) that also account for enrichment in spatially co-existing Cu-(Ni, PGE) mineralisation (Campo-Rodriguez et al., Reference Campo-Rodríguez, Cook, Ciobanu, Schutesky, King, Gilbert and Ehrig2024b). Comparable REY-bearing geochemical signatures are reported in magnetite from IOCG deposits, notably at Olympic Dam and adjacent deposits (Courtney-Davies et al., Reference Courtney-Davies, Ciobanu, Verdugo-Ihl, Dmitrijeva, Cook, Ehrig and Wade2019; Cook et al., Reference Cook, Ciobanu, Ehrig, Slattery and Gilbert2022) and IOA deposits along the northern Chilean iron belt, such as Los Colorados (Knipping et al., Reference Knipping, Bilenker, Simon, Reich, Barra, Deditius, Wälle, Heinrich, Holtz and Munizaga2015), albeit with variable concentrations. We thus consider that the REY-enriched signatures displayed by Jatobá magnetite represent a fingerprint of IOCG-related fluids.
Reinforcing the idea that REE are an intrinsic signature of IOCG mineralisation in the CMP are the Fe ores from the Salobo Cu-Au-Mo deposit in the Northern Copper Belt. Whole-rock analyses of iron formations (of banded iron formation, BIF origin, Justo et al., Reference Justo, Dantas, Bau, Freitas-Silva, Santos and Schorscher2020) and mineralised lenses from the Salobo deposit given by Lindenmayer and Teixeira (Reference Lindenmayer and Teixeira1999) show ΣREE contents of up to 2200 ppm, mean 938 ppm). REE-enrichment is attributed to potassic alteration.
The characteristic IOCG-like signature of magnetite from Jatobá is emphasised by the presence of ‘granitophile elements’ and the marked correlation between granitophile and REY enrichment (mottled magnetite; Fig. 6), a feature identified in IOCG deposits of the Olympic Cu-Au Province, South Australia (Courtney-Davies et al., Reference Courtney-Davies, Ciobanu, Verdugo-Ihl, Dmitrijeva, Cook, Ehrig and Wade2019; Verdugo-Ihl et al., Reference Verdugo-Ihl, Ciobanu, Cook, Ehrig and Courtney-Davies2020).
Other studies of trace-element signatures in magnetite from Carajás deposits (Huang and Beaudoin, Reference Huang and Beaudoin2019; Mansur et al., Reference Mansur, Dare, Ferreira, Miranda and Monteiro2023) used lithophile elements (Al, Ca, Mg, Si) and transition metals (V, Cr, Ti, Ni, Mn) to distinguish individual ‘generations’ of magnetite, as well as diagrams considered to be helpful for discriminating magmatic from hydrothermal origin and/or evolution. In the present investigation, we show why such diagrams are not reliable, at least if applied to at Jatobá, because of the effect that ilmenite and amphibole nano-inclusions have on lithophile element distributions at the grain-scale. We contend that a decoupling among transition metals occurs during evolution from trellis to mottled magnetite, e.g. core–rim preferential distribution of Cr, Nb and Mn, but not V (Fig. 8).
Deep shear-zone metamorphism – telescoped transition of trellis to silicate-mottled magnetite
The schematic diagrams in Fig. 12 illustrate magnetite transformations both in terms of grain textures and the nanoscale inclusions within. This shows a telescoped transition between trellis and silicate-mottled magnetite as the temperature gradually decreases from 730 to 400°C (estimated from magnetite–ilmenite pairs; Fig. 10d), during which the ilmenite changes from trellis to blebby and patchy textures (Fig. 12a–c). Silicate-mottled magnetite coexists with the patchy ilmenite textures but becomes dominant in ore-hosted magnetite (Fig. 12c, d). Amphiboles in the silicate-mottled magnetite mirror those in the country rocks (Fig. 4m) and, in both cases, ferro-tschermakite records pressures of ∼7 kbar (6.4–7.4 kbar). Such P-T conditions are compatible with amphibolite-facies metamorphism at a depth of ∼20 km.
Schematics showing the micron- to nano-scale textural evolution of magnetite from host basalt to ore. See text for additional explanation. The dashed lines indicate fractures. Abbreviations: Act – actinolite; Aln – allanite; Amp – amphibole; Bt – biotite; Ccp – chalcopyrite; Chl – chlorite; Fts – ferro-tschermakite; Gbs – gibbsite; Ghn – gahnite; Hbl – hornblende; Hc – Hercynite; Ilm – ilmenite; NCP – non-classical pyribole; Py – pyrite; Tlc – talc; Ttn – titanite.

Initial titanomagnetite is affected by fracturing and cross-cutting sets of trellis lamellae (Fig. 12a). Blebby ilmenite textures occur in fragmented magnetite, resulting from deformed grains now filling swell textures in the country rock (Fig. 12b). Primary hercynite in the igneous magnetite is replaced by Al-hydroxides (gibbsite), whereas ilmenite is partially replaced by Mg-amphiboles (subsequently altered to talc).
The mottled magnetite is typical of the ore interval, whereby fragmented cores preserve densely mottled domains surrounded by overgrowths (Fig. 12c). In this case, an evolution from Mg-(Fe)-amphibole and NCPs to Ce-bearing calcic amphibole and local formation of allanite (Fig. 11a–c) is recorded throughout the mottled areas. This magnetite preserves patchy ilmenite throughout cores and overgrowths and contains abundant sulfide (pyrite, chalcopyrite) inclusions.
Rare-mottled magnetite displays sets of fractures with gangue minerals infill, sulfide inclusions, brecciated margins and high porosity (Fig. 12d). In this case, relict NCPs, sparse calcic amphibole associated with mica and titanite (the only Ti-bearing phase present) and micron-scale fractures with numerous voids are typical (Figs 9f, 11d–e). These changes suggest replacement of the densely mottled magnetite via dissolution–reprecipitation reactions, during an increase in the fluid flux.
Magnetite trace-element signatures change from Ti-Cr-Ni to REE-U+W+Mo following transition from trellis to mottled textures. The same geochemical trend is emphasised by nucleation of micron-scale inclusions of REE-minerals, uraninite, molybdenite and scheelite/ferberite throughout Fe-(Ti)-oxides (Fig. 5h–n).
Metamorphism is supported by the range of fabrics and textures in magnetite and the country rocks indicative of deformation during a tectonothermal event subsequent to deposition of volcanic sequences in an active rift. Whereas the initial titanomagnetite represents a magmatic accessory in the host lithologies, magnetite is accumulated in pods, folds and bands instead of preserved as single grains (Supplementary Figs S1, S2). Such textures could result from metamorphic segregation (Robin, Reference Robin1979) in otherwise non-banded lithologies. The banding could also be an inherited depositional fabric resulting from Fe-rich, thin BIF-like horizons intercalated within the volcanic sequences. For example, BIFs interlayered with mica schists and chalcopyrite-rich amphibole and amphibole schist concordant with metamorphic foliation are considered as amphibolites representing the metamorphosed expression of mafic protoliths belonging to a volcano-sedimentary succession (Fernandes et al., Reference Fernandes, Galarza, Teixeira de Gouvêa and Tavares de Souza2021). However, the close association between magnetite and apatite, which increases in abundance towards the orebody (16 wt.% of rock volume), rules out a BIF connection.
Deformation associated with metamorphism is also suggested by the sigmoidal morphology of scapolite, pressure shadows surrounding magnetite porphyroblasts, pinch-and-swell structures (Fig. 2) and the grain-scale fabrics exhibited by pyrite (Campo-Rodriguez et al., Reference Campo-Rodríguez, Cook, Ciobanu, Schutesky, King, Gilbert and Ehrig2024b). Unlike Veloso et al. (Reference Veloso, Monteiro and Juliani2020), who considered the scapolite to be an expression of sodic alteration associated with the IOCG system, we suggest that scapolite may instead relate to ocean floor alteration of basaltic sequences (Hekinian, Reference Hekinian1982) prior to metamorphism at higher P-T conditions. Arguments favouring such a hypothesis include scapolite textures (overgrowth on sigmoidal grains), its occurrence as thin intervals rather than distinct zones and in particular, the association with epidote group minerals and albite (Figs. 2e; 4c, e). Syn-metamorphic deformation is also supported by the widespread chain-width disorder observed in NCPs from mottled magnetite and the annealing textures in pyrite (Campo-Rodriguez et al., Reference Campo-Rodriguez, Ciobanu, Slattery, Cook, Schutesky, Ehrig, King and Yao2024a, Reference Campo-Rodríguez, Cook, Ciobanu, Schutesky, King, Gilbert and Ehrig2024b).
Amphibolite-facies metamorphism at an estimated depth of 20 km, based on multiple lines of evidence, can take place in strike-slip deep shear zones via mechanisms of ‘shear heating by friction’ (Leloup and Kienast, Reference Leloup and Kienast1993). Jatobá is placed within the Canaã dos Carajás shear zone, one of the three main strike slip systems identified in the Carajás Domain (e.g. Pinheiro and Holdsworth, Reference Pinheiro and Holdsworth1997). Recent geodynamic models (Costa et al., Reference Costa, Santos, Serafim, Costa and Roopnarain2020; Trunfull et al., Reference Trunfull, Hagemann, Xavier and Moreto2020) have postulated activation of strike slip systems accompanied by deformation or metamorphism post rifting. As documented by thermomechanical modelling and field examples, the ascent of hot fluids/magmas along shear zones enhances temperature in shallower parts while leading to strain localisation in the deeper parts of the strike slip faults (Leloup et al., Reference Leloup, Ricard, Battaglia and Lacassin1999). Indeed, the ∼2.5 Ga Lu-Hf age obtained from deformed REE-rich grain cores of basalt-hosted apatite (Campo-Rodriguez et al., Reference Campo-Rodriguez, Ciobanu, Gilbert, Wade, Cook, Schutesky and Ehrig2025) is coeval with metamorphism of a volcanic sequence initially deposited in a rifting regime active during ca. 2.76–2.73 Ga and is attributed to the initiation of IOCG system at Jatobá.
We therefore suggest that the transition from trellis to silicate-mottled magnetite records deep shear metamorphism in the Canaã dos Carajás system with telescoping of multiple fluid fluxes. We explain the textural-geochemical differences between magnetite (and other minerals) present in both host rocks and ore zones by the variable overprinting effects during protracted fluid–rock interaction. The IOCG system is enhanced in areas of highest fluid flux and can be fingerprinted by a marked enrichment in REE and granitophile elements. Such an overprint is recorded at ∼2 Ga by U-Pb age determination of apatite indicating later re-equilibration during post-uplift mylonitisation of the host sequences (Campo-Rodriguez et al., Reference Campo-Rodriguez, Ciobanu, Gilbert, Wade, Cook, Schutesky and Ehrig2025).
Summary and implications
The major observations of this investigation are as follows:
Jatobá magnetite from mafic host lithologies and an orebody (massive magnetite with Cu-Ni-mineralisation) shows two distinct textures defined by the type of mineral inclusions: (1) trellis ilmenite and (2) silicate-mottled, respectively. Trace-element signatures for the two types of magnetite show distinct trends with more Ti, Cr, Co and Mn in trellis magnetite and a pronounced enrichment of REY and lithophile elements in the mottled type. Other elements, notably V, attain comparable concentrations (thousands of ppm) in both types. Trace elements from the so-called ‘granitophile group’ (U-Pb-W-Sn-Mo) are present in low, yet measurable quantities with abundant U-, W-, Mo-bearing inclusions observed in magnetite.
Magnetite records transitional textures from trellis to silicate-mottled with overlap between the two types, whereas ilmenite changes from lamellar to blebby and patchy textures. In the blebby subtype, Al-hydroxides (gibbsite) and talc (formed on behalf of pre-existing Mg-amphibole) are documented.
Nanoscale ilmenite–magnetite thermobarometry yields a range of temperature (from 728°C at logfO2 = –12 to 414°C at logfO2 = –31) for re-equilibration between magnetite and ilmenite from initial trellis to blebby and patchy textures in densely mottled magnetite. Allanite and titanite are documented from associations with calcic amphiboles within mottled magnetite. The formation of allanite from Ce-bearing calcic amphibole is recognised from epitaxial intergrowths between the two species at the nanoscale.
Pressure estimates of 6.4–7.4 kbar from ferro-tschermakite in the country rocks correlate with those recorded by the same amphibole species contained within magnetite. Such P-T conditions are compatible with amphibolite-facies metamorphism at a depth of ∼20 km. Syn-metamorphic deformation is documented from a range of textures, such as segregation of magnetite + apatite, within pods, folds and bands, as well as sigmoidal scapolite and pressure shadows surrounding magnetite.
These multiple lines of mineralogical–geochemical evidence support a genetic model involving deep shear-zone metamorphism in the root of the Canaã dos Carajás strike-slip structure. The transition from trellis to silicate-mottled magnetite records telescoping of fluid fluxes, with variable overprinting effects during protracted fluid–rock interaction, instead of hydrothermal system zonation as invoked by previous models. The model presented here is firmly constrained by apatite geochronology, a mineral typical of IOCG system evolution and which is ubiquitous throughout the Jatobá system (Campo-Rodriguez et al., Reference Campo-Rodriguez, Ciobanu, Gilbert, Wade, Cook, Schutesky and Ehrig2025). Comparable studies of magnetite from the other deposits in the orefield could prove the existence of a deeply rooted hydrothermal system as inferred from the 2.5–2 Ga age span recognised at Jatobá. The new model may have broad applicability to other IOCG systems hosted within shear zones from the Carajás Domain and elsewhere.
Large accumulations of Fe in the crust, including giant IOA deposits, can result from a combination of magmatic and hydrothermal processes, involving crystal fractionation/liquid immiscibility and/or metal scavenging by fluids directly from magma reservoirs during tectonic activation of crustal structures (Reich et al., Reference Reich, Simon, Barra, Palma, Hou and Bilenker2022 and references therein). A regional-scale correlation between tectonic structures and IOCG mineralisation is recognised in the Atacama Fault System and associated deposits of the Coastal Cordillera in Chile (Verdugo-Ihl et al., Reference Verdugo-Ihl, Ciobanu, Courtney-Davies, Cook, Slattery, Ehrig, Tornos and Hanchar2022; Seymour et al., Reference Seymour, Singleton, Gomila, Arancibia, Ridley, Gevedon, Stockli and Seman2024). In other cases, shear deformation and metamorphism have only redistributed pre-existing mineralisation, as has been considered for IOCG deposits along the Singhbhum Shear Zone in eastern India (Pal et al., Reference Pal, Selby and Sarangi2023). At Jatobá, we show that magnetite of igneous origin is concentrated during metamorphism and records fluid input associated with shear-zone activation linked to main ore deposition.
Supplementary material
The supplementary material for this article can be found at https://doi.org/10.1180/mgm.2025.10099.
Acknowledgements
The authors thank the staff of Adelaide Microscopy, particularly Animesh Basak and Nobuyuki Kawashima for their continuous support with analytical work. They also thank Sergio Huhn for his assistance with geological data. The constructive comments from two anonymous reviewers are greatly appreciated.
Financial Statement
Y.T.C.R and M.E.S acknowledge the Brazilian Research Council (CNPq – Project 409015/2021-0) and the Coordenação de Aperfeiçoamento de Pessoal de Nível Superior - Brasil (CAPES) - Finance Code 001. The Institute of Sustainability, Energy and Resources of the University of Adelaide supported analytical work. N.J.C. and K.E. acknowledge Australian Research Council Linkage grant LP200100156.
Competing interests
The authors declare that they have no known competing interests relevant to the reported research.


 Open access