


1. Introduction
In 1940s, scientists discovered the production of a rare carbon isotope (14C, approximately one in 1012 parts of 12C) in the atmosphere (Korff and Danforth Reference Korff and Danforth1939; Korff et al. Reference Korff1940) and its participation in the global carbon cycle through photosynthesis and food chain. Willard Libby and his group observed the absence of 14C in fossils and revealed its declining presence due to radioactive decay (Libby et al. Reference Libby1970). Radiocarbon has since then presented importance in versatile applications (Hajdas et al. Reference Hajdas2009), ranging from dating ancient (in e.g. Quaternary study and archaeology) or modern (in e.g. forensic science) samples, tracing metabolic pathways in human bodies, to determination of bio-/fossil- components (in fuel, fabric, or even the emissions of green-house gases and particulate pollution) for environmental considerations.
In different applications, samples under test may contain a wide dynamic range of the isotope. Figure 1 presents an exponential distribution of pMC (percent modern carbon) in the x-axis. One modern carbon (MC) is defined as the radioactivity of 14C in the atmospheric background in 1950, the year 0 BP (before present) in dating. In the earth science and archaeological studies, the limit of the 14C dating method is around 55 kyr BP (Hajdas et al. Reference Hajdas, Ascough and Garnett2021), when the radioactivity of such an ancient sample decays into 0.1 pMC. For modern samples after 1950, 14C contents present a sharp increase to ∼200 pMC in 1960s and decrease back to <100 pMC at present (Hua et al. Reference Hua, Turnbull and Santos2022; Kutschera Reference Kutschera2022). The atmospheric nuclear tests were restricted after 1960s, and the abnormal abundance was absorbed by oceans and terrestrial systems and also diluted by fossil emissions. The so-called bomb-peak curve is employed for dating modern samples in e.g. forensic investigations (Hajdas et al. Reference Hajdas, Calcagnile and Molnár2022; Johnstone et al. Reference Johnstone-Belford, Jacobsen and Fallon2023; Kutschera Reference Kutschera2022; Quarta et al. Reference Quarta, D’Elia and Braione2019; Wang et al. Reference Wang, Shen and Ding2010; Zavattaro et al. Reference Zavattaro, Quarta and D’Elia2007). Because of the increasing awareness of environmental protection and sustainable economy, the utility of fossil-based materials is now limited and replaced more and more by the use of recyclables. 14C therefore becomes a remarkable tracer to distinguish fossil and biogenic materials in e.g. fuels, fabrics, plastics, leathers, etc. (Carcione et al. Reference Carcione, Defeo and Galli2023; Delli et al. Reference Delli Santi, Bartalini and Cancio2021; Varga et al. Reference Varga, Hajdas and Calcagnile2023; Wang et al. Reference Wang, Luo and Tang2022). In 1949, Suess discovered that the 14C content in the atmosphere decreases because of the dilution by the CO2 emission from the fossil combustion (Suess et al. Reference Suess1955). 14C is considered the most promising tracer for evaluating the anthropogenic CO2 emission, which is a major factor responsible for global climate change (Cui et al. Reference Cui, Newman and Xu2019; Michael et al. Reference Michael2012; Pataki et al. Reference Pataki, Randerson and Dawson2010; Turnbull et al. Reference Turnbull, Lehman and Miller2007; Zhou et al. Reference Zhou, Niu and Wu2022). Such a dilution effect (Suess-effect) is usually not large, e.g., the anomalies in the downtown of a mega-city is only ∼10 pMC below the background value (Pataki et al. Reference Pataki, Randerson and Dawson2010). Measurement resolution below 0.1 pMC is required for Suess-effect evaluation, and this is quite challenging to analytical methods. Leakage risks of nuclear power plants, on the other hand, are another environmental concern. The finding of abnormally increased concentrations (up to several hundred times of MC) in the surrounding atmosphere and hydrosphere, or in biosphere over accumulation, can help to reveal and evaluate such risks (Buzynnyi et al. Reference Buzynnyi, Romanenko and Mykhailova2023; Cao et al. Reference Cao, Qian and Ren2024; Krishnan et al. Reference Krishnan, D'Souza and Nayak2022). 14C is also a perfect candidate to trace the medicine metabolic pathways and the micro-dosing technique has shown significant advantages for studies directly on human bodies for many obvious reasons (Arjomand et al. Reference Arjomand2010; Gao et al. Reference Gao, Li and Kasserra2011; Zoppi et al. Reference Zoppi, Crye and Song2007; Zoppi et al. Reference Zoppi and Arjomand2010). The safety limit for human beings is 250 nCi (Arjomand et al. Reference Arjomand2010). However, such a level of 14C in a human body is still hundreds even thousands of times above the atmospheric background.
The dynamic ranges of the radiocarbon’s contents in different types of samples and their coverage by different analytic techniques.
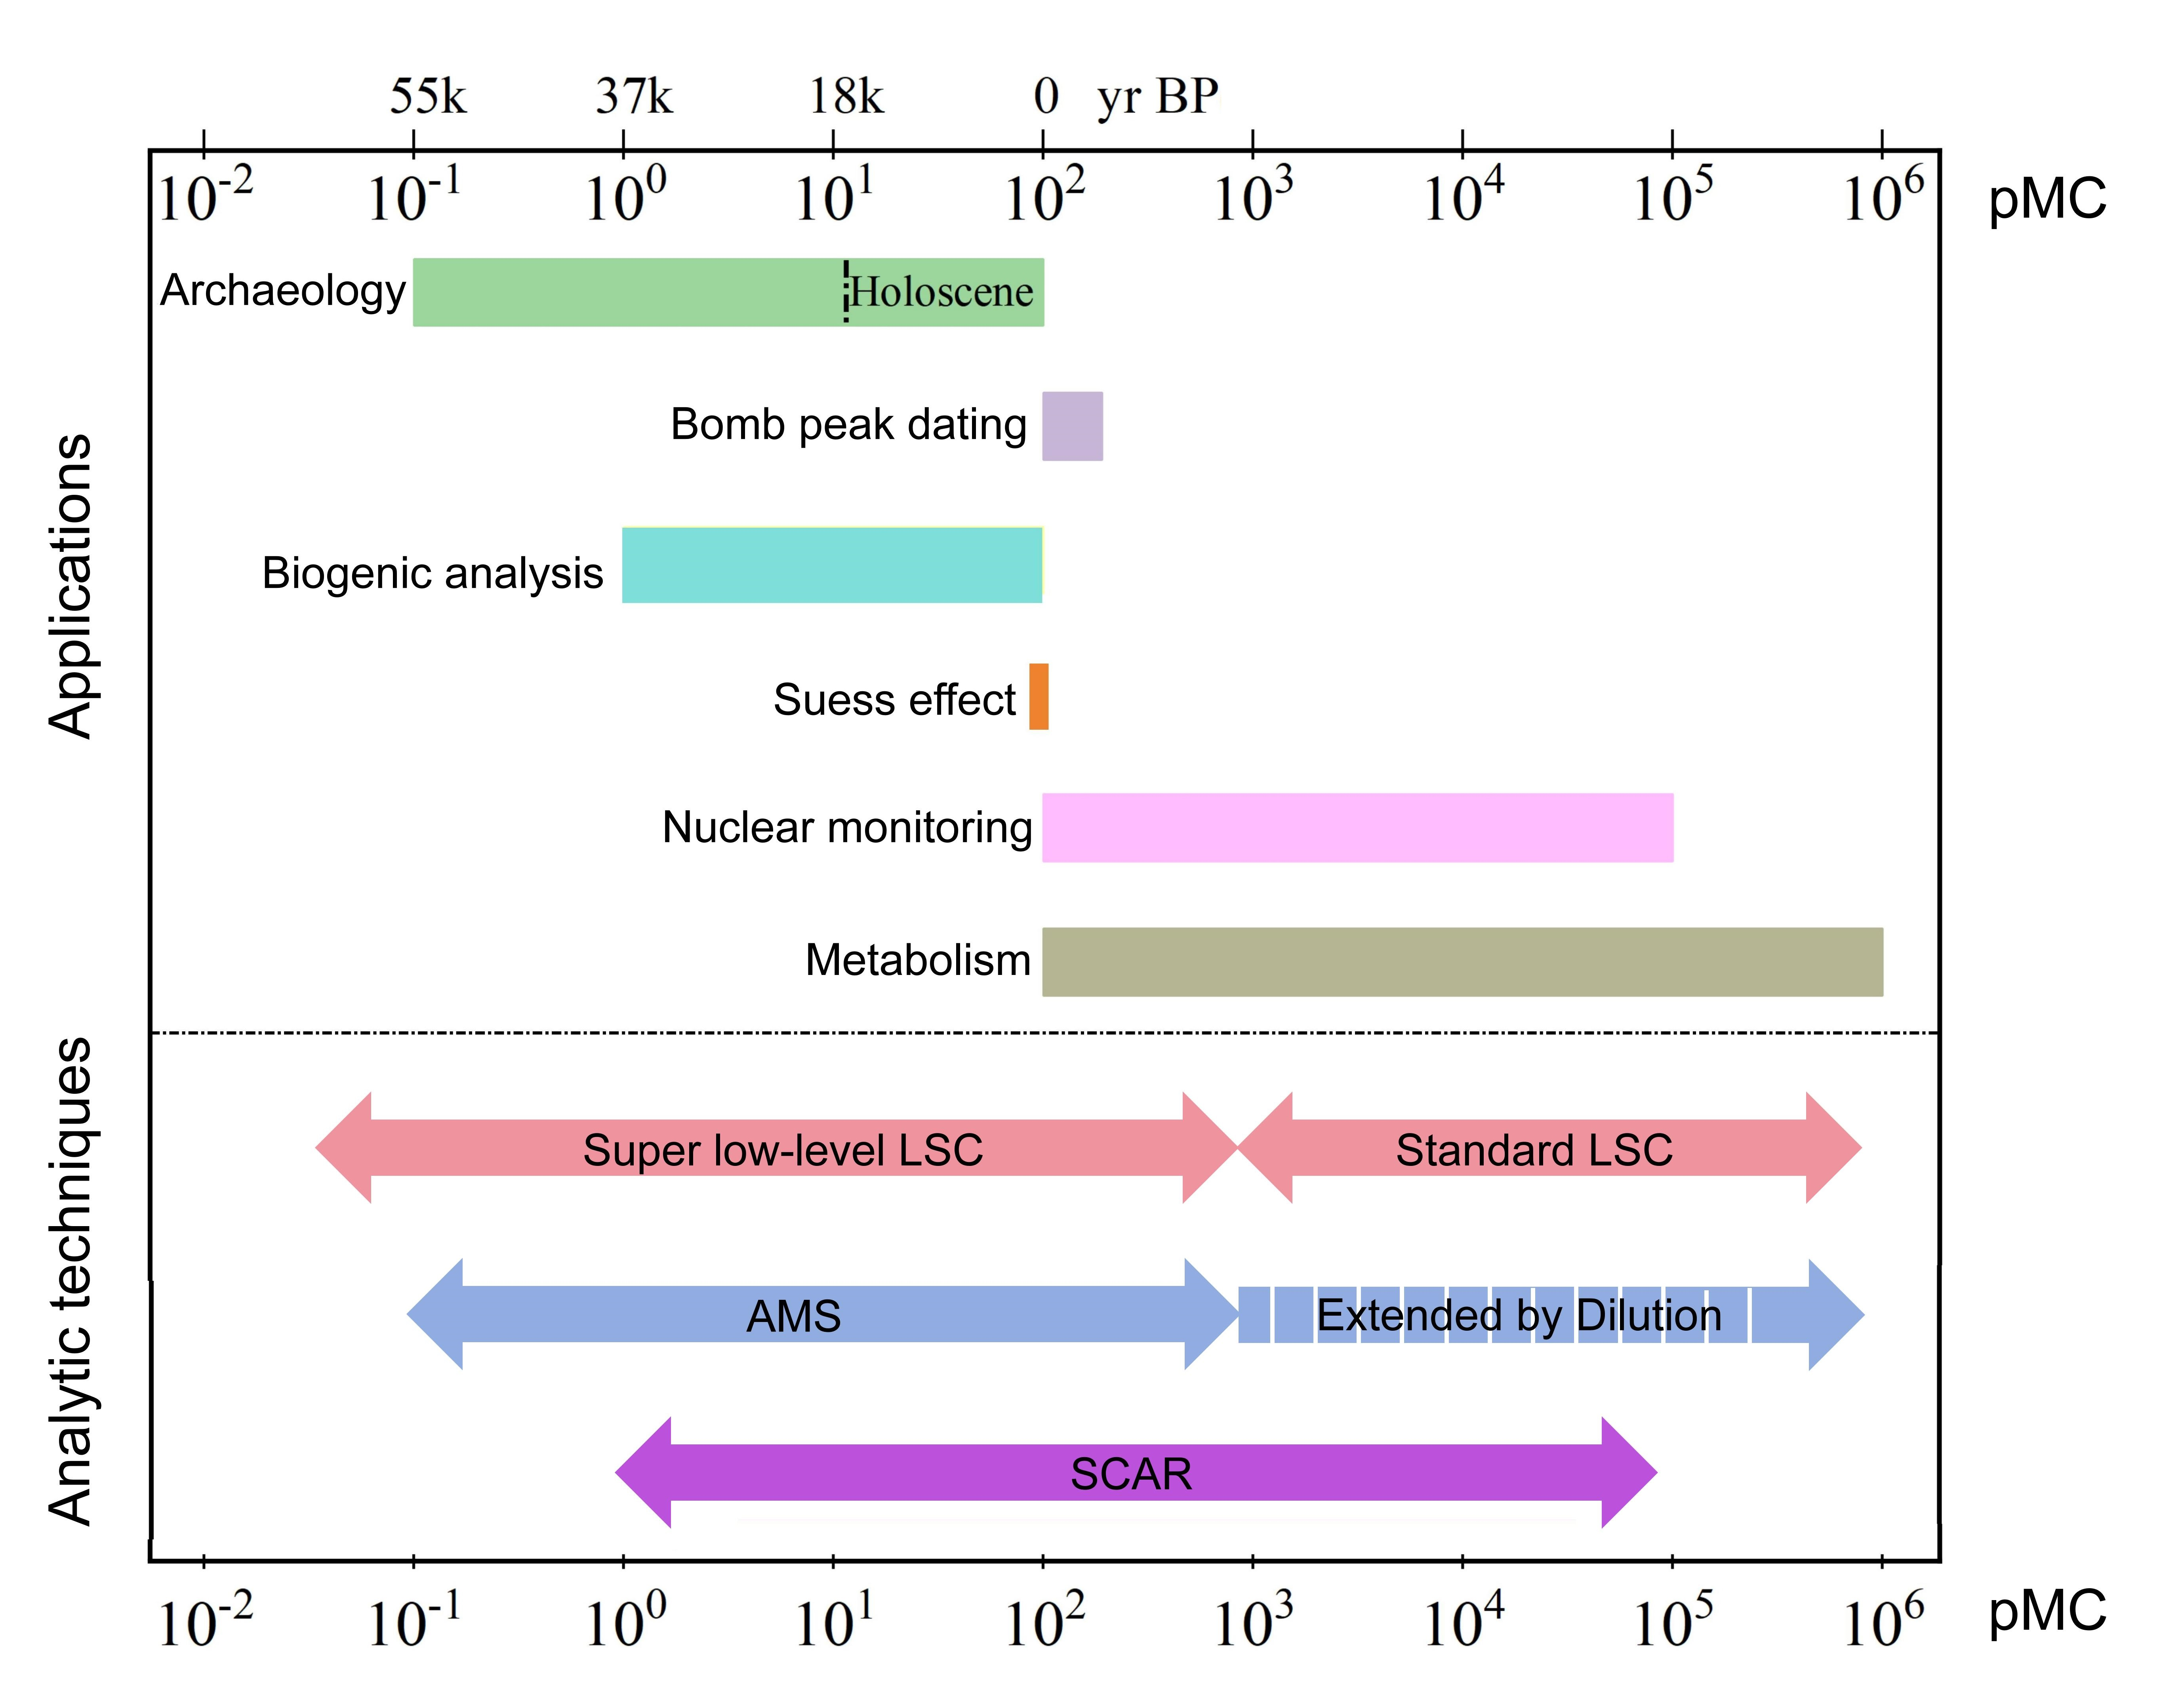
The development of 14C analytical methods has been driven by the needs in these applications. Libby’s brilliant screen-wall counter plotted the famous “curve of knowns” and deduced the half-life of 14C (Arnold et al. Reference Arnold and Libby1949) but was soon replaced by proportional gas counters (Vries and Barendsen Reference Vries and Barendsen1953) and later by liquid scintillation counters with much higher detection efficiency (Nazarov et al. Reference Nazarov, Kruzhalov and Ekidin2021). By applying massive lead shielding and coincidence counting techniques, ultra-low background (0.038 pMC) can be achieved using modern super low-level LSCs, which are ideal for very old samples (Hogg et al. Reference Hogg and Cook2022). LSCs dominated in archaeology and Quaternary study until the rise of accelerator mass spectroscopy (AMS) in 1970s. The latter has revolutionary advantages in the reduction of sample sizes and time consumption. However, up to date, LSCs are still frequently used in nuclear monitoring and medicine metabolism research, where sample consumption is not a problem and the higher radioactive levels in samples make the measurement time acceptable (Buzynnyi et al. Reference Buzynnyi, Romanenko and Mykhailova2023; Cao et al. Reference Cao, Qian and Ren2024; Krishnan et al. Reference Krishnan, D'Souza and Nayak2022; Zollinger et al. Reference Zollinger, Lozac’h and Hurh2014). After 40 years of development, AMS has become the king of 14C analysis. Sample size down to 10 μgC and precision of 1‰ using 1 mgC within 1 hr of measurement are realized by a compact AMS with footprint size of ∼8 m2 (Synal et al. Reference Synal, Stocker and Suter2007). AMS is an extremely sensitive instrument with a detection limit <0.1 pMC, but its dynamic range is usually within 104, which is not sufficient for metabolism applications. Therefore 100- to 1000-fold dilution is needed when AMS is employed for medicine samples (Arjomand et al. Reference Arjomand2010). These systems are not recommended to be shared with low-level measurements for the background contamination reason. Moreover, the acquisition and operation of an AMS instrument still have to bear a relative high cost. Laser spectroscopy (LS) on radiocarbon measurements has attracted enormous efforts (Fatima et al. Reference Fatima, Hausmaninger and Tomberg2021; Giusfredi et al. Reference Giusfredi, Bartalini and Borri2010; Galli et al. Reference Galli, Bartalini and Ballerini2016; Jiang et al. Reference Jiang and McCartt2021; McCartt et al. Reference McCartt, Ognibene and Bench2016; Zare et al. Reference Zare2012) and one of the most successful techniques is called Saturated-absorption CAvity Ring-down spectroscopy (SCAR) (Giusfredi et al. Reference Giusfredi, Bartalini and Borri2010). Through the continued improvement over the last decade, SCAR has now been commercialized at the ppqSense company, with performances quite close to AMS but with a much less cost. The lower detection limit is 1 pMC and the upper limit is 105 pMC. A precision of 0.3 pMC can be achieved by averaging the absorption signal in 4 hr. Laser spectroscopy method offers new opportunities for applications where AMS is deemed too complicated and expensive, meanwhile LSC is inappropriate for sample processing complexity and time consumption reasons.
In this paper, the working principle of SCAR and its sample preparation procedure are described. Samples in different phases were prepared and measured to demonstrate the feasibilities of the technique in different applications including Suess-effect evaluation, biogenic component analysis, food fraud detection, dating, and medicine metabolism study. In the final section, the performances of the SCAR technique are concluded and discussed.
2. Methodology
2.1 Saturated absorption CAvity Ring-down spectroscopy (SCAR)
SCAR is a special Cavity Ring-Down laser Spectroscopy (CRDS) by employing the saturated absorption region of the ring-down curve to reduce noises induced by the mechanical vibration and therefore increase the sensitivity dramatically. The working principle of the technique has been described in detail in (Giusfredi et al. Reference Giusfredi, Bartalini and Borri2010; Galli et al. Reference Galli, Bartalini and Ballerini2016; Zare et al. Reference Zare2012).
As a molecular absorption spectroscopy, SCAR measures 14CO2 concentration in pure CO2 gas sample by scanning the laser wavelength through 2208–2212 cm–1 to cover the absorption line (0001-0000) P(20) of 14CO2 molecule and fitting the absorption spectrum with a Voigt function. As shown in Figure 2(a), the spectral area covered by the fitting curve is proportional to the abundance of the molecule, and the fitting residual is used to evaluate the measurement uncertainty. It is possible to derive the systematic error using multiple measurements of the same sample. To report the measurement result in percent Modern Carbon (pMC) or Fraction Modern (F14C), the 14CO2 abundance needs to be calibrated by reference materials and corrected by the fractionation factor of isotope 13C (i.e. δ13C) (Stuiver and Polach Reference Stuiver and Polach1977). δ13C values of CO2 gases can be either measured by an Isotope Ratio Mass Spectroscopy (IRMS), a Cavity Ring-Down Spectroscopy (CRDS), or obtained through looking up empirical data (Julien et al. Reference Julien, Parinet and Nun2015). Figure 2(b) shows a standard 4-point accuracy analysis on reference materials IAEA C1, C7, C8, and NIST OXII, and a root-mean-square deviation of 0.50 pMC is achieved. A 2-point calibration has been performed by using IAEA C1 as 0 pMC point and the NIST OXII standard as 134.07 pMC point. δ13C values of the reference materials are from suppliers and have been applied in the above calibration and data-quality assurance.
(a) The spectral area (the yellow green) below the fitting curve (red) is proportional to the 14 C abundance. The green spectral area (100 pMC) is plotted for comparison. The fitting residuals in the bottom is to calculate the uncertainty of the result. (b) Reference materials IAEA C1, C7, C8 and NIST OXII are used to evaluate the absolute accuracy of the technique by calculating the root-mean-square deviation.

It is worthwhile mentioning that to avoid the interference from the N2O molecules which have absorption line located very close to the chosen 14CO2 line, the absorption cavity is stabilized at the low temperature (170 K) and low pressure (12 mbar) to keep the spectral profile sufficiently narrow. The N2O gas is expected to be well removed in the sample preparation procedure (described below). For some cases where residual N2O does induce interference (which can be observed in the absorption spectrum), an extra fitting algorithm on the N2O spectrum will be applied to compensate the measurement.
2.2 Sample preparation for SCAR
SCAR is designed to measure 14CO2 in pure CO2 gas. With a preparation system, it is able to measure solid, liquid and gaseous samples containing radiocarbon. The procedure is similar to the established technique (Aerts-Bijma et al. Reference Aerts-Bijma, van der Plicht and Meijer2001). The flow chart of sample preparation is shown in Figure 3. Solid samples are cut into small pieces and weighted by a high precision digital analytic balance, while liquid samples are picked and measured by a micro-pipette. They are packaged by Tin cups and combusted at an elemental analyzer (ESC 8020 CHNS/O, NC Technologies S.R.L.) into CO2 gases. The elemental analyzer is a furnace (operated in 950°C) connected with gas filters and a gas chromatography (GC) to separate CO2 from other gases. The gaseous sample, ambient air, is prepared by a gas concentrator (ESC 8070 Air CO2, NC Technologies S.R.L.) where CO2 in the air sample is purified and accumulated. The CO2 gas is delivered from ESC 8020 or ESC 8070 by a helium carrier gas to a homemade zeolite filter or a glass flask bathed in liquid nitrogen, where the helium gas passes through and the CO2 gas is trapped. The zeolite filter is connected to SCAR cavity and CO2 is released into it automatically by heating the zeolite. The glass flask connects to SCAR manually for flexibility in applications.
The flow chart of the sample preparation for SCAR.
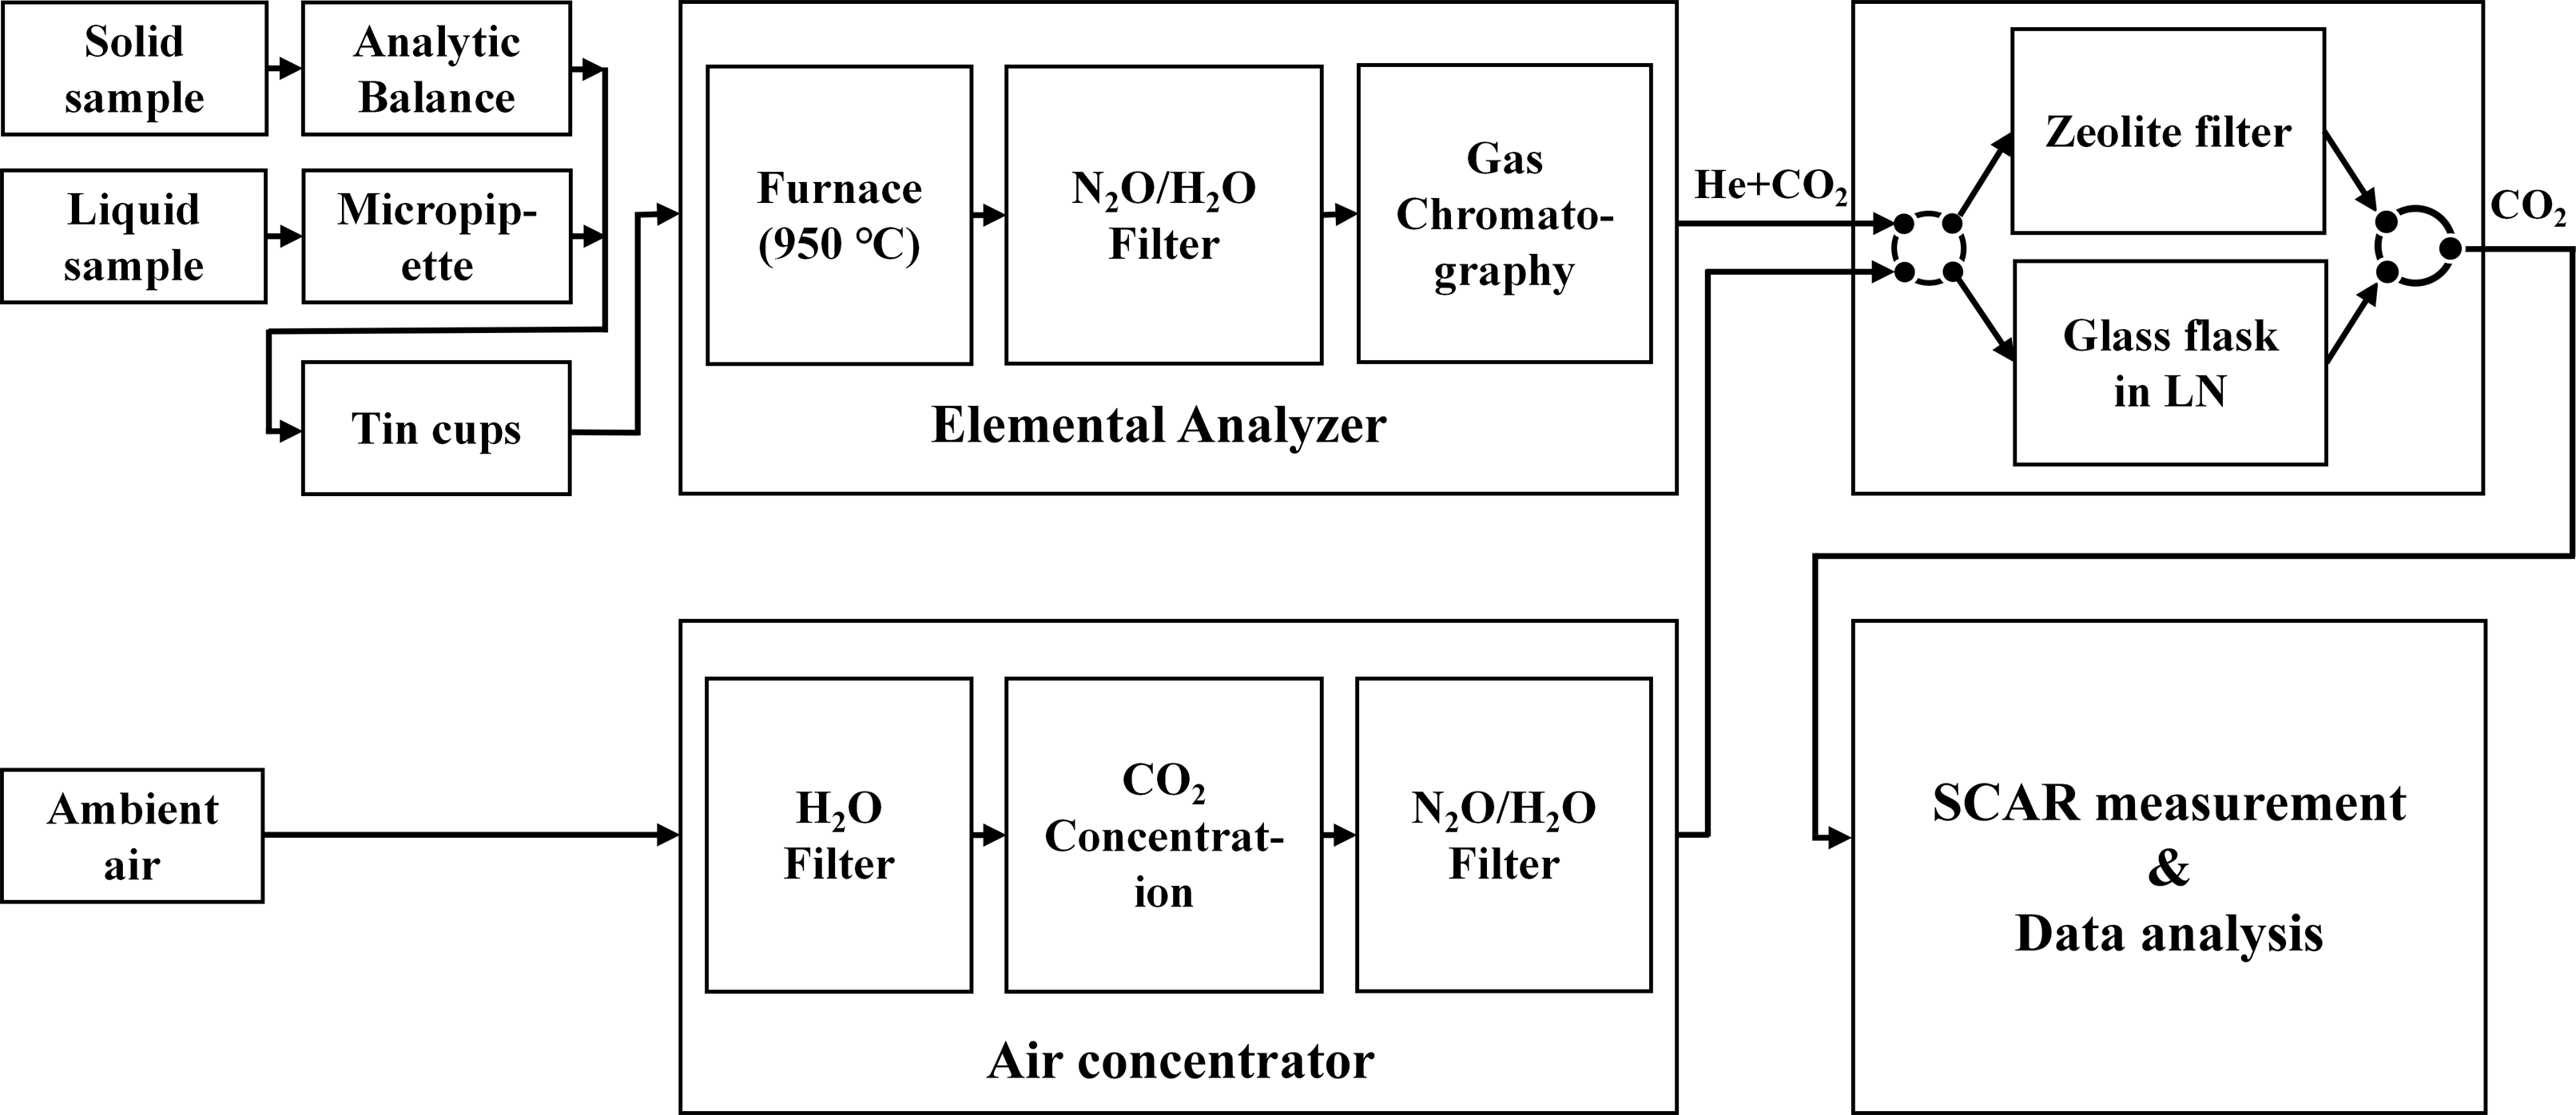
To fill the absorption cavity sufficiently, a minimum carbon mass ∼1 mg is required. The typical time for ESC 8070 or ESC 8020 to prepare such amount of CO2 is ∼15 min. The measurement time of SCAR ranges from minutes to hours for different uncertainty levels on-demand.
Water vapor and N2O gas are harmful to the measurement. The former will be frozen on the high-reflectivity mirrors at the low temperature in the cavity, and the latter is an interference gas as aforementioned. Specific filters are thus designed in ESC 8070 and ESC 8020 to remove them. Water vapor is absorbed by SICAPENT® trap, and the N2O is removed by a copper-powder column heated to 550°C.
3. Measurements and results
3.1 Suess effect evaluation
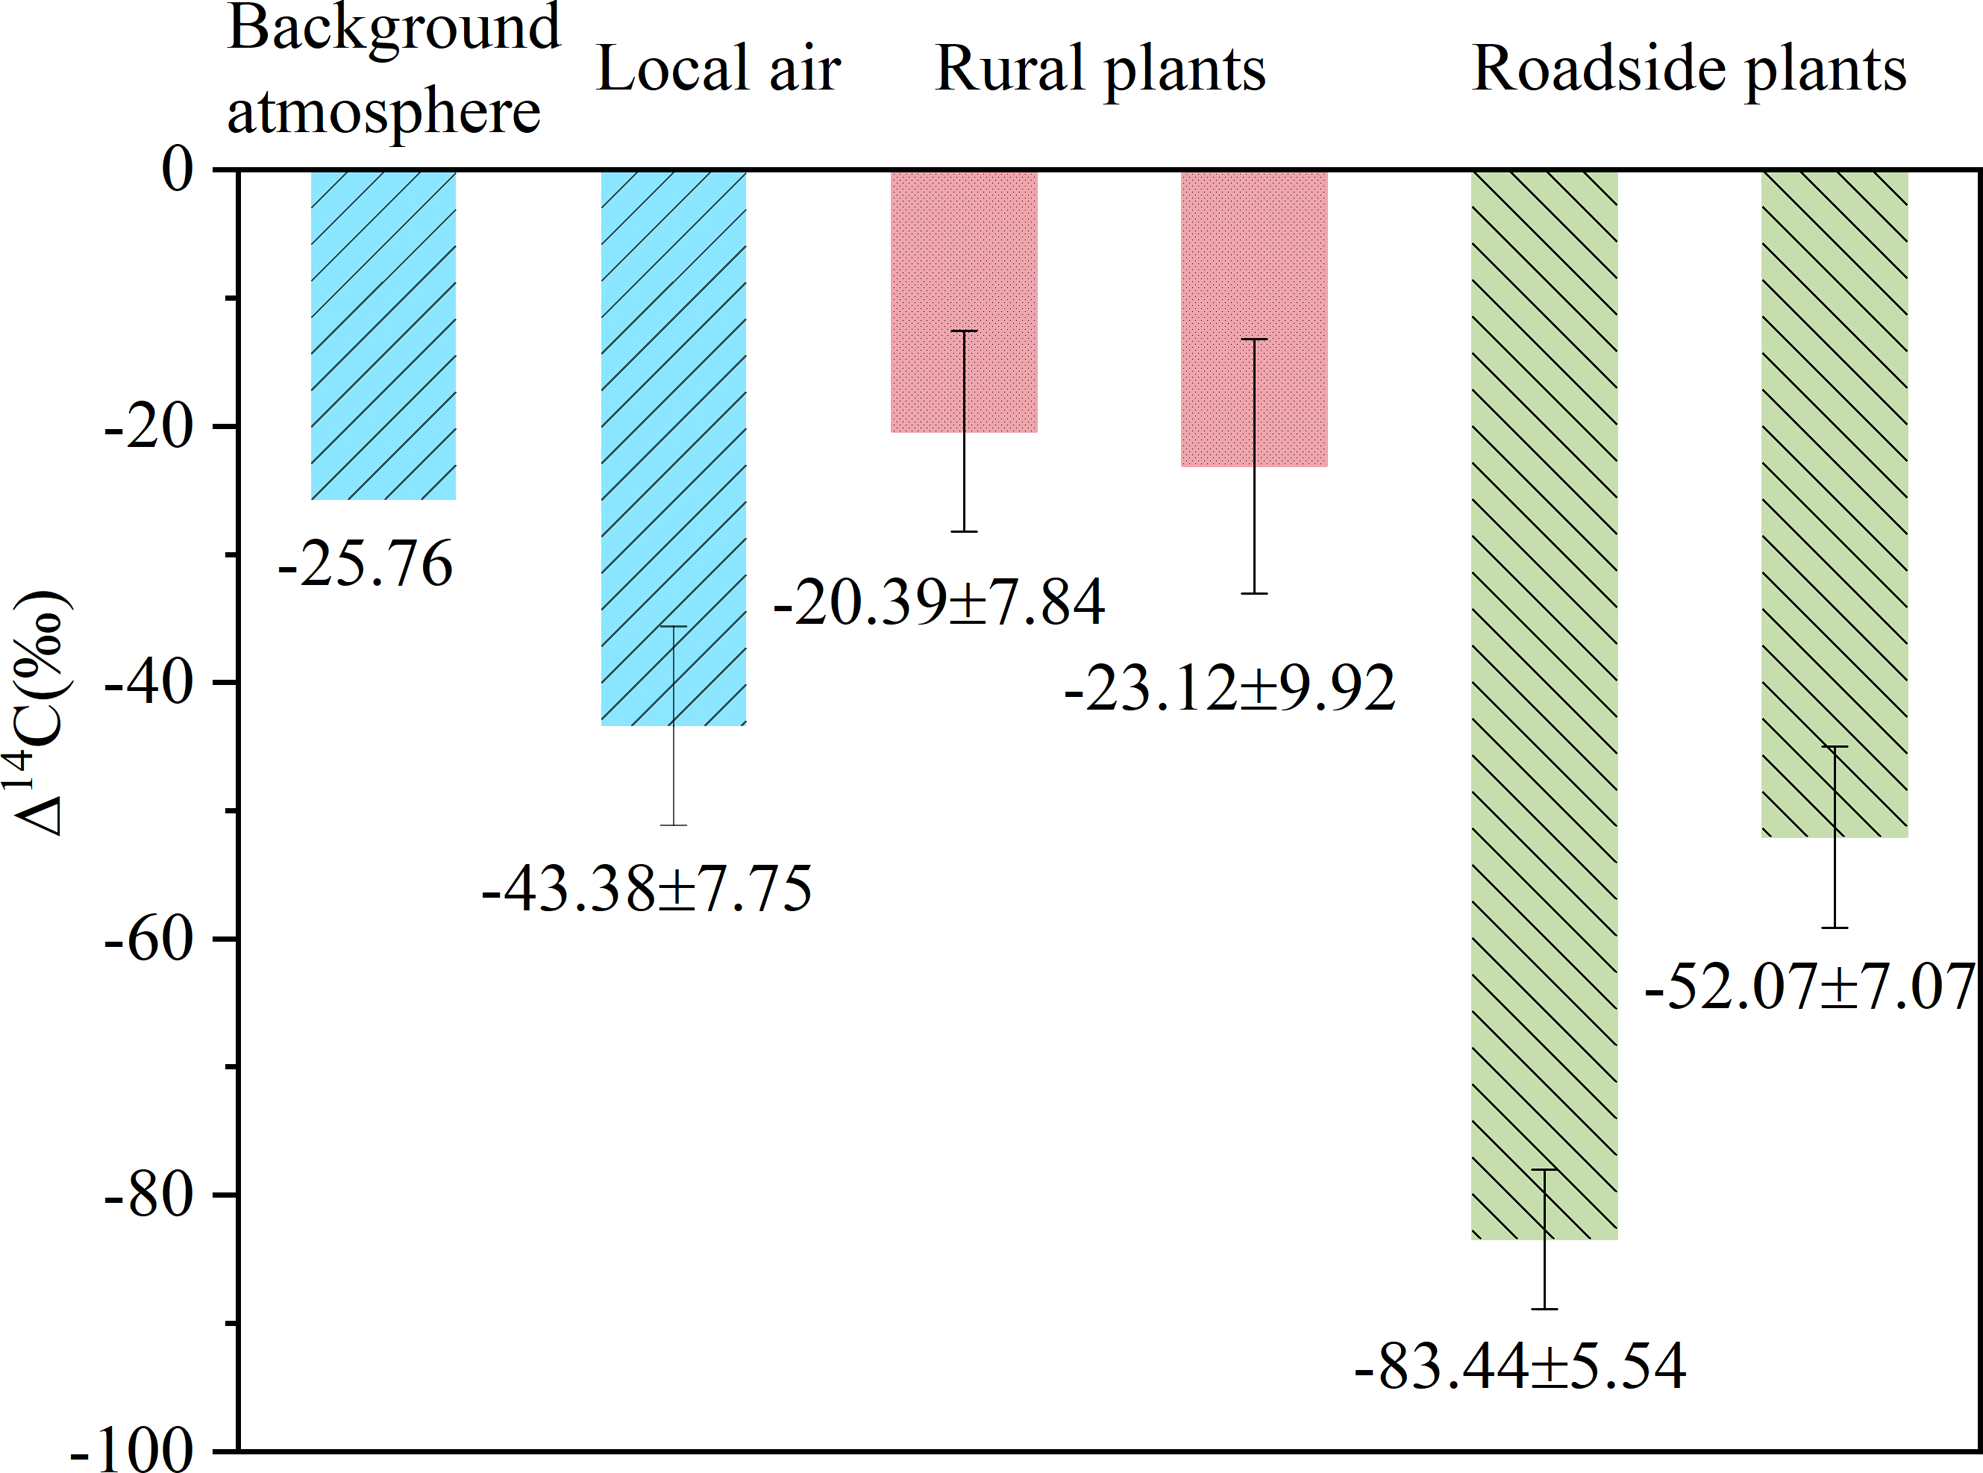
To observe the Suess effect induced by the fossil emission, the same kind of plants (Bromus) were collected from two different locations at a town close to the city of Florence in Italy. Some samples are from a rural area, and the others are from the roadside close to a gas station where the traffic is quite busy. The plants were already dry when collected, and they were prepared in laboratory by weighting and packaging before being combusted in the elemental analyzer. The carbon-content ratios were measured to be around 30%, and ∼5 mg of raw leaves was sufficient for SCAR to analyze its 14C abundance.
The ambient air of an industrial area (outside the Florence city where the laboratory of ppqSense company locates) was collected and CO2 in the air sample was concentrated by ESC 8070. The enrichment time was 15 min and totally 16.5 mg of CO2 (i.e. 4.5 mg carbon mass) was collected. The measurement procedure takes from 30 min to hours, depending on the measurement accuracy. In this experiment, a measurement uncertainty of ±0.5 pMC was achieved in 90 min of averaging. A quasi-continuing measurement with time resolution of 30 min can be expected, which is a solid competitive advantage over AMS and LSC for the ambient air monitoring.
In Figure 4, the measurement results are presented in Δ14C, indicating the deviation of 14C in parts per thousand (per mil) from the preindustrial atmosphere (Reimer et al. Reference Reimer, Thomas and Ron2004). To do fractionation corrections, the δ13C values of the ambient air (–9 ± 3‰) and of the plants (–28.10 ± 2.5‰) are obtained from literatures (Stuiver and Polach Reference Stuiver and Polach1977; Troughton and Card Reference Troughton and Card1975). Δ14C value of the background atmosphere in 2024, which works as the reference, is deduced by applying an annual decrease of 5‰ on the 2019 data (Hua et al. Reference Hua, Turnbull and Santos2022). The local ambient air (of the industrial area) and the plants from the roadside present clear decreases, while the plants collected in the rural region does not. This reveals that the atmospheric 14CO2 in the industrial area and at the road side are diluted by the emissions from fossil fuels.
The air from the local industrial area and the plants from the roadside contain less 14C while the rural plants present an equivalent level, comparing with the background atmosphere.
3.2 Biogenic content analysis
As global warming and climate changes progressively increases social concerns, the restriction on fuels and raw materials from fossils has become a common awareness to reduce CO2 emissions. Adding bio-content into fossil fuels such as petrol, nature gas and coal is an effective practice and has become national polices in many countries, and the application of fossil-limited/free materials in fashion market becomes a trend. Radiocarbon measurement provides scientific backing in determining the biogenic content in fuels or fashion materials. SCAR has been proven to be a novel and effective technique for such applications. It was applied to analyze biogenic components in fuels (Delli et al. Reference Delli Santi, Bartalini and Cancio2021) and fashion materials (Carcione et al. Reference Carcione, Defeo and Galli2023), and the results were consistent with AMS.
In this paper, two bio-plastic materials were analyzed by SCAR. Plastic-1 is from a disposable cutlery case containing a PLA (polylactic acid) material. Plastic-2 is from a supermarket (Coop Italy) shopping bag containing a registered bio-plastic material called Mater Bi®. For the two materials, 6 mg and 5.4 mg samples were prepared and measured, respectively. Both materials contain a similar carbon-mass content (∼40%) but different radiocarbon abundances (14.64 ± 0.88 and 66.22 ± 0.88). Although no fractionation correction is performed, distinct values (15% and 66%) of the bio-mass ratios for the two materials are still well deduced, respectively, by assuming the radiocarbon abundance of pure bio-materials to be one hundred percent Morden.
3.3 Dating
To demonstrate the feasibility of SCAR for dating applications, ancient and modern (after 1950) samples were respectively analyzed. Modern samples include a bottle of white wine in 1979, and a piece of wood collected from an old gate in the downtown of Florence. The exact age of the gate is not known. The ancient sample is 950 mg of a sediment from Chinese Academy of Geological Sciences (CAGS). The sediment was pretreated with the acid-base-acid (ABA) method and the 14C and 13C abundances were measured by AMS at CAGS. The zero-background graphite used at the AMS is also measured by SCAR for comparison.
0.05 mL of the white wine and 8.8 mg of the gate wood were used in the measurements. The 14C abundances of the wine and the wood were measured, and the values of Fraction Modern (F14C) were deduced to be 1.2934 ± 0.0088 and 1.0726 ± 0.0126, respectively. δ13C of the two samples were from literatures (Stuiver and Polach Reference Stuiver and Polach1977; Troughton and Card Reference Troughton and Card1975), i.e. –28.10 ± 2.5‰ and –25 ± 5‰ for grape and wood, respectively. Applying the bomb-peak curve, the age of the white wine is determined to be 1979 ± 2 calendar year (Figure 5(a)). For the wood, Figure 5(b) indicates two possibilities, and we believe the real age of the tree is more likely in 1956–1958, since the appearance of the old gate suggests that the tree should not have been cut down later than 2000.
Dating the ages of the white wine (a) and old wood (b) samples with bomb-peak curve. The comparison of the results between the SCAR and AMS measurements (c) and the age evaluation (d) of the sediment. The measurement on the background graphite in (c) is for the zero-point check.
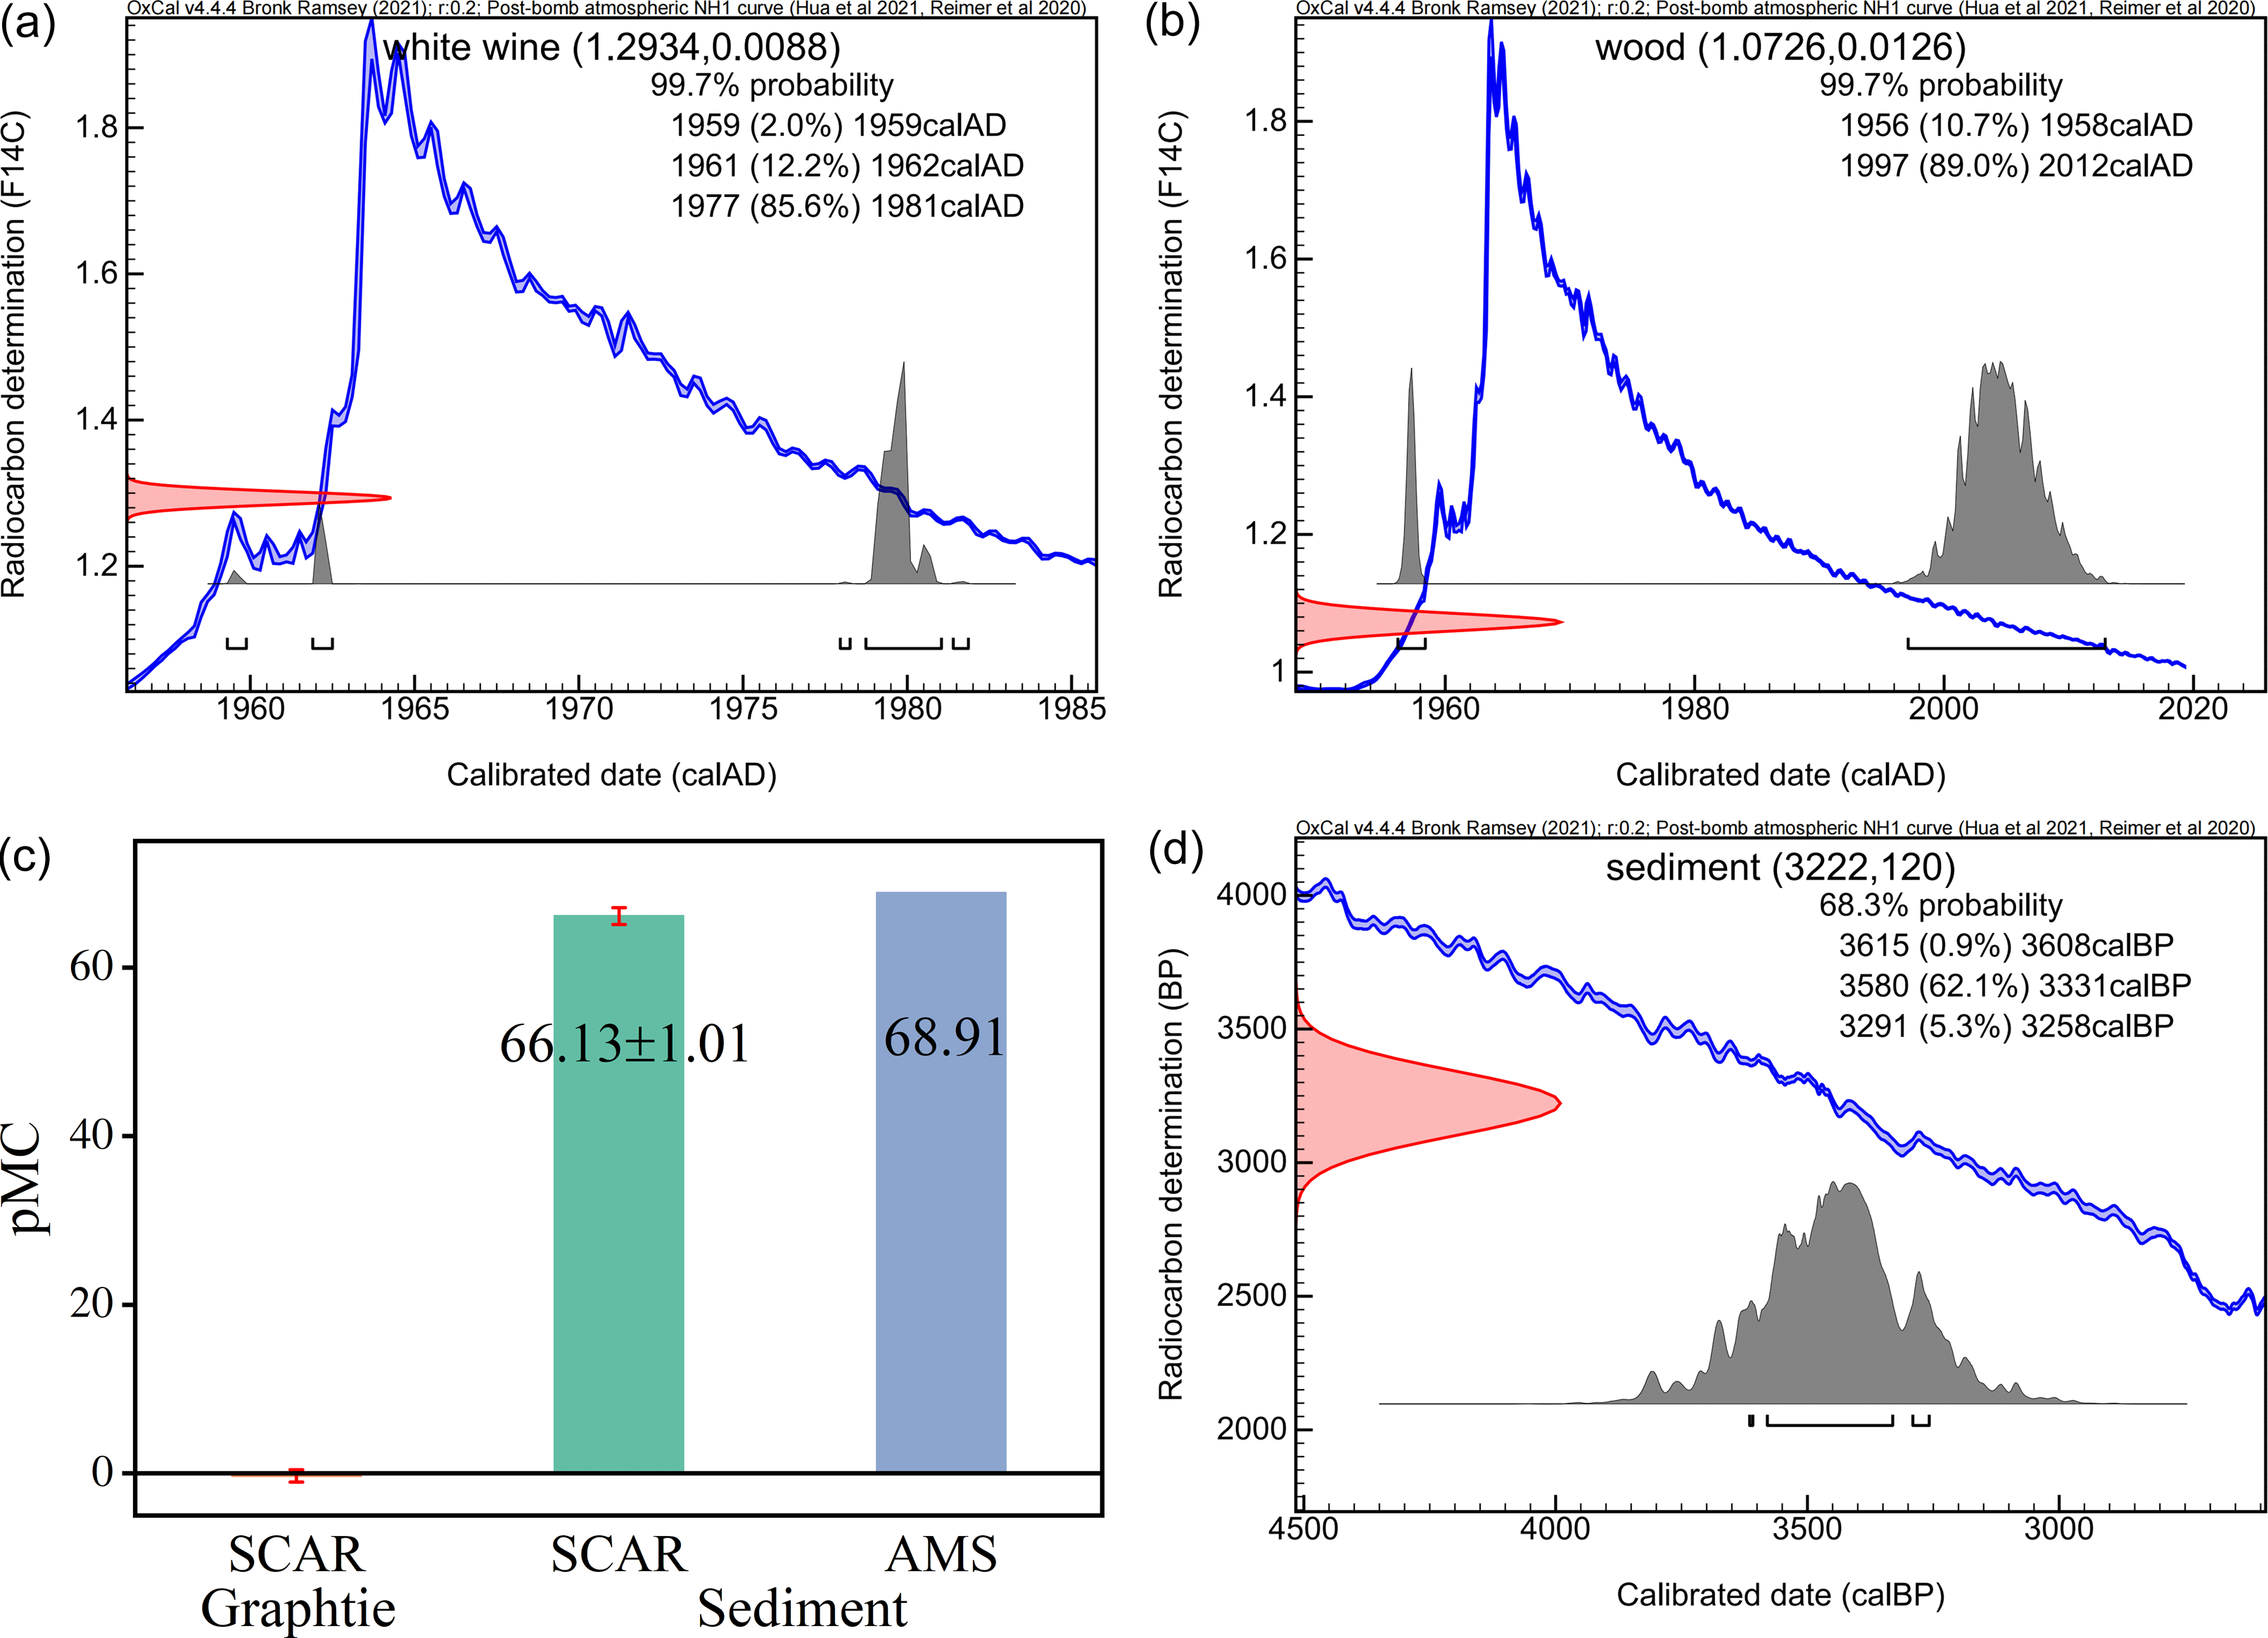
Since the carbon content of the sediment was measured to be only ∼0.2%, to accumulate enough CO2 for measurement, 950 mg of sediment was divided equally into 10 parts (i.e. 100 mg/part and the last being 50 mg) and combusted using the EA individually. The CO2 was collected by the glass flask bathed in liquid nitrogen. The accumulated CO2 was finally fed into SCAR for measurement. The measured 14C abundance of the sediment was 67.10 ± 1.01 before doing δ13C correction. The interference from N2O gas appeared in the measurement and the compensation algorithm was applied. An abnormally high uncertainty ± 1.01 was produced even we had averaged the signal for 90 min. The fractionation factor δ13C (−24.08‰) obtained from the AMS measurement at CAGS was employed for correction, although this value differs from that of the original CO2 gas before graphitization (Fahrni et al. Reference Fahrni, Southon and Stantos2017). After δ13C correction, our result is 66.96 ± 1.01, which is consistent with the AMS result of 68.91 pMC, see Figure 5(c). The age of the sediment is determined to be 3222 ± 120 yr BP (Figure 5(d)).
3.4 Food fraud detection
Radiocarbon was utilized to detect food fraud (Palstra et al. Reference Palstra and Meijer2024; Quarta et al. Reference Quarta, Hajdas and Molnár2022; Tudyka et al. Reference Tudyka and Pawlyta2014; Varga et al. Reference Varga, Hajdas and Calcagnile2023) by analyzing the biological component or determining the age of the food and beverage. For instance, vinegar in many countries is obliged to be produced from plants through the fermentation process while acetic acid is also available by industrial synthesis from fossil materials. The latter has a lower cost and hence is possibly used to produce synthetic vinegar. In China, the national standard (GB1886.10-2015) states that the ratio of the natural (biological) component in vinegar should be above 95%. Aged wines and liquors are usually of higher quality, so the fraudulent production of aged and expensive alcohols is often mixed with younger ones. Radiocarbon abundance in the ethanol reveals the real age of the alcohol, i.e., the exact year the grape or wheat was planted. Different from acetic acid, gelatins are from nature proteins, whether as food additive or for industrial usage. Edible gelatin is from fresh materials and usually with a shelf-life less than 2 years. Industrial gelatin, however, is possible to come from recycled materials and thus might have older radiocarbon age. It was reported that industrial gelatin was illegally used as a food additive for cost saving.
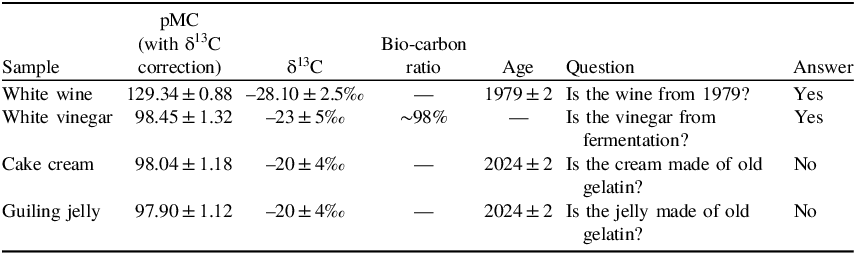
To verify the performance of SCAR in such applications, a bottle of white wine from 1979, a bottle of white vinegar (made in 2024), some cream in a packaged Macaron cake and some Chinese Guiling jelly (the latter two contain gelatin) were tested. 0.05 mL of wine, 0.15 mL of vinegar, 5.9 mg of cake cream, and 50 mg of jelly were prepared and measured. No special treatment was applied before the combustion and the measurement procedure that takes 30 or 60 min/sample.
Table 1 shows the measurement results and evidences to support the use of SCAR for food fraud detection. The values of δ13C are from literatures (Stuiver and Polach Reference Stuiver and Polach1977; Troughton and Card Reference Troughton and Card1975). Dating with the bomb-peak curve (see Figure 5(a)), the age of the white wine is determined to be 1979 ± 2. The bio-carbon ratio in the vinegar is higher than 95% (the Chinese national standard for fermented vinegar) by assuming the 14C abundance of pure bio-materials to be 100 pMC. The carbon in both cake cream and jelly are proven to be from young materials and there is no old gelatin added.
Measurement results and evidence to answer questions regarding food fraud detection
3.5 Medicine metabolism study
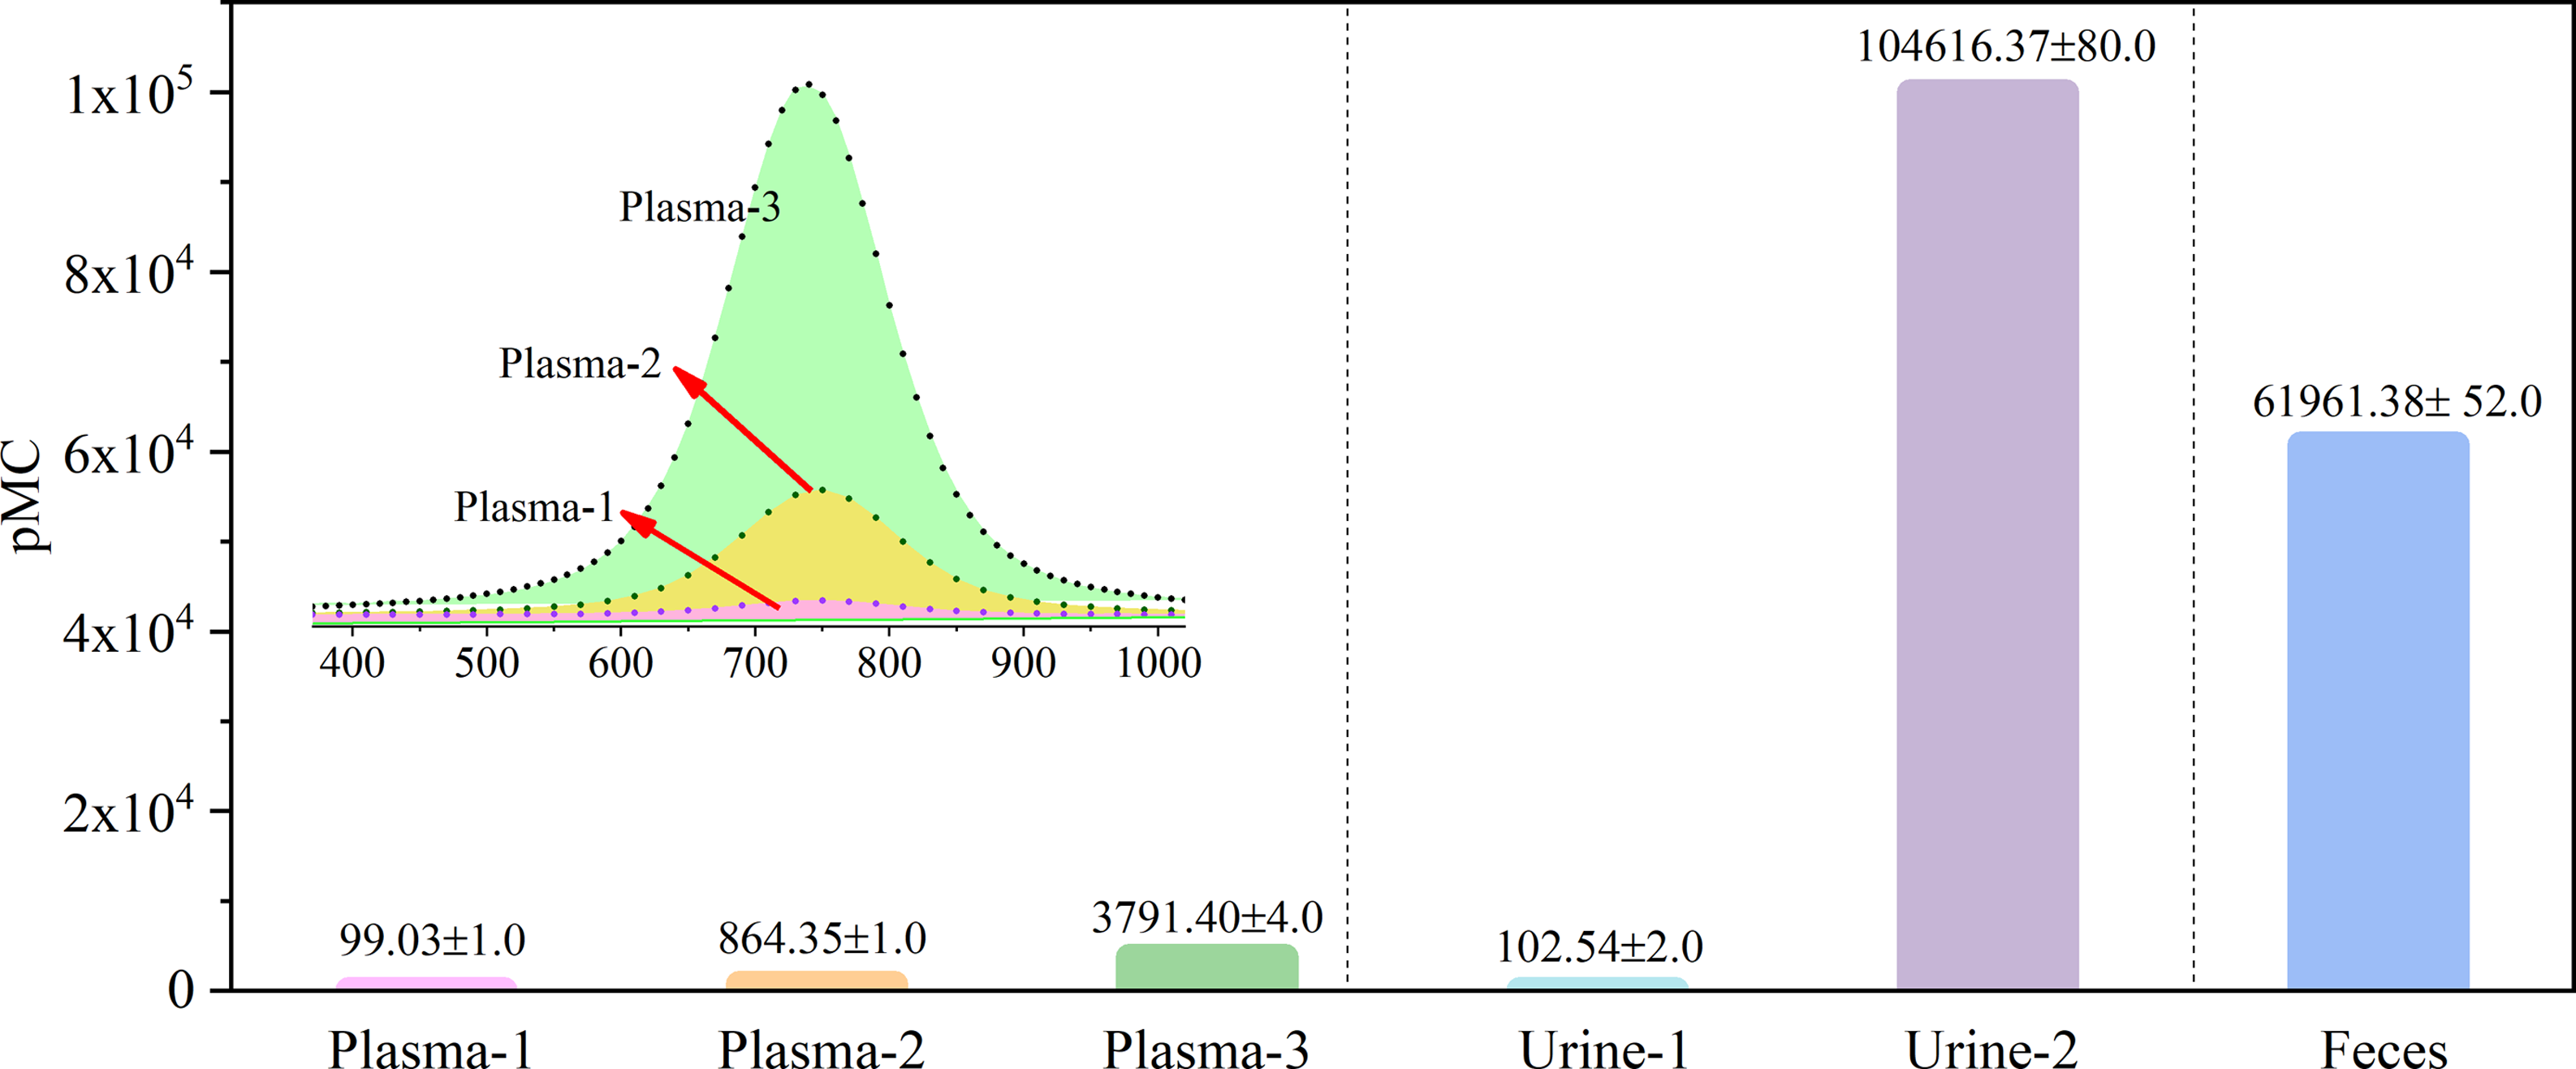
To test the performance of SCAR to its upper detection limit, human metabolic samples labeled with 14C were analyzed. Three plasma samples, two urine samples, and one feces sample were prepared and measured. The sources of the samples are not revealed for confidential reasons.
Among the three plasma samples, two (Plasma-2 and Plasma-3) are from experimental groups who took the 14C-labeled medicine while sample Plasma-1 is from the control group who did not take the medicine. 0.1 mL (100 mg) of each sample were combusted by EA directly and measured by SCAR. The measurement times for the three samples are 30, 10, and 2 min respectively. From Figure 6, one can see that Plasma-1 from the control group, presents 99.03 pMC close to the nature background, while the other two samples present around 8.6 and 38 times of the background, respectively. Similar to the plasma samples, the sample Urine-2 is from the experimental group and Urine-1 is from the control group. The urine was absorbed on a piece of paper and the paper was dried and cut into small pieces (∼30 mg) for combustion and measurement. The carbon masses of the urine samples on the papers were, however, not measured. The 14C concentration of the experimental group is beyond 105 pMC, 1000 times of that measured in the control group. The real concentration of the urine is believed to be even higher since it has been diluted by the carbon mass of the paper. The feces sample is only from the experimental group and there is no control group for reference. 33 mg of sample was directly combusted and measured, and ∼6×10⁴ pMC of 14C was observed.
The comparison between experimental and control groups among different metabolic samples (left: plasma; middle: urine; right: feces). The inset shows the spectral areas of different plasma samples.
4. Conclusion and discussion
In conclusion, a total of 24 (16 solid, 7 liquid and 1 gaseous) samples were prepared and analyzed using SCAR, in the laboratory at the ppqSense company in Florence. The time consumption, the sample mass, and the measurement results (with and without δ13C correction) of each sample are listed in Table 2.
The summary of 24 samples prepared and analyzed by SCAR measurements

From the table, one can see that the minimum carbon mass measured using SCAR is 1.4 mg. According to the ppqSense company, the minimum value is now 0.6 mg for the newest version of SCAR. This is competitive with LSC but still worse than AMS. To obtain this amount of carbon mass, in most cases, we need several to tens of mg in raw materials. They can be combusted using an EA in one working cycle since the maximum sample mass taken by the EA is suggested to be <100 mg. It is an exception for the white vinegar and the sediment, in which the carbon mass ratio is very low (1.3% and 0.2% respectively). 150 mg of vinegar and 950 mg of sediment were utilized, and they were separated into equal parts and combusted for 2 and 10 times, respectively. For the ambient air, in a 15-min cycle by the ESC 8070, a total of 21 L air was concentrated and 16.5 mg CO2 was trapped at the zeolite filter.
The sample-preparation and measurement procedures for SCAR are relatively simple. Unlike AMS where graphitization is required and LSC where the scintillation liquid needs to be prepared, SCAR analyzes CO2 gases directly. The samples can be combusted directly by EA and the CO2 gas can be trapped by the zeolite filter. The entire preparation procedure is automatic and takes only 15 min. Even in the most difficult case with sediment, where the sample is divided and combusted for 10 times, the preparation time (105 min) is acceptable. The SCAR measurement is also automatic, and the time taken for one sample ranges from 30 min to hours, depending on the uncertainty required by the applications (discussed later). For high-concentration samples like in medicine metabolism studies, the measurement time can be reduced to several minutes. The preparation and measurement procedures are independent and thus can be operated in parallel: when a delivered CO2 gas sample is under measurement, a new cycle of combustion or enrichment can start at ESC 8020 or ESC 8070. These advantages make SCAR a potential candidate in commercializing integrated radiocarbon laboratories, which is very difficult for AMS or LSC techniques to realize. It is worthwhile to mention that SCAR is probably the only technique hopeful in realizing real-time (or near real-time) ambient radiocarbon measurement in the future. This would be especially valuable to e.g. the fossil-emission evaluation and source identification, the nuclear leakage monitoring, etc.
SCAR’s measurement range is broad, with the lower limit of detection (LLD) to 1 pMC and the upper limit to 105 pMC. AMS performs better near the LLD (<0.1 pMC) region, but its dynamic range is usually limited to 104. LSC theoretically can measure low concentration, but the sample and time consumptions are not so practical when 14C abundance is close to or below the natural background. The broad measurement range of SCAR makes it a versatile solution for many applications. For archaeological studies, the theoretical age limit is 37 kya (corresponding to the LLD 1 pMC). However, in practice the measurement uncertainty at such a low concentration cannot support the dating precision. 18 kya (corresponding to 10 pMC) is realistic and can cover Holocene in earth science research. SCAR provides promising measurements in the range of several to hundreds of pMC, which covers applications such as biogenic-component analysis, dating with the bomb-peak curve, and Suess-effect evaluation. Due to its broad dynamic range, SCAR can measure up to 1000 times above the natural background and therefore is able to quantify the 14C tracers in human plasma, urine, and feces directly without applying the dilution process.
The uncertainty can be reduced as the measurement time increases. From Table 2, one can see that the uncertainties within ±1, ± 0.6, and ±0.4 pMC can be achieved by increasing the measurement time from 30 min, to 1 h and 2.5 hr, respectively. For biogenetic-component determination in samples such as fuel, fabric and plastic, uncertainty of ±1 pMC within 30 min of signal averaging is sufficient. While for dating with the bomb-peak curve, ±0.4 pMC means an uncertainty of ±0.4 year for samples in 1980s. For ancient samples 5 kyr ago, in which 14C radioactivity decayed to half, ±0.4 pMC corresponds to ±62 years in the age determination. The uncertainty achieved in a 2.5-hr measurement guarantees an acceptable precision in the above dating applications. Suess-effect evaluation is probably the most challenge task for current 14C analytic techniques. As shown in Figure 4, the decreases of 14C in plants and ambient air are clearly measured by SCAR. However, a continuous measurement to observe the minor fluctuation of 14C in ambient air has never been realized. The difficulty is the lack of a real-time technique with good enough precision. 0.1 pMC (or even below) is a fair resolution to separate the several-pMC difference between the urban and rural areas. Consequently, the measurement performance of SCAR still needs to be improved.
Finally, in the work for this paper we did not perform δ13C measurements. In applications such as Suess-effect evaluation and dating, fractionation correction is required to achieve a fair accuracy. δ13C values in the paper are obtained in the following approaches: those of the reference materials are from the supplier; those of the ambient air, the plant leaves, the white wine, the white vinegar and the gelatins are empirical data from literatures (Stuiver and Polach Reference Stuiver and Polach1977; Troughton and Card Reference Troughton and Card1975); and that of the sediment is from the AMS on-line measurement. Empirical data of δ13C contain uncertainties and therefore will enlarge the total uncertainties in deducing pMC or F14C. In the bio-fraction analysis and medicine applications, we did not perform fractionation corrections. However, an on-line δ13C determination procedure can be developed along with SCAR measurement in the future.
Acknowledgments
The authors acknowledge Chinese Academy of Geological Sciences for providing sediment samples and thank Profs. Zhongshan Li, Xiaolei Zhao, Shan Jiang, and Ass. Prof. Hui Zhang for constructive discussions.
Funding statement
This work is supported by “Pioneer” and “Leading Goose” R&D Program of Zhejiang Province, China (Grant Nos. 2022C03084).
Competing interests
The authors declare the following potential conflicts of interest: Luca Varricchio and Amelia Detti are employees, and Saverio Bartalini is the founder of the ppqSense S.r.l.


 Open access