


The accurate identification and compositional characterization of clay minerals and associated phases are fundamental to a wide range of basic and applied scientific disciplines, including Earth sciences, soil science, chemistry, environmental studies and materials engineering (Bergaya & Lagaly, Reference Bergaya and Lagaly2013; Biswas et al., Reference Biswas, Grathoff, Naidu and Warr2024). Clay minerals are typically fine-grained and frequently occur as complex intergrowths, posing significant challenges for identification, classification and eventual quantification. Conventional crystallographic and spectroscopic techniques, most notably X-ray diffraction (XRD) and Fourier-transform infrared (FTIR) spectroscopy, remain essential tools in clay mineral studies (Brindley & Brown, Reference Brindley and Brown1984; Moore & Reynolds, Reference Moore and Reynolds1997; Madejová, Reference Madejová2003; Środoń, Reference Środoń, Bergaya, Theng and Lagaly2006). However, these methods can be limited by poor crystallinity, peak overlap and the presence of mixed-layer or amorphous phases. In such cases, micro-scale chemical compositional data provide important complementary information for reliable mineralogical characterization, particularly when diffraction or spectroscopic results are ambiguous or inconclusive.
Quantifying elemental abundances and oxide compositions provides further insight into the crystal-chemical characteristics of clay minerals. These data can be used to derive structural formulas, estimate layer charge and differentiate between dioctahedral and trioctahedral members of principal clay mineral groups, such as kaolinite-serpentine, illite, smectite and chlorite (Brindley & Brown, Reference Brindley and Brown1984; Newman & Brown, Reference Newman, Brown and Newman1987; Brigatti, Reference Brigatti2018; Garcia-Romero et al., Reference Garcia-Romero, Lorenzo, García-Vicente, Morales, García-Rivas and Suárez2021). Compositional data are typically acquired using techniques such as energy-dispersive X-ray spectroscopy (EDX or EDS) combined with scanning or transmission electron microscopy (SEM/TEM), electron probe microanalysis (EPMA) or bulk analytical methods including X-ray fluorescence (XRF) and inductively coupled plasma optical emission spectroscopy (ICP-OES) or inductively coupled plasma mass spectrometry (ICP-MS).
For compositional data to be meaningful in mineral identification, a rigorous and well-controlled analytical methodology is required. This begins with careful sample preparation aimed at isolating pure mineral separates, although complete separation from intergrown or admixed phases is often difficult to achieve. Accurate determinations also require appropriate calibration procedures and the absence of mineral-specific measurement artifacts, such as electron beam damage incurred during microanalysis (Warr et al., Reference Warr, Thombare, Kumar, Peltz and Grathoff2024). EPMA and EDX analyses are best conducted on well-polished, electrically conductive mounts, while ICP and XRF analyses use finely ground powders. As the oxygen concentration is difficult to measure accurately, the elemental data are often normalized to a specific number of oxygens to calculate oxide abundances or cation proportions, which are determined based on known molecular weights and stoichiometries (Droop, Reference Droop1987; Deer et al., Reference Deer, Howie and Zussman1992, Reference Deer, Howie and Zussman2013). For phyllosilicate clay minerals, the cations are then assigned to specific crystallographic sites, such as tetrahedral or octahedral positions, based on established structural criteria (Newman & Brown, Reference Newman, Brown and Newman1987). Additionally, diagnostic elemental ratios, such as Si:Al, Fe:Mg and K:Na, are commonly used to distinguish among mineral groups (Deer et al., Reference Deer, Howie and Zussman1992, Reference Deer, Howie and Zussman2013; Stanley, Reference Stanley2020; Boraiy et al., Reference Boraiy, El-Metwally, Borbon and Chevailler2024). The total octahedral cation occupancy also helps determine whether a clay mineral is dioctahedral or trioctahedral. These compositional markers are particularly useful for identifying solid-solution trends and estimating layer charge in expandable clay minerals such as smectites and vermiculites (Vali et al., Reference Vali, Martin, Amarantidis and Morteani1993; Christidis et al., Reference Christidis, Chryssikos, Derkowski, Dohrmann, Eberl, Joussein and Kaufhold2023).
To support identification, calculated compositions are compared against established mineral standards. This can be achieved by consulting published compositional results or using digital databases and software tools. A search-match program has been proposed for the International Centre for Diffraction Data (ICDD) PDF-4 database, containing over 20,000 compositions (Fawcett et al., Reference Fawcett, Blanton, Kabekkodu and Blanton2018). However, such programs perform poorly for clay minerals with similar chemistry, and selecting an appropriate match can be challenging, because many compounds in the database are rare or not relevant to natural samples. Numerous software programs also exist for identifying minerals based on stoichiometry, although these are often limited either by database size or by specialization in particular mineral groups (Yavuz, Reference Yavuz2003; Yavuz et al., Reference Yavuz, Kumral, Karakaya, Karakaya and Yildirim2015; Siebach et al., Reference Siebach, Moreland, Costin and Jiang2026). Another limitation of this approach is its reliance on assumptions regarding the number of anions or cations in the structure. Additionally, this process can be complicated by the presence of trace elements that are not part of the mineral structure, such as elevated concentrations of iron oxides from nanoparticles (Xia et al., Reference Xia, Liu, Wang, Sun, Zou and Chen2021; Biswas et al., Reference Biswas, Warr and Saha2023; Sudheer Kumar et al., Reference Sudheer Kumar, Warr, Thombare, Manzel and Grathoff2026).
Another established approach for quantifying and mapping the composition of coarse-grained minerals is automated SEM-EDX mineral identification (Gottlieb et al., Reference Gottlieb, Wilkie, Sutherland, Ho-Tun, Suthers and Perera2000; Gu, Reference Gum2003; Fandrich et al., Reference Fandrich, Gu, Burrows and Moeller2007). This method combines backscattered electron images and EDX analyses to match minerals in polished mounts to a reference database and to systematically map their spatial distribution. It has also been applied to sedimentary and clay-bearing materials (Pirrie et al., Reference Pirrie, Rollinson, Power and Webb2013; Han et al., Reference Han, Löhr, Abbott, Baldermann, Farkaš and McMahon2022). However, automated SEM-EDX is primarily effective for larger grains and is generally less suitable for ultra-fine, clay-sized fractions, which are difficult to polish and require targeted manual analysis due to heterogeneous compositions and overlapping grains.
In this paper, a simple, purpose-built MinMatch database for clay minerals and associated phases is presented, based on oxide compositional data. The database currently contains over 500 reference mineral compositions, of which 373 represent well-constrained clay mineral compositions (reported in oxide weight %) from the literature, while the remaining entries correspond to accessory minerals. Many of the compositions were taken from standard reference volumes published by the Mineralogical Society of UK & Ireland, specifically Wilson (Reference Wilson, Deer, Howie and Zussman2013) for clay minerals and Deer et al. (Reference Deer, Howie and Zussman1992, Reference Deer, Howie and Zussman2013; Fleet, Reference Fleet, Deer, Howie and Zussman2003) for the accessory minerals. Additional compositions were selected from peer-reviewed research papers using the following criteria: (1) the analytical data were considered reliable, based on clearly described methods; (2) analyses were conducted on minerals of sufficient purity; and (3) compositional data were reported in oxide form. The program includes a search-and-match algorithm that employs the Pearson correlation coefficient for ranking potential minerals and offers additional statistical and visual means to evaluate compositional similarity. As an illustration of the program’s application, this contribution reports on its testing using the well-characterized 12th Reynolds Cup samples from the 2024 competition, providing an unbiased assessment of its mineral identification capabilities.
Sample preparation and data acquisition
The MinMatch.xls spreadsheet program was used during participation in the Clay Minerals Society’s 12th Reynolds Cup, where both SEM and TEM analyses were conducted in an open-competition setting. These samples were chosen because they provided a comprehensive collection of clay minerals and associated phases, making them ideal for testing the performance of the MinMatch program (Table 1). At that time, the James Hutton Institute in Aberdeen, Scotland (courtesy of S. Hillier), provided three well-characterized reference samples of known mineralogy; however, their contents were not disclosed to participants and were described as follows: (1) RC12-1, a kaolin; (2) RC12-2, a brown bentonite; and (3) RC12-3, an Old Red Sandstone. According to the information provided, the mineral powders were manually hand-ground prior to mixing to ensure homogeneity.
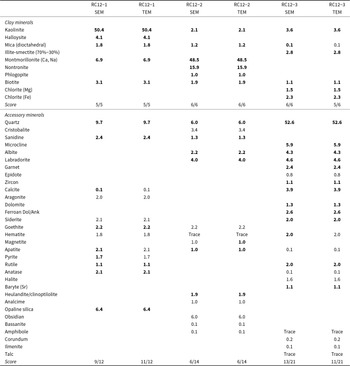
Mineral abundance of the three 12th Reynolds Cup mixtures provided by S. Hillier. Those identified in SEM (>2 µm) and TEM (<2 µm) studies are in bold.

Table 1 Long description
The table reports mineral abundances for three Reynolds Cup mixtures, RC12-1, RC12-2, and RC12-3, with parallel results from SEM and TEM size fractions. Values are listed for clay minerals and accessory minerals, and SEM and TEM entries match for each mineral in each mixture. RC12-1 is clay-dominated, led by kaolinite at 50.4%, with additional montmorillonite at 6.9%, quartz at 9.7%, and opaline silica at 6.4%. RC12-2 shifts strongly to montmorillonite at 48.5% and nontronite at 15.9%, with smaller amounts of quartz and obsidian at 6.0% each and cristobalite at 3.4%. RC12-3 is dominated by quartz at 52.6%, with lower clay contents including kaolinite at 3.6% and illite-smectite at 2.8%, plus notable feldspars such as microcline at 5.9% and plagioclase minerals around 4 to 5%. Carbonates and iron oxides vary by mixture, including calcite at 3.9% and hematite at 2.0% in RC12-3, while RC12-1 includes aragonite at 2.0% and siderite at 2.1%. Score rows indicate how many listed minerals were identified out of the total considered for clays and accessories, so some absences may reflect non-detection rather than true zero.
Ank = ankerite; Dol = dolomite.
A portion (1 g) of each sample was dispersed in 1 L of double-distilled water and subjected to ultrasonic treatment at 50–60 Hz for 15 min. The >2 µm size fraction was then allowed to sediment according to Stokes’ Law, and the <2 µm size fraction remaining in suspension was carefully decanted from the glass beaker and dried in an oven at 60°C to obtain the fine solid fraction. The remaining >2 µm size fraction was subsequently resuspended in 1 L of water, and the procedure was repeated until no significant quantity of the <2 µm size fraction could be separated. Once dried, both the <2 µm and >2 µm size fractions were homogenized manually using an agate mortar and pestle.
A small portion (∼75 mg) of the <2 µm size fractions was added to 10 mL of ethanol in separate glass vials. After dispersion using an ultrasonic bath, a few drops of each suspension were deposited onto a holey carbon film supported on a specimen grid. To evaluate sample purity and dispersion quality, a second set of <1 µm size fractions was prepared by gravity settling.
The specimens were analysed using TEM-EDX following the methods of Warr et al. (Reference Warr, Thombare, Kumar, Peltz and Grathoff2024). Data were acquired from ∼1 µm2 areas in parallel-beam TEM mode, with careful attention given to count times, beam-induced damage and calibration. Totals of 123, 40 and 81 particle analyses were obtained for RC12-1, RC12-2 and RC12-3, respectively. Measurement areas were chosen to target signals from individual minerals; however, due to the frequent occurrence of clay mineral aggregates, it was not always possible to ensure measurement purity, particularly where different clay minerals were stacked or intergrown. Overall, data acquisition required ∼1 full day of TEM time per sample.
A small amount of the >2 µm size fraction was also added to 10 mL of ethanol in a small glass vial. Following mixing and sonication, a few drops of the coarse mineral suspension were pipetted onto a SEM sample stub lined with double-sided conductive carbon tape. The concentration of suspension was adjusted to obtain an even distribution of mineral grains with minimal overlap, while ensuring that each imaged area contained several tens of measurable particles. Prior to field-emission secondary electron imaging, samples were sputter-coated with a thin palladium layer to enhance surface conductivity and to minimize charging. SEM-EDX analyses were performed using a Zeiss Auriga FIB-SEM equipped with an X-MAX 80 mm2 silicon drift detector. The elemental mapping function was applied, followed by analysis of the stored EDX data. In general, the fine-grained particles (<2 µm) were successfully removed during grain-size separation, except in RC12-2, where some fine material remained attached to larger grains.
Based on visual inspection of the secondary electron images and corresponding elemental maps, the EDX data were selectively processed for areas representing individual grains or monominerallic aggregates. Multiple regions were chosen to obtain representative spectra of sufficient intensity while minimizing interference from neighbouring grains. However, in practice, signals from adjacent grains could not always be avoided. Consequently, data collection proceeded in a stepwise manner, allowing unsatisfactory analyses to be promptly excluded from the dataset.
This methodology is described in detail in Podlech et al. (Reference Podlech, Matschiavelli, Peltz, Kluge, Arnold and Cherkouk2021) and is summarized here. EDX mapping and secondary electron images were acquired at 10 kV and at a working distance of <5 mm, typically using magnifications between 448× and 656×. Mappings used a dwell time of 100 µs and total acquisition times of between 60 and 90 min. Data processing was performed using the INCA software (Oxford Instruments), which applied peak and background fittings, pulse pile-up, escape peak and atomic number (Z), absorption (A) and fluorescence (F) corrections. To avoid reliance on oxygen measurements, the results were normalized to 100%, assuming all cations were present as oxides. The presence of other anions was assessed by examining chlorine and sulfur signals. Standardization of the elemental oxide concentrations was verified by measuring ASTIMEX silicate standards of similar oxide concentrations, with measurement accuracies reported by Podlech et al. (Reference Podlech, Matschiavelli, Peltz, Kluge, Arnold and Cherkouk2021). A total of 8 maps and 197 mineral analyses were obtained for RC12-1, 6 maps and 126 analyses were obtained for RC12-2 and 5 maps and 203 analyses were obtained for RC12-3. SEM data acquisition required ∼1–2 days per sample, totalling ∼1 week of beam time.
All of the TEM and SEM compositional analyses obtained in this study are provided as Supplementary Material.
Database and using MinMatch
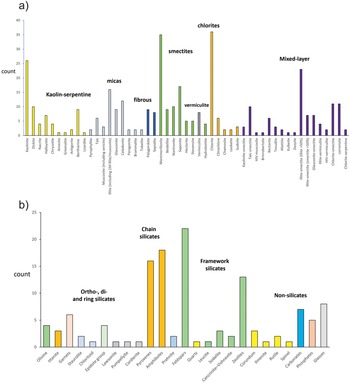
The database currently includes more than 370 clay mineral data files (Fig. 1a). These are grouped into 51 varieties of clay minerals, the most common being chlorite (not differentiated, n = 36), montmorillonite (n = 35), kaolinite (n = 26) and mixed-layered illite-smectite (n = 23). Other minerals represented by multiple compositions (n = 10–20) are dickite, illite, celadonite, nontronite, saponite, talc-smectite, chlorite-smectite and corrensite. All remaining species are represented by between one and nine individual compositions.
Mineral datasets included in the MinMatch program: (a) clay minerals and (b) accessory phases. Count = number of chemical compositions in the database. HIV = hydroxy-interlayered vermiculite.

Figure 1 Long description
The image contains two bar graphs comparing mineral counts. Panel a shows vertical bars grouped by mineral types: Kaolin-serpentine, micas, fibrous, smectites, vermiculite, chlorites and Mixed-layer. The y-axis is labeled count, ranging from 0 to 40. Chlorites have the highest count, reaching approximately 36. Smectites and vermiculite also show high counts, around 30 and 25 respectively. Panel b displays vertical bars grouped by silicate types: Ortho-, di- and ring silicates, Chain silicates, Framework silicates and Non-silicates. The y-axis is labeled count, ranging from 0 to 25. Chain silicates have the highest count, reaching approximately 23. Framework silicates follow with counts around 20. Bars are visually differentiated by color blocks per group. The graphs demonstrate the distribution of mineral compositions across different categories.
In addition to clay mineral species, a range of common accessory phases occurring in the clay-sized fraction of soils, sediments and rocks are included in the database (Fig. 1b). These currently comprise 124 compositions, derived largely from Deer et al. (Reference Deer, Howie and Zussman1992) and associated mineral volumes of the Mineralogical Society of London. This part of the database contains numerous types of framework silicates (feldspars, n = 23; zeolites, n = 13; quartz, n = 1), chain silicates (amphiboles, n = 18; pyroxenes, n = 16) and ortho-, di- and ring silicates (e.g. garnet, n = 6; olivine, n = 4; epidote, n = 4; titanite, n = 3). A range of non-silicate minerals was also added, including oxides (corundum, ilmenite, rutile and spinel), carbonates (calcite, dolomite and siderite) and phosphates (e.g. apatite). Several amorphous glass phases are also included, which were initially absent during the Reynolds Cup testing of the MinMatch program reported in this study. The glasses span felsic (obsidian), intermediate (andesitic) and basic (basaltic) compositions.
MinMatch (available as Supplementary Material) is a Windows OS-based, Excel-based spreadsheet application (version LTSC Standard, Office 2021) with an integrated macro that performs a search-and-match procedure. Operation and database expansion require both macros, and the developer tab must be enabled. This version is incompatible with older Excel releases without modification, and additional adjustments may be necessary for macOS-based systems.
Each data file for a given mineral is organized vertically in separate columns, displaying the major oxide compositions in order of decreasing average abundance, calculated from the mean of all clay minerals in the database. The sequence is as follows:
 \begin{align*} & {\text{Si}}{{\text{O}}_{\text{2}}}{\text{ \gt A}}{{\text{l}}_{\text{2}}}{{\text{O}}_{\text{3}}}{\text{ \gt MgO \gt F}}{{\text{e}}_{\text{2}}}{{\text{O}}_{\text{3}}}{\text{ + FeO \gt }}{{\text{K}}_{\text{2}}}{\text{O \gt CaO \gt N}}{{\text{a}}_{\text{2}}}{\text{O \gt Ti}}{{\text{O}}_{\text{2}}} \\
& {\text{ \gt C}}{{\text{r}}_{\text{2}}}{{\text{O}}_{\text{3}}}{\text{ \gt }}{{\text{P}}_{\text{2}}}{{\text{O}}_{\text{5}}}{\text{ \gt }}{\left( {{\text{N}}{{\text{H}}_{\text{4}}}} \right)_{\text{2}}}{\text{O \gt L}}{{\text{i}}_{\text{2}}}{\text{O \gt NiO \gt MnO \gt SrO \gt }}{{\text{P}}_{\text{2}}}{{\text{O}}_{\text{5}}}{\text{ \gt }}{{\text{V}}_{\text{2}}}{{\text{O}}_{\text{5}}} \\
& {\text{ \gt CoO \gt BaO \gt ZnO}}\end{align*}
\begin{align*} & {\text{Si}}{{\text{O}}_{\text{2}}}{\text{ \gt A}}{{\text{l}}_{\text{2}}}{{\text{O}}_{\text{3}}}{\text{ \gt MgO \gt F}}{{\text{e}}_{\text{2}}}{{\text{O}}_{\text{3}}}{\text{ + FeO \gt }}{{\text{K}}_{\text{2}}}{\text{O \gt CaO \gt N}}{{\text{a}}_{\text{2}}}{\text{O \gt Ti}}{{\text{O}}_{\text{2}}} \\
& {\text{ \gt C}}{{\text{r}}_{\text{2}}}{{\text{O}}_{\text{3}}}{\text{ \gt }}{{\text{P}}_{\text{2}}}{{\text{O}}_{\text{5}}}{\text{ \gt }}{\left( {{\text{N}}{{\text{H}}_{\text{4}}}} \right)_{\text{2}}}{\text{O \gt L}}{{\text{i}}_{\text{2}}}{\text{O \gt NiO \gt MnO \gt SrO \gt }}{{\text{P}}_{\text{2}}}{{\text{O}}_{\text{5}}}{\text{ \gt }}{{\text{V}}_{\text{2}}}{{\text{O}}_{\text{5}}} \\
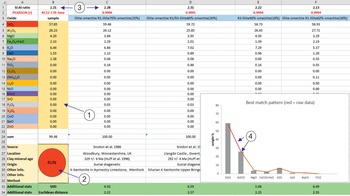
& {\text{ \gt CoO \gt BaO \gt ZnO}}\end{align*}These oxides are listed in this order because they are more likely to produce curves that generally decrease in abundance from left to right (Fig. 2), thereby reducing the occurrence of strongly zigzagging curves that complicate visible pattern matching. If a different ordering is preferred, such as by atomic weight % (wt.%) or by molecular weight % of oxides, the rows in the data files can be easily re-sorted according to user preference. The oxide compositions are normalized to 100 wt.%, and hydrous components (OH– or H2O) are excluded to optimize the matching procedure.
User interface of the MinMatch program and illustration of the matching procedure. To use the program: (1) type in the mineral oxide raw data (normalized to 100%) in the field marked in orange; (2) hit the ‘RUN’ button to identify the best-fitting datasets sorted by Pearson correlation coefficient (r) values (labelled in red); (3) examine the SiO2:Al2O3 ratios, sum of squared differences (SDD) and Euclidean distances as additional statistical criteria and (4) inspect the shapes of the matching graphs to optimize final selections (line graph = raw data, histogram = reference pattern). The example shown corresponds to the illite-smectite of the RC12-3 sample.

Figure 2 Long description
The table contains columns labeled with sample names and oxide compositions, normalized to 100 percent. Rows represent different oxides such as SiO2, Al2O3, Fe2O3 and others. Key values include SiO2 ranging from 56.42 to 57.52 percent across samples. The graph compares raw data (red line) against reference patterns, with axes labeled 'Oxide' and 'wt percent'. The best match pattern is highlighted, showing deviations in specific oxides. The table has approximately 20 rows and multiple columns, illustrating differences in oxide compositions between samples.
In addition to oxide compositions, supplementary metadata are provided, including the literature source (first author and year), mineral location and, where available, geological information such as formation age and genetic origin (e.g. diagenetic, hydrothermal). Further descriptors, including the deposit type and the analytical method used to determine the composition, are also included. New minerals can be easily added to the MinMatch program database by modifying the macro formulas, as described within the program.
To use the MinMatch program, the first step is to input the ‘unknown’ raw oxide data into the appropriate column, marked ‘raw data’ (Fig. 2). The oxide data must have all hydrous components (H2O, OH–) removed and be normalized to 100 wt.% to match the format of the database. These corrections are necessary because the measured hydrous contents of clay minerals are often highly variable depending on drying conditions and analytical variability. Consequently, datasets can only be reliably correlated after this adjustment. Low concentrations of elements (commonly <0.1 wt.%), which may arise from impurities, can remain in the raw data input, as they do not significantly affect the matching results.
Once the data have been entered, the next step is to hit the ‘RUN’ button, which activates a macro that re-sorts the database based on the goodness of fit, as measured by the Pearson correlation coefficient (r). This statistic quantifies the linear relationship between the raw data and reference mineral compositions and is defined as per Equation 1:
 \begin{align}{\textit{r}}\,{\text{ = }}\,{{{\Sigma}}}\left( {\left( {{{\textit{x}}_{\textit{i}}}\, {\text{ - }}\,\overline {\textit{x}} } \right)\left( {{{\textit{y}}_{\textit{i}}}\,{\text{ - }}\,\overline {\textit{y}} } \right)} \right){\text{/}}\,\sqrt[{}]{{\left( {{{{\Sigma}}}{{\left( {{{\textit{x}}_{\textit{i}}}\,{\text{ - }}\,\overline {\textit{x}} } \right)}^{\text{2}}}{{{\Sigma}}}{{\left( {{{\textit{y}}_{\textit{i}}}\,{\text{ - }}\,\overline {\textit{y}} } \right)}^{\text{2}}}} \right)}}\end{align}
where xi and yi are the oxide values of the raw and reference compositions, respectively, and x̄ and ȳ are their respective mean values. A value of r = +1.0 indicates a perfect positive correlation, r = –1.0 indicates a perfect negative correlation and r = 0 signifies the absence of any linear correlation.
In addition to the Pearson correlation coefficient (r), MinMatch also calculates the sum of the least squared differences (SDD) and the Euclidean distance. These parameters provide additional measures based on absolute compositional similarity. However, in practice, the Pearson correlation coefficient is considered sufficient for ranking the best matches, as it effectively captures both the linearity and the relative ratios of the oxide compositions.
As part of the optimization steps in the matching process, the SiO2:Al2O3 ratio can be considered along with an examination of the raw curves and the reference data to facilitate visual comparison (Fig. 2). The best-fit dataset can then be selected based on a combined assessment of the Pearson correlation coefficient, SDD, Euclidean distance, SiO2:Al2O3 ratio and the graphical information. In general, the closer the mineral match to multiple reference files of the same mineral types (e.g. illite-smectites), the more reliable the result. Such results can be easily copied into additional worksheets and arranged accordingly prior to any subsequent analyses.
Results
Based on the EDX compositional analyses, the clay minerals and other phyllosilicates within the sample mixtures were reliably identified without the need for XRD or other analytical methods (Table 1). In contrast, only ∼60% of the accessory minerals were recognized using the same approach. A summary of these results is presented in the following subsections.
Composition analyses of clay minerals and other phyllosilicates
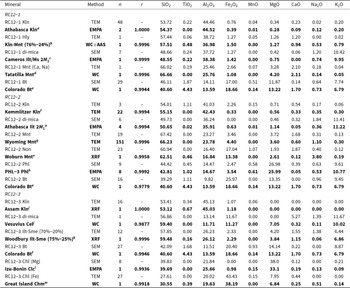
Due to the fine-grained nature of the clay minerals in the three samples, the TEM-EDX analyses of the <1 µm and <2 µm size fractions were preferred for compositional characterization, with the exception of some of the larger mica minerals, such as dioctahedral illite/muscovite, biotite and phlogopite, which were more accurately quantified using SEM-EDX (Table 2). In all three mixtures, the <1 µm size fractions generally contained a higher proportion of smectites and illite-smectites compared to the <2 µm size fractions, which were often more enriched in kaolinite and had a greater proportion of accessory minerals (e.g. quartz, iron oxides/oxyhydroxides and micas). Table 2 provides examples of how MinMatch can be used to characterize minerals in the test samples, and it illustrates how this information can be applied to optimize mineral recognition, with the support of the detailed EDX analyses provided as Supplementary Material. The best reference compositions fell within a Pearson correlation coefficient range of 0.9779–1.0000, and, based on repeat EDX analyses of the same mineral compositions, differences exceeding ±0.0002 were considered to be significant.
Best-selected clay mineral compositions determined by SEM-EDX or TEM-EDX and their corresponding best match (bold) from the MinMatch database. All oxide compositions were normalized to 100% ± 0.5% to ensure internal consistency among datasets.

Table 2 Long description
The table lists oxide weight percent compositions for clay minerals identified in three RC12 samples, alongside the closest matching reference compositions from a mineral database. Each RC12 mineral entry includes the analytical method, number of analyses, and a similarity value when a database match is provided. Kaolinite in RC12-1, RC12-2, and RC12-3 is silica and alumina rich, around the mid 50s for silica and low 40s to mid 40s for alumina, and aligns very closely with the paired kaolinite references. Halloysite appears only in RC12-1 and shows higher silica and lower alumina than the RC12-1 kaolinite, with small but noticeable iron, magnesium, and calcium. Montmorillonite in RC12-1 and RC12-2 has the highest silica values in the table, in the mid to high 60s, with alumina in the low to mid 20s and modest magnesium and calcium, and it closely matches the listed montmorillonite references. The di-mica entries for RC12-1 and RC12-2 have moderate silica and alumina but elevated potassium, around ten to eleven, consistent with illite or muscovite type references. Biotite entries show lower silica than the clays but much higher iron and magnesium, and the RC12-2 biotite is especially iron rich compared with the other biotites. Chlorite in RC12-3 splits into a magnesium-rich type with very high magnesium and low iron, and an iron-rich type with very high iron and much lower magnesium, each paired with a corresponding chlorite reference. Values are normalized to a consistent total, and differences can reflect both real mineral chemistry and method or sample heterogeneity, especially where the number of analyses is small.
References: aZhang et al. (Reference Zhang, Wasyluik and Pan2001), bShimoda (Reference Shimoda1978), cBarrenechea et al. (Reference Barrenechea, Rodas, Frey, Alonso-Azcárate and Mas2000), dRoss & Hendriks (Reference Ross and Hendricks1945), eLarsen et al. (Reference Larsen, Irving, Gonyer and Larsen1937), fSchwerdtner et al. (Reference Schwerdtner, Anger and Störr2007), gWarr et al. (Reference Warr, Thombare, Kumar, Peltz and Grathoff2024), hHillier et al. (Reference Hillier, Marwa and Rice2013; analysis included 0.55 wt.% P2O5), iSaikia et al. (Reference Saikia, Bharali, Sengupta, Bordoloi, Goswamee, Saikia and Borthakur2003), jHendrick & Ross (Reference Hendrick and Ross1941), kŚrodoń et al. (Reference Środoń, Morgan and Eslinger1986), lAlt et al. (Reference Alt, Teagle, Brewer, Shanks and Halliday1998), mBattey (Reference Battey1956).
AAS = atomic absorption spectroscopy; WC = wet chemistry.
International Mineralogical Association (IMA)-approved mineral symbols and mixed-layer abbreviations (Warr, Reference Warr2020, Reference Warr2021): Bt = biotite; Cel = celadonite; Chl = chlorite; Chm = chamosite; Clc = clinochlore; Hly = halloysite; Ilt = illite; Kln = kaolinite; Mnt = montmorillonite; Ms = muscovite; Phl = phlogopite; Sme = smectite.
RC12-1
Thin, hexagonal-shaped crystals indicative of kaolinite were abundant in this sample, along with occasional halloysite nanotubes (Fig. 3). The kaolinite produced characteristic EDX compositions, composed largely of SiO2 and Al2O3, whereas the halloysite nanotubes were more difficult to analyse and exhibited slightly lower SiO2 and Al2O3 contents, along with elevated concentrations of Fe2O3, MgO and CaO. The best MinMatch fit for these analyses was a mixed-layered kaolinite-montmorillonite (76%-24%), which probably reflects contamination from surrounding smectite minerals concentrated in the fine-grain-size fractions.
TEM images of <2 µm-sized minerals: (a,b) RC12-1, (c,d) RC12-2 and (e,f) RC12-3. Ant = anatase; Chm = chamosite; Fe-Sme = Fe-smectite; Gth = goethite; Hem = hematite; Hly = halloysite; Ilt-Sme = illite-smectite; Kln = kaolinite; Mnt = montmorillonite (International Mineralogical Association (IMA) symbols from Warr, Reference Warr2020, Reference Warr2021).

Figure 3 Long description
The image A showing a grayscale micrograph with a scale bar labeled 100 nanometers at the lower left. Text labels read a), Am, Ply, Kln and Opl. Several thin, overlapping, angular sheet-like areas occupy the center and right. Multiple dark, irregular clusters are present, including one dense dark rounded area near the center-left. The image B showing a grayscale micrograph with a scale bar labeled 100 nanometers at the lower left. Text labels read b) and Mnt. A large, rounded, darker region occupies most of the center. A curved dark boundary line runs near the lower edge. The image C showing a grayscale micrograph with a scale bar labeled 100 nanometers at the lower left. Text labels read c), Mnt and Gth. Overlapping sheet-like regions extend diagonally. A prominent elongated dark feature lies near the upper center. The image D showing a grayscale micrograph with a scale bar labeled 100 nanometers at the lower left. Text labels read d) and Fe-Sme. A broad, relatively uniform gray area fills most of the frame with faint tonal variations. A darker curved edge is present near the top. The image E showing a grayscale micrograph with a scale bar labeled 100 nanometers at the lower left. Text labels read e), Hem and Chm. A dark, dense mass sits at the left side, with additional dark patches near the bottom. A lighter, thin sheet-like region occupies the right side. The image F showing a grayscale micrograph with a scale bar labeled 100 nanometers at the lower left. Text labels read f) and Ilt-Sme. Multiple overlapping, angular sheet-like regions fill the frame, with mottled gray textures and several darker linear edges.
In addition to the kaolinite-group minerals, smaller quantities of a smectite were detected in the clay-sized fraction with a composition similar to that of the Tatatilla montmorillonite, which contains interlayered Ca and Na (Ross & Hendriks, Reference Ross and Hendricks1945). An estimated average structural formula, based on a dioctahedral structure, for these compositional analyses is:
 \begin{align*}\bigl( {{\text{S}}{{\text{i}}_{{\text{3}}{\text{.88}}}}{\text{A}}{{\text{l}}_{{\text{0}}{\text{.12}}}}} \bigr)\bigl( {{\text{A}}{{\text{l}}_{{\text{1}}{\text{.64}}}}{\text{F}}{{\text{e}}_{{\text{0}}{\text{.12}}}}{\text{M}}{{\text{g}}_{{\text{0}}{\text{.24}}}}} \bigr)\bigl( {{\text{C}}{{\text{a}}_{{\text{0}}{\text{.13}}}}{\text{M}}{{\text{g}}_{{\text{0}}{\text{.04}}}}{\text{N}}{{\text{a}}_{{\text{0}}{\text{.02}}}}} \bigr){{\text{O}}_{{\text{10}}}}\bigl( {{\text{O}}{{\text{H}}_{\text{2}}}} \bigr)\end{align*}
with a total layer charge of –0.36 (tetrahedral charge –0.12, octahedral charge –0.24) per O10(OH2) and dominated by Ca and Mg interlayered cations.
Other phyllosilicates detected in this mixture included a dioctahedral mica and biotite. SEM-EDX analyses (Table 2) indicate that their compositions are comparable to an illite/muscovite 2M 1 from the Cameros Basin (Barrenechea et al., Reference Barrenechea, Rodas, Frey, Alonso-Azcárate and Mas2000) and a biotite from the San Juan volcanic field of Colorado (Larsen et al., Reference Larsen, Irving, Gonyer and Larsen1937). Although the determination of the biotite composition is relatively old, it remains widely accepted and has been retained in standard reference textbooks for over 50 years (Deer et al., Reference Deer, Howie and Zussman1992; Fleet, Reference Fleet, Deer, Howie and Zussman2003). More recent biotite compositional datasets have not yet been incorporated into the MinMatch program.
RC12-2
The most abundant clay mineral present in the fine-grained fractions of the RC12-2 mixture was smectite, which occurred in two distinct compositions: (1) a Ca-montmorillonite and (2) an Fe-rich smectite. Based on TEM-EDX analyses (n = 19), the structural formula of the Ca-montmorillonite can be expressed as:
 \begin{align*}\bigl( {{\text{S}}{{\text{i}}_{{\text{3}}{\text{.95}}}}{\text{A}}{{\text{l}}_{{\text{0}}{\text{.05}}}}} \bigr) & \bigl( {{\text{A}}{{\text{l}}_{{\text{1}}{\text{.56}}}}{\text{F}}{{\text{e}}_{{\text{0}}{\text{.15}}}}{\text{M}}{{\text{g}}_{{\text{0}}{\text{.29}}}}} \bigr)
\bigl({{\text{C}}{{\text{a}}_{{\text{0}}{\text{.11}}}}{\text{M}{\text{g}_{{\text{0}}{\text{.04}}}}}{\text{N}}{{\text{a}}_{{\text{0}}{\text{.04}}}}{{\text{K}}_{{\text{0}}{\text{.01}}}}} \bigr){{\text{O}}_{{\text{10}}}}\bigl( {{\text{O}}{{\text{H}}_{\text{2}}}} \bigr)\end{align*}
\begin{align*}\bigl( {{\text{S}}{{\text{i}}_{{\text{3}}{\text{.95}}}}{\text{A}}{{\text{l}}_{{\text{0}}{\text{.05}}}}} \bigr) & \bigl( {{\text{A}}{{\text{l}}_{{\text{1}}{\text{.56}}}}{\text{F}}{{\text{e}}_{{\text{0}}{\text{.15}}}}{\text{M}}{{\text{g}}_{{\text{0}}{\text{.29}}}}} \bigr)
\bigl({{\text{C}}{{\text{a}}_{{\text{0}}{\text{.11}}}}{\text{M}{\text{g}_{{\text{0}}{\text{.04}}}}}{\text{N}}{{\text{a}}_{{\text{0}}{\text{.04}}}}{{\text{K}}_{{\text{0}}{\text{.01}}}}} \bigr){{\text{O}}_{{\text{10}}}}\bigl( {{\text{O}}{{\text{H}}_{\text{2}}}} \bigr)\end{align*}with a total layer charge of –0.34 (tetrahedral charge –0.05, octahedral charge –0.29) per O10(OH2) and dominated by Ca, Mg and Na interlayered cations.
This dioctahedral structure is comparable to the montmorillonite in RC12-1, and its low layer charge closely matches that of the Wyoming montmorillonite from Upton Cross (Warr et al., Reference Warr, Thombare, Kumar, Peltz and Grathoff2024), although the interlayer sites are enriched in Ca relative to Na.
The TEM-EDX analyses (n = 23) of the Fe-smectite contained an average of 17.04 wt.% Fe2O3 and is listed in the Reynolds Cup mixture as a nontronite (Table 2). However, this measured composition did not closely match the nontronites in the MinMatch database. The best match (r = 0.9901) ranked only 11th and exhibited a significantly lower SiO2:Al2O3 ratio of 2.72 compared to the >4.3 ratios of the 10 nontronites in the database. The best overall fit (r = 0.9958) with a similar SiO2:Al2O3 ratio of 3.71 was that of an Fe-rich montmorillonite from Woburn, UK, with the following dioctahedral structural formula:
 \begin{align*}\bigl( {{\text{S}}{{\text{i}}_{{\text{3}}{\text{.82}}}}{\text{A}}{{\text{l}}_{{\text{0}}{\text{.18}}}}} \bigr) & \bigl( {{\text{A}}{{\text{l}}_{{\text{1}}{\text{.03}}}}{\text{F}}{{\text{e}}_{{\text{0}}{\text{.80}}}}{\text{M}}{{\text{g}}_{{\text{0}}{\text{.16}}}}} \bigr)
\bigl({{\text{C}}{{\text{a}}_{{\text{0}}{\text{.13}}}}{\text{M}}{{\text{g}}_{{\text{0}}{\text{.02}}}}{\text{N}}{{\text{a}}_{{\text{0}}{\text{.04}}}}{{\text{K}}_{{\text{0}}{\text{.01}}}}} \bigr){{\text{O}}_{{\text{10}}}}\bigl( {{\text{O}}{{\text{H}}_{\text{2}}}} \bigr)\end{align*}
\begin{align*}\bigl( {{\text{S}}{{\text{i}}_{{\text{3}}{\text{.82}}}}{\text{A}}{{\text{l}}_{{\text{0}}{\text{.18}}}}} \bigr) & \bigl( {{\text{A}}{{\text{l}}_{{\text{1}}{\text{.03}}}}{\text{F}}{{\text{e}}_{{\text{0}}{\text{.80}}}}{\text{M}}{{\text{g}}_{{\text{0}}{\text{.16}}}}} \bigr)
\bigl({{\text{C}}{{\text{a}}_{{\text{0}}{\text{.13}}}}{\text{M}}{{\text{g}}_{{\text{0}}{\text{.02}}}}{\text{N}}{{\text{a}}_{{\text{0}}{\text{.04}}}}{{\text{K}}_{{\text{0}}{\text{.01}}}}} \bigr){{\text{O}}_{{\text{10}}}}\bigl( {{\text{O}}{{\text{H}}_{\text{2}}}} \bigr)\end{align*}This structure has a total layer charge of –0.37 (tetrahedral charge –0.18, octahedral charge –0.19) and is dominated by Ca- and Na-interlayer cations. As the Fe2+/Fe3+ was not determined for this Fe-smectite, the structural formula should be considered an approximation, as it assumes that all Fe is Fe3+ and that there is no Fe substituting Si in the tetrahedral sites.
In addition to the two smectite minerals, the lower concentrations of kaolinite, di-mica, phlogopite and biotite were successfully identified in this mixture using both SEM and TEM. The di-mica (SEM-EDX, n = 6) corresponded closely with an illite 2M 1 pattern from Athabasca (Zhang et al., Reference Zhang, Wasyluik and Pan2001), the phlogopite (SEM-EDX, n = 9) matched the PHL-3 composition of Hillier et al. (Reference Hillier, Marwa and Rice2013) and the biotite aligned with a sample composition reported by Larsen et al. (Reference Larsen, Irving, Gonyer and Larsen1937), despite the significantly greater Fe2O3 content of the EDX analyses. Although the biotite reference composition was derived using wet chemical methods rather than modern microprobe analyses, this exceptionally pure iron-rich biotite has provided a reliable benchmark for constraining the annite-phlogopite series (Rieder et al., Reference Rieder, Cavazzini, D’yakonov, Frank-Kamenetskii, Gottardi and Guggenheim1998). This slightly lower match (r = 0.9779) probably reflects the limited number of biotite compositions currently included in the database (n = 5), which reduces the ability to fully capture the compositional diversity of this mineral.
RC12-3
MinMatch analysis of RC12-3 clay mineral compositions confirmed the presence of a mixture of kaolinite, mica, illite-smectite, biotite and two types of chlorites: clinochlore and chamosite (Tables 1 & 2). The kaolinite composition closely matched that of Assam, India (Saikia et al., Reference Saikia, Bharali, Sengupta, Bordoloi, Goswamee, Saikia and Borthakur2003), although it exhibited slight differences from RC12-1 and RC12-2, particularly in the trace concentrations of Ti, Fe, Mn, Mg, Ca and Na. These minor variations are probably due to the presence of very fine accessory minerals rather than reflecting true compositional differences in the kaolinite itself.
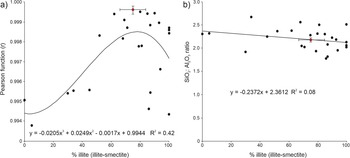
The di-mica component was best matched to a celadonite composition from Vesuvius; however, this identification was based on a single TEM-EDX analysis and should therefore be considered tentative. By contrast, the illite-smectite component produced a more robust result. Twelve particle analyses indicated that an illite-smectite structure (75%-25%) from Woodbury, UK (Środoń et al., Reference Środoń, Morgan and Eslinger1986), most closely matched the illite-smectite composition (70%-30%) determined by XRD (value provided by S. Hillier). The procedure used to establish this match is illustrated in Fig. 4, which presents both the Pearson correlation coefficient (r) and the SiO2:Al2O3 ratios for the top 25 candidate illite-smectite structures, including the end-members illite and smectite. The trend in the dataset was approximated by fitting a third-order polynomial curve (R 2 = 0.42), reflecting a moderate correlation between r and the illite content (%) in illite-smectite minerals (Fig. 4a). The highest r value of 0.9996 corresponds closely to the main peak, reflecting a high illite content in the illite-smectite mineral. Considering the standard deviation (±1σ of 0.0002, n = 12), all matched samples within the range 0.9994–0.9998 are regarded as statistically indistinguishable and thus represent plausible solutions. These correspond to illite-smectite compositions with ∼60–80% illite-layer abundance.
(a) Top 25 Pearson function mineral fits (r) to the mixed-layered illite-smectite mineral in the RC12-3 sample. The observed data are approximated using a third-order polynomial curve. The best-fit (highest r) value of 0.9997 reflects an Reichweite 1 (R1; short-range ordering) illite-smectite (75%-25%) composition from the database. (b) The SiO2:Al2O3 ratios for the top 25 matches obtained for the same dataset as (a). The raw data have a SiO2:Al2O3 ratio of 2.21, marked on the graph as a red data point. Error bars represent the calculated standard deviation (±1σ, n = 12).

Figure 4 Long description
The image A showing a scatter plot labeled a). The vertical axis label is Pearson function (r). The vertical axis range is 0.994 to 1.000. The horizontal axis label is percent illite (illite-smectite). The horizontal axis range is 0 to 100. A smooth curve is drawn across the plot. An equation is printed: y equals negative 0.0205x superscript 3 plus 0.0249x superscript 2 minus 0.0017x plus 0.9944. R superscript 2 equals 0.42. Multiple circular data markers are plotted across the range, including a cluster between about 60 and 90 on the horizontal axis and between about 0.997 and 1.000 on the vertical axis. One marker near the top has a vertical error bar. The image B showing a scatter plot labeled b). The vertical axis label is silicon dioxide colon aluminum oxide ratio. The vertical axis range is 0 to 3.0. The horizontal axis label is percent illite (illite-smectite). The horizontal axis range is 0 to 100. A straight line is drawn with a slight downward slope. An equation is printed: y equals negative 0.2372x plus 2.3612. R superscript 2 equals 0.08. Multiple circular data markers are plotted, with many markers between about 60 and 100 on the horizontal axis and between about 2.0 and 2.7 on the vertical axis. One marker near the right side has a vertical error bar.
As a secondary criterion, the measured SiO2:Al2O3 ratios of the top 25 matches (ranked by r) were examined (Fig. 4b). Although no significant correlation is observed between the SiO2:Al2O3 ratio and illite content (R 2 = 0.08), the measured value of 2.21 compares reasonably well with the 2.28 ratio of the Woodbury illite-smectite composition (Środoń et al., Reference Środoń, Morgan and Eslinger1986), consistent with the general pattern observed for all oxide concentrations (Fig. 2). Considering analytical uncertainty (±1σ of 0.06, n = 12), the more reliable SiO2:Al2O3 ratios are estimated to lie within the range 2.15–2.27.
Based on the average TEM-EDX analyses of the illite-smectite of the RC12-3 sample, structural formulas for this mineral and for the Woodbury illite-smectite can be written as follows:
 \begin{align*}{\text{illite-smectite = }} & \bigl( {{\text{S}}{{\text{i}}_{{\text{3}}{\text{.57}}}}{\text{A}}{{\text{l}}_{{\text{0}}{\text{.43}}}}} \bigr)\bigl( {{\text{A}}{{\text{l}}_{{\text{1}}{\text{.48}}}}{\text{F}}{{\text{e}}_{{\text{0}}{\text{.11}}}}{\text{M}}{{\text{g}}_{{\text{0}}{\text{.43}}}}} \bigr)\\ &
\bigl({{\text{C}}{{\text{a}}_{{\text{0}}{\text{.10}}}}{\text{N}}{{\text{a}}_{{\text{0}}{\text{.17}}}}{{\text{K}}_{{\text{0}}{\text{.51}}}}} \bigr){{\text{O}}_{{\text{10}}}}\bigl( {{\text{O}}{{\text{H}}_{\text{2}}}} \bigr)\end{align*}
\begin{align*}{\text{illite-smectite = }} & \bigl( {{\text{S}}{{\text{i}}_{{\text{3}}{\text{.57}}}}{\text{A}}{{\text{l}}_{{\text{0}}{\text{.43}}}}} \bigr)\bigl( {{\text{A}}{{\text{l}}_{{\text{1}}{\text{.48}}}}{\text{F}}{{\text{e}}_{{\text{0}}{\text{.11}}}}{\text{M}}{{\text{g}}_{{\text{0}}{\text{.43}}}}} \bigr)\\ &
\bigl({{\text{C}}{{\text{a}}_{{\text{0}}{\text{.10}}}}{\text{N}}{{\text{a}}_{{\text{0}}{\text{.17}}}}{{\text{K}}_{{\text{0}}{\text{.51}}}}} \bigr){{\text{O}}_{{\text{10}}}}\bigl( {{\text{O}}{{\text{H}}_{\text{2}}}} \bigr)\end{align*} \begin{align*}{\text{Woodbury illite-smectite = }} & \bigl( {{\text{S}}{{\text{i}}_{{\text{3}}{\text{.65}}}}{\text{A}}{{\text{l}}_{{\text{0}}{\text{.35}}}}} \bigr)\bigl( {{\text{A}}{{\text{l}}_{{\text{1}}{\text{.54}}}}{\text{F}}{{\text{e}}_{{\text{0}}{\text{.11}}}}{\text{M}}{{\text{g}}_{{\text{0}}{\text{.35}}}}} \bigr)\\ &
\bigl({{\text{C}}{{\text{a}}_{{\text{0}}{\text{.08}}}}{\text{N}}{{\text{a}}_{{\text{0}}{\text{.01}}}}{{\text{K}}_{{\text{0}}{\text{.54}}}}} \bigr){{\text{O}}_{{\text{10}}}}\bigl( {{\text{O}}{{\text{H}}_{\text{2}}}} \bigr)\end{align*}
\begin{align*}{\text{Woodbury illite-smectite = }} & \bigl( {{\text{S}}{{\text{i}}_{{\text{3}}{\text{.65}}}}{\text{A}}{{\text{l}}_{{\text{0}}{\text{.35}}}}} \bigr)\bigl( {{\text{A}}{{\text{l}}_{{\text{1}}{\text{.54}}}}{\text{F}}{{\text{e}}_{{\text{0}}{\text{.11}}}}{\text{M}}{{\text{g}}_{{\text{0}}{\text{.35}}}}} \bigr)\\ &
\bigl({{\text{C}}{{\text{a}}_{{\text{0}}{\text{.08}}}}{\text{N}}{{\text{a}}_{{\text{0}}{\text{.01}}}}{{\text{K}}_{{\text{0}}{\text{.54}}}}} \bigr){{\text{O}}_{{\text{10}}}}\bigl( {{\text{O}}{{\text{H}}_{\text{2}}}} \bigr)\end{align*}with calculated total layer charges of –0.80 and –0.70 per O₁₀(OH)₂, respectively.
Similarly, the TEM and SEM-EDX compositions of the biotite (n = 27), clinochlore (n = 8) and chamosite (n = 27) particles could be successfully matched to reference compositions in the database. Although the biotite composition did not allow for a reliable structural formula, the two chlorite compositions yielded approximate stoichiometric formulas as follows:
 \begin{align*}{\text{clinochlore = }}{\bigl( {{\text{M}}{{\text{g}}_{{\text{4}}{\text{.53}}}}{\text{A}}{{\text{l}}_{{\text{1}}{\text{.25}}}}} \bigr)_{{\text{5}}{\text{.87}}}}{\bigl( {{\text{S}}{{\text{i}}_{{\text{3}}{\text{.19}}}}{\text{A}}{{\text{l}}_{{\text{0}}{\text{.81}}}}} \bigr)_{{\text{4}}{\text{.00}}}}{{\text{O}}_{{\text{10}}}}{\bigl( {{\text{OH}}} \bigr)_{\text{8}}}\end{align*}
 \begin{align*}{\text{chamosite = }}& {\bigl( {{\text{F}}{{\text{e}}^{{\text{2 + }}}}_{{\text{3}}{\text{.38}}}{\text{M}}{{\text{g}}_{{\text{1}}{\text{.23}}}}{\text{A}}{{\text{l}}_{{\text{1}}{\text{.30}}}}{\text{M}}{{\text{n}}_{{\text{0}}{\text{.01}}}}} \bigr)_{{\text{5}}{\text{.92}}}} {\bigl( {{\text{S}}{{\text{i}}_{{\text{2}}{\text{.86}}}}{\text{A}}{{\text{l}}_{{\text{1}}{\text{.14}}}}} \bigr)_{{\text{{4}}}{\text{.00}}}}{{\text{O}}_{{\text{10}}}}{\bigl( {{\text{OH}}} \bigr)_{\text{8}}}\end{align*}
The clinochlore composition with the highest correlation (r = 0.99) corresponded to a forearc Izu–Bonin sample from Ocean Drilling Program (ODP) Hole 786B (Alt et al., Reference Alt, Teagle, Brewer, Shanks and Halliday1998), whereas the best-fitting chamosite (also r = 0.99) matched a specimen from the Great Island spilite, New Zealand (Table 2; Battey, Reference Battey1956).
Composition analyses of accessory phases
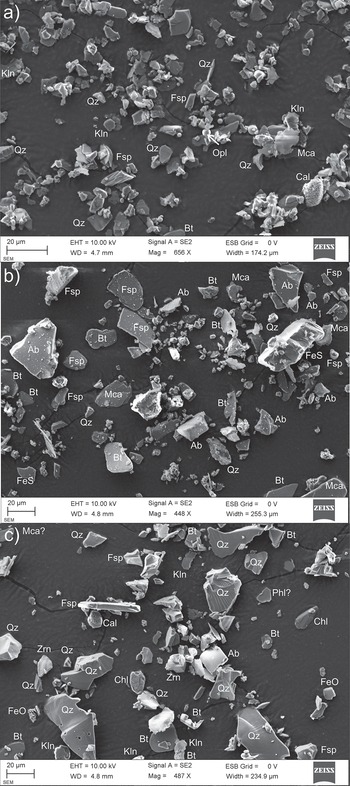
Secondary electron imaging of multiple regions within the >2 µm size fractions revealed well-isolated grains suitable for high-quality EDX mapping (Figs 5 & S1). These regions were selected based on their relatively uniform mineral distribution and minimal particle aggregation. Mineral identification was performed using the MinMatch program, utilizing multiple-area EDX analyses of individual grains, and the results are summarized on the corresponding SEM images (Fig. 5).
SEM secondary electron images of the coarse fractions (>2 µm): (a) RC12-1, (b) RC12-2 and (c) RC12-3. International Mineralogical Association (IMA)-approved mineral symbols after Warr (Reference Warr2021): Ab = albite; Bt = biotite; Cal = calcite; Fsp = feldspar; Kln = kaolinite; Mca = mica; Opl = opal; Qz = quartz.

Figure 5 Long description
The image A showing a grayscale scanning electron micrograph labeled “a)” with many angular and irregular particles scattered across a dark background. Multiple particles are annotated with short labels including “Qz”, “Fsp”, “Kin”, “Cal”, “Mca”, “Bt” and “Opl”. A scale bar at the lower left reads “20 µm”. A metadata strip along the bottom includes “EHT = 10.00 kV”, “Signal A = SE2”, “Mag = 65 K X”, “WD = 4.7 mm”, “ESD = 0 V” and “Zeiss”. The image B showing a grayscale scanning electron micrograph labeled “b)” with scattered angular grains and several larger fragments among smaller debris. Many grains are annotated with short labels including “Ab”, “Bt”, “Qz”, “Fsp”, “Mca” and “FeS”. A scale bar at the lower left reads “20 µm”. A metadata strip along the bottom includes “EHT = 10.00 kV”, “Signal A = SE2”, “Mag = 65 K X”, “WD = 4.7 mm”, “ESD = 0 V” and “Zeiss”. The image C showing a grayscale scanning electron micrograph labeled “c)” with numerous angular particles distributed across a dark background, including several larger blocky grains and smaller fragments between them. Many grains are annotated with short labels including “Qz”, “Fsp”, “Kin”, “Cal”, “Bt”, “Ab”, “Chl”, “Phl?”, “FeO” and “Zn”. A scale bar at the lower left reads “20 µm”. A metadata strip along the bottom includes “EHT = 10.00 kV”, “Signal A = SE2”, “Mag = 65 K X”, “WD = 4.8 mm”, “ESD = 0 V” and “Zeiss”.
Several limitations inherent to EDX analyses affected the performance of MinMatch in identifying accessory mineral phases. The inability to detect hydrogen prevented differentiation between oxides and hydroxides, and the presence of the substrate film hindered reliable quantification of carbon. Additionally, the Fe2+/Fe3+ ratio could not be determined, which restricted the interpretation of iron-bearing minerals. The mineral database is primarily optimized for aluminosilicate minerals, which reduces its effectiveness for other mineral groups such as phosphates, sulfates, sulfides and carbonates. Despite these limitations, reliable element maps could be routinely obtained for Si, Ti, Al, Fe, Mg. Ca, Na, K, P, Ba and S (Fig. S1). The distribution of Zr-Kα (2.04 keV) could also be mapped; however, this peak overlaps with P-Kα (2.01 keV), introducing uncertainty when trying to distinguish between these two elements using EDX.
MinMatch also failed to identify a number of minerals present at very low or trace concentrations (<0.2 wt.%), such as amphibole, corundum, ilmenite and talc, which occurred in the RC12-2 and RC12-3 mixtures.
Feldspar compositions
One group of minerals for which MinMatch performed particularly well was the feldspars, whose precise identification and quantification using XRD remain challenging. For example, RC12-3 contained three feldspar species – microcline, albite and a plagioclase (labradorite) – all of which were successfully identified using MinMatch (Fig. 6). The microcline was best matched with a composition from Nora Kärr, Sweden (MacKenzie, Reference MacKenzie1954), yielding r = 0.9997, and its SiO2:Al2O3 ratio of 3.47 compared reasonably well with the measured value of 3.74. The best-fitting albite was that reported by Kracek & Neuvonen (Reference Kracek and Neuvonen1952) from Virginia, USA, with r = 0.9998 and a closely matching SiO2:Al2O3 ratio (3.45 compared with the measured value of 3.53). A second albite match from Val Devero, Italy (Azzini, Reference Azzini1933), also yielded r = 0.9996, with a slightly lower SiO2:Al2O3 ratio of 3.29. For the plagioclase (labradorite), the best fit was an andesine feldspar from Madras, India (Howie, Reference Howie1955), with r = 0.9995, which most accurately reproduced the average Ca and Na contents measured by SEM-EDX (n = 8). Its SiO2:Al2O3 ratio of 2.20 matched well with the measured ratio of 2.13. The second-best fit was a labradorite feldspar from Utah, USA (Meen, Reference Meen1933), with r = 0.9946; however, this composition exhibited a significantly lower SiO2:Al2O3 ratio (1.78) than the measured ratio.
MinMatch’s best-fit composition for the three felspars present in RC12-3. (a) Microcline fit to the SEM-EDX data from Nora Kärr, Sweden (MacKenzie, Reference MacKenzie1954). (b) Albite fit to the SEM-EDX data from Virginia, USA (Kracek & Neuvonen, Reference Kracek and Neuvonen1952). (c) Andesine fit to the plagioclase (described as labradorite) to the SEM-EDX data from Madras, India (Meen, Reference Meen1933).

Figure 6 Long description
The image A showing a bar and line graph. Text: “a)”. Text: “Nora Kärr microcline”. Text: “EDX data, n = 7”. Text: “Best fit microcline Nora Kärr, Sweden r = 0.9997 SiO2: Al2O3 = 3.47 EDX SiO2: Al2O3 = 3.74”. The horizontal axis label: “Elemental oxide”. The vertical axis label: “Weight %”. The vertical axis range shows 0 to 80. The horizontal axis categories: “SiO2”, “Al2O3”, “MgO”, “Fe2O3”, “K2O”, “CaO”, “Na2O”, “TiO2”. Bar heights: SiO2 about 65; Al2O3 about 20; K2O about 15; Na2O about 1; MgO 0; Fe2O3 0; CaO 0; TiO2 0. A line connects points at the same categories with approximate values: SiO2 about 65; Al2O3 about 20; MgO 0; Fe2O3 0; K2O about 15; CaO 0; Na2O about 1; TiO2 0. The image B showing a bar and line graph. Text: “b)”. Text: “Virginia albite”. Text: “EDX data, n = 9”. Text: “Best fit albite Virginia, USA r = 0.9998 SiO2: Al2O3 = 3.45 EDX SiO2: Al2O3 = 3.53”. The horizontal axis label: “Elemental oxide”. The vertical axis label: “Weight %”. The vertical axis range shows 0 to 80. The horizontal axis categories: “SiO2”, “Al2O3”, “MgO”, “Fe2O3”, “K2O”, “CaO”, “Na2O”, “TiO2”. Bar heights: SiO2 about 70; Al2O3 about 20; Na2O about 10; MgO 0; Fe2O3 0; K2O 0; CaO 0; TiO2 0. A line connects points at the same categories with approximate values: SiO2 about 70; Al2O3 about 20; MgO 0; Fe2O3 0; K2O 0; CaO 0; Na2O about 10; TiO2 0. The image C showing a bar and line graph. Text: “c)”. Text: “Madras andesine”. Text: “EDX data, n = 8”. Text: “Best fit andesine Madras, India r = 0.9995 SiO2: Al2O3 = 2.20 EDX SiO2: Al2O3 = 2.13”. The horizontal axis label: “Elemental oxide”. The vertical axis label: “Weight %”. The vertical axis range shows 0 to 80. The horizontal axis categories: “SiO2”, “Al2O3”, “MgO”, “Fe2O3”, “K2O”, “CaO”, “Na2O”, “TiO2”. Bar heights: SiO2 about 55; Al2O3 about 25; CaO about 10; Na2O about 10; MgO 0; Fe2O3 0; K2O 0; TiO2 0. A line connects points at the same categories with approximate values: SiO2 about 55; Al2O3 about 25; MgO 0; Fe2O3 0; K2O 0; CaO about 10; Na2O about 10; TiO2 0.
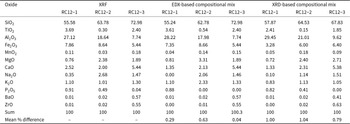
Comparison of powder compositions (main oxides, wt.%) based on XRF analyses, EDX compositions and XRD quantification (participant number 58) and mineral compositions given by Profex and XRD quantitation.

Table 3 Long description
The table lists weight percent of major oxides for three samples (RC12-1, RC12-2, RC12-3) measured by XRF and compared with compositions derived from EDX and from XRD. Silica is the dominant oxide and increases from about 56 to 73 percent by XRF, with EDX matching closely and XRD slightly lower for RC12-3 at about 68 percent. Alumina decreases across the series, from about 27 percent in RC12-1 to about 8 percent in RC12-3 by XRF, with XRD giving somewhat higher alumina than XRF for all three samples. Iron oxide is around 8 percent in RC12-1 and RC12-2 by XRF and EDX, but XRD reports notably lower iron for RC12-1 at about 3 percent and closer values for RC12-2 and RC12-3. Calcium oxide is low in RC12-1 and RC12-2 and higher in RC12-3 at about 5.4 percent across methods, while magnesium oxide peaks in RC12-2 at roughly 2.4 to 3.3 percent depending on method. Sodium oxide differs more by method, including a zero value in the EDX mix for RC12-1 and lower XRD sodium for RC12-2 than XRF. Totals are about 100 percent for each method and sample, with EDX mean percent differences under 1 percent and XRD mean percent differences around 0.8 to 1.0 percent, indicating overall close agreement but some oxide-specific deviations.
Oxides, hydroxides, oxyhydroxides and carbonates
Despite the challenges in differentiating Fe oxide and oxyhydroxide minerals, such as goethite, hematite and magnetite, whose EDX compositions are effectively indistinguishable, additional diagnostic information was obtained from their characteristic crystal morphologies. For example, goethite (2.2 wt.%), in RC12-1 was positively identified based on its flat, lath-shaped crystals (Fig. 3). In contrast, goethite was not detected in RC12-2, despite being present at a similar abundance (2.2 wt.%). Hematite and magnetite in RC12-2 could not be discriminated using EDX compositions alone; their presence was instead inferred from supplementary observations, including the magnetic behaviour of small black grains in RC12-2 and the intense red colouration associated with hematite in RC12-3.
Similarly, the distinct crystal morphologies of TiO2 grains allowed anatase and rutile to be distinguished in RC12-1. In contrast, only rutile crystals were detected in RC12-3, whereas anatase, present at 0.1 wt.%, was not detected. Additionally, the 3.4 wt.% cristobalite present in RC12-2 could not be reliably distinguished from quartz.
Amorphous phases
The amorphous SiO2 phase (opal) in RC12-1 was successfully identified based on the spherical grain morphology (Fig. 3a) and the absence of electron diffraction patterns during selective-area TEM analyses. In contrast, the amorphous obsidian glass in RC12-2 was not recognized, primarily because glass compositions were not included in the MinMatch database at the time. Since then, eight glass compositions, ranging from obsidian to basaltic glasses, have been added to the database. Re-evaluation of some compositions previously attributed to sanidine feldspars indicated a closer match to obsidian glass; however, characteristic grain shapes for glass were not recognized, and these grains could not be reliably distinguished from feldspars.
Non-oxide minerals
The carbonate polymorphs calcite and aragonite could not be reliably distinguished. Dolomite, however, was recognized in RC12-3 based on its Mg-Ca composition. Apatite was identified in two samples on the basis of its Ca-phosphate chemistry, while pyrite was recognized in RC12-1 based on its Fe-S composition. Baryte was also identified in RC12-3.
Compositional mass balancing and combining with XRD Rietveld quantifications
Rietveld refinement programs, such as Profex (Doebelin & Kleeberg, Reference Doebelin and Kleeberg2015), provide the summed oxide composition derived from the mineral structure files, enabling direct comparison with the bulk powder composition obtained by XRF. This comparison can be used to refine overall quantifications through mass-balancing procedures (Rahfeld et al., Reference Rahfeld, Kleeberg, Möckel and Gutzmer2018). For the XRD quantifications conducted in this study (participant 58), the summed oxide totals differed from the XRF bulk compositions by 1.00, 1.04 and 0.79 wt.% oxides for the RC12-1, RC12-2 and RC12-3 mixtures, respectively (see Supplementary Material).
As a comparison, the EDX-based compositional analyses of both clay minerals and the accessory phases were used to refine the XRD-based quantification results through a stepwise procedure. First, a list of minerals considered present was compiled based on combined XRD and SEM/TEM-EDX results, with Profex-derived values serving as the initial estimates of mineral abundances. Oxide concentrations were then manually adjusted by identifying the mineral(s) contributing the dominant proportion of each element and iteratively modifying their abundances to achieve best agreement with the corresponding bulk XRF concentration. For example, in sample RC12-2, the principal contributors were quartz and heulandite for SiO2, muscovite and kaolinite for Al2O3, muscovite and phlogopite for K2O and plagioclase, dolomite and fluorapatite for CaO. These adjustments were made in a spreadsheet to minimize differences between the EDX-derived elemental mixtures and the bulk XRF data. Finally, the abundances of the remaining minerals were also optimized to further improve the overall agreement between calculated and measured oxide compositions.
This procedure was applied to all three RC12 samples, and the manually mass-balanced, EDX-derived oxide wt.% values were compared with the XRF-derived abundances and the XRD-derived compositions obtained using Profex (Fig. 7). Improvements in compositional matching were observed across all three samples, with all final mass-balanced adjustments showing mean differences of less than 0.5 wt.% oxides relative to the bulk chemistry for each sample. Although mathematically optimized, these adjustments did not result in improved overall quantification. This outcome is attributed to the MinMatch programme failing to identify several accessory minerals, which consequently distorted the calculated values.
Bulk oxide weight (%) results plot for (a) RC12-1, (b) RC12-2 and (c) RC12-3, showing the mass-balanced results using the EDX-derived compositions (solid circles) and XRD quantifications of the mineral components, as well as those given by Profex (open circles). The average differences between the datasets are given in Table 3. The diagonal lines represent 1:1 relationships.

Figure 7 Long description
The image A showing a scatter plot labeled a). The horizontal axis label is “XRF oxide weight (%)” with a range from 0 to 80. The vertical axis label is “EDX or Profex oxide weight (%)” with a range from 0 to 80. A diagonal line runs from the lower left to the upper right. A legend titled “EDX Profex” lists: SiO2, TiO2, Al2O3, FeO, MnO, MgO, CaO, Na2O, K2O, P2O5. Each listed oxide is represented by a distinct marker style in the plot. Plotted points include a point near (55, 55), a point near (30, 30) and multiple points clustered near the origin around x values 0 to 10 and y values 0 to 10. The plotted points are positioned close to the diagonal line. The image B showing a scatter plot labeled b). The horizontal axis label is “XRF oxide weight (%)” with a range from 0 to 80. The vertical axis label is “EDX or Profex oxide weight (%)” with a range from 0 to 80. A diagonal line runs from the lower left to the upper right. Plotted points include a point near (65, 65), a point near (25, 25) and multiple points clustered near the origin around x values 0 to 10 and y values 0 to 10. The plotted points are positioned close to the diagonal line. The image C showing a scatter plot labeled c). The horizontal axis label is “XRF oxide weight (%)” with a range from 0 to 80. The vertical axis label is “EDX or Profex oxide weight (%)” with a range from 0 to 80. A diagonal line runs from the lower left to the upper right. Plotted points include a point near (75, 75), a second point near (75, 70) and multiple points clustered near the origin around x values 0 to 10 and y values 0 to 10. The point near (75, 70) is positioned below the diagonal line. Across a), b) and c), the same axis labels and ranges are used and each plot includes a diagonal reference line with points distributed near that line.
Furthermore, multiple valid approaches probably exist for balancing the compositions, as several minerals exhibit similar elemental signatures. Consequently, there are multiple solutions that can minimize the differences between the chemical mixture model and the XRF results. Mass-balance procedures can also be attempted, such as non-negative least square regression analyses, although the outcomes may vary considerably depending on the assumptions employed.
A more realistic approach would be to integrate EDX-derived oxide chemistries directly into Rietveld refinement workflows, allowing mineral compositions obtained from EDX to dynamically update structural parameters such as site occupancies and formula weights, effectively serving as a quantitative calibration library. This integration could improve the non-unique best-fit mineral structures selected from refinement libraries, as chemically constrained models yield more realistic stoichiometric structures. It would also enhance the identification of intermediate phases within solid-solution series, such as albite-anorthite feldspars and chamosite-clinochlore chlorites. With expanded reference databases and more robust accessory mineral detection, this combined approach could ultimately become a standard procedure for achieving internally consistent and reproducible mineralogical quantifications.
Summary and conclusions
The MinMatch.xls program is a robust, reference-based tool for the rapid, reliable identification of clay minerals and accessory phases using measured oxide compositions. It compares measured data with over 500 reference datasets. Potential matches are ranked using the Pearson correlation coefficient (r), along with secondary criteria, including the SiO2:Al2O3 ratio, other statistical parameters and visual inspection of graphical patterns. This approach provides objective and reproducible results for fine-grained materials.
Application to the 12th Reynolds Cup samples demonstrated accurate identification of clay minerals, coarser phyllosilicates, feldspars and other accessory components. Fine-grained fractions (<1–2 µm) were characterized by TEM-EDX and coarser grains by SEM-EDX. Best-fit compositions had high correlations (r > 0.9779), confirming the program’s precision. Closely related minerals, including illite-smectites, dioctahedral smectites and chlorite species, were reliably distinguished. Feldspars and carbonates were also accurately identified, although differentiation of iron oxides and oxyhydroxides remained limited.
Integration with mass-balance and XRD analyses improved agreement with bulk XRF data (mean differences <0.5 wt.% oxides), supporting quantitative workflows. Although some trace accessory minerals were not detected, the method provides a strong basis for combining chemical, structural and morphological data to achieve comprehensive sample characterisation.
MinMatch offers an efficient and accurate approach for identifying clay minerals and associated phases and is complementary to other analytical techniques. Future improvements, including expanded reference databases, enhanced detection of accessory phases and integration with iterative Rietveld refinement workflows, could further increase its capability to resolve complex, fine-grained assemblages.
Supplementary material
The supplementary material for this article can be found at https://doi.org/10.1180/clm.2026.10032. The latest version of MinMatch is available from the corresponding author upon request.
Acknowledgements
We thank the teachers and participants of past DTTG workshops, where this MinMatch program has been presented, tested and refined. We also thank Steve Hillier for providing the necessary information concerning the 12th Reynolds Cup samples. The manuscript text was improved based on language suggestions from Grammarly and ChatGPT-5. The authors thank Duncan Pirrie and an anonymous reviewer for their constructive comments on the submitted version of the manuscript.
Financial support
The JEOL 2100 Plus TEM microscope used in this study was financed by the Deutsche Forschungsgemeinschaft (DFG project number 428027021; https://gepris.dfg.de/gepris/projekt/428027021).
Competing interests
The authors declare none.


 Open access