


INTRODUCTION
Health-care associated infections (HCAIs) are estimated to affect 9% of in-patients in UK hospitals [Reference McDonald1] and the risk of infection in intensive treatment units (ITUs) is particularly high. Analysing cause is difficult because infection is likely to be multifactorial [Reference Weber, Raasch and Rutala2]. Hospitalization in an ITU, duration of stay, hand and environmental contamination [Reference Stone3] and previous antibiotic use have all been recorded as risk factors for many nosocomial infections [Reference del Mar4–Reference Falagas and Kopterides6], as has the health status of the patient preceding infection [Reference Fridkin and Jarvis7, Reference Graffunder and Venezia8]. Regression analyses can identify individual risk factors, but they oversimplify the underlying processes that lead to the infection. For example, the duration of stay in an ITU is a suggested risk factor for both Acinetobacter and methicillin-resistant Staphylococcus aureus (MRSA) infection [Reference Vosylius, Sipylaite and Ivaskevicius9, Reference Urban, Segal-Maurer and Rahal10] but stay in an ITU is likely to be extended if patients become infected. Furthermore, correlation may not reflect causality and may reflect an underlying phenomenon to which both infection and the risk factor are related. This is particularly important if there is a chain of processes that occur in sequence and lead to infection. Finally, infections by one pathogen do not occur in isolation and that containment and management of one pathogen can impact on the incidence of others [Reference Urban, Segal-Maurer and Rahal10].
Given the magnitude of the clinical problems posed by nosocomial infections there has been considerable interest in developing models to investigate the transmission and infection process and the impact of management to mitigate against spread. Modelling disease transmission and control in a hospital environment is complicated by the fact that the clinical environment is not homogeneous. Hospital environments are hierarchically structured and have inherent stochastic processes and small populations that impact on the ability to generate practical models. Therefore, mean-field models are often limited by the small number and stochastic nature of the clinical environment and frequentist statistical approaches by interdependence and non-independence of the disease processes. While there have been considerable advances in the use of Bayesian approaches and Markov chain Monte Carlo (MCMC) methods that allow for model parameter estimation under these conditions [Reference McBryde, Pettitt and McElwain11], few models have been developed to investigate day-to-day processes that operate at the level of the individual nurse and patient. In this paper we consider these processes and investigate the structural dependency between management processes that we hypothesize may be significant in determining the incidence of cases of colonization/infection in an ITU. Structural equation modelling (SEM) investigates relationships among different processes by partitioning relationships among variables on the basis of a hypothetical pathway of interaction that are identified a priori. The paths between variables are defined in equation form with response variables (a case occurring) related to two or more predictor variables (medical history, contact with infected patients, etc.) with response variables in one equation forming the predictors in others. SEM tests whether the variables in the path are interrelated by analysing their variances and covariances. Goodness-of-fit criteria for each model are then used to compare and identify the simplest model and best explanation for the available data. SEM is effectively used to challenge an a priori hypothetical model of a system with data observed about that system. While SEM has been used in the analysis of behavioural aspects of healthcare [Reference Schuckit12] its use in an epidemiological context has been less frequent [Reference Bryan, Schmiege and Broaddus13].
We used this patient-centred modelling approach to investigate the role of risk factors in determining colonization and infection by opportunist pathogens in an ITU, specifically MRSA, Acinetobacter spp., Klebsiella spp., Candida spp., and Pseudomonas spp. First, we used Monte Carlo analyses of incidences of colonization and infection in space and time to investigate whether cases in the ward were clustered in space or time. The rationale being that close proximity of cases in time and bed occupancy might be indicative of contagious rather than opportunistic colonization and infection among patients. We then developed a hypothetical pathway model of ward colonization/infection based on recorded patient and ward management and challenged it using SEM to disentangle the relative contribution of interacting covariates in determining the number of cases.
MATERIALS AND METHODS
Management of the ITU and collation of data
The data were derived from records of admission of patients (from 1 September 2002 to 31 August 2003) to an 18-bedded ITU in a UK hospital with a high proportion of trauma, neurosurgery, vascular surgery and hepato-biliary surgery patients. Patients were admitted directly from the community and other wards and all were screened routinely for MRSA carriage. Clinical samples were collected if patients showed signs of sepsis. Patients were isolated if they had diarrhoea, other transmissible infections or were colonized with a resistant organism. Given the diverse nature of the sources of samples it was not possible to delineate between colonized and infected status among the cases so no distinction was made between clinical infection and asymptomatic colonization. A colonization/infection case or event was considered to be any positive record of the presence of a pathogen on an individual patient.
About 3 months into the study period there was an outbreak of multi-drug resistant Acinetobacter. Isolation protocols were changed to barrier nursing procedures without moving the patient or bed. Nursing staff worked a shift system with two shifts per 24-h period and each patient was allocated a nurse for the duration of each shift. Nurses also assisted colleagues with the care of other patients when required. No records of movements by doctors and other medical professionals were kept. Similarly, no information on nursing activities with individual patients was available and nurse contact was simply a record of who was nursing whom and their colonization/infections status on each shift. Due to availability of data, the five pathogens were analysed as species; sub-species/serotypes information was not available.
Analysis of clustering of colonization/infection status among beds and through time
A Monte Carlo approach was used to estimate whether cases of colonization/infection by each of the organisms clustered in time and space. The 18 beds positions were assumed to be fixed points in space.
A modification of K functions was used to assess the extent to which cases of colonization/infection within patients were clustered in time and space. The K function  is defined as the expected number of events within distance s of an arbitrary event. Over a surface of events it is calculated from:
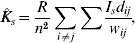
where R is the area of the study area; n is the number of points; s is the distance; I is an indicator variable taking the value 1 if the event is within the distance s; d is the distance between points i and j; and w is an edge correction factor that allows for the fact that the boundary of the study area may lie within the search radius s beyond which there are obviously no events to count. If is calculated for randomly distributed points in the same plane, for multiple realizations of randomly distributed points, then it is possible to assess the extent to which the observed pattern K deviates from random. To consider clustering in both time and space the K function is extended to  which is defined as the expected number of events within distance s and time t of an arbitrary event. Here u is the temporal separation between points i and j; and v is an analogous edge correction factor for time:
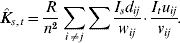
If the processes are independent in time and space then should equate to the product of two K functions, one relating to space and one to time  .
.
The function:

is then a measure of the extent of spatio-temporal dependency in the point data. The extent to which there is spatial and temporal dependency in the point data can be assessed by Monte Carlo approaches in a manner similar to that for the simple K function, by allocating time coordinates to the points at random and comparing the random  with those of the observed.
The extent of clustering is assessed by ranking the total count of colonizations/infections against similar total counts obtained from a large number of random permutations. To allow for the disease demography we included the full period over which patients were infected in the analysis. In contrast with K-function analysis (which addresses points of colonization/infection in time and space) we preserved the trajectory of time of disease and changes in bed occupancy for each patient, but permuted when and where they started. One thousand iterations were performed for each pathogen.
We undertook initial analyses over the range 0–30% of the total ranges in time and space with space and time steps of 1 m and 7 days. The limits were set to ensure that all events were not included in the count in space or time.
SEM of colonization/infection in the ITU
We collated records of the numbers of patients reported as carrying individual pathogens with a colonization/infection; beds occupied; the number of colonized/infected patients seen by nurses prior to any individual becoming colonized/infected; the level of ward colonization/infection from admission to the point at which individual patients became colonized/infected; the reason for admission to ITU; patient age; duration of stay prior to colonization/infection and the APACHE II score on admission to the ward. The APACHE II score is a continuous measure of patient health and is an assessment of the likelihood of patient survival. These data were used to collate a series of potential predictor variables that were hypothesized to be responsible for colonization/infection by each pathogen. These variables were the number of bed moves made by an individual patient in the ward, the duration of time in the ward, and three time-based measures of nurse contact with other colonized/infected patients prior to an individual becoming colonized/infected. The nurse contact variable was the sum of shifts that a nurse had with colonized/infected patients in 2, 4 or 6 days prior to the reference case becoming colonized/infected. Where patients left the ward without ever becoming colonized/infected, they were effectively censored and the relevant details of time in the ward and bed moves were collated in relation to their points of leaving. The nurse contact variables were also measured in relation to the time of leaving.
We developed a conceptual model of the colonization and infection process for all pathogens (Fig. 1). This model was based on our assessment of the likely impact of the processes observed in the ITU, it did not include processes or factors for which we had no data. As such it is an empirical model. This model assumed that incidence of colonization/infection in individual patients in the ITU was driven by two sets of processes, one related to patient health and their reason for admission to the ward and the other related to their subsequent management post-admission. The first included the cause of admission to ITU and the general health of the patient. Patients were admitted for treatment for one of 19 specialities; however, the numbers of patients in each category were, in some cases, too few for analysis. Specialities that involved invasive surgical procedures were pooled into a surgical group and those without surgical procedures into a second group. We assumed that patients suffering invasive procedures and those with high APACHE II scores were likely to be more susceptible to colonization/infection. For the second set of processes, the hypothesis was that colonization/infection was related to contact with nurses who had been in contact with colonized/infected patients prior to the individual patient becoming colonized/infected (time period set to contacts in the preceding 2, 4, or 6 days) and that the number of these contacts was related to the overall level of colonization/infection in the ward and the duration of stay prior to colonization/infection. In addition, risk of colonization/infection would be greater in patients who had moved beds or around the ward prior to infection. We also assumed that length of stay prior to colonization/infection would increase bed moves and the number of nurse contacts with colonized/infected patients. Since isolation of cases of MRSA was a specific management strategy bed movement was included as an endogenous variable in the full model for MRSA, but this was assumed to be an exogenous variable for the other pathogens.
Full model of the potential routes of infection for an individual pathogen in an intensive treatment unit.

SEM [Reference Kline14] was used to investigate the relationships among the predictor variables and colonization/infection in the hypothetical model. The model was tested for each pathogen and then compared with simpler models from which non-significant pathways were removed. Goodness of fit was assessed using χ2 tests (where a significant χ2 statistic indicates that the model is not supported by the data), the comparative fit index (CFI) and the root mean square error of approximation (RMSEA) following the methodology of Kline [Reference Kline14]. The models were fitted using weighted least squares using a diagonal weight matrix and a variance adjusted χ2 statistic (the default settings for a binary response variable in a SEM) in the Mplus 8 package [Reference Muthén and Muthén15]. The Mplus analysis formulation assumes conditional normality rather than the more restrictive assumptions of multivariate normality. The conditional normality assumption allows non-normality for the response variables [Reference Muthén and Muthén15].
In order to test the validity of the models we obtained new (validation) data from the same ITU, for the 4 months preceding the study period (1 May 2002 to 30 August 2002). A typical method for comparing two datasets in a SEM is to undertake a group analysis, whereby both sets of data are modelled in combination with group as a covariate, effectively under the constraint that the parameter estimates are assumed to be the same for each dataset. This approach was not used since this method makes the assumption that the two datasets are independent [Reference Grace and Pugesek16], which given the longitudinal nature of the dataset was not a valid assumption. Instead, we identified the most parsimonious path model for each pathogen and then cross-validated each with the new dataset. Three methods were used to cross-validate each model. In the first we compared the levels of incidence of each pathogen over the two periods and then made a formal comparison of the magnitude of the covariates used in the models in the two periods using generalized linear models with the log-transformed covariates as the response and the sample period as a predictor. In the second, the correlation matrices for the parsimonious model were compared with those for the new data using the root mean square residual (RMSR) statistic. This effectively quantifies how the overall relationships among the covariates differed between the model and new datasets for each pathogen. A Monte Carlo approach was used to test the extent to which the RMSR statistic differed between the new data and that used in the original analyses. Here we permuted the input covariates for each model 1000 times and calculated the RSMR between the correlation matrix for the variables used in the original parsimonious model and that of each permutation. The number of the random permutations were calculated that exceeded the RSMR value of that of the new data to original data comparison. This gave an assessment of the extent to which the match between correlation structures in the original model data and that used in the validation could have arisen by chance. If the RSMR for the correlation matrices of the validation data and original model data, for any pathogen model, was exceeded by 950 of the permutation correlation matrix comparisons then it could be concluded that the similarity did not arise by chance and that the correlation structures of the two datasets were similar. In the third method the parameter estimates from the final (parsimonious) SEM for each pathogen were used to predict the probability of colonization/infection expected for each case/non-case in the new dataset. Receiver operator characteristics (ROC) plots and area under the curve (AUC) statistics were used to compare the predicted infection/colonization status with that actually observed in the validation data.
RESULTS
The incidence of infections within the ITU
A total of 440 patients passed through the ITU ward in the study period. Patients were admitted under 24 specialities from 87 clinicians; 291 nursing staff were associated with individual beds within the ward. The number of beds with which each nurse was associated increased with the number of patients admitted, with 102 nurses attending half or more of the beds over the study. The mean duration of stay in the ward was 38·6 shifts (s.d.=83·8). The number of beds occupied by individual patients was positively related to length of stay (r=0·541, t=13·47, P<2·2×10−16). There was a total of 3814 microbiological tests undertaken on patients from the ITU over the study period. Of these cases it was not possible to identify which were colonization, infections at specific wound sites or whether the latter were derived from injuries/interventions received before, during or after surgery. Nonetheless, information on sample position was recorded in the microbiology laboratory and of the samples taken from ITU; 216 recorded no pathogen, 579 records were collated from blood samples; 267 from drains following procedures; 1482 from sputum samples; 186 from swabs; 137 from tips; 119 from tracheostomies; 196 from urine and 632 from wounds. Of these there were 168 cases of colonization/infection by MRSA, 44 cases by Acinetobacter spp., 50 cases by Klebsiella spp., 105 cases by Candida spp. and 72 cases by Pseudomonas spp. There was an increase in all cases of colonization/infection during the first 3 months of the study (Fig. 2), which was followed by a decline and a slight increase towards the end. The decline in Acinetobacter cases after the first 3 months followed the introduction of a series of interventions to minimize spread of this pathogen in the ward.
Trends in incidence of infections by 5 pathogens in the intensive treatment unit ward, by 12-h shift (x axis), from 2002 to 2003. Note the study began at shift number 1200. Loess smoothing was used to simplify time trend (smoothing parameter f=0·001, equivalent to 7 shifts around each point).

Space–time clustering
Table 1 shows the significance of clustering at each separation in time and space. Colonizations/infections by MRSA, Candida and Pseudomonas were clustered at many space and time thresholds, but those of Acinetobacter and Klebsiella showed no clustering whatsoever. Clustering was highest in Candida. These results suggest that for some of the pathogens the presence of colonization/infection was a risk for subsequent colonization/infection in nearby beds.
Space–time clustering of infections in the intensive treatment unit at different time and inter-bed distances

s(m) is the distance step in metres and t(m) is the time step in shifts (12 h). P values representing levels of significance of difference between observed level of clustering and that derived from 1000 permutations of starting point of patient entry into intensive treatment unit. Grey cells indicate significant space–time clustering, e.g. s6 (6 m), t4 (4× 12 h shifts) was P=0·044. Empty cells indicate no significant space–time clustering.
SEM of pathways of colonization/infection
Pathway models are assessed by considering (i) the χ2 statistic – which should be non-significant if the difference between the predicted covariance structure and that observed in the data is non-significant. In effect, a non-significant χ2 is suggestive that the model is adequate; (ii) the RMSEA which should be <0·05, and (iii) through consideration of the significance of the individual path coefficients. χ2 tests for the full models for each pathogen were high suggesting that our conceptual models were not good descriptors of the data. The removal of non-significant pathways greatly decreased the χ2 values for all pathogens except Pseudomonas – for which no model provided significant pathways. The models with all of the non-significant predictors removed are shown in Figure 3. Assessments of model adequacy for parsimonious models for each pathogen are shown in Table 2. The best models differed between pathogens. For all pathogens, the number of nurse contacts with other colonized/infected patients was a significant predictor of colonization/infection in these simpler models, although the contact period differed between pathogens. For MRSA, nurse contacts with infected patients for 2, 4 and 6 days prior to colonization/infection were all significant predictors, but the strongest impact was noted for contacts in the prior 2 days. The results were similar for Klebsiella colonizations/infections, while nurse contacts in the previous 4 days generated the best models for Acinetobacter and Candida colonizations/infections. Nurse contact variables were also significantly related to number of bed moves made by a patient prior to becoming infected. Therefore, bed moves impacted on nurse contacts, which in turn impacted on colonization/infections. These results suggest that there is an interaction between nursing contacts with patients and ward management that influences the likelihood of a patient becoming infected for all of the pathogens tested, except Pseudomonas. In addition for all pathogens except MRSA the time spent in the ward prior to becoming infected was a significant predictor of bed movement. This indicates that extending the time in the ward increased risk of becoming infected because it enhanced bed movement and hence nurse contact. The residual terms (expressed as coefficients in the boxes in Fig. 3) for internal variables within the model (i.e. those that are predicted and are themselves predictors – such as nurse contacts) were high, suggesting that other key processes and variables were not included in our models.
The best path models (i.e. those with significant pathways) for infections by four pathogens in the intensive treatment unit 2002–2003. Values next to pathways show standardized coefficients. The parameter estimates and their standard errors are shown in parentheses. The unexplained variation for each of the variables, internally predicted by the models, is shown in their respective boxes. No model is shown for the infections caused by Pseudomonas aeruginosa since there were no significant pathways.

Summary statistics for the pathway models to infection for five pathogens

Results for both the full model and the best path model at each nurse contact period (2, 4 and 6 days) are shown for each. χ2 is the test statistic used to assess the models, d.f. is the degrees of freedom and P is the significance level. For χ2 tests, non-significance means that the model is an adequate description of the data. The simplest models from which non significant pathways have been removed are shown in Figure 3. CFI is the comparative fit index where values near 1 infer good fit. RMSEA is the root mean square error of approximation with values <0·05 indicating good fit.
SEM model validation
There was a total of 143 patients in ITUs in the 3-month validation dataset. Numbers of cases of colonization and infection were lower in this period, with only 4 cases of Acinetobacter, 5 of Candida, 2 of Klebsiella and 8 of MRSA. On the basis of the previous period we would have expected 11 cases of Acinetobacter; 26 of Candida; 12 of Klebsiella and 44 of MRSA. However, the number of bed movements and nurse contacts that were key drivers in the SEM were also lower in this period. The number of bed moves per patient was 2·45 times higher in the original study period for patients with Acinetobacter than in the validation period (t=17·8 P<0·0× 10−16) and the number of nurse contacts was higher in this period by a factor of 1·21 (t=3·67, P<0·00031). The same was the case for MRSA, Candida and Klebsiella colonizations/infections where bed movements was between 2·3 and 2·6 times higher and nurse contacts with other cases of infection 1·2–2·3 times higher in the later period than in the validation phase (P<0·000001 in all cases).
If both the incidence of the pathogens and the putative drivers changed between the original sampling period and that of the validation period, did their relationships change? If the correlation structure of the data derived from the two periods was the same then the relationships developed in the earlier stage of the modelling would have greater generality for subsequent periods. The number of times that permuted samples of the validation data produced RSMR statistics greater than those derived from a comparison of the cross-validation and original data correlation matrices, varied with the pathogen. There were insufficient cases of Klebsiella for analysis. For the MRSA models 990 permutation matrices had higher RSMR values than that of the direct original to validation data comparison. For Acinetobacter the number was 797 and for Candida, 992. These results suggest that the correlation structures of the original data used in the models and those used to validate them were similar for each pathogen.
ROC plots assessing the extent to which predictions of the parsimonious model for each pathogen were matched by the observed data in the validation datasets are shown in Figure 4. In a ROC plot the true positive rate (sensitivity) is plotted against the false positive (specificity) for different decision thresholds for accepting presence. The closer the plot is to the upper left of the plot the better is the model at predicting the binary outcome. The AUC represents this more formally, with a value of 1 representing perfect fit and values of 0·5 approximately random. In this case all models except that for MRSA had AUC >0·6 indicating that they performed better than chance. The model for MRSA was the poorest, suggesting that it was little better than chance and that the variables measured were not good predictors outside of the dataset for which the model was originally developed.
Receiver operator characteristic (ROC) plots assessing model performance for the four parsimonious path models when used to predict outcomes in the validation dataset. Note that the models used the direct effects and not indirect effects of variables, since the endogenous proximal variables in the networks were all directly observed.

Summary of results
The pattern of disease in the ITUs over the study period depended on the pathogen considered. There was significant clustering of cases of MRSA, Candida and Pseudmononas, but not of cases of either Acinetobacter or Klebsiella. For the structural equation models, only that for cases of Candida was adequate when assessed by both goodness-of-fit criteria and in terms of its ability to predict new cases. While the models for Acinetobacter and Klebsiella (and more marginally MRSA) were adequate when assessed on the basis of goodness-of-fit criteria, there were insufficient cases to validate them in the new dataset.
DISCUSSION
The high cost of control programmes and the need for an evidence base on which to form them have led to extensive research into risk factors associated with nosocomial infections. Since experimentation is inevitably difficult in a clinical context, considerable attention has been paid to modelling approaches. There have been a number of studies that have investigated nosocomial infections using modelling approaches. These have ranged from analytical approaches (e.g. [Reference Vanderpas, Louis, Reynders, Mascart and Vandenberg17]) that attempt to simulate the dynamics of spread to stochastic modelling approaches [Reference Pelupessy, Bonten and Diekmann18, Reference Cooper and Lipsitch19] that specifically recognize the longitudinal and stochastic nature of colonization in a small population setting. Many of these approaches have been based on MCMC techniques that allow parameter estimation, e.g. transmission coefficients, when frequentist approaches are intractable. While some of these models address issues of the disease progression, e.g. through compartment models [Reference Starr, Campbell, Renshaw, Poxton and Gibson20], few have addressed issues of day-to-day patient management considering factors like the role of individual nurses and individual bed occupancy; with the possible exception of McBryde [Reference McBryde, Pettitt and McElwain11], who investigated hand washing and duration of stay on disease transmission. Our approach was totally empirical, in that we built our conceptual model around the processes that we observed in this particular ITU. We wanted to assess the relative impacts of these procedures on disease incidence, while recognizing that many of the processes would be non-independent and interact in the disease process. We used SEM because it explicitly seeks to model the dependency among the covariates and the outcomes. All models are simplifications of reality and their outputs have to be judged in the context of the underlying simplifications and assumptions. In our case simplification was driven as much by the available information as by the scope of the observed and modelled processes. Our analyses were not based on data collected from a ‘trial’, rather they were based on data collected from a real clinical environment where behaviour was determined by clinical need and not the scientific rigour required in experimentation. Furthermore, none of the data were collected with any form of analysis in mind, rather they were collected for management and monitoring of a highly dynamic clinical environment. This has implications for the results insofar as the data themselves would not necessarily have been able to capture the dynamics of colonization or disease transmission at an appropriate scale, e.g. patients were not sampled on a daily basis for colonization. We could not differentiate between colonization and infection for which the risk factors are likely to be different. Furthermore, we clearly did not have access to information on all of the processes likely to be involved with colonization or infection, and had, at best, surrogate measures for disease spread. The potential role of non-nursing medical staff in colonization/infection was not investigated, since attendance of these staff on the ward was not recorded. We subsumed the role of clinicians into the speciality that they provided thus possibly underestimating clinicians in the colonization/infection process. Prior patient treatment with antimicrobials was also not included and this is an important risk factor predisposing colonization/infection by both MRSA [Reference Graffunder and Venezia8] and carbapenem-resistant A. baumannii [Reference del Mar4]. Pathways of disease to uncolonized/uninfected patients were only investigated after colonization/infection was present in the ward and we assumed that ward colonization/infection, patient condition and surgery were independent of the colonization/infection process.
Our modelling approach could also be criticized on the basis of attempting to adopt a quasi-frequentist approach in an environment where the data are unlikely to meet distributional assumptions. There was obvious serial dependency between the levels of ward colonization and infection and nurse contact variables and the outcome of individual patient colonization/infection. However, the results indicate that the pattern of variation and relationships among the outcomes and their putative covariates were similar in the original and validation datasets, suggesting that the SEM analyses were reasonably robust. Notwithstanding these assumptions, weaknesses and omissions, the results suggest that the pattern of incidence of the pathogens was different on the ward and that management and ward-related factors impacted on the each pathogen differently. These differences in pattern may well relate to the biology of each organism and/or the direct management of the Acinetobacter outbreak that occurred during the study period. The outbreak initiated a range of infection control measures over several months. These measures controlled the outbreak as reflected in the subsequent low number of cases. It was not possible to identify which factors contributed to the reduction of infections by Acinetobacter, but the absence of clustering in cases during the period suggests that any contagious element had been contained. The introduction of antibacterial alcohol hand-washes may have been responsible for the decline. However the incidence of MRSA and Candida increased subsequently, indicating that incidence of colonization/infection occurred irrespective of the intervention to control the Acinetobacter outbreak. Furthermore, the existence of space–time clustering for three of the pathogens leads us to conclude that inter-patient transmission of some form for these pathogens (at least) was occurring on the ward [Reference Rello21].
The SEM analyses attempted to identify risk factors leading to colonization/infection by each pathogen. Prior nurse contact with colonized/infected patients prior to a patient becoming colonized/infected was a significant predictor for all pathogens. Nursing staff have been implicated as risk factors in previous studies [Reference Cepeda22]. Given that the nurse contact, ward level of colonization/infection and duration of stay prior to colonization/infection covariates were specific to each pathogen (although undoubtedly non-independent) it is not possible to compare the relative significance of each variable across pathogens. Nevertheless, the results indicate that the ‘contact time’ leading to the best models varied with the pathogen, possibly as a consequence of differences in their underlying epidemiology of transmission. More interestingly, the number of contacts made by nurses with colonized/infected cases was significantly related to the number of bed moves made by patients. These results suggest that there is an interaction between bed movement and patient–nurse changes that interact to enhance the risk of colonization/infection. Indeed, this factor may have been partially responsible for the relatively low incidence of the pathogens during the period when the validation data were collected, since the extent of bed moves and the subsequent nurse contacts with colonized/infected cases was considerably lower in this part of the study. Ironically, this may also have contributed to the comparatively low success in our model validation, since there were fewer cases of colonization/infection by each pathogen available for analysis. The impacts of extended stays in ward increasing the risk of infection reported elsewhere [Reference Stone3] appear to be mediated by bed movements. This is logical since ward management necessitates bed movement and the longer patients are present in a ward the more likely they are to be moved. The suggested role of bed movements in colonization/infection clearly has implications for ward management since it implies that patient movement and changing nurses among patients should be minimized to reduce risk of colonization and infection. Thus the practice of moving patients to isolate cases of MRSA within the ward could pose risks of enhancing other nosocomial infections.
This study highlights the complex interactions arising from the need to manage multiple clinical conditions among multiple nosocomial threats. Our findings suggest that the interaction between bed movement and contact between nursing staff and colonized/infected patients has to be managed prescriptively to minimize risk of infection. The findings also suggest that there are differences in the epidemiology of individual pathogens which mean that a general strategy aimed at controlling all infections in an ITU context might not be as effective as individual strategies aimed at each [Reference Rello21].
ACKNOWLEDGEMENTS
This research was funded by the Hospital Infection Society. We thank Barbara Lanyon for data entry and an anonymous referee for substantial contributions to the manuscript.
DECLARATION OF INTEREST
None.



