

Introduction
Ruminants play a crucial role in providing high-quality protein products for human consumption, owing to the efficient utilisation of plant fibres by their rumen microbes. However, this process leads to methane emissions, a significant contributor to global climate change (FAO, 2023). Ruminal methanogenesis serves as a metabolic hydrogen sink (Mizrahi et al., Reference Mizrahi, Wallace and Moraïs2021), but results in the loss of 2–12% of dietary energy (Johnson and Ward, Reference Johnson and Ward1996). Moreover, this process competes with other hydrogen-utilising pathways, such as propionate formation and reductive acetogenesis, thereby limiting the synthesis of energy substrates for the host animals (Beauchemin et al., Reference Beauchemin, Ungerfeld and Eckard2020). Notably, ruminal bacterial community greatly contributes in methane emission. Distinct rumen bacterial community type (or ruminotype, analogous to the gut enterotype) had been identified in low-methane-emitting sheep (Kittelmann et al., Reference Kittelmann, Pinares-Patino and Seedorf2014), which was associated with high ruminal propionate production, suggesting a beneficial redirection of metabolic hydrogens from methanogenesis towards more efficient and environmentally friendly pathways (Greening et al., Reference Greening, Geier and Wang2019; Li et al., Reference Li, Ma and Huo2024). Within this ruminotype, Quinella constitutes the predominant bacterial genus (32.5%), and has been proposed as a biomarker for low-methane-emitting ruminants (Kittelmann et al., Reference Kittelmann, Pinares-Patino and Seedorf2014).
Quinella spp., formerly known as Quin’s oval, are characterised by oval-shaped cells initially misclassified as yeasts due to their large sizes (Quin, Reference Quin1943). They are now classified as members of the family Veillonellaceae. While a previous in vitro study indicated that Quinella can produce lactate, acetate, and propionate from glucose, this occurred only in co-culture with other bacteria (Orpin, Reference Orpin1972). However, in vivo studies have yielded inconsistent results regarding its effects on the ruminal acetate-to-propionate ratio in sheep (Kittelmann et al., Reference Kittelmann, Pinares-Patino and Seedorf2014; Vicini et al., Reference Vicini, Brulla and Davis1987). As Quinella remains uncultivable in isolation, its full metabolic potential has not yet to be clarified. Recent genomic evidence from four metagenome-assembled genomes (MAGs) derived from sheep rumen samples revealed that Quinella possesses the genetic capability for utilising glucose and hydrogen to produce acetate, propionate and lactate (Kumar et al., Reference Kumar, Altermann and Leahy2022). Nevertheless, these MAGs were obtained from a limited number of sheep rumen samples, leaving the actual in vivo metabolic role of ruminal Quinella remains unresolved.
The yak (Bos grunniens), indigenous to the Qinghai–Tibet Plateau, has evolved distinctive rumen fermentation characteristics through long-term adaptation to high altitude. Previous studies indicate that yaks exhibited significant rumen metabolic advantages over indigenous cattle, including greater volatile fatty acid (VFA) production and reduced methane emissions (Liu et al., Reference Liu, Li and Pei2022, Reference Liu, Gao and Liu2023a). Metagenomic analyses of highland ruminants also supports this point of view by revealing enriched pathways for ruminal VFA synthesis alongside relatively weaker methanogenic pathways (Zhang et al., Reference Zhang, Xu and Wang2016). Specifically, yaks have been shown to harbour higher ruminal Quinella levels together with lower methane emissions compared to cattle (Liu et al., Reference Liu, Gao and Liu2023a, Reference Liu, Yang and Yang2023b). However, within the yak groups the Quinella function in VFA and methane production has not been verified yet. We hypothesise that the higher Quinella abundance in the yak rumen is associated with a metabolic pattern that redirects hydrogen toward alternative sinks such as propionate synthesis and reductive acetogenesis, thereby enhancing energy harvest efficiency.
Thus, this study aimed to investigate the distribution of ruminal Quinella and its potential role in carbon metabolism and VFA synthesis within the yak rumen. A high-quality genomic database was firstly constructed, comprising 67 Quinella genomes derived from over 12,000 published ruminal MAGs across 12 ruminant species, to elucidate their metabolic potentials. The distribution patterns and inferred functions of Quinella species in yaks were then examined using amplicon sequencing data and the Tax4Fun2 tool. Furthermore, the metabolic role of Quinella in rumen carbohydrate metabolism was investigated through integrated metagenomic and metabolome analyses of yaks with high or lower Quinella (n = 9 per group). Our findings provide novel insights into the functional roles of Quinella in the rumen ecosystem and establish a valuable genomic resource for this genus, which may also provide genetic clues for future cultivation attempts.
Material and methods
Construction of a genomic database for ruminal Quinella
Ruminal MAGs were sourced from 16 published studies (Supplementary Table S1) via public repositories, primarily the NCBI (https://www.ncbi.nlm.nih.gov) and ENA (https://www.ebi.ac.uk). A total of 14,721 MAGs were obtained, representing the rumen microbiome of 12 ruminant species. Following quality assessment with CheckM (Parks et al., Reference Parks, Imelfort and Skennerton2015), 12,717 medium- to high-quality bacterial MAGs were retained, each exhibiting > 80% completeness and < 20% contamination. These MAGs were dereplicated at a 95% average nucleotide identity (ANI) threshold using dRep (Olm et al., Reference Olm, Brown and Brooks2017), resulting in 5,901 non-redundant bacterial MAGs. Taxonomic annotation was performed using the Genome Taxonomy Database Toolkit (GTDB-Tk, v2.3.0) with its reference database (release 214, updated on 28 April 2023). From this curated set, 67 medium- to high-quality Quinella MAGs were identified and compiled into a novel genomic database for subsequent analysis.
The phylogenetic tree of Quinella species was constructed using GTDB-Tk (v2.3.0) and visualised with Evolview v3 (Subramanian et al., Reference Subramanian, Gao and Lercher2019). From the MAG collection, a subset of 38 high-quality MAGs, meeting the criteria of > 90% completeness and < 3% contamination, was selected to analyse the metabolic potential of Quinella. This stricter contamination threshold (<3%, versus the commonly used 5%) was applied to minimise the misinterpretation of metabolic functions due to contaminating sequences. Carbohydrate-active enzymes, particularly glucoside hydrolases (GH), were annotated in the MAGs using dbCAN-sub (E-value < 1e-15, coverage > 0.35) (Zheng et al., Reference Zheng, Ge and Yan2023). Specialised gene clusters related to primary metabolism and energy capture were identified using gutSMASH (Pascal Andreu et al., Reference Pascal Andreu, Roel-Touris and Dodd2021). Functional profiles were generated using Prokka (E-value < 1e-6) (Seemann, Reference Seemann2014), retaining only genes present in more than 75% of the selected 38 high-quality MAGs.
Abundance distribution of Quinella in the yak rumen
Rumen bacterial 16S rRNA gene sequencing, comprising samples from yaks (n = 359) and cattle (n = 299), were obtained from published studies (Supplementary Table S2). Raw sequences were quality-checked using FastQC (v0.12.0) and subsequently processed in QIIME2 (v.2023.7) (Bolyen et al., Reference Bolyen, Rideout and Dillon2019). Single-end and merged paired-end reads were denoised into amplicon sequence variants (ASVs) using DADA2 (v.1.26.0) (Callahan et al., Reference Callahan, McMurdie and Rosen2016). Taxonomic classification of ASVs was performed against the SILVA database (v.138.1) (Quast et al., Reference Quast, Pruesse and Yilmaz2012). After removing mitochondrial and chloroplast-derived sequences, ASVs that appeared in fewer than two samples or had a total frequency of less than 10 reads across all samples were filtered out. The remaining ASVs were analysed at various taxonomic levels. For comparative analysis, the relative abundance of bacterial ASVs were normalised to 100% per sample.
To compare yaks with high and low ruminal Quinella abundance, all samples in which Quinella was not detected (zero reads) were first excluded. This step was to prevent the misclassification of samples where this genus might be absent or below the detection limit (e.g., due to lower sequencing depth), as representing low abundance. From the remaining samples containing Quinella, the 15 samples with the highest relative abundance of Quinella were designated as the high-Quinella group, and another 15 samples with the lowest relative abundance formed the low-Quinella group. The average sequencing depth for the low-Quinella group was 50,570 ± 2,468 reads (mean ± standard error), confirming sufficient coverage. The functional profiles of the rumen bacterial community in these samples were then predicted using Tax4Fun2 (Wemheuer et al., Reference Wemheuer, Taylor and Daniel2020). KEGG Orthology (KO) groups (Kanehisa and Goto, Reference Kanehisa and Goto2000) were identified where the sequence similarity exceeded 97% against the reference profiles (Ref99NR). Finally, the predicted functional profiles were normalised to counts per million (CPM), and any KO terms or pathways present in fewer than 15 samples or having a CPM below 5 were excluded from subsequent analysis.
Animal experiment and sampling in the yak model
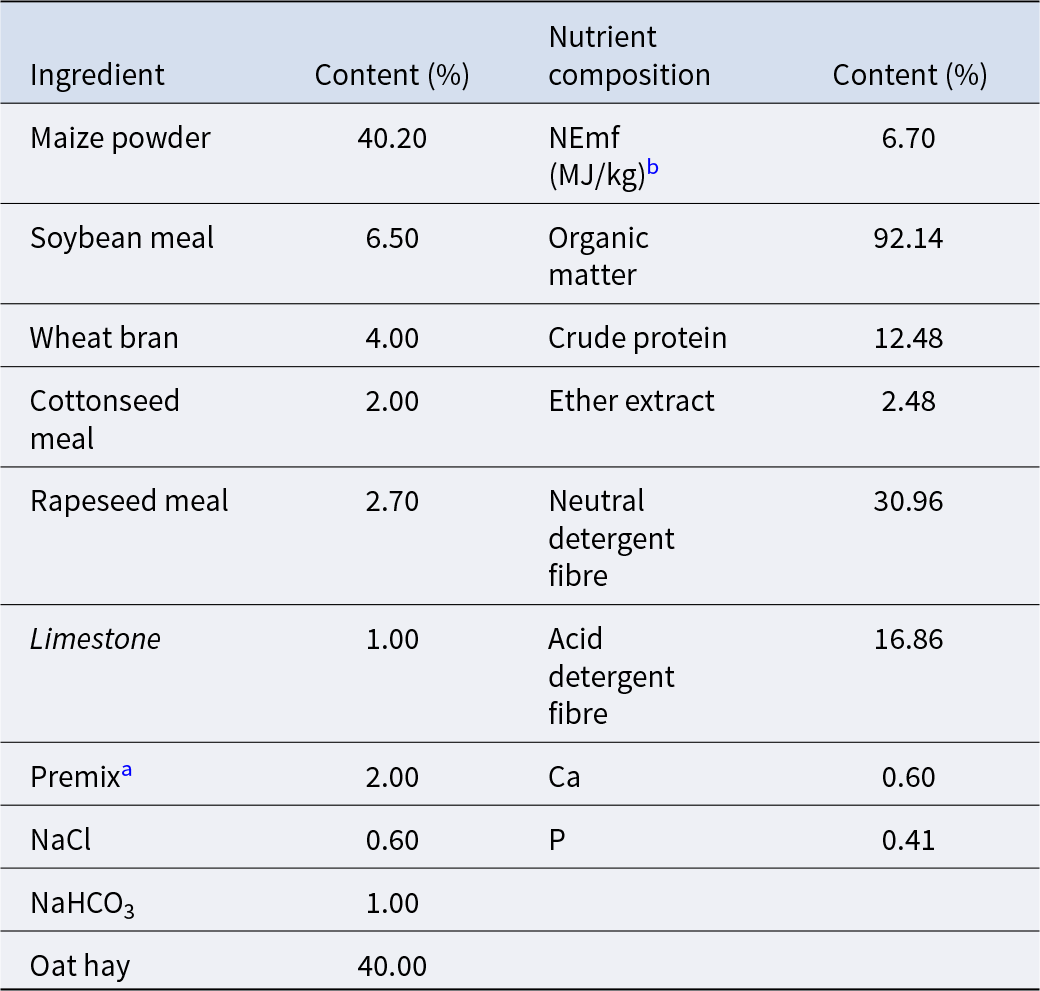
A herd of 40 healthy male yaks, with an average liveweight of 134.3 kg, was utilised in this study. Experimental procedures were approved by the Institutional Animal Care and Use Committee (IACUC) of Nanjing Agricultural University [SYXK (SU) 2017-0007]. The yaks were housed on a local farm on the Qinghai–Tibet Plateau (100.98°E, 35.25°N, 3,380 m altitude) and fed a standard total mixed ration ad libitum. The ration contained 14.8% crude protein with a concentrate-to-forage ratio of 60:40 on a dry matter basis (Table 1). After a 2-week dietary adaptation period, the animals were maintained on this ration for an additional 4 weeks prior to sampling. The initial average feed intake of yaks was 4.40 kg/day on a dry matter basis, with a standard error of 0.165. Yaks were individually tethered with continuous access to fresh water. Before the morning feeding, ruminal content samples were collected from the yaks via the oesophagus using a commercial gastric tube (Wuhan Anscitech Farming Technology Co., Ltd., Wuhan, China). Samples were filtered through four layers of gauze and stored in liquid nitrogen for subsequent analysis.
Feed ingredient and nutrient composition of growing yaks (dry matter basis)

a Premix provides 6.0 mg vitamin A, 1.5 mg vitamin D3, 20 mg vitamin E, 20.0 μg biotin, 60.0 mg nicotinic acid, 72.0 mg Fe (FeSO4), 16.0 mg Cu (CuSO4), 76.0 mg Zn (ZnSO4), 64.0 mg Mn (MnSO4), 1.8 mg I (KI), 1.4 mg Se (Na2SeO3) for per kg of the total ration.
b NEmf, net energy for maintenance and fattening of growing yaks.
DNA extraction and metagenomic sequencing of yak rumen samples
Genomic DNA was extracted from ruminal content samples using a commercial bead-beating kit (product no. DP328; TIANGEN Biotech Co., Ltd., Beijing, China), a method commonly used in rumen microbial studies (Luo et al., Reference Luo, Li and Zhang2022). The concentration and integrity of the DNA were evaluated using a Qubit 2.0 Fluorometer (Thermo Scientific, Waltham, MA, USA) and by agarose gel electrophoresis. Qualified DNA was used for library construction with an Agencourt AMPure XPMedium kit (product no. A63880; Beckman Coulter, Inc., Brea, CA, USA). Metagenomic library sequencing was performed on the MGISEQ-2000 platform at BGI Genomics Co., Ltd. (Beijing, China) to generate 150-bp paired-end reads. Raw reads were processed using SOAPnuke (parameter: -n 0.001 -l 20 -q 0.5 -adaMis 3 -minReadLen 150) (Chen et al., Reference Chen, Chen and Shi2018) to remove adaptors and low-quality reads. After pre-processing, a total of 3,129,029,844 reads were generated, with an average of 78,225,746 ± 555,435 reads (mean ± standard error) per sample.
Thereafter, host-derived DNA sequences were filtered out by aligning reads to the top-level DNA of Bos grunniens (https://ftp.ensembl.org; modified on 13 December 2022) using Bowtie2 (v.2.5.1) (Langmead and Salzberg, Reference Langmead and Salzberg2012). The remaining microbial reads were de novo assembled into contigs longer than 1,000 bp using MEGAHIT (v.1.2.9; parameter: -min-contig-len 1000) (Li et al., Reference Li, Liu and Luo2015). After assembly, open reading frames (ORFs) were then predicted from these contigs using Prodigal (v.2.6.3; parameter: -p meta) (Hyatt et al., Reference Hyatt, Chen and LoCascio2010). The ORFs from all samples were pooled and clustered using CD-HIT (v.4.8.1; parameter: -aS 0.9 -c 0.95 -G 0 -g 0 -T 0 -M 0) to generate a non-redundant gene catalogue (Fu et al., Reference Fu, Niu and Zhu2012). Finally, gene abundance within each sample was quantified using Salmon (v.1.10.2; parameter: -validateMappings -meta) (Patro et al., Reference Patro, Duggal and Love2017) by aligning reads to the non-redundant gene catalogue. The results were normalised to the transcripts per million (TPM) for subsequent analysis.
Taxonomic and functional annotation of yak rumen metagenomes
Prior to annotation, the nucleotide-based gene catalogue was translated into a corresponding protein catalogue using SeqKit (Shen et al., Reference Shen, Le and Li2016). For taxonomic profiling of the rumen microbiome, protein sequences were aligned using DIAMOND (v.2.1.9) (Buchfink et al., Reference Buchfink, Xie and Huson2015) against the NCBI-NR database (171.6 GB size, modified on 23 December 2023), based on the BLASTP function (parameter: -evalue 1e-5 -max-target-seqs 5). Since no protein sequences of Quinella were available in the NCBI-NR database, we performed a separate taxonomic assignment for this genus. The nucleotide gene catalogue was aligned using the BLASTN function (parameter: -evalue 1e-5) against our custom Quinella genomic database (Chen et al., Reference Chen, Ye and Zhang2015). Results from both annotation rounds were merged, retaining only the highest-scoring matches for each query sequence. Microbial functions were annotated by aligning protein sequences to the eggNOG database (v.5.0.2, parameter: -m diamond -evalue 1e-5) (Huerta-Cepas et al., Reference Huerta-Cepas, Szklarczyk and Heller2019) to obtain abundances of KEGG pathways, modules and reactions. For downstream analysis, only microbial functions with a TPM > 5 in at least 50% of the samples were retained. Functional enrichment analysis between the high- and low-Quinella groups was conducted using the ReporterScore package (v.0.1.6) (Peng et al., Reference Peng, Chen and Tan2024) in R software (v.4.2.1). The directed mode with 999 permutations was applied to identify functions associated with differences in Quinella abundance. During enrichments, group comparisons were based on the Wilcoxon rank-sum test, with P-values adjusted using the Benjamini and Hochberg method.
Analysis of rumen fermentation parameters and metabolome
The molar concentrations of individual VFA in rumen samples were analysed using a 7890B gas chromatograph (Agilent Technologies, CA, USA) equipped with a fused-silica capillary column (30 m in length; 0.25 mm internal diameter; 0.25 mm film thickness; Supelco, PA, USA) (Jin et al., Reference Jin, Li and Cheng2018). Ruminal methane production was predicted from the molar proportions of individual VFA using the stoichiometric model of Moss et al. (Reference Moss, Jouany and Newbold2000) according to the following equation:
CH4 (mol/mol of fermented hexose) = 0.45 × C2 – 0.275 × C3 + 0.40 × C4
where C2, C3 and C4 represent the molar percentages of acetate, propionate and butyrate, respectively. The predicted values estimate the theoretical metabolic hydrogen flux directed toward methanogenesis. For metabolomic analysis, ruminal metabolites were extracted using an extraction solution (MeOH: ACN, v/v = 1:1) containing deuterated internal standards. The mixture was fully mixed using ultrasonic treatment for 10 min, and incubated at −40°C for 1 h to precipitate proteins. The supernatant was obtained by centrifugation at 13,800 × g for 15 min at 4°C and transferred to a clean glass vial for later analysis. A quality control (QC) sample was also prepared by pooling equal aliquots of supernatant from all samples to monitor analytical variability.
Untargeted metabolomic profiling of ruminal metabolites was performed using liquid chromatography-tandem mass spectrometry by Shanghai Biotree Biomedical Technology Co., Ltd. (Shanghai, China). Analysis was conducted on a UHPLC system (Vanquish, Thermo Fisher Scientific) coupled to an Orbitrap Exploris 120 mass spectrometer (Orbitrap MS, Thermo), following the method described by Ren et al. (Reference Ren, Li and Yan2021). Raw metabolomic data were pre-processed using an in-house program developed by Biotree, and metabolites were identified against the BiotreeDB database (v3.0) (Zhou et al., Reference Zhou, Luo and Zhang2022). After pre-processing, peak intensities for each metabolite were normalised using internal standards. Metabolites with a relative standard deviation greater than 30% in quality control samples were excluded from further analyses. Missing values were imputed using the k-nearest neighbour algorithm. Both principal component analysis (PCA) and orthogonal partial least squares discriminant analysis (OPLS-DA) of ruminal metabolites were conducted in SIMCA (v.14) after Pareto scaling. Differential metabolites between groups were identified based on a variable importance in projection (VIP) score > 1 for the OPLS-DA model and a P-value < 0.05 from Student’s t-tests. Potential biomarkers associated with Quinella abundance were further evaluated using MetaboAnalyst (v.6.0) (Pang et al., Reference Pang, Lu and Zhou2024), retaining features with an area under the curve (AUC) > 0.80 and p-values < 0.05.
Statistical analysis
All statistical analyses were performed using R software (v.4.2.1). Ruminal parameters and animal growth performances were compared between groups using Student’s t-test. For indices derived from amplicon sequencing (i.e., predicted functions) and metagenome (i.e., KEGG modules and reactions), comparisons between the low- and high- Quinella groups were conducted using the Wilcoxon rank-sum test, with P-values adjusted via the Benjamini–Hochberg method. Spearman rank correlation analysis was performed to identify the relationships among microbial genera and also between microbial genera and differential metabolites, with P-values < 0.05 considered statistically significant (n = 40). Co-abundance patterns among predicted pathways at KEGG level 3 were analysed using the SparCC method (Weiss et al., Reference Weiss, Van Treuren and Lozupone2016). To reduce undirected relationships, the edge weight of each co-abundance was determined using the iDIRECT module (Xiao et al., Reference Xiao, Zhou and Kempher2022). Robust associations among endogenous metabolic pathways (Xue et al., Reference Xue, Sun and Wu2020) were retained based on a false discovery rate (FDR) < 0.01 and an absolute edge weight > 0.6. All resulting networks were visualised using Gephi software (v.0.10.1).
Results
A novel genomic database of ruminal Quinella MAGs
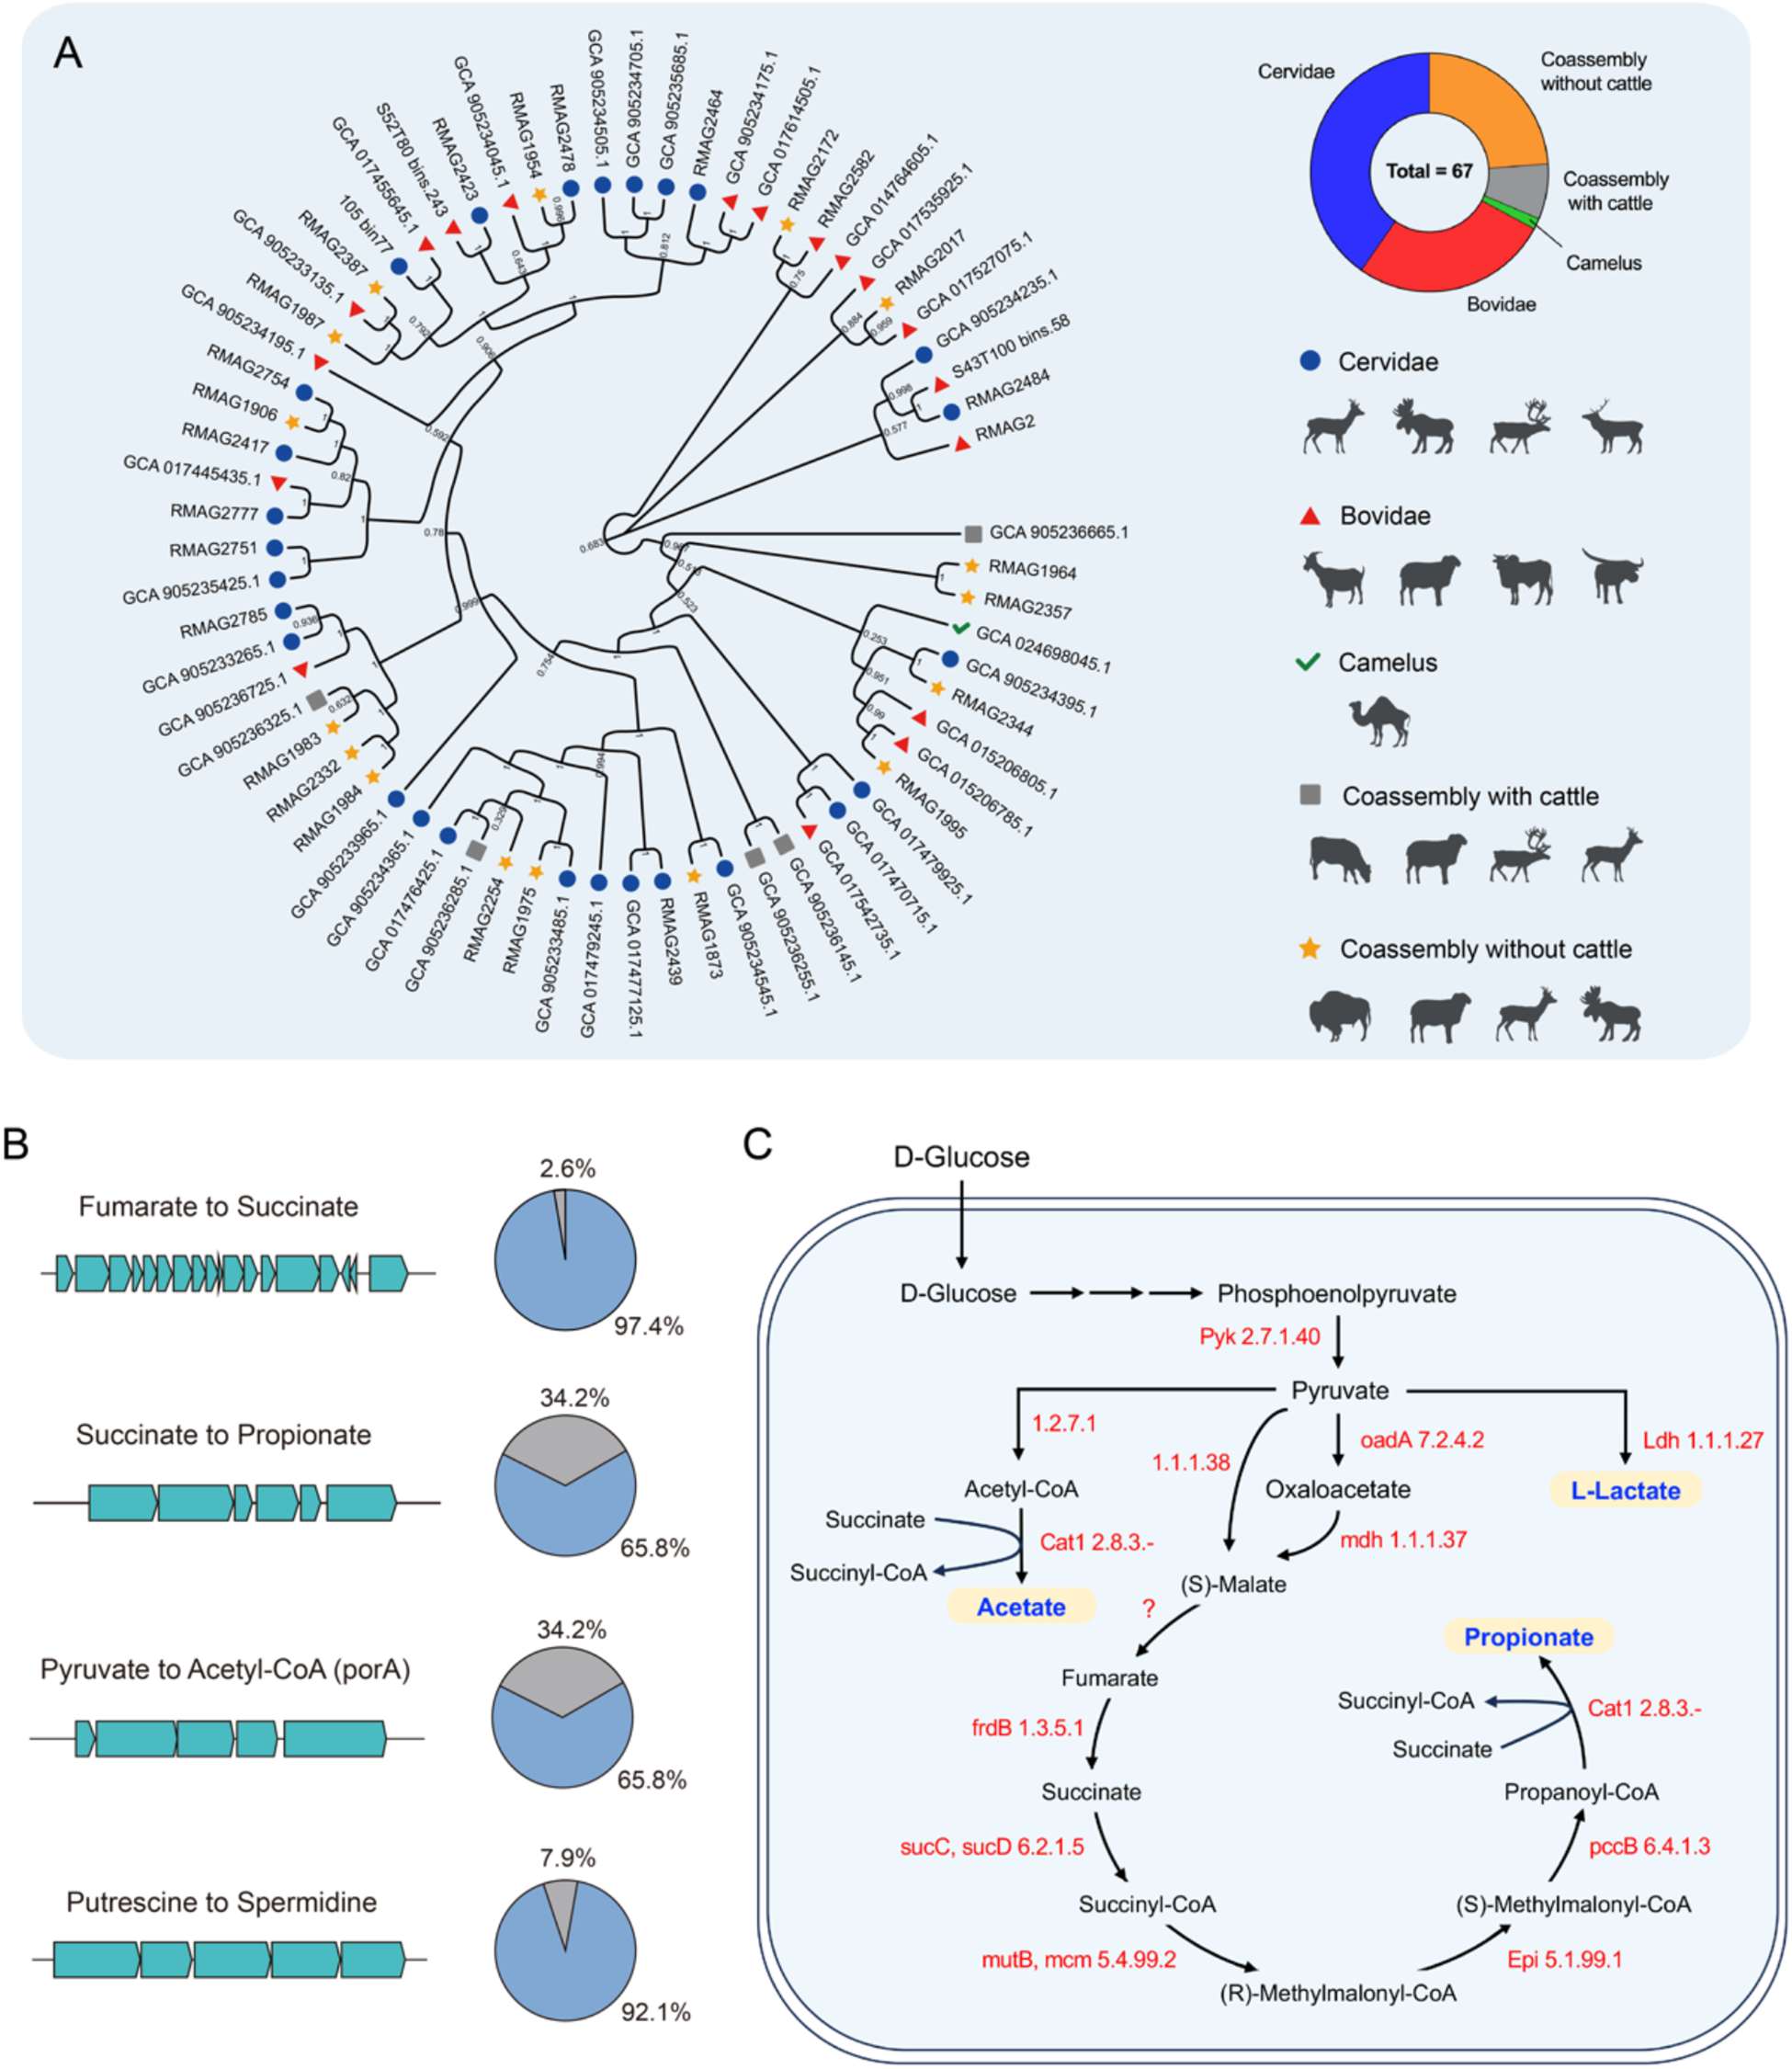
A novel genomic database was constructed, comprising 67 medium- to high-quality, non-redundant MAGs representing unculturable species of Quinella from 12 ruminant species. All genomes exceeded 80% completeness with contamination below 10% (Supplementary Table S3). Notably, over 90% of these MAGs in our database were previously classified as unculturable Selenomonadaceae bacterium due to the high similarity (>92.4%) of their 16S rRNA gene sequences as reported by Kumar et al. (Reference Kumar, Altermann and Leahy2022). Using updated reference databases and improved bioinformatic tools, our analysis indicated that these MAGs showed closest genomic affiliation to be with the genus Quinella. We thus provisionally assign them as putative Quinella in this study. Phylogenetic analysis showed that Quinella genomes clustered independently of host ruminant species (Fig. 1A). About 40.3% and 26.9% of the MAGs were collected from the families Cervidae and Bovidae, respectively. However, none were obtained directly from cattle (Bos taurus). Functional annotation revealed a genetic potential of Quinella for carbohydrate metabolism. Most Quinella MAGs (>80%) encoded enzymes involved in starch degradation (i.e., GH13_e122), sucrose hydrolysis (i.e., GH13_e89) and fructan breakdown (GH32_e23; Supplementary Table S4). Genomic analysis further identified widespread gene clusters potentially responsible for key conversions, including fumarate to succinate (97.4% of MAGs), succinate to propionate (65.8%), pyruvate to acetyl-CoA (65.8%) and putrescine to spermidine (92.1%; Fig. 1B). The Quinella genomes also contained the genetic capacity for the glycolytic conversion of D-glucose to phosphoenolpyruvate and subsequently to pyruvate via pyruvate kinase (EC 2.7.1.40; Fig. 1C). Subsequently, the genomes encode enzymes enabling the conversion of pyruvate to L-lactate via L-lactate dehydrogenase (EC 1.1.1.27), alternatively to malate through oxaloacetate decarboxylase (EC 7.2.4.2) and malate dehydrogenase (EC 1.1.1.37), or to acetate via pyruvate: ferredoxin oxidoreductase (EC 1.2.7.1) and succinyl-CoA: coenzyme A transferase (EC 2.8.3.-). Genomic evidence of ruminal Quinella also supports the potential for propionate production from fumarate. In contrast, the absence of identifiable fumarate hydratase genes suggests Quinella may lack the capacity to produce propionate from malate.
Cladogram of ruminal Quinella in different ruminant species and their carbohydrate metabolism based on genome analysis. (A) Cladogram of ruminal Quinella derived from metagenome-assembled genomes, (B) major gene clusters present in Quinella genomes and (C) proposed intracellular glucose metabolism of ruminal Quinella derived from functional annotation using Prokka. EC names: 2.7.1.40 (Pyk), pyruvate kinase; 1.2.7.1, pyruvate:ferredoxin oxidoreductase; 1.1.1.38, NAD-dependent malic enzyme; 7.2.4.2 (oadA), oxaloacetate decarboxylase; 1.1.1.27 (Ldh), L-lactate dehydrogenase; 2.8.3.- (Cat1), succinyl-coA:coenzyme A transferase; 1.1.1.37 (mdh), malate dehydrogenase; 1.3.5.1 (frdB), fumarate reductase; 6.2.1.5 (sucC, sucD), succinate–coA ligase [ADP-forming]; 6.4.1.3 (pccB), propionyl-coA carboxylase; 5.4.99.2 (mutB, mcm), methylmalonyl-coA mutase; 5.1.99.1 (Epi), ethylmalonyl-coA/methylmalonyl-coA epimerase.

Distribution and predicted metabolic potentials of Quinella
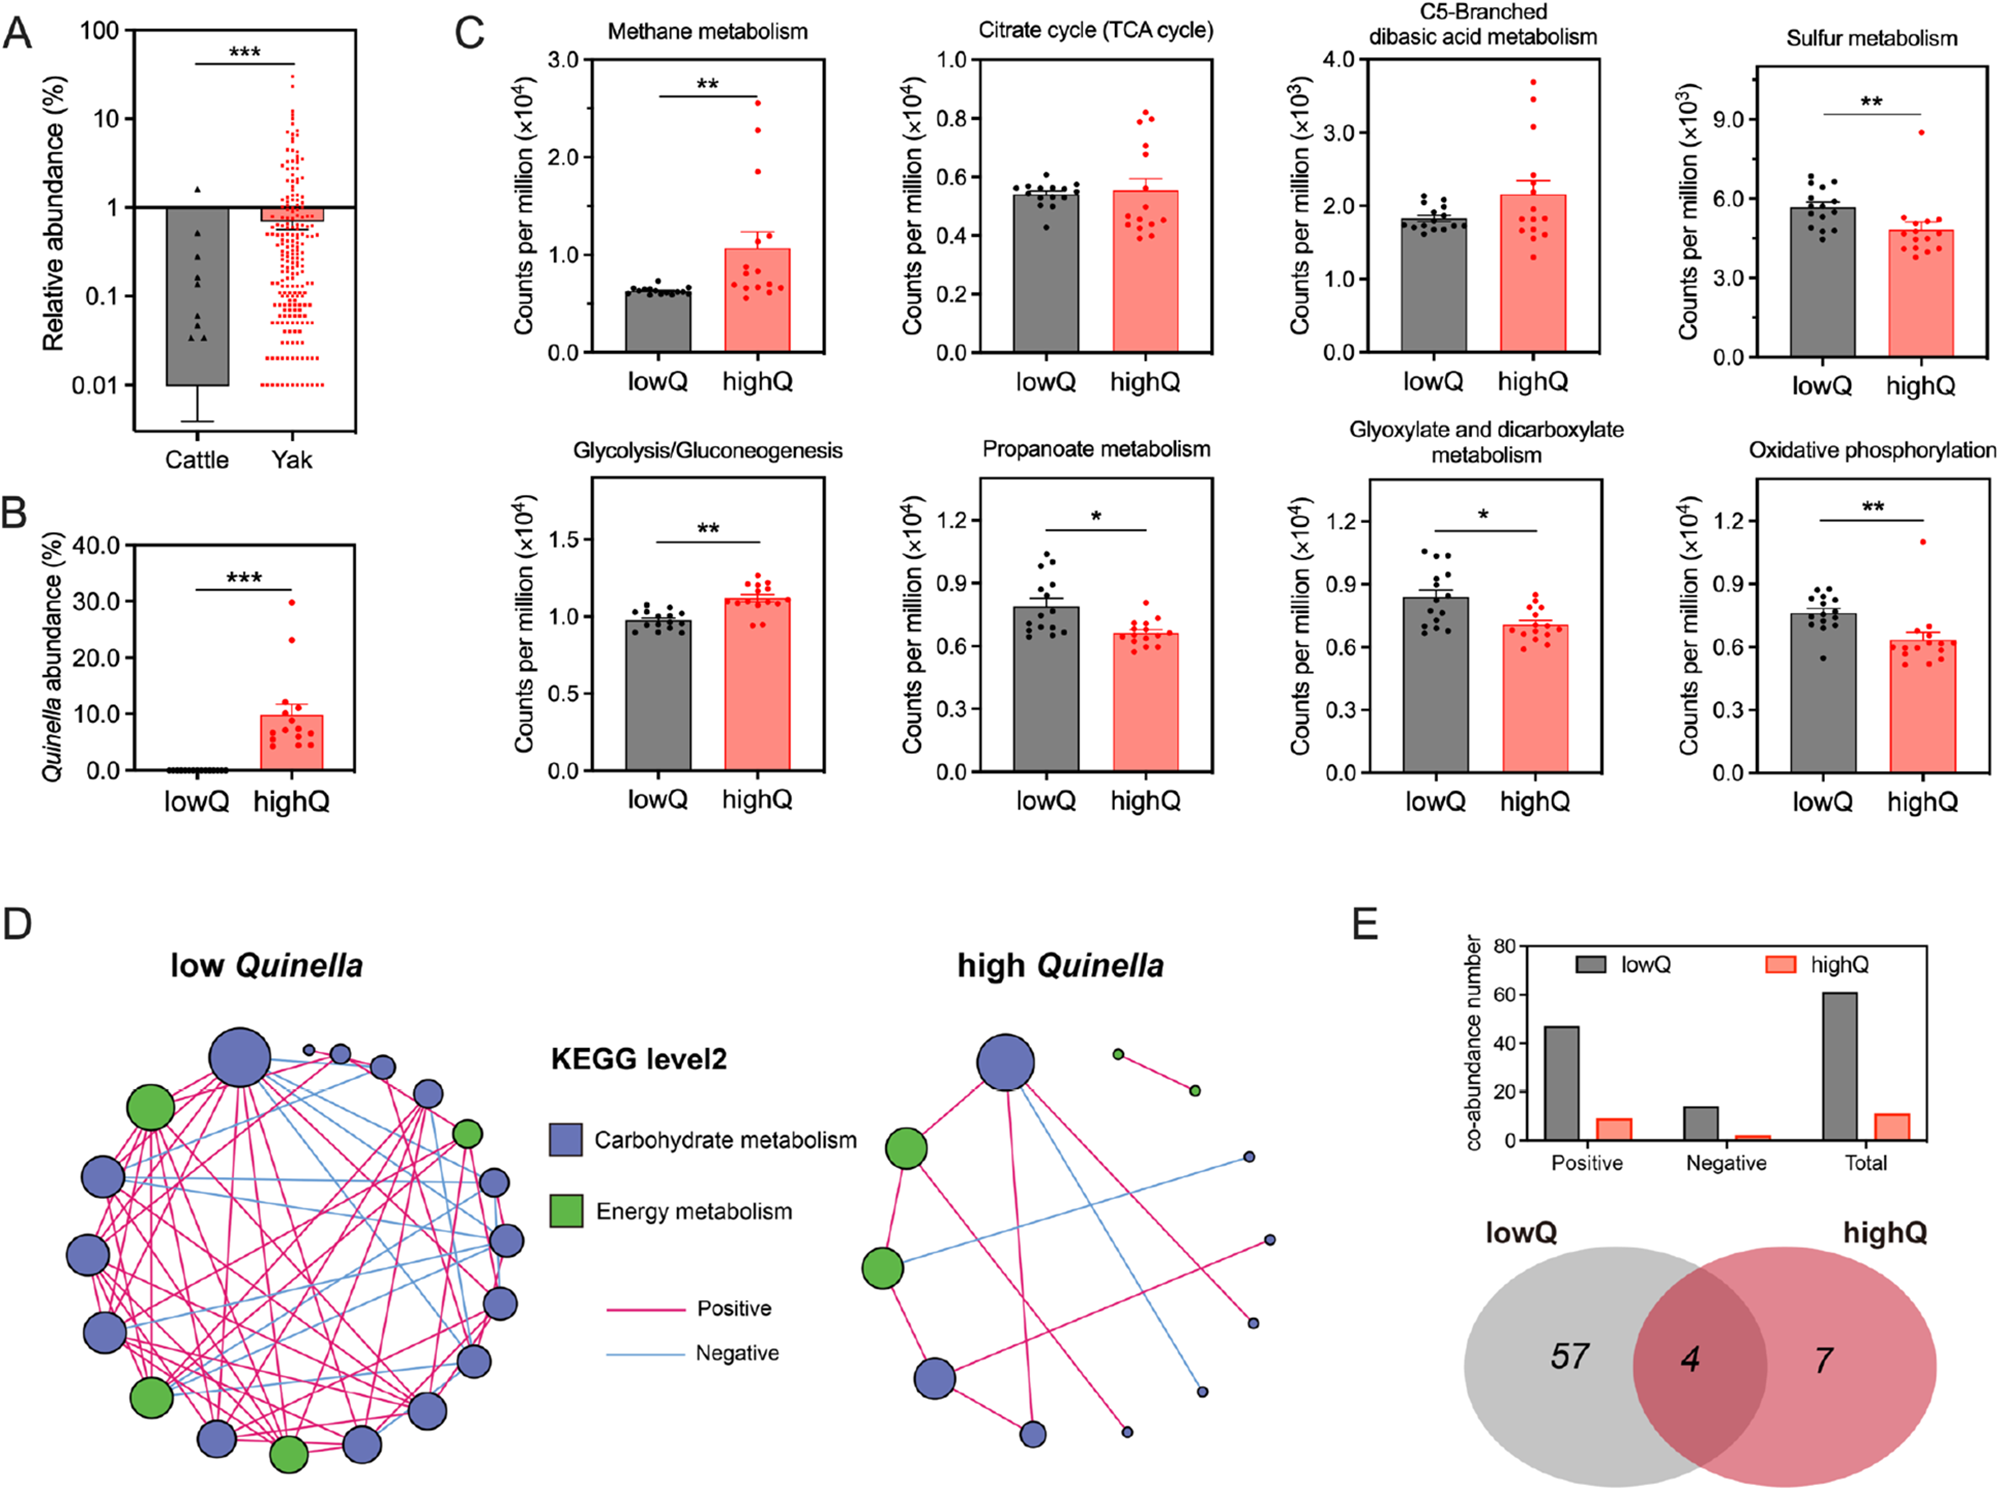
The relative abundance of ruminal Quinella was influenced by both ruminant species and host variations within the same breed (Fig. 2A). Yaks exhibited a notably higher occurrence of Quinella (56.3%, n = 359) compared with cattle (3.01%, n = 299). The average abundance of ruminal Quinella was also significantly greater in yaks than in cattle (P < 0.001, Fig. 2A). Based on this difference, yak rumen samples representing low- or high-Quinella abundance were selected (between-group P < 0.001, Fig. 2B) to investigate the metabolic associations of this genus. Analysis of Tax4Fun2 revealed that a higher ruminal abundance of Quinella was associated with increased predicted abundances of “methane metabolism,” and “glycolysis/gluconeogenesis,” but with decreased abundances of “propanoate metabolism,” “glyoxylate and dicarboxylate metabolism,” “sulphur metabolism” and “oxidative phosphorylation” (FDR < 0.05; Fig. 2C). Moreover, a high abundance of Quinella corrected with fewer interactions among bacterial genera within the yak rumen, comprising 47.6 positive and 26.9% negative significant correlations (Supplementary Fig.S1). Consistently, the overall connectivity of the rumen microbial metabolic network was lower in the high-Quinella group, with significant co-abundance correlations among endogenous metabolic pathways declining from 1606 to 316 (FDR < 0.01, edge weight > 0.6). In particular, correlations involving carbohydrate metabolism and energy metabolism pathways decreased from 61 to 11 co-abundances in yaks with higher Quinella abundance (Fig. 2D and 2E).
Distribution of ruminal Quinella and their roles in predicted energy metabolism of the rumen microbial community in yaks. (A) Distribution and relative abundance of ruminal Quinella in yaks and cattle. (B) Comparison of Quinella abundance among selected samples. (C) Major differential pathways in carbohydrate metabolism and energy metabolism between samples with high or low Quinella based on Tax4Fun2 analysis. (D, E) Correlation network of pathways involved in carbohydrate and energy metabolism in the yak rumen with high or low Quinella. LowQ or highQ, low or high abundances of ruminal Quinella.

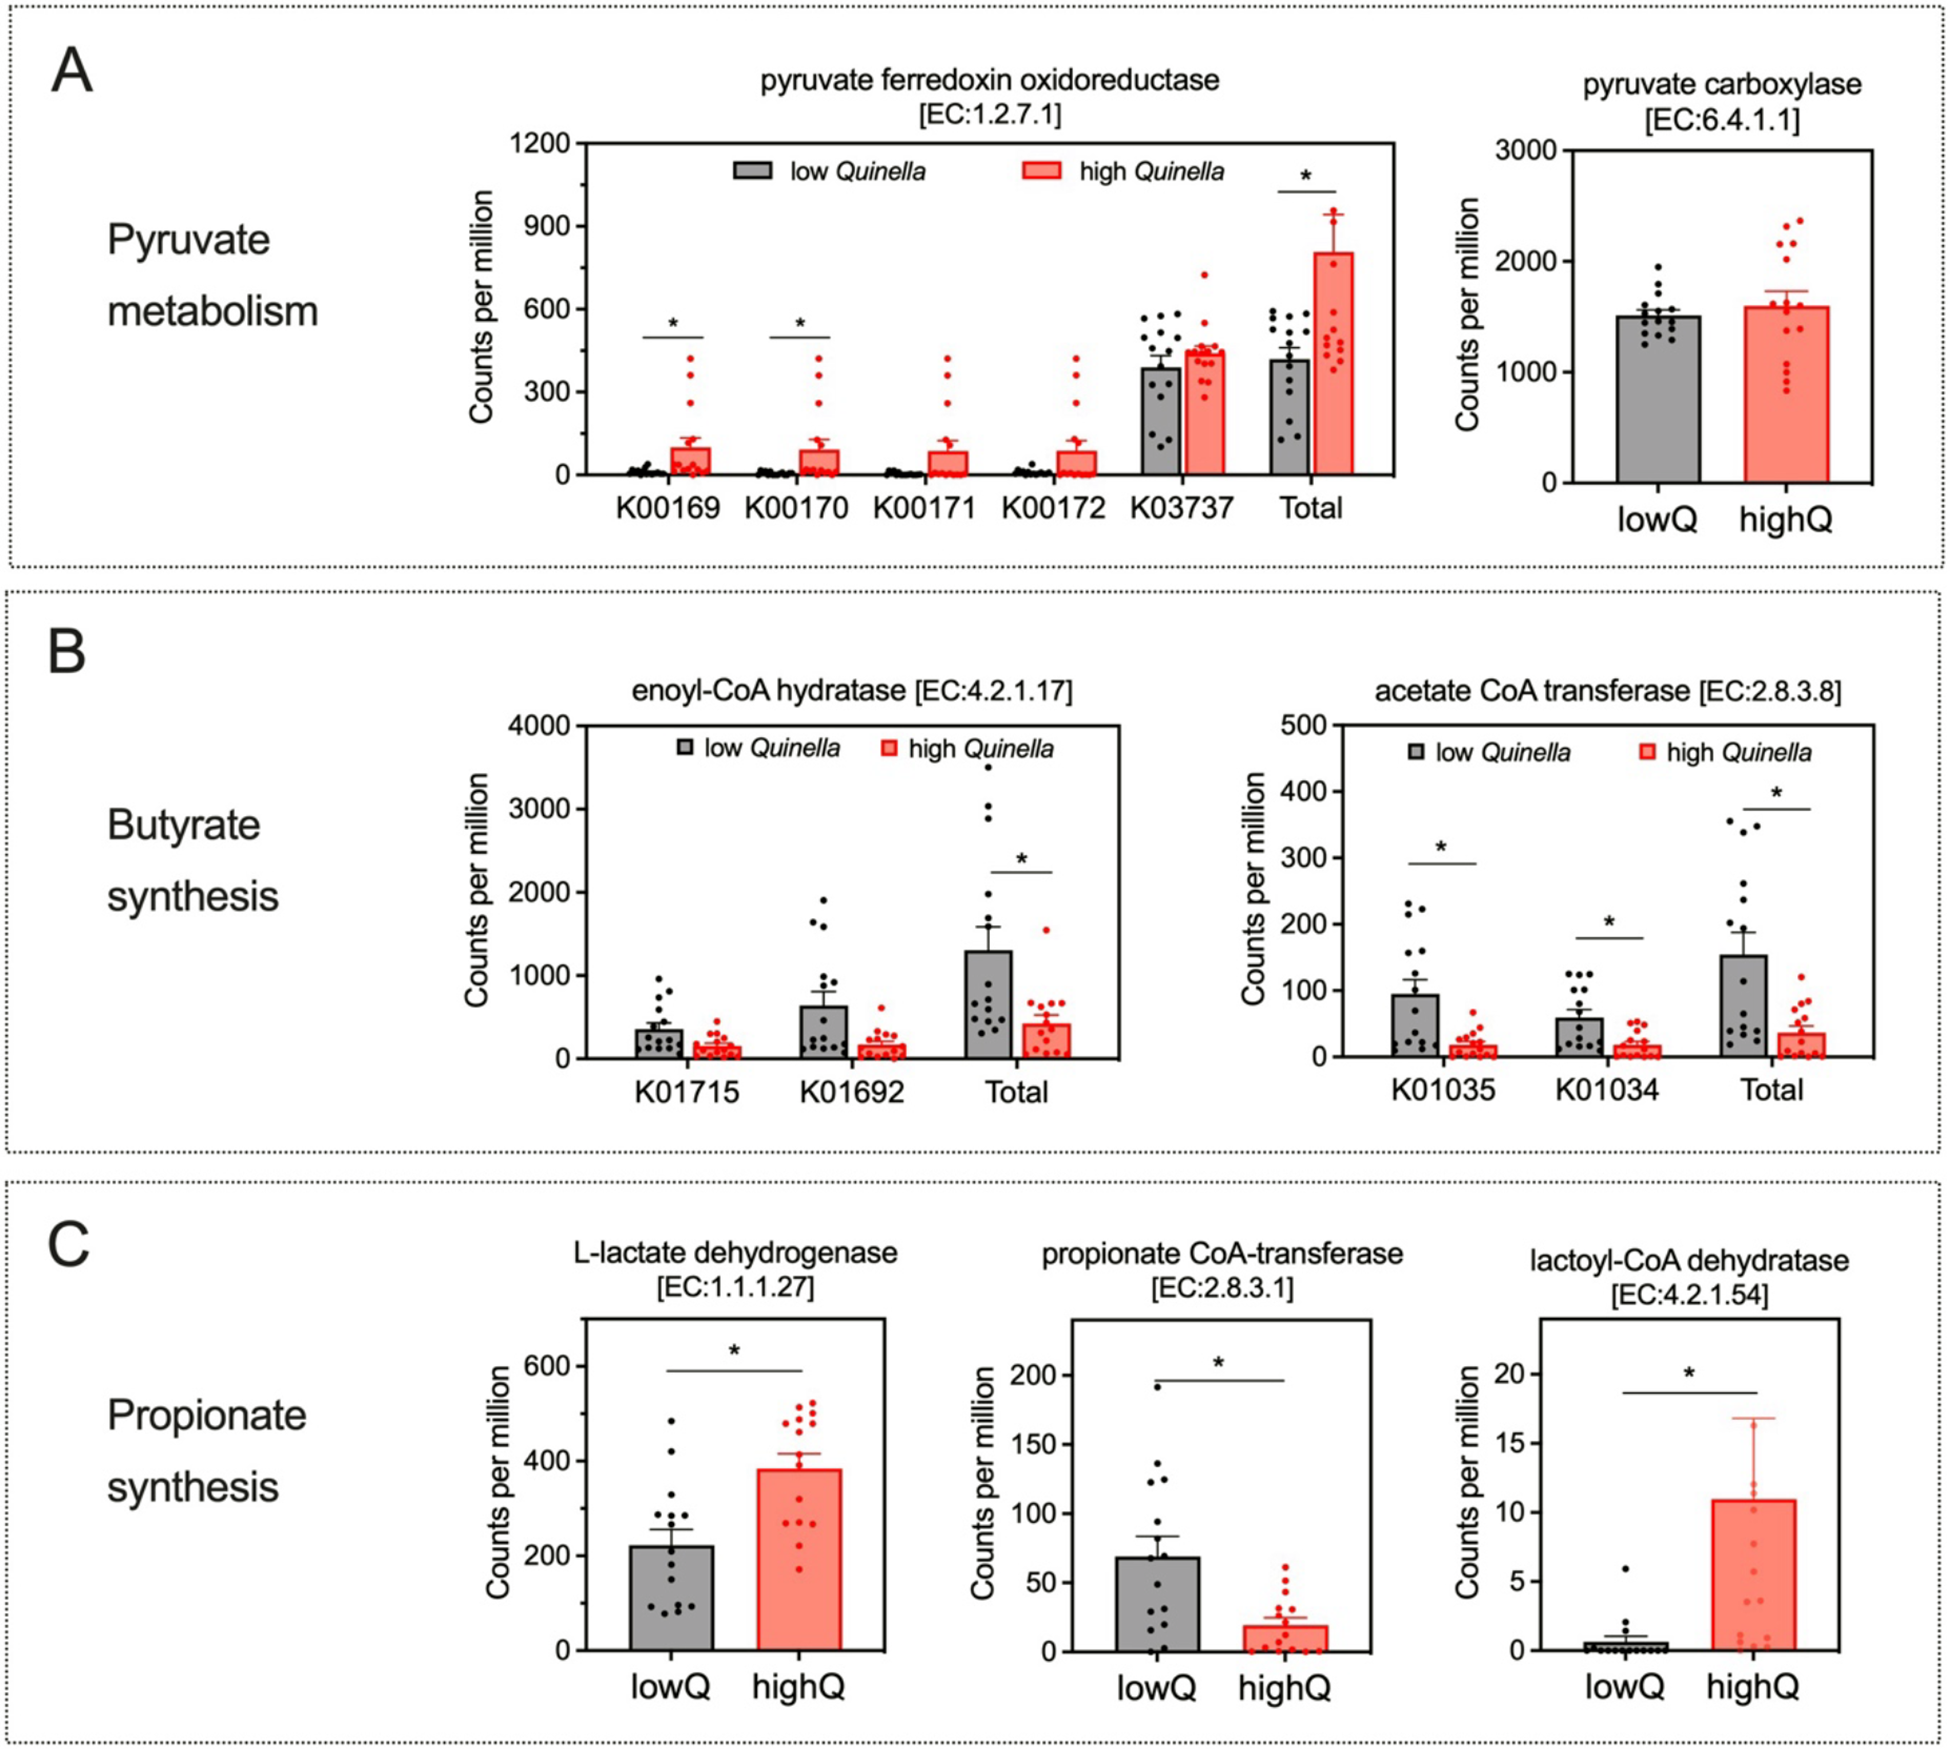
The abundance of ruminal Quinella in yaks was associated with changes in the genetic potential for VFA synthesis (Fig. 3). Specifically, yaks with higher ruminal Quinella abundance showed significantly greater relative abundances of genes encoding total pyruvate:ferredoxin oxidoreductase (EC 1.2.7.1), particularly K00169 and K00170 (FDR < 0.05), but had no effects on genes for pyruvate carboxylase (EC 6.4.1.1). In butyrate synthesis, higher Quinella abundance was associated with significantly lower abundances of genes encoding enoyl-CoA hydratase (EC 4.2.1.17) and acetate CoA transferase (EC 2.8.3.8, particularly K01035 and K01034) (FDR < 0.05). Changes in enzyme genes related to propionate synthesis showed much variation. Yaks with higher Quinella abundance showed greater abundances of genes encoding L-lactate dehydrogenase (EC 1.1.1.27) and lactoyl-CoA dehydratase (EC 4.2.1.54), but a lower abundance of propionate CoA-transferase (EC 2.8.3.1) (FDR < 0.05). Furthermore, the predicted genetic potential of the ruminal bacterial community for the succinate pathway did not differ significantly between the high- and low-Quinella groups (FDR > 0.05).
Major differential KEGG Orthology (KO) that encoded the enzyme related to ruminal volatile fatty acid synthesis between high or low Quinella in the yak rumen. (A) Related to pyruvate metabolism. (B) Related to butyrate synthesis. (C) Related to propionate synthesis. The asterisk represents significance at 0.01 < FDR < 0.05. LowQ or highQ, low or high abundances of ruminal Quinella.

Potential roles of ruminal Quinella in carbon metabolism in vivo
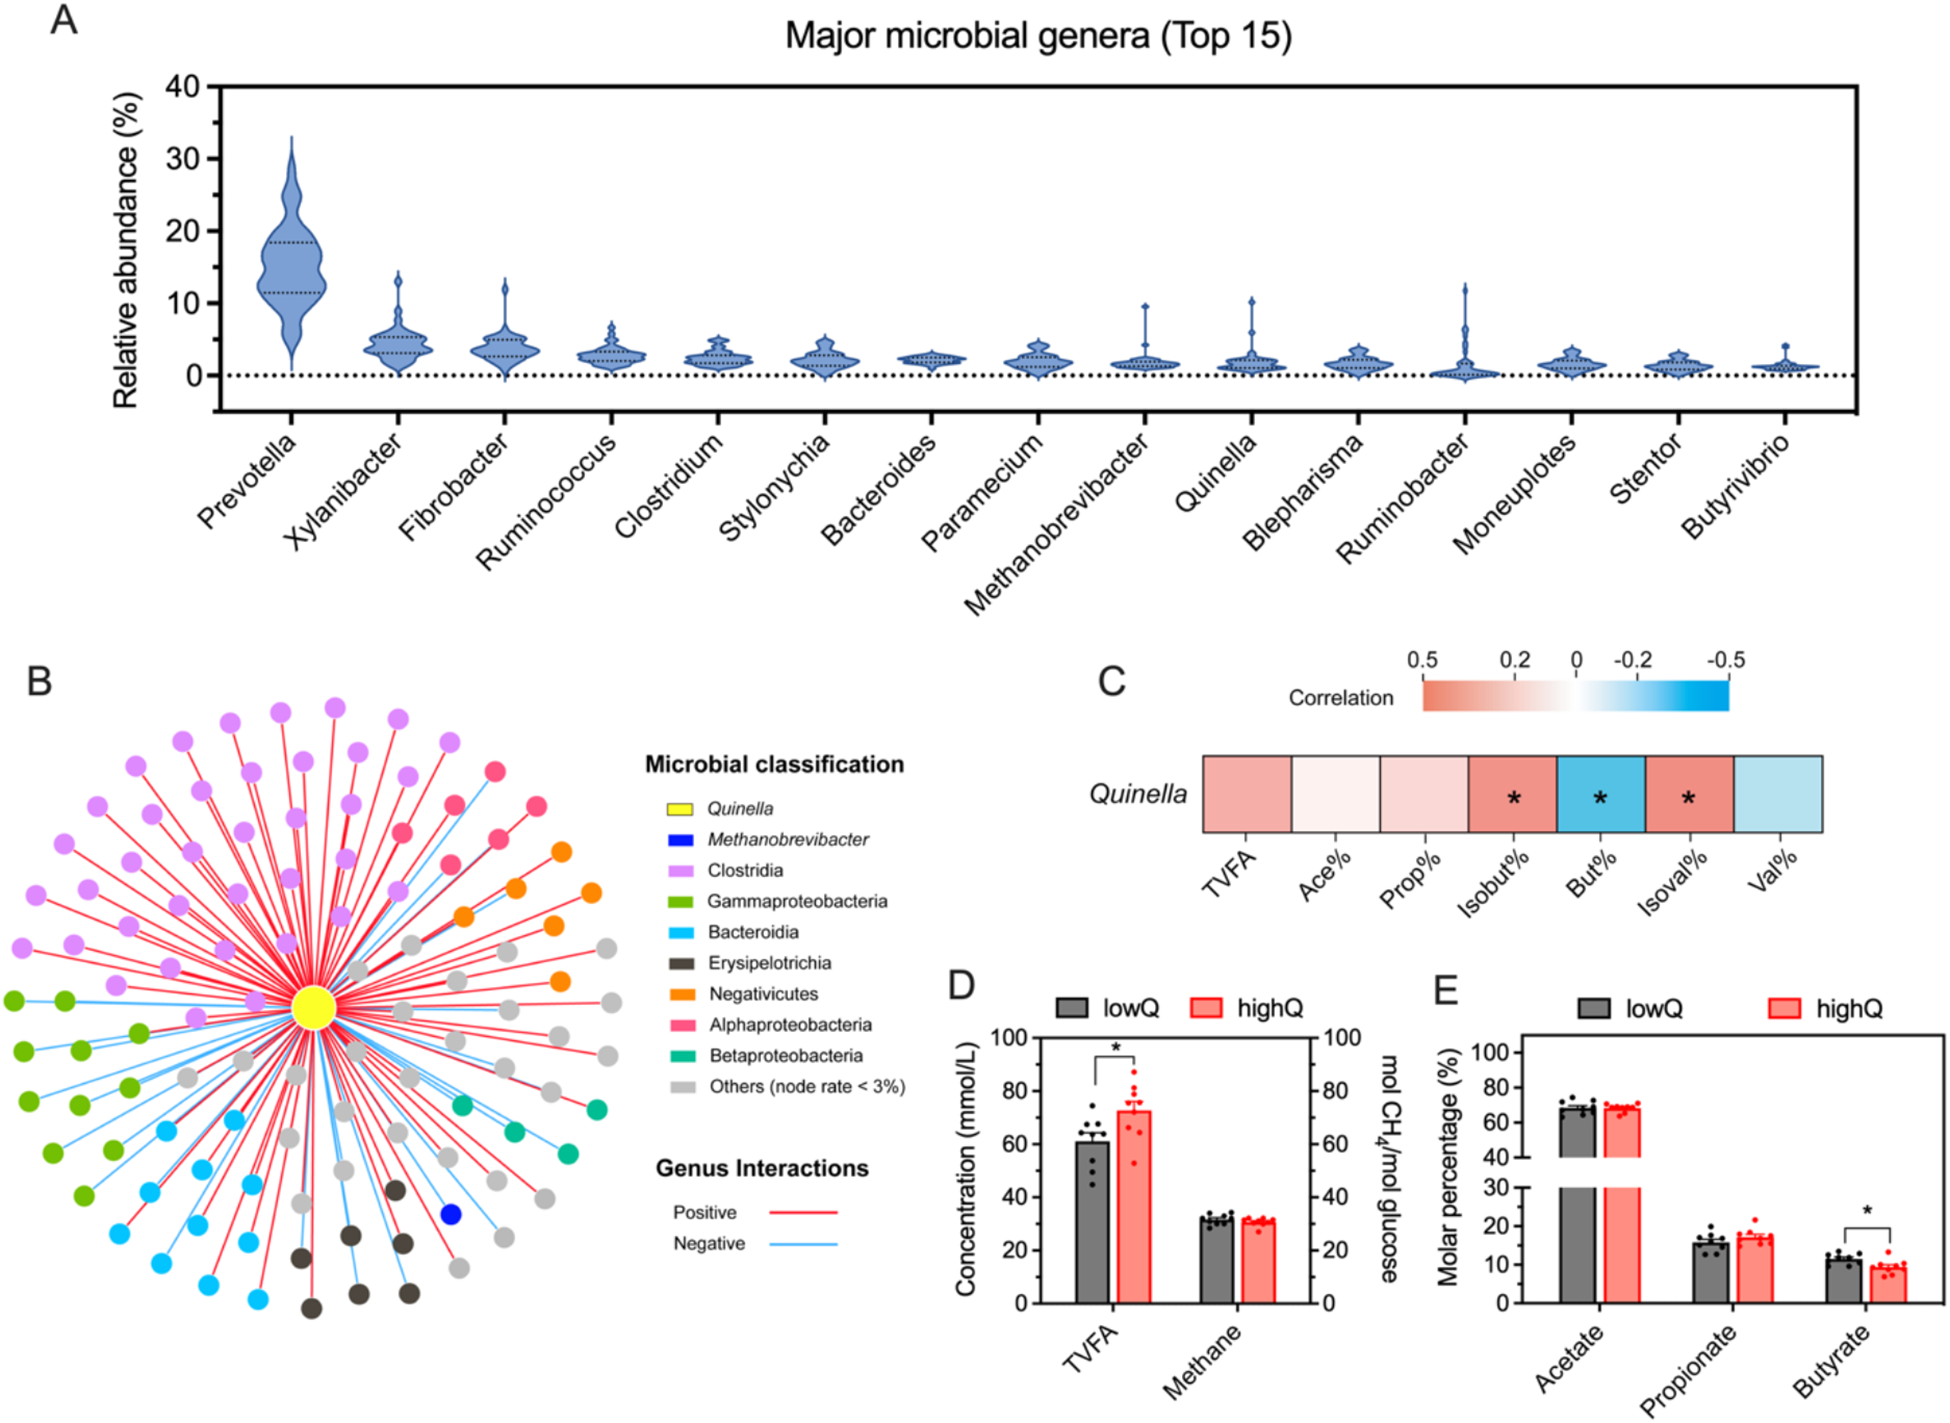
Within the yak rumen, Quinella was the 10th most abundant microbial genus, with an average relative abundance of 1.88% ranging from 0.61% to 10.14% (Fig. 4A). Its relative abundance showed significant correlations with numerous genera from the classes Clostridia (37 genera), Bacteroidia (11 genera) and Gammaproteobacteria (11 genera, Fig. 4B). Notably, a significant negative correlation was observed between Quinella and Methanobrevibacter (n = 40, P = 0.036, R = − 0.333), the predominant hydrogenotrophic methanogen in the rumen. Furthermore, Quinella abundance correlated significantly with the molar percentages of butyrate (P = 0.017, R = − 0.376), isobutyrate (P = 0.037, R = 0.331) and isovalerate (P = 0.031, R = 0.342) (n = 40; Fig. 4C). Yaks with higher ruminal Quinella abundance exhibited an increased total VFA concentration but a decreased molar percentage of butyrate (P < 0.05; Fig. 4D, E). In contrast, predicted methane production and the molar percentages of acetate and propionate did not differ significantly between groups (P > 0.10). Similarly, no significant differences were detected in growth performance indices including feed intake, average daily gain, and feed-to-gain ratio between the two groups (P > 0.10; Table 2).
Correlations between the relative abundances of ruminal Quinella and other prokaryotic microbes or ruminal fermentation parameters in the yak rumen. (A) Relative abundances of the major microbial genera (top 15). (B) Significant correlations between the relative abundances of ruminal Quinella and other prokaryotic microbes by Spearman analysis (P < 0.05). (C) Correlations between the ruminal Quinella and TVFA, and molar percentages of individual VFA. (D) Changes in ruminal VFA and predicted methane production in the yak rumen. (E) Changes in the molar percentage of major VFA. The “asterisk” represents significance at 0.01 < P < 0.05. TVFA, total volatile fatty acids; VFA, volatile fatty acids; lowQ or highQ, low or high abundances of ruminal Quinella.

Growth performance of growing yaks with high or low ruminal Quinella (n = 9)
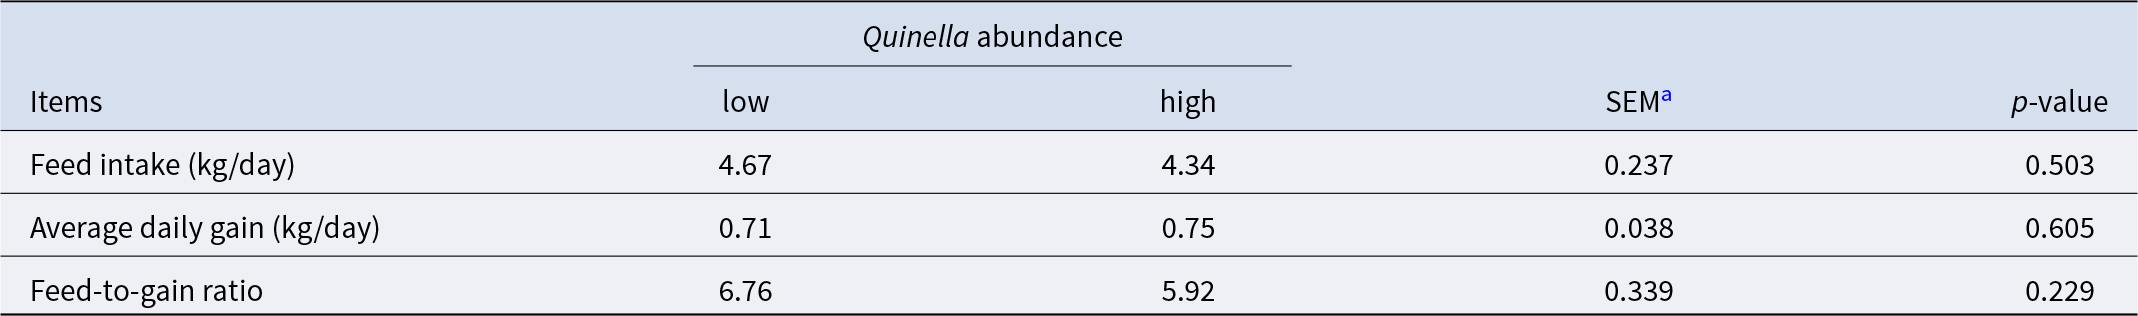
a SEM represents the pooled standard error of the mean of all samples.
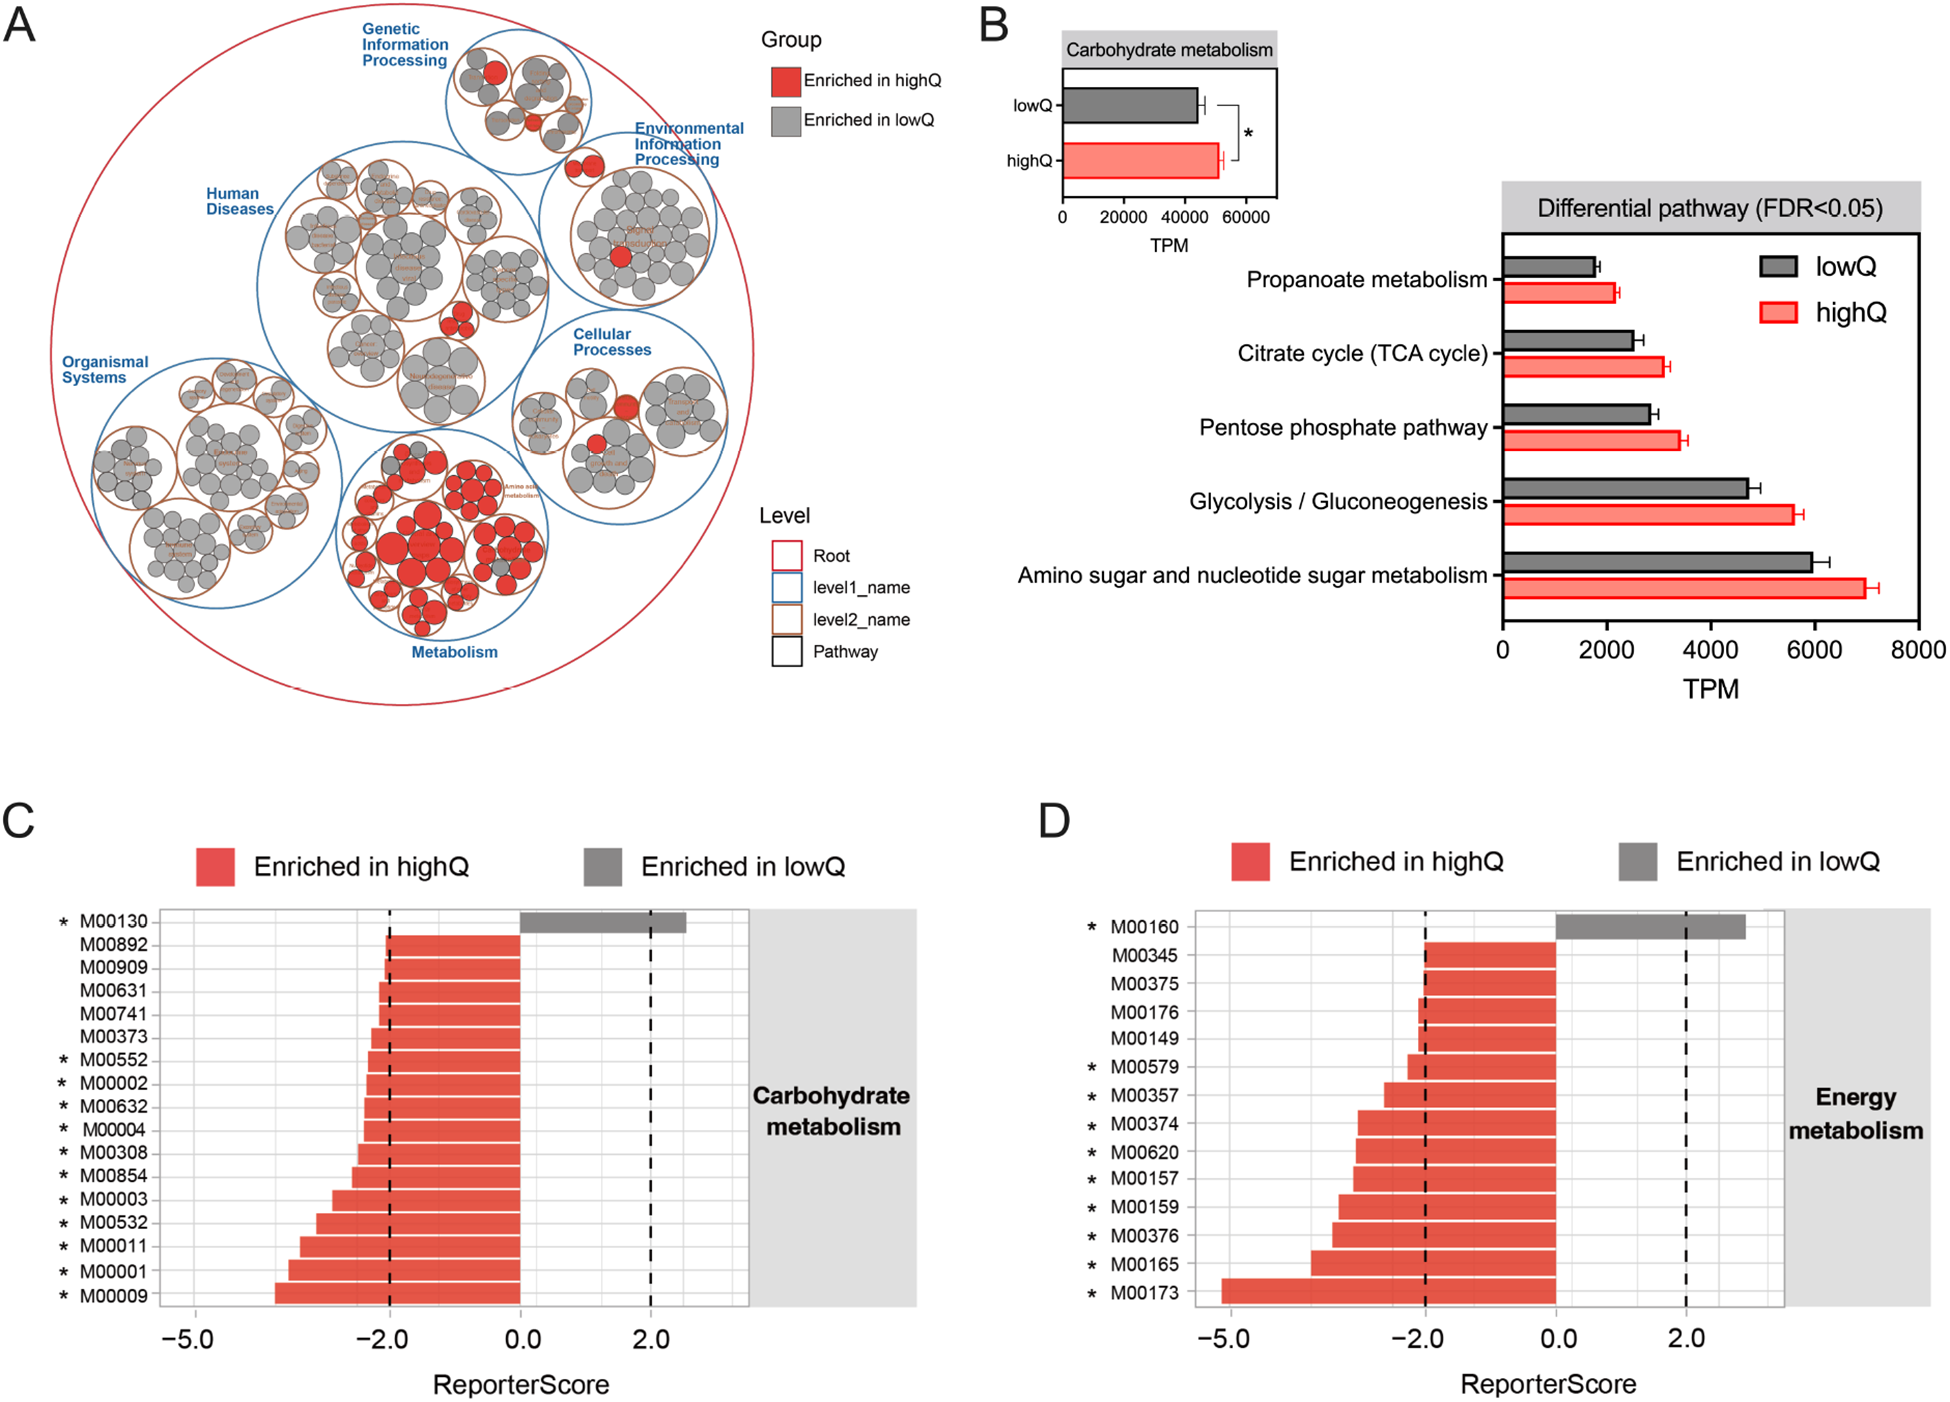
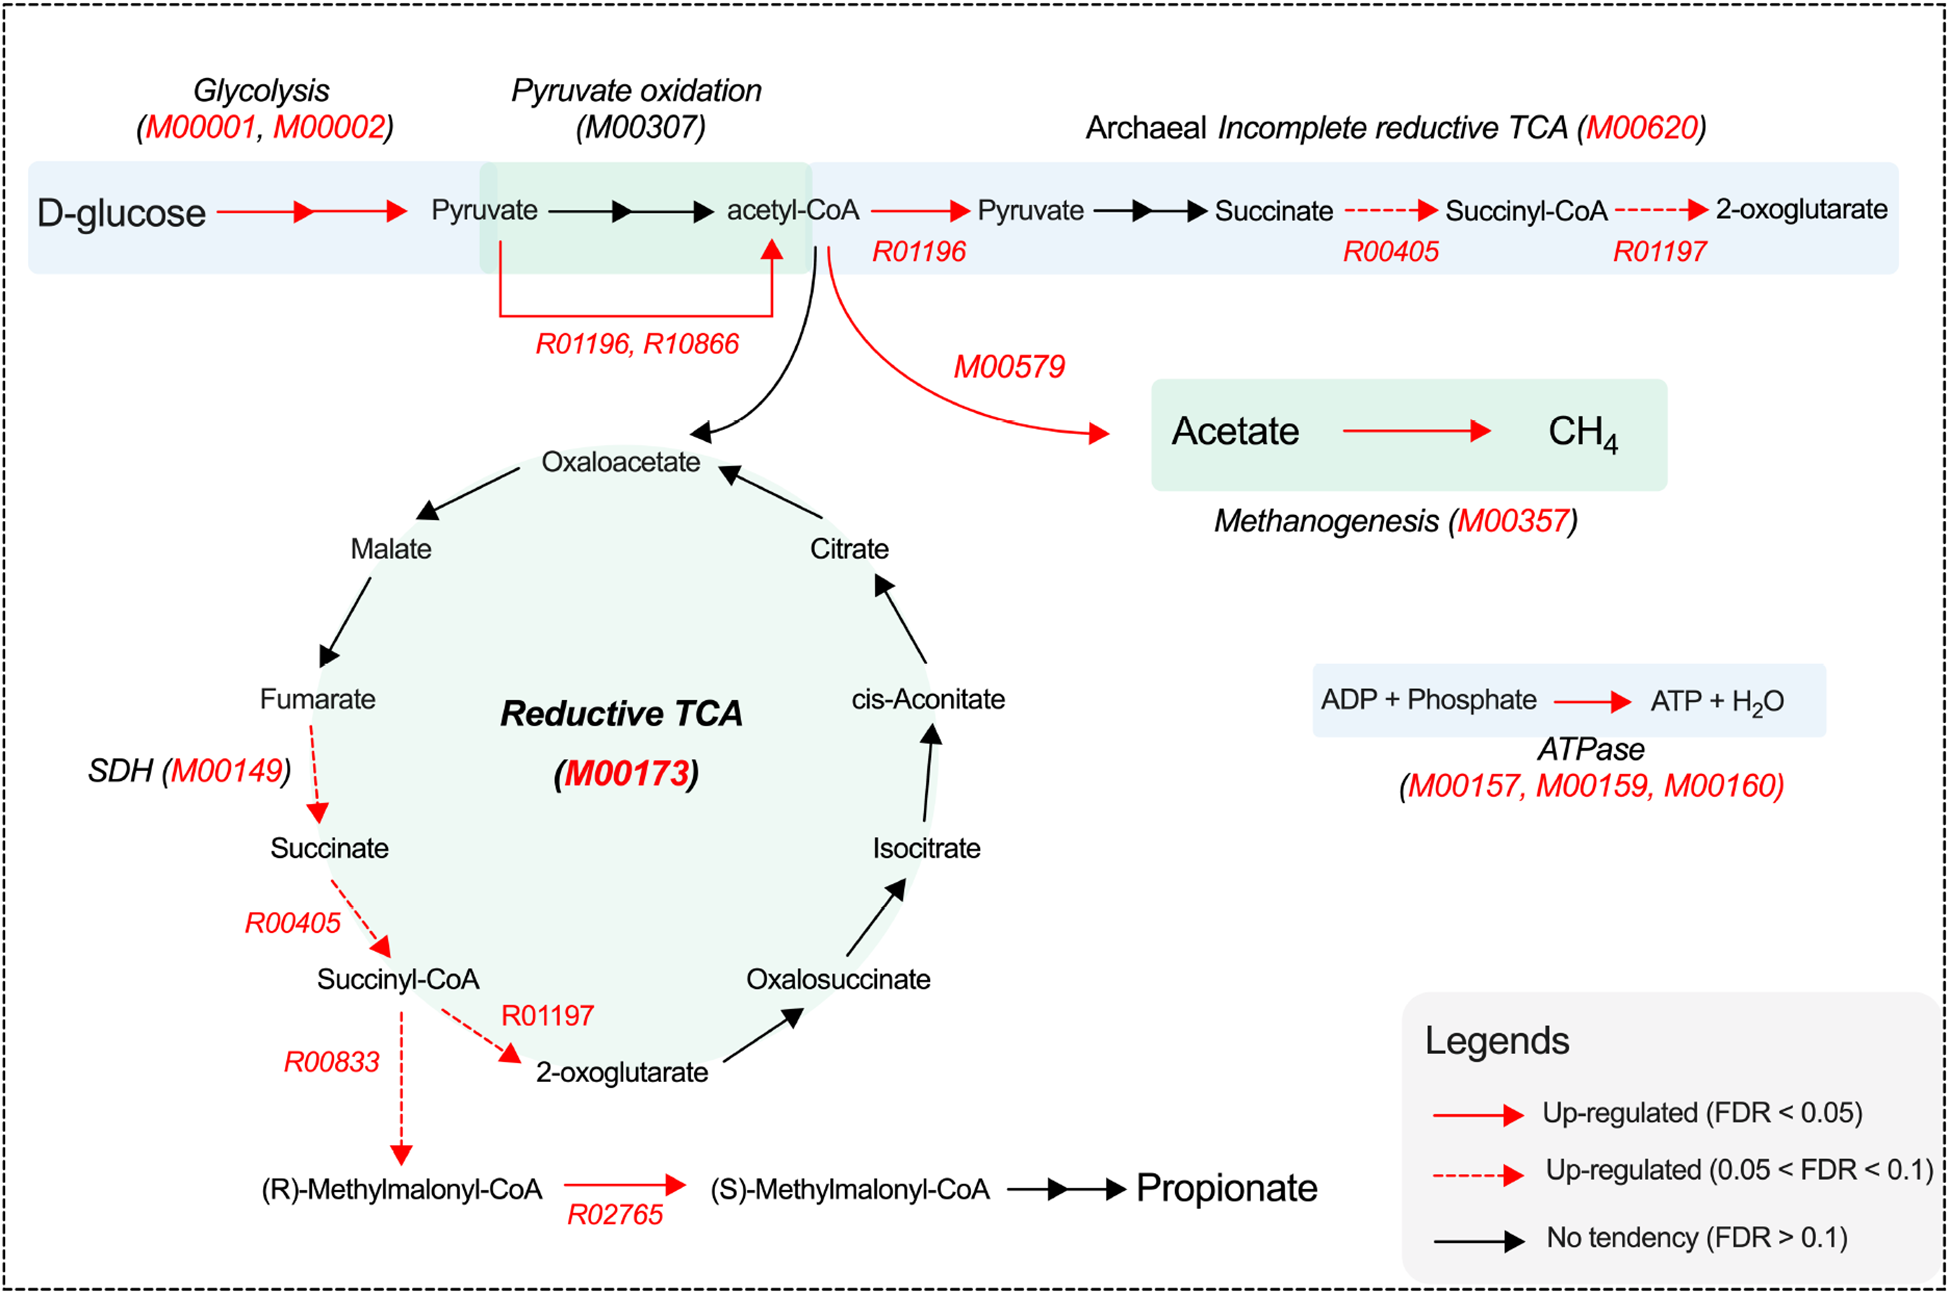
As shown in Figure 5A, pathways classified under “Metabolism” (KEGG level 1) were enriched in yaks with higher ruminal Quinella abundance. These yaks exhibited increased relative abundances of “carbohydrate metabolism” and five specific pathways within this category (FDR < 0.05; Fig. 5B). ReporterScore analysis further identified 11 “carbohydrate metabolism” and nine “energy metabolism” modules that were enriched in the high-Quinella groups (FDR < 0.05; Fig. 5C and 5D). Among these, high Quinella abundance was significantly associated with changes in 10 KEGG reactions (FDR < 0.05) and showed a trend for 21 additional KEGG reactions (0.05 < FDR < 0.10; Supplementary Fig.S2). Overall, yaks with higher Quinella abundances exhibited an enhanced genetic potential for “glycolysis,” as indicated by enriched modules for the conversion of glucose to pyruvate (M00001, M00002), and a greater abundance of genes encoding reactions from pyruvate to acetyl-CoA (R01196, R10866; FDR < 0.05; Fig. 6). These yaks also showed an enriched genetic repertoire for the “reductive TCA” (M00173, FDR = 0.015). This was supported by a higher abundance of genes for succinate dehydrogenase (M00149, FDR = 0.057), and trends toward elevated reactions converting succinate to 2-oxoglutarate (R00405, R01197, 0.05 < FDR < 0.10). Within fumarate reduction pathways, high Quinella abundance was associated with a greater abundance of genes involved in the conversion of succinyl-CoA to (R)-methylmalonyl-CoA (R00833, FDR = 0.078) and subsequently to (S)-methylmalonyl-CoA (R02765, FDR = 0.044). Moreover, these yaks exhibited a higher abundance of the phosphate acetyltransferase-acetate kinase pathway (M00579, FDR = 0.032) for converting acetyl-CoA into acetate. Increased abundances of genes were also observed for ATPase modules, including prokaryotic M00157 and M00159, and eukaryotic M00160 (FDR < 0.05).
Metabolic changes in the yak rumen under high and low levels of Quinella. (A) Pathway enrichments from ReporterScore. (B) Significant changes in carbohydrate metabolism pathways. (C, D) Module alterations in carbohydrate and energy metabolism. FDR, false discovery rates. The “asterisk” represents significance at 0.01 < FDR < 0.05. LowQ or highQ, low or high abundances of ruminal Quinella.

Schematic diagram of pathway changes involved in volatile fatty acid synthesis. Red arrows, modules and reactions represented components that were increased in association with higher ruminal Quinella abundance. TCA, tricarboxylic acid; SDH, succinate dehydrogenase, FDR, false discovery rates.

Metabolite biomarkers for ruminal Quinella in yaks
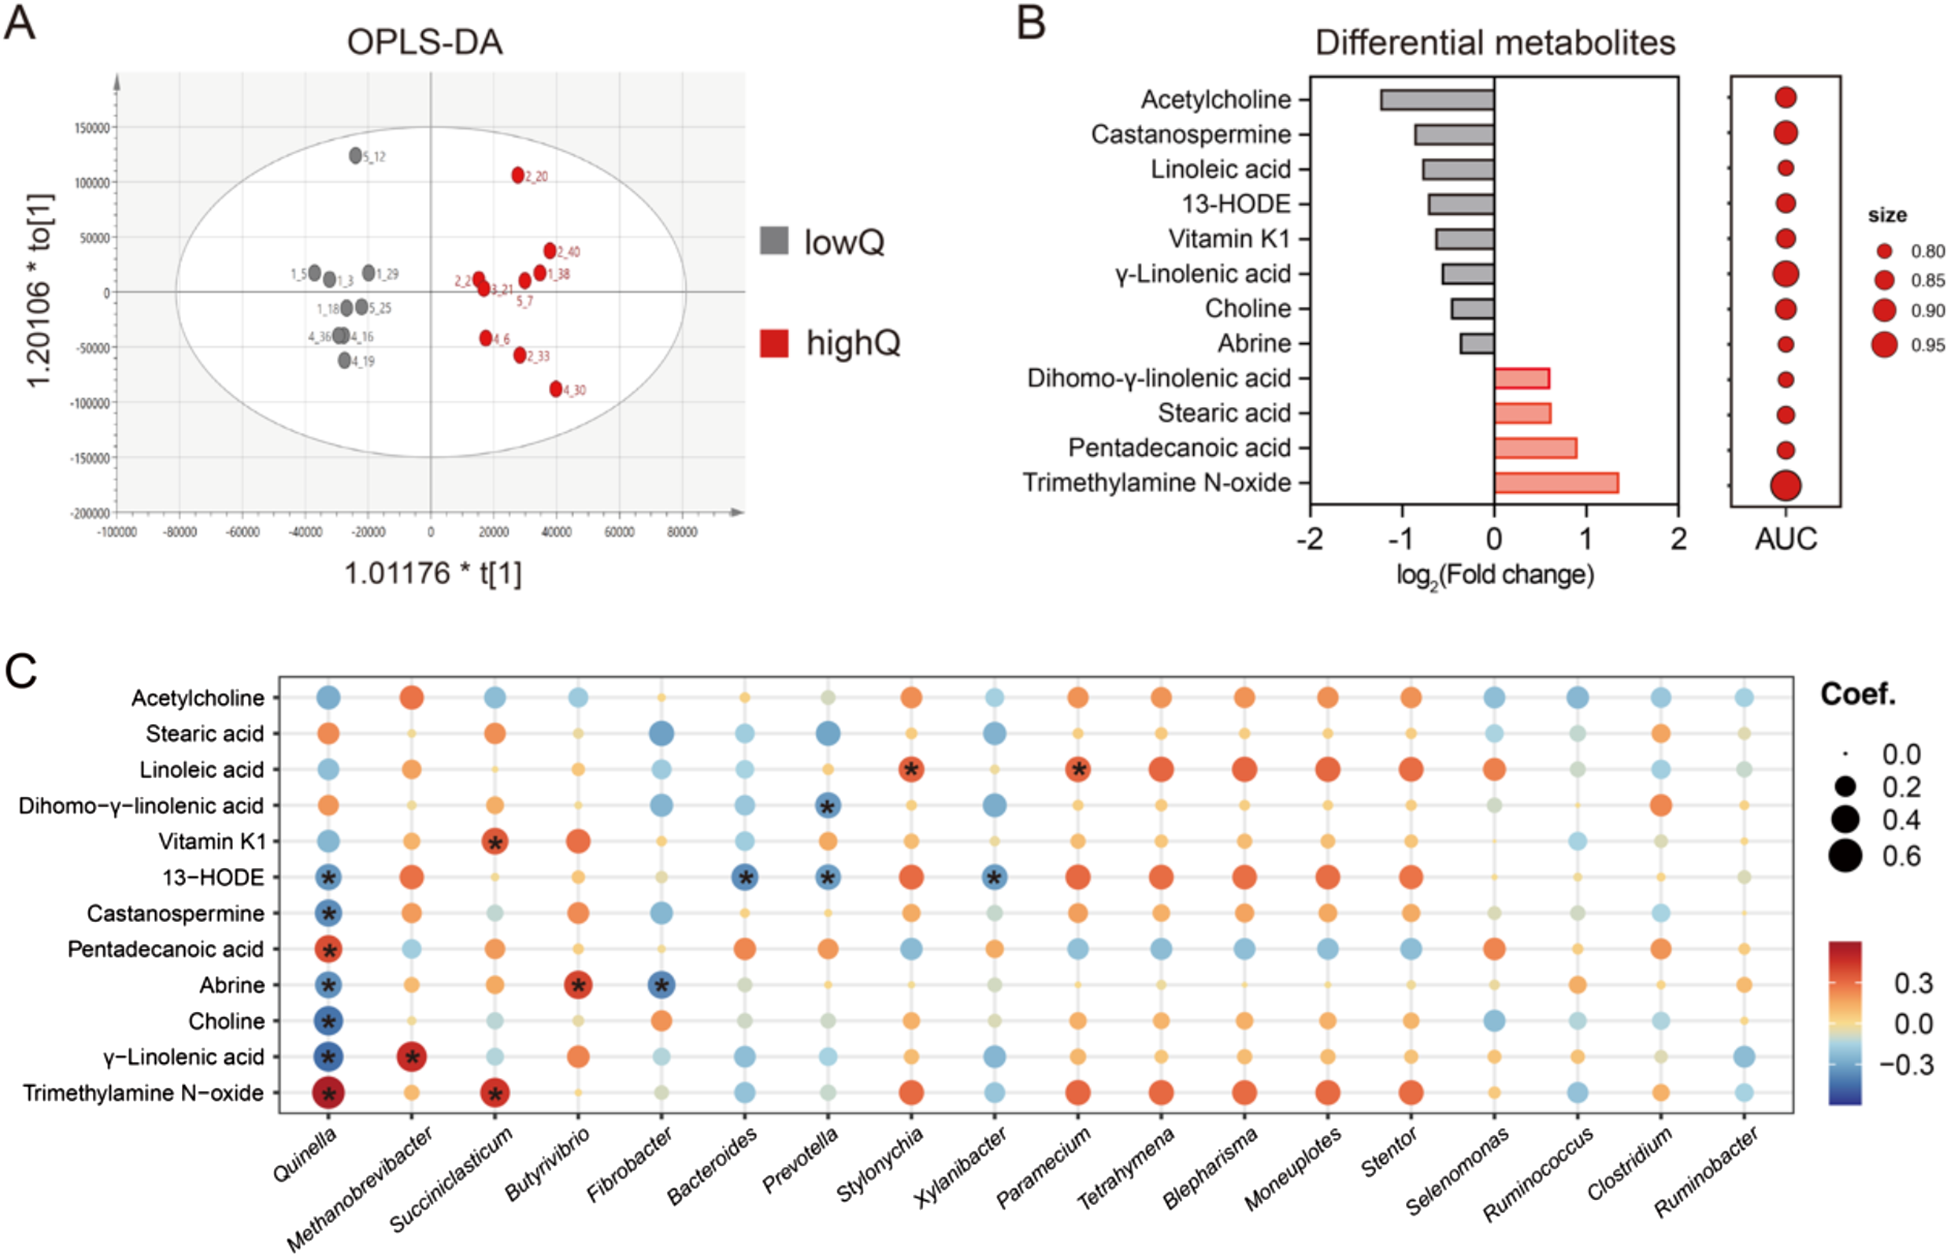
Results from PCA did not clearly separate ruminal metabolites profiles between the low- and high-Quinella groups (Supplementary Fig.S3). In contrast, OPLS-DA achieved a distinct separation (Fig. 7A). Based on VIP score > 1 and P-value < 0.05, 12 metabolites related to microbial activities were identified as significantly altered, four of which were significantly upregulated in the high-Quinella group. When evaluated as potential biomarkers, trimethylamine N-oxide exhibited the highest AUC value for distinguishing the groups, followed by γ-linolenic acid and castanospermine (Fig. 7B; Supplementary Fig.S3). Spearman correlation analysis revealed that only 7 of the 12 differential metabolites correlated significantly with Quinella abundance, including 13-HODE, castanospermine, pentadecanoic acid, abrine, choline, γ-linolenic acid and trimethylamine N-oxide (P < 0.05). Among these, Methanobrevibacter abundance showed a positive correlation with γ-linolenic acid, while Succiniclasticum exhibited a positive correlation with trimethylamine N-oxide (P < 0.05). Notably, three differential metabolites – choline, pentadecanoic acid, and castanospermine – showed significant correlations exclusively with Quinella among the major microbial genera present in the yak rumen (P < 0.05; Fig. 7C).
Metabolite biomarkers and phenotype predictions for ruminal Quinella. (A) Orthogonal partial least squares discriminant analysis (OPLS-DA) of ruminal metabolites, (B) differential ruminal metabolites associated with Quinella abundances and their area under curve (AUC) values as biomarkers, (C) Spearman correlation between the differential metabolites and the relative abundance of rumen genera. The “asterisk” represents significance at 0.01 < FDR < 0.05. LowQ or highQ, low or high abundances of ruminal Quinella.

Discussion
In our study, we first constructed a novel Quinella MAGs database. Our findings showed that Quinella genomes were not clustered by ruminant breeds in the phylogenetic tree, suggesting a shared evolutionary relationship across hosts. Notably, the majority of these genomes were collected from Cervidae ruminants, with none originating directly from cattle. To elucidate this distribution, we compared the ruminal occurrence of Quinella between yaks and cattle. As expected, Quinella was both more prevalent and abundant in yak rumen, whereas its presence in cattle was markedly low. This pattern may be associated with the reported absence of Quinella in low-methane-emitting cattle (Wallace et al., Reference Wallace, Rooke and McKain2015), though the genus having previously been identified as a ruminal biomarker for low methane emissions (Kittelmann et al., Reference Kittelmann, Pinares-Patino and Seedorf2014). As mentioned earlier, the relative abundance of ruminal Quinella was host-specific and showed a high heritability in large-scale sheep studies (Hess et al., Reference Hess, Hodgkinson and Hess2023; Wang et al., Reference Wang, Zhang and Zhang2023), which aligns with our findings. Difford et al. (Reference Difford, Plichta and Løvendahl2018) proposed that smaller rumen sizes and higher turnover rates in small ruminants facilitate the growth of bacteria such as Sharpea and Quinella that utilise soluble sugars. The heritable nature of ruminal passage rate may further explain the high heritability of ruminal Quinella abundance (Smuts et al., Reference Smuts, Meissner and Cronjé1995; Wang et al., Reference Wang, Zhang and Zhang2023). Together, these host-related physiological and genetic factors likely contribute to the greater abundance of ruminal Quinella observed in yaks compared to cattle in this study.
Additionally, our analysis revealed that most Quinella MAGs harboured genes encoding GH families involved in the degradation of starch, sucrose and fructan. This genomic potential appears to contrast with a previous study reported by Orpin (Reference Orpin1972), in which enriched Quinella could not grow on starch or other polysaccharides, but was capable of utilising monosaccharides (i.e. glucose, fructose, mannose), disaccharides (i.e. sucrose) and mannitol. The discrepancy suggests that while ruminal Quinella may lack a complete enzymatic suite for direct starch utilisation, it possesses the genetic potential to participate in starch degradation through intermediary steps. For instance, it might participate in starch metabolism by converting starch to amylose via 1,4-alpha-glucan branching enzyme (EC 2.4.1.18, GH13_e200) rather than to monosaccharides. Conversely, the presence of genes encoding oligo-1,6-glucosidase (EC 3.2.1.10) supports the genetic capacity to degrade sucrose to D-fructose and D-glucose, aligning with Orpin’s (Reference Orpin1972) observation that sucrose and glucose sustained Quinella growth. Previous studies have demonstrated that ruminal Quinella species are hydrogen-utilising bacteria (Kumar et al., Reference Kumar, Altermann and Leahy2022), and enriched cultures can produce lactate, acetate and propionate in vitro when supplied with glucose as the carbon source (Orpin, Reference Orpin1972). In the present study, we also found the presence of genes encoding enzymes responsible for catalysing glucose into these three metabolites within Quinella genomes. However, no genes or gene clusters associated with the conversion of malate to fumarate were detected, which contrasts with the findings of Kumar et al. (Reference Kumar, Altermann and Leahy2022). Analysis using gutSMASH indicated that ruminal Quinella possessed gene clusters for fumarate reduction, facilitating the conversion of fumarate to succinate, and subsequently to propionate. These genomic evidences imply that Quinella species may primarily generate propionate via fumarate reduction rather than through glucose fermentation. This insight may guide improvement of ruminal Quinella in vitro culture media, given fumarate’s crucial role as electron acceptor for fumarate-reducing bacteria (Hattori and Matsui, Reference Hattori and Matsui2008) was not emphasized in prior attempts (Kumar et al., Reference Kumar, Altermann and Leahy2022).
In our study, yaks were chosen as the animal model due to their comparatively higher rumen energy efficiency relative to cattle, a trait potentially linked to the presence of Quinella species (Liu et al., Reference Liu, Gao and Liu2023a, Reference Liu, Yang and Yang2023b). Our results indicated that correlations among rumen bacterial genera and KEGG pathways, particularly those related to carbohydrate and energy metabolism, were reduced in yaks with higher ruminal abundance of Quinella. Within microbial ecosystems, a reduction in such broad-scale correlations may reflect decreased functional redundancy among community members (Weimer, Reference Weimer2015). Consequently, this restructuring of microbial interaction in yaks with higher ruminal Quinella may be associated with a greater overall microbial energy efficiency in the rumen, a pattern consistent with observations in low-methane-emitting sheep (Maman et al., Reference Maman, Palizban and Atanaki2020). Regarding functional potential, the high-Quinella group showed lower abundance of two gene encoding enzymes for butyrate synthesis, but higher abundance of several genes involved in acetate and propionate synthesis. Notably, the differential enzyme-encoding genes identified via amplicon sequencing differed from those derived from metagenomic data. The discrepancy could be attributable to the inability to exclude dietary influences when using amplicon sequencing data. Furthermore, amplicon-based functional prediction relies on taxonomic assignment and reference genome databases, which can be influenced by several factors such as limited taxonomic resolution at the species and the incompleteness or functional inaccuracy of available databases. In contrast, shotgun metagenomic sequencing provides a more direct and comprehensive profile of functional potential, offering a more accurate representation of the shifts in VFA synthesis genes in our study. Taken together, these genomic insights were reflected in vivo, where higher levels of Quinella were associated with increased concentrations of total VFA in the rumen, but not with changes in predicted methane production.
The enhanced VFA synthesis was mainly attributed to the enrichment of metabolic pathways associated with carbohydrate and energy metabolism observed alongside elevated Quinella levels. Specifically, yaks with more Quinella exhibited greater abundances of modules in the glycolysis pathways, enhancing the conversion of glucose to pyruvate. Increased levels of Quinella were correlated with elevated abundances of several reactions involved in propionate metabolism and in pathways converting acetyl-CoA to acetate. These shifts could explain the rise in total VFA concentrations without altering the molar percentages of acetate and propionate, suggesting a simultaneous enhancement of both acids. Furthermore, Quinella abundance showed significant correlations with hydrogen-utilising bacteria, such as Acetivibrio and Propionispira, which are known to contribute to acetate and propionate synthesis (Murray, Reference Murray1986; Ueki et al., Reference Ueki, Watanabe and Ohtaki2014). In the present study, a negative correlation was observed between the relative abundance of Quinella and Methanobrevibacter, the predominant hydrogenotrophic methanogens in the yak rumen (Zhou et al., Reference Zhou, Fang and Meng2017). Nevertheless, no significant association was observed between Quinella abundance and predicted methane production. This finding appears inconsistent with a previous study reporting reduced methane emissions in sheep with extremely high ruminal levels of Quinella (>30%; Kittelmann et al., Reference Kittelmann, Pinares-Patino and Seedorf2014). The discrepancy may be explained by two factors. First, the relative abundance of Quinella in our yak herd remained far below the high thresholds reported in sheep (Kittelmann et al., Reference Kittelmann, Pinares-Patino and Seedorf2014). Second, the methane production in our study was predicted using the stoichiometric model of Moss et al. (Reference Moss, Jouany and Newbold2000) based on VFA proportions, which is less accurate than direct measurement.
In the present study, elevated levels of Quinella were associated with a distinct separation of ruminal metabolite profiles in yaks. Twelve differential metabolites were identified as potential biomarkers (AUC > 0.8), seven of which correlated significantly with Quinella abundances in the rumen. Both 13-HODE and γ-linolenic acid exhibited negative associations with Quinella abundances. This pattern suggests that higher Quinella abundance coincided with reduced levels of a γ-linolenic acid derivative and increased levels of its hydrogenation product (stearic acid), potentially indicating an altered ruminal biohydrogenation process (Lee and Jenkins, Reference Lee and Jenkins2011; Vangaveti et al., Reference Vangaveti, Jansen and Kennedy2016). Furthermore, the differential metabolites implicated perturbations in linoleic acid metabolism, which may occur within a microbial metabolic context where Quinella co-occurred with several hydrogen-utilising bacteria, thereby influencing hydrogen metabolism in the rumen. Our results also showed a negative correlation between Quinella abundance and ruminal choline, alongside a positive correlation with trimethylamine N-oxide (TMAO), which had the highest values of AUC values. This points to a potential link between Quinella and choline metabolism, leading to TMAO accumulating in high-Quinella rumen environments. Since TMAO can be reduced to trimethylamine by certain Proteobacteria (Jameson et al., Reference Jameson, Doxey and Airs2016), the observed negative correlations between Quinella and several Proteobacteria genera might coincide with a decreased capacity for TMAO reduction, potentially contributing to its accumulation. Lastly, a non-significant trend toward a lower feed-to-gain ratio (by 12.4%) was observed in the high-Quinella group. This trend, together with the associated increases in total VFA concentrations and the altered metabolic profiles, provides preliminary clues for a potential link between the Quinella-associated ruminal environment and feed efficiency in yaks. Further research via oral administration of enriched or isolated Quinella would help clarify its effects on yak performance.
Conclusion
In summary, our study constructed a high-quality genomic database of Quinella from multiple ruminant species. Genomic analysis revealed that Quinella possessed two distinct gene cluster for converting fumarate to propionate. The ruminal abundance of Quinella was found to be host-dependent, with a markedly higher prevalence and abundance in yaks than in cattle. In yaks, a greater abundance of Quinella was associated with enhanced microbial pathways for glycolysis, the reductive Krebs cycle and acetate production from acetyl-CoA. This metabolic shift coincided with increased total VFA concentrations and a decreased butyrate molar percentage. However, predicted methane production was unaffected, despite a negative correlation between Quinella and Methanobrevibacter. We conclude that Quinella can modulate rumen energy metabolism. Nevertheless, at the abundances observed in this study, it does not constitute a robust biomarker for diminished methanogenesis in yaks. Our findings provide novel insights into the genomic and metabolic potential of rumen Quinella and offer a valuable genomic resource for future research.
Supplementary material
The supplementary material for this article can be found at https://doi.org/10.1017/anr.2026.10030.
Data availability statement
Raw data of the rumen metagenome are deposited in the NCBI BioProject database under the accession number PRJNA1137056. The MAGs comprising the Quinella genome database are available via Figshare (DOI: 10.6084/m9.figshare.26537689).
Acknowledgements
This study was supported by the National Natural Science Foundation of China (grant no. 32302760), the Fundamental Research Funds for the Central Universities (grant no. KYLH20025012), the Qinghai Provincial Natural Science Fund for Distinguished Young Scholars (grant no. 2024-ZJ-905), and Qinghai University Research Ability Enhancement Project (grant no. 2025KTST04). Our special thanks to Dr. Shaukat Ali Bhatti, a retired associate professor from the University of Agriculture Faisalabad, for his language editing of this paper.
Author contributions
J.G.: investigation, funding acquisition, data curation, writing – original draft; H.D.: methodology, visualization; Q.W.: investigation, formal analysis; M.G.: investigation, formal analysis; Z.S.: formal analysis; project administration; L.H.: resources, supervision, funding acquisition; Y.C.: conceptualization, supervision, writing – review & editing.
Conflict of interest
None.
Declaration of generative AI and AI-assisted technologies in the writing process
The authors did not use any artificial intelligence assisted technologies in the writing process.


 Open access