


1. INTRODUCTION
The surface mass balance (SMB) of mountain glaciers is known to be a good indicator of climate change (IPCC, Reference Stocker, Qin, Plattner, Tignor, Allen, Boschung, Nauels, Xia, Bex and Midgley2013). So changes in glacier SMB can be used to assess changes in climate conditions in environments where direct meteorological observations are scarce (Vincent and others, Reference Vincent2004; Huss and others, Reference Huss, Farinotti, Bauder and Funk2008a; Radić and others, Reference Radić, Bliss, Beedlow, Hock, Miles and Cogley2014). However, for this purpose, a precise understanding of the sensitivity of SMB to atmospheric variables is mandatory (e.g. Oerlemans and Fortuin, Reference Oerlemans and Fortuin1992; Oerlemans and Reichert, Reference Oerlemans and Reichert2000; Gerbaux and others, Reference Gerbaux, Genthon, Etchevers, Vincent and Dedieu2005; Sicart and others, Reference Sicart, Hock and Six2008). Knowing SMB sensitivity is also necessary to calibrate/validate the numerical models used to simulate the past and future evolution of glaciers (e.g. Huss and others, Reference Huss, Zemp, Joerg and Salzmann2014; Réveillet and others, Reference Réveillet, Rabatel, Gillet-Chaulet and Soruco2015).
Several models have been developed to simulate melt rates at the glacier surface, from empirical/statistical approaches using temperature only to physically-based approaches including all the energy fluxes at the glacier surface. For instance, the simple degree-day (DD) approach (Braithwaite, Reference Braithwaite1995; Hock, Reference Hock1999) simulates snow and ice melt at the glacier surface from the sum of positive DD (PDD, i.e. the sum of daily mean temperatures above the melting point over a given period of time) and distinct melt factors for snow and ice identified from observations. However, this approach does not accurately represent the spatial variability of melt over the entire glacier surface because the influences of topography and aspect are not taken into account (Hock, Reference Hock1999). To improve the simple DD model, temperature-index (TI) models have been developed that account for other variables such as potential solar radiation, shortwave radiation and surface albedo (e.g. Hock, Reference Hock1999; Pellicciotti and others, Reference Pellicciotti2005; Vincent and Six, Reference Vincent and Six2013; Gabbi and others, Reference Gabbi, Carenzo, Pellicciotti, Bauder and Funk2014). On the other hand, energy balance models use meteorological data to determine energy fluxes. Several approaches have been developed with different levels of complexity (e.g. Oke, Reference Oke1987; Mölg and Hardy, Reference Mölg and Hardy2004; Gerbaux and others, Reference Gerbaux, Genthon, Etchevers, Vincent and Dedieu2005; Hock and Holmgren, Reference Hock and Holmgren2005; Lejeune and others, Reference Lejeune2007; Sicart and others, Reference Sicart, Hock, Ribstein, Litt and Ramirez2011; Dumont and others, Reference Dumont, Durand, Arnaud and Six2012a; Gurgiser and others, Reference Gurgiser, Mölg, Nicholson and Kaser2013a, Reference Gurgiser, Marzeion, Nicholson, Ortner and Kaserb). These physically-based models give good results when the meteorological data come from local meteorological measurements (e.g. Six and others, Reference Six, Wagnon, Sicart and Vincent2009). However, unless very high-resolution downscaling from atmospheric models is implemented as a previous step (Mölg and Kaser, Reference Mölg and Kaser2011), their performance decreases rapidly when remote meteorological data or reanalysis data are used (e.g. Gabbi and others, Reference Gabbi, Carenzo, Pellicciotti, Bauder and Funk2014).
Given the wide range of modelling approaches available, different points need to be considered when choosing the appropriate model to simulate long-term changes in glacier volume.
First, in a recent study comparing energy balance models forced with meteorological data from a weather station located at a distance of ~4 km, Gabbi and others (Reference Gabbi, Carenzo, Pellicciotti, Bauder and Funk2014) found that the modelled melt rates were often highly erroneous. Consequently, although these models have a physical basis, long-term reconstructions of the past from meteorological reanalysis data or of the future from climate scenarios are difficult to assess if reliable meteorological data are not available close to the study site or at the appropriate spatial resolution.
The second point is the use of the parameters of an empirical melt model outside the calibration period. Gabbi and others (Reference Gabbi, Carenzo, Pellicciotti, Bauder and Funk2014) showed that using TI or enhanced TI (ETI) (incorporating incoming shortwave radiation and albedo) models for a period of several decades leads to significant bias due to a non-constant relationship between temperature and melt. This conclusion is in agreement with that of Huss and others (Reference Huss, Funk and Ohmura2009) who pointed out that the melt factors, in particular the snow DD factors (DDFs), used at a century timescale remained stable until the mid-1970s and have decreased by −7% per decade since. According to these authors, higher air temperatures linked to incoming longwave radiation can explain part of the observed decrease in the DDFs since the mid-1970s, indicating oversensitivity of TI models to temperature change. DDFs could also be affected by variations in global shortwave radiation, and, to a lesser extent, by changes in turbulent heat fluxes (Braithwaite, Reference Braithwaite1995; Ohmura, Reference Ohmura2001). Huss and others (Reference Huss, Funk and Ohmura2009) therefore recommend caution when using classical TI models calibrated in the past, to project snow and ice melt in glaciological and hydrological studies or to calculate future sea-level rise. Ablation-temperature relationships can also be affected by changes in albedo related to dust (Oerlemans and others, Reference Oerlemans, Giesen and Van den Broeke2009) or black carbon deposition (Painter and others, Reference Painter2013; Gabbi and others, Reference Gabbi, Huss, Bauder, Cao and Schwikowski2015). According to these studies, TI and ETI models are only capable of reconstructing changes in volume over short time periods. Given that the parameters are not stable over time, these studies pointed out that these models require recalibration for distinct sub-periods to accurately model melt over long-time periods. In addition, Gabbi and others (Reference Gabbi, Carenzo, Pellicciotti, Bauder and Funk2014) showed that ETI models are more stable than TI models over decadal periods and are therefore better suited to estimate melting for future glacier-wide SMB projections. Moreover, the small number of meteorological variables used in ETI models is a major advantage for future projections for which the estimation of each meteorological variable can be questioned.
A third point concerns the transferability of parameters determined for an instrumented glacier to an uninstrumented glacier. Carenzo and others (Reference Carenzo, Pellicciotti, Rimkus and Burlando2009) tested the transferability of ETI model parameters and concluded that parameters calibrated over a given season on a given glacier in Switzerland can be applied to another season or another Swiss glacier with only a slight decrease in performance. However, the question concerning the transferability over long time periods or to distant glaciers remains open.
A question concerning model performance also remains. While most of the models have been validated using changes in volume or glacier-wide SMB, the question of the performance of each model for distributed SMBs remains to be answered. Vincent and Six (Reference Vincent and Six2013) pointed out that determining melt model parameters requires a large number of ablation measurements covering long periods because both solar radiation and air temperature vary in space and over time. Very few sensitivity studies have been conducted on snow and ice melt separately over the ablation season. Six and Vincent (Reference Six and Vincent2014) showed that the DDFs vary both in space and over time and that the use of constant DDFs over long time periods could lead to high uncertainties. In addition, several studies (e.g. Hock, Reference Hock1999; Carenzo and others, Reference Carenzo, Pellicciotti, Rimkus and Burlando2009; Pellicciotti and others, Reference Pellicciotti, Raschle, Huerlimann, Carenzo and Burlando2011) raised the problem of equifinality because different pairs of model parameters can have similar performances. Finally, a model intercomparison study by Gabbi and others (Reference Gabbi, Carenzo, Pellicciotti, Bauder and Funk2014) covering the 20th century concluded that the ETI and the simplified energy balance (SEB) (Oerlemans, Reference Oerlemans2001) models were the only ones able to reproduce the observed ice volume changes at a multi-decadal timescale.
None of these studies analyzed the uncertainties in winter snow accumulation and their impacts on the summer SMB (SSMB). Although the variability of the glacier-wide SMB over recent decades in the Alps is mainly driven by summer ablation (Six and Vincent, Reference Six and Vincent2014), modelling the winter SMB (WSMB) is important to correctly model the annual glacier-wide SMB. WSMB is usually estimated from corrected precipitation derived from neighbouring weather stations, reanalysis data, or outputs from regional climate models. The amount of snow can be assessed using a correction factor depending on the elevation and a temperature threshold to characterize the precipitation phase (Vincent and others, Reference Vincent, Vallon, Pinglot, Funk and Reynaud1997, Reference Vincent2007; Hock, Reference Hock1999; Machguth and others, Reference Machguth, Eisen, Paul and Hoelzle2006, Reference Machguth, Paul, Kotlarski and Hoelzle2009; Rabatel and others, Reference Rabatel, Dedieu, Thibert, Letréguilly and Vincent2008). These empirical relationships can be improved when abundant field data make it possible to account for the spatial variability of WSMB in relation to processes linked with the deposition or redistribution of snow (e.g. Gerbaux and others, Reference Gerbaux, Genthon, Etchevers, Vincent and Dedieu2005; Dumont and others, Reference Dumont2010). This approach is efficient in the case of well-documented glaciers, but cannot be extrapolated to other glaciers. Other approaches attempted to consider topographic parameters and wind effects as the sources of spatial variability of snow depth (e.g. Winstral and Marks, Reference Winstral and Marks2002; Machguth and others, Reference Machguth, Eisen, Paul and Hoelzle2006; Huss and others, Reference Huss, Farinotti, Bauder and Funk2008a; Dadic and others, Reference Dadic, Mott, Lehning and Burlando2010; Gascoin and others, Reference Gascoin, Lhermitte, Kinnard, Bortels and Liston2013; Sold and others, Reference Sold2013; Gabbi and others, Reference Gabbi, Carenzo, Pellicciotti, Bauder and Funk2014). The commonly used variables are elevation, slope and curvature calculated from a DEM. The calibration of these relationships requires numerous in situ measurements and sites with sufficient data are unfortunately rare (e.g. Machguth and others, Reference Machguth, Eisen, Paul and Hoelzle2006; Dadic and others, Reference Dadic, Mott, Lehning and Burlando2010; Sold and others, Reference Sold2013).
The aim of the present study is to shed new light on the spatial and temporal variability of glacier SMB processes (accumulation and ablation) to identify the relevant atmospheric and topographic variables to explain SMB variability. The study is based on a long (i.e.1995–2012) dataset of extensive glaciological and meteorological measurements on four glaciers in the French Alps, covering wide ranges of elevation and different aspects and slopes. The objectives of this paper are: (i) to analyze the sensitivities of ice and snow ablation to air temperature and potential solar radiation in the framework of ETI models and of the spatial and temporal variability of accumulation to precipitation and topographic variables; and (ii) to compare different empirical models and identify a simple and robust model capable of simulating SMB for the time period over which field measurements are available.
2. STUDY SITES AND DATA
2.1. Study sites
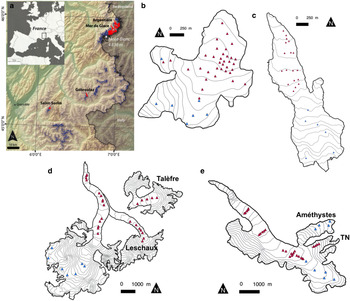
This study focuses on four glaciers located in the French Alps (Fig. 1). These glaciers belong to the observation facility ‘Service d'Observation GLACIOCLIM’ (http://www-lgge.ujf-grenoble.fr/ServiceObs/index.htm). The two largest glaciers are Mer de Glace and Glacier d'Argentière located in the Mont Blanc area, covering a surface area of 28 and 13 km2, respectively. The Glacier de Saint-Sorlin and Glacier de Gébroulaz, each covering a surface area of ~3 km2, are located in the Grandes Rousses massif and Vanoise National Park, respectively. The topographic characteristics of these glaciers are listed in Table 1 (see also Six and Vincent, Reference Six and Vincent2014). Major tributaries of these glaciers are also included in this study: for example Glacier des Améthystes and Glacier du Tour Noir for Glacier d'Argentière and Glacier de Leschaux for the Mer de Glace. Although Glacier de Talèfre has not been connected to the Mer de Glace since the end of the 1950s, it is used to study the sensitivity of SMB to a southern aspect.
(a) Location of glaciers in the western Alps. The glaciers in the French Alps are in blue except for the glaciers used for the present study, which are in red. The other figures show the network of field mass-balance measurements (blue triangles in the accumulation area and red triangles in the ablation area) for (b) Glacier de Saint-Sorlin, (c) Glacier de Gébroulaz, (d) Mer de Glace, and (e) Glacier d'Argentière. Grey lines represent 50 m contour lines. Tributary glaciers of Glacier d'Argentière (Améthystes and Tour Noir: TN) and Mer de Glace (Talèfre and Leschaux) are also shown.
Main characteristics of the four monitored glaciers and their main tributaries. The number of measurement sites in the ablation and accumulation areas is also given. The minimum elevation (snout position) was measured in 2012 (adapted from Six and Vincent, Reference Six and Vincent2014).

2.2. Data
2.2.1. Glaciological data
WSMB and SSMB have been monitored on all the glaciers we studied since 1995 using the glaciological method (Cuffey and Paterson, Reference Cuffey and Paterson2010). The uncertainties of the direct measurements have been assessed at ~0.20 m w.e. a–1 for WSMB and 0.15 or 0.30 m w.e. a–1 for SSMB depending on whether the ablation concerned ice or snow and firn (Thibert and others, Reference Thibert, Blanc, Vincent and Eckert2008). Stakes are set up in the accumulation and ablation areas and cover a large part of each glacier (Fig. 1). WSMBs are measured at every stake (see Fig. 1 and Table 1) at the end of April using snow cores and density measurements. During the ablation season (April–October), glaciers are visited monthly except on the Glacier de Gébroulaz, which is monitored only three times a year. Thanks to this large quantity of field measurements, snow and ice melt can be analyzed separately over an 18 a period.
2.2.2. Meteorological data
Automatic weather stations (AWS) are located on the moraine of Glacier d'Argentière and Glacier de Saint-Sorlin and record air temperature, relative humidity, short- and long-wave radiation and wind speed and direction at half-hourly time steps. As the meteorological measurements at these stations do not cover the entire study period (since 2005 and 2006, respectively), these data cannot be used in this study. On the other hand, atmospheric temperature data from the SAFRAN (Système d'Analyse Fournissant des Renseignements Adaptés à la Nivologie, System of analysis for the provision of information for the science of snow) reanalysis are available back to 1958 (Durand and others, Reference Durand2009). SAFRAN disaggregates large-scale meteorological analyses and observations in the French Alps. The analyses provide hourly meteorological data as a function of seven slope exposures (N, S, E, W, SE, SW and flat), and altitude (at 300 m intervals up to 3600 m a.s.l.), and that differ for each mountain range (e.g. Mont Blanc, Vanoise and Grandes Rousses massifs).
We compared summer temperature data from SAFRAN and the AWS over the same time period and the results showed a higher correlation than when we compared AWS data with data from meteorological stations down in the valleys, hence justifying the use of SAFRAN reanalysis data. As SAFRAN data are available at 300 m intervals from 1200 to 3600 m a.s.l., the air temperature at the elevation of each SMB measurement was computed using a linear interpolation between the elevations available in the SAFRAN analysis.
Due to the lack of precipitation records close to each glacier, precipitation data were also taken from SAFRAN reanalysis. Like air temperature, precipitation data are available for each 300 m interval and differ for each massif and exposure. As the precipitation phase is directly known from the SAFRAN reanalysis, these data provide better results than precipitation measurements taken in the valley and extrapolated using an altitudinal gradient and a temperature threshold of 274.15 K. Solid precipitation data from SAFRAN reanalysis were used during the accumulation season.
Finally, potential direct solar radiation, IPOT, was computed from the 10 m DEMs of each glacier as a function of upper atmosphere radiation and atmospheric transmissivity, knowing solar zenith and azimuth angles and glacier surface topographic characteristics (e.g. Hock, Reference Hock1999).
2.2.3. Digital elevation models
This study covers the period 1995–2012 for which different DEMs were used to take the changes in glacier geometry into account. The DEMs were determined from aerial photogrammetry and have a 10 m spatial resolution. For Glacier de Saint-Sorlin, three DEMs are available from 1997, 2003 and 2007. For Glacier d'Argentière and Mer de Glace, DEMs from 1998, 2003 and 2008 were used. For Glacier de Gébroulaz, DEMs from 1998 and 2003 were available. For Glacier de Gébroulaz and Mer de Glace, the DEMs from aerial photogrammetry did not cover the entire basin catchment and therefore a DEM from satellite images (ASTER-GDEM), obtained during the period 2000–10, with a 30 m resolution, was used to compute the mask for potential radiation.
3. SSMB AND WSMB SENSITIVITIES
3.1. SSMB sensitivity
3.1.1. Sensitivity to temperature
Thanks to monthly field measurements during the ablation period, two datasets of snow and ice ablation measured at the stakes were available. These datasets were analyzed separately and compared with the cumulative PDD (CPDD, in K) at each stake. Figure 2(a–c) shows the ice ablation measured at the stakes from August to October over the period 1995–2012 as a function of the CPDD on three glaciers (Saint-Sorlin, Mer de Glace and Argentière). Correlations were computed stake-by-stake to eliminate the impact of spatial variability related to solar radiation, albedo or other variables. For the sake of clarity, only three stakes located at three distinct elevations are shown on each glacier in Figure 2. Correlations were significant in all cases at the 99% (Student's t test) confidence level, indicating a variability of ice ablation that is well explained by temperature variability.
Correlation between ablation and cumulative PDD for three stakes located at distinct elevations on (a) Glacier de Saint-Sorlin (ice ablation), (b) Glacier d'Argentière (ice ablation), (c) Mer de Glace (ice ablation) and (d) Glacier de Saint Sorlin (snow ablation). Each point corresponds to 1 year between 1995 and 2012. Coloured numbers correspond to the DDFs, computed for the different elevations.

Using the linear regressions between snow/ice ablation and CPDD, DDFs can be computed (as described in Vincent, Reference Vincent2002). Ice DDF sensitivities on these glaciers over the same study period have already been analyzed by Six and Vincent (Reference Six and Vincent2014). To complete their study, the DDFs were computed over two distinct periods, 1995–2002 and 2003–12. The results (not shown) showed that the ice DDF variations did not exceed 6% between the two periods. On the other hand, DDFs change over the course of the ablation season and are generally higher at the beginning of the ice ablation season. The decrease in DDFs during late summer and fall can be primarily explained by snowfall events during September–October leading to an increase in the surface albedo and hence to a decrease in the DDFs. The potential impact of changes in solar radiation over the course of the ablation season on the DDFs is barely quantifiable particularly because the decrease in solar radiation in late summer goes hand in hand with more frequent snowfalls at the glacier surface.
Snow ablation was only studied on Saint-Sorlin (Fig. 2d), because data on snow ablation on the other glaciers were too scarce. Correlations are significant at the 99% confidence level (Student's t test). Note that the snow ablation measurements shown in Figure 2d do not cover the same time periods from one stake to the other because the snow tends to disappear earlier in the season at lower elevations. Moreover, like the ice DDF, the snow DDF fluctuates considerably over the ablation season. DDF snow values typically increase from 0.003 m w.e. K−1 d−1 over the period from late April to early June to 0.006 m w.e. K−1 d−1 over the period from early June to mid-July. This large increase in DDF could be partly explained by the 20% increase of IPOT between these two periods and/or by snow metamorphism and associated changes in albedo (e.g. Oerlemans, Reference Oerlemans2001).
Our analysis of field MB measurements for four glaciers and over a period of nearly 20 a supports the findings of Six and Vincent (Reference Six and Vincent2014) and confirms that the variability of snow and ice ablation over time is mainly driven by CPDD variability and consequently by temperatures during the ablation season.
3.1.2. Sensitivity to solar radiation
To eliminate the temporal variability of ablation, ablation and solar radiation values were first cumulated over the period 2004–12. Then, cumulated ablation values were divided by the CPDD to obtain DDFs and solar radiation values were divided by the number of days to be expressed as daily mean solar radiation. The snow/ice ablation at different elevations depends on the temperature lapse rate. To be independent of elevation, we analyzed the spatial variability of the snow/ice DDFs directly. When we compared these values with cumulative potential solar radiation obtained for the same periods (Fig. 3), the correlations were significant at the 99% confidence level (Student's t test). The correlations were higher for ice ablation than for snow ablation, probably due to greater spatial variability of the snow surface albedo. However, the high correlations indicate that the spatial variability of SSMB is largely explained by solar radiation, as emphasized repeatedly in the literature (e.g. Hock, Reference Hock1999; Pellicciotti and others, Reference Pellicciotti2005; Vincent and Six, Reference Vincent and Six2013).
Relationships between DDFs and daily mean potential solar radiation computed for: (a) ice ablation on Glacier de Saint-Sorlin, (b) ice ablation on Glacier d'Argentière (including Glacier du Tour Noir and Glacier des Améthystes), (c) ice ablation on Mer de Glace (including Glacier de Talèfre and Glacier de Leschaux) and (d) snow ablation on Glacier de Saint-Sorlin.

3.2. WSMB sensitivity
We also used our dataset to study the spatial and temporal variability of the WSMB. Stakes located in the lower part of Mer de Glace and Glacier d'Argentière (i.e. below 2000 m a.s.l.) were not included because of melt events that occurred in late winter – early spring (i.e. before accumulation was measured).
3.2.1. Temporal variability of WSMB and precipitation
First, we compared the measured WSMB at each stake on each glacier with cumulated solid precipitation data from SAFRAN reanalysis, at 3000 m a.s.l. (accumulation area) and at 2700 m a.s.l. (ablation area) (Fig. 4a). The results showed that solid precipitation inferred from SAFRAN reanalysis data are under-estimated by ~1.5 on the average at the glacier scale, in good agreement with Gerbaux and others (Reference Gerbaux, Genthon, Etchevers, Vincent and Dedieu2005) and Dumont and others (Reference Dumont2010). Note that this averaged ratio has a high inter-annual variability ranging from 1.3 to 1.9 at 2700 m a.s.l. and from 1.4 to 1.7 at 3000 m a.s.l. at Glacier de Saint-Sorlin over the period studied (results not shown). As a result, the correction factor for WSMB strongly depends on the calibration period. Similar results were obtained for the other glaciers with larger elevation ranges (Argentière and Mer de Glace) with ratios ranging from 1.2 (at 2000 m a.s.l.) to 2.0 (at 3200 m a.s.l.).
(a) WSMB vs solid precipitation on Glacier de Saint-Sorlin. Each dot corresponds to one winter season (in blue for stake #14 located in ablation area at 2700 m a.s.l. and in red for stake #5 located in accumulation area at 3000 m a.s.l.). (b) WSMB anomalies computed at four stakes on Glacier de Saint-Sorlin over the period 1995–2012. The dark line shows the solid precipitation anomalies at 2700 m a.s.l. from the SAFRAN reanalysis data.

Next, the temporal variability of WSMB was compared with precipitation variability. To eliminate spatial variability, the WSMB anomaly was computed at each stake by subtracting the mean WSMB of this stake from the annual WSMB value. These WSMB anomalies were then compared with solid precipitation from the SAFRAN reanalysis at 2700 m a.s.l. (Fig. 4b). Except for a few years when amplitude is not well represented (1996–2000, 2002 and 2006), the temporal variability of the WSMB was fairly well explained by the temporal variability of solid precipitation. The correlations were computed at the level of point measurements and were significant in every case at the 95% confidence interval according to a Student's t test (r 2 > 0.42).
In addition, the WSMB anomalies from one stake to another at Glacier de Saint Sorlin were very similar (Fig. 4b). This shows that the spatial distribution of WSMB is well reproduced from 1 a to another. This finding is also valid for the other glaciers we studied (see Supplementary Material).
3.2.2. Spatial variability of the WSMB
Because SAFRAN reanalysis data are available at 300 m intervals in elevation, they should represent the dependence of elevation on meteorological variables. Regarding precipitation, the factor between SAFRAN solid precipitation and the WSMB, increases with the elevation (Fig. 4b). This is also the case of the other glaciers studied (results not shown). As a result, the elevation gradient is larger for WSMB than for solid precipitation. This can be explained first by the lack of observations at high elevations in the SAFRAN model and second by the non-inclusion in the model of wind preferential deposition.
To study the variables that possibly influence the spatial distribution of WSMB (independently with respect to the inter-annual accumulation variability), we cumulated the annual data from 2004 to 2012 (i.e. 8 a). Considering all the points located above 2000 m a.s.l. on the four glaciers, a significant correlation (r 2 = 0.57) between elevation and cumulative accumulation was found, and the linear trend was ~100 mm w.e. 100 m−1. (Fig. 5). However, considering the accumulation area only (i.e. above 2900 m a.s.l.), this correlation decreased (r 2 = 0.11) and was no longer significant at the 95% confidence level (Student's t test).
Correlation between WSMB cumulated over the period 2004–12 with elevation for all the glaciers studied. Coloured lines represent the linear regressions, in pink for the accumulation area only and in black for the accumulation and ablation areas.

The same study was conducted on the other glaciers. Considering the entire glacier elevation range of each glacier, the correlation between WSMB and elevation was significant at the 99% confidence level (Student's t test). However, the correlation was higher for Mer de Glace and Glacier d'Argentière (r 2 = 0.79 and 0.78, respectively) than for Gébroulaz and Saint-Sorlin glaciers (r 2 = 0.63 and 0.50, respectively). Note that these correlations increased with the amplitude of the glacier elevation ranges. Only considering the accumulation area, the correlation remained significant at the 99% confidence level (Student's t test) for Argentière and Gébroulaz (r 2 = 0.49 and 0.56, respectively), but not for Mer de Glace and Saint-Sorlin.
Relationships with several other topographic parameters were analyzed to improve our understanding of the spatial variability of the SW MB.
First, we tested numerous statistical relationships with slope, curvature and Topographic Position Index (TPI) using different DEM resolutions (10–200 m). Note that the TPI describes the difference between the elevation of a grid node and the mean elevation within a predetermined neighbourhood. Using the TPI, the spatial variability of snow related to the presence of a ridge (TPI > 0) or a valley (TPI < 0) can be taken into account (Weiss, Reference Weiss2001; De Reu and others, Reference De Reu2013).
Despite the numerous field measurements carried out on these glaciers, we did not find any significant correlations with slope, curvature and TPI (see Supplementary Material).
Additional relationships were tested using distance to a steep slope (slope > 30°, 45°, 60°) and distance to the next ridge. The purpose was to test the redistribution of solid precipitation from slopes adjacent to the glacier surface. Unfortunately, these statistical experiments did not lead to significant correlations (see Supplementary Material).
In conclusion, SAFRAN reanalysis data are not sufficient to explain the WSMB changes with elevation (i.e. vertical distribution). This suggests the presence of a possible bias in the SAFRAN reanalysis data or/and local factors that influence the accumulation of snow. We can also conclude that, based on our local measurements, elevation is probably the only variable that significantly affects WSMB spatial variability; however it does not explain all the variability.
4. MELT MODELS: METHODS, CALIBRATION AND PERFORMANCE
In this section, we compare the different melt models available in the literature and a new melt model to simulate SSMB. All the melt models were calibrated using the SSMB stake measurements made over the period 2004–12. Parameters were varied until the measured SSMB was matched. Then models were validated by comparing simulation results with stake measurements made over the period 1995–2003.
To compare the performance of each model for the simulation of SSMB, the same WSMB measurements were used to force all the models.
Finally, the glacier-wide SMB was computed over the last two decades using the best set of model parameters and compared with the field values obtained from the Service d'Observation GLACIOCLIM (Six and Vincent, Reference Six and Vincent2014). For the modelling approach, the WSMB distribution for each year was constructed by interpolating the field measurements using a kriging method detailed hereafter.
4.1. Melt model descriptions
The classical DD model (Braithwaite and Olesen, Reference Braithwaite and Olesen1989) is based on air temperature only. Ice and snowmelt are related to air temperature using distinct melt factors for ice and snow:
 $$M\; = \; DDF_{{\rm snow/ice}}\; \; T\;\;\;\;\;{\rm if\;} T\; \gt \; 0\; K\; $$
 $$M\; = \; 0\; \;\;\;\;\;{\rm if\;} T\; \lt \; 0\; K$$
where DDF snow/ice is the DDF for snow and ice (m w.e. K−1 d−1), T is the difference between the mean daily air temperature (K) and the melting point Tm (273.15 K).
The TI model proposed by Hock (Reference Hock1999) (HTI) includes potential direct solar radiation to consider the spatial variability of melt due to exposure:
 $$M\; = \; (MF\; + \; R_{{\rm ice/snow}}\; \; IPOT)\; \; T\;\;\;\;\;{\rm if\;} T\; \gt \; 0\; K\; $$
 $$M\; = \; 0\; \;\;\;\;\;{\rm if\;} T\; \lt \; 0\; K$$
where MF is the melt factor (m w.e. K−1 d−1), R ice/snow the radiation factor for ice or snow (m3 w.e. K−1 W−1 d−1), IPOT the incoming potential direct solar radiation (W m−2) and T the difference between the mean daily air temperature (K) and Tm. The SEB model proposed by Oerlemans (Reference Oerlemans2001) takes into account IPOT and other physical variables such as albedo. Melting from solar radiation and other heat fluxes can be distinguished, but changes in snow albedo and atmospheric transmissivity are not considered. The melt energy Q is computed and converted into a melt rate M, thus avoiding the need to set an air temperature threshold (melt occurs only when melt energy is available):
 $$Q = (1 - \alpha_{\rm snow/ice}) IPOT + C_1 T + C_0$$
 $$M\; = \displaystyle{{Q\; \Delta t} \over {Lf\; \rho}} $$
where α is the albedo, fixed at 0.75 for the snow and 0.35 for the ice (Oerlemans, Reference Oerlemans2001), IPOT is the incoming potential direct solar radiation (W m−2), C 1 the temperature factor (W m−2 K−1), T the difference between the mean daily air temperature (K) and Tm, and C0 is an empirical factor (W m−2) describing the other temperature-dependent energy fluxes. The melt rate M is calculated from the melt energy using the latent heat of fusion (Lf = 333 700 J kg−1), the time step Δt and the water density (ρ = 1000 kg m−3).
The ETI model of Pellicciotti and others (Reference Pellicciotti2005) takes IPOT into account, along with other physical variables such as albedo and atmospheric transmissivity. Like the SEB model, the melt caused by solar radiation and other heat fluxes can be distinguished:
 $$M\; = \; T_F\; T+ SRF\; (1 - \alpha _{{\rm snow/ice}})\; IPOT\; Cf\;\;\;\;{\rm \; } {\rm if}\;T\; \gt \; 1\; K$$
 $$M\; = \; 0\; \;\;\;\;\;{\rm if\;} T\; \lt \; 1\; K$$
where T F is called the temperature factor (m w.e. K−1 d−1), T the difference between the mean daily air temperature (K) and Tm, SRF the shortwave radiation factor (m3 w.e. W−1 d−1), α the albedo of snow or ice. IPOT is the incoming potential direct solar radiation (W m−2) and Cf a cloud transmission factor defined by Eqn (7) (Pellicciotti and others, Reference Pellicciotti, Raschle, Huerlimann, Carenzo and Burlando2011). Note that the temperature threshold above which melt occurs was set to 1 K above the melting point Tm according to the study by Pellicciotti and others (Reference Pellicciotti2005).
In the ETI model, the ice albedo is considered to be constant and the snow albedo is estimated from T acc, which is a particular CPDD calculated since the last snowfall (Brock and others, Reference Brock, Willis and Sharp2000), as follows:
 $$\alpha _{{\rm snow}}\; = \; a_1\; - \; a_2\; log10\; T_{{\rm acc\;}} $$
 $$\alpha _{{\rm ice}}\; = \; 0.24$$
where a 1 and a 2 are empirical parameters calibrated using field measurements. In our study, due to the lack of snow albedo measurements and the proximity of the Rhonegletscher (150–200 km away from the four glaciers studied), these parameters were taken from Gabbi and others (Reference Gabbi, Carenzo, Pellicciotti, Bauder and Funk2014): a 1 = 0.86 and a 2 = 0.155.
The cloud transmission factor was computed using Eqn (5) from Pellicciotti and others (Reference Pellicciotti, Raschle, Huerlimann, Carenzo and Burlando2011) and calibrated using data from the two weather stations located on the moraines of Glacier de Saint-Sorlin and Glacier d'Argentière.
 $$Cf\; = \; p_1\; \Delta T\; + \; p_2\; \; $$
For Glacier de Saint-Sorlin, p 1 = 0.016 K−1 and p 2 = 0.188, and for Glacier d'Argentière, p 1 = −1.75 10−5 K−1 and p 2 = 0.3948. Due to its proximity, we adopt the same parameters for Mer de Glace as for Glacier d'Argentière. The ETI model is not suitable for Gébroulaz because of the absence of nearby meteorological stations.
Finally, we propose a new TI model, hereafter referred to as the alternative TI (ATI) model. We added the terms T and IPOT in order to separate the spatial variability of melt due to aspect and the temporal variability due to temperature. In our approach, the daily melt is computed as follows:
 $$M\; = \; \; Tf_{{\rm ice\; /snow}}\; \; T\; \; + \; If_{{\rm ice/snow}}\; IPOT$$
where Tf snow/ice is the temperature factor for ice and snow (m w.e. K−1 d−1), T the difference between the mean daily air temperature (K) and Tm, If snow/ice is the radiation factor for ice or snow (m3 w.e. W−1 d−1) and IPOT is the incoming potential direct solar radiation (W m−2). Melt occurs at the glacier surface only when the energy available from T and IPOT is sufficient (i.e. when sum of the two terms of the equation is positive and in particular even if T from nearby measurements or a reanalysis is < 0 K). Thereby this approach does not require a temperature threshold. In this approach, If snow/ice represents the energy fluxes related to solar radiation, which differ for snow and ice, but are constant, i.e. no temporal changes in albedo are assumed. Tf represents the temperature-dependent energy fluxes.
4.2. Calibration
Summer stake measurements over the period 2004–12 were used to calibrate the models. For each glacier, 15–20 stakes were used, totalling ~150 measurements per glacier used for calibration. The snow heights at the beginning of the melt season were taken from the field measurements and converted into m w.e. using snow density measurements. Because snow to ice transition at each stake is unknown, ice and snow factors cannot be computed separately. They were therefore computed using the least squares method. For this purpose, a large range was chosen for each parameter and every value was tested over this range using an iterative method with a low increment (10−7 to 1, depending on the parameters). For each iteration, two performance criteria were computed: the Nash-Sutcliffe efficiency coefficient: NSE (Nash and Sutcliffe, Reference Nash and Sutcliffe1970) and the RMSE. When NSE is maximum and RMSE is minimum, the parameters are at an optimum. Due to the numerous measurements, only one set of optimum parameters was found, thereby reducing the equifinality problem (see Section 5.2.1). The optimum set of parameters was computed for each glacier and for each model (Table 2).
Optimum sets of parameters for each glacier and each model, calibrated over the 2004–12 period

4.3. Stability of the model parameters
To assess the suitability of each model to be used for the different time periods, we tested the temporal variability of the parameters. To assess the transferability of the parameters calibrated on one glacier to another for each model, we analyzed the spatial variability of the parameters on the different glaciers.
4.3.1. Uncertainties due to the temporal variability of model parameters
For each model, the parameters were calibrated using ablation measurements over three periods: P 1 = 2004–12, P 2 = 2004–08 and P 3 = 2009–12. In order to assess the temporal stability of the parameters, simulations and measurements were compared over the 2004–12 period using the three parameter sets corresponding to each calibration period. The temporal stability of the parameters was quantified by computing the difference between the modelled and observed ablation for each stake on each glacier and each parameter set (~1500 values). To synthesize this information, these differences were averaged as a function of the glacier, model and parameter set. The maximum averaged differences for each glacier and each model are listed in Table 3. Figure 6a summarizes this method for one glacier. Results indicate mean differences ranging between 0.07 and 0.74 m w.e. a−1; which clearly depend on the glacier. For Argentière, Saint-Sorlin and Gébroulaz, the maximum averaged differences were similar to the measurement uncertainties, whereas Mer de Glace showed higher values, indicating that a time-dependent calibration is necessary. This peculiar behaviour of Mer de Glace could be related to changes in the surface albedo over time due to the increase in the debris cover on the tongue over the last decade. Table 3 also shows larger differences between modelled and observed ablation for the DD and ETI models, while the smallest differences were obtained for the HTI and ATI models.
Schematic representation of the method used to study (a) the temporal and (b) the spatial variability of the model parameters (i.e. the mean differences reported in Tables 3 and 4 for the studied models) in the case of the one glacier. A similar method is applied for the other three glaciers.

Maximum of the averaged difference (m w.e.) between modelled and observed ablation for each stake on each glacier and each parameter set computed over three calibration periods (2004–12, 2004–08 and 2009–12). (See Section 4.3.1 for more details).

4.3.2. Uncertainties due to the spatial variability of model parameters
To study the spatial transferability of the model parameters, the optimum parameter set calibrated on each one of the three glaciers (the ‘calibrated’ glaciers) for the period 2004–12 was used to model ablation at each stake on the fourth glacier (the ‘tested’ glacier). For the ‘tested’ glacier and for each parameter set resulting from the ‘calibrated’ glaciers, the difference between measured and modelled ablations was computed at each stake and then averaged at the scale of the ‘tested’ glacier. The maximum averaged differences representing the worst case for spatial transferability of the model parameters are given in Table 4. This method is illustrated in Figure 6b for a specific glacier. The five models show similar performance with differences between modelled and observed ablation ranging from 0.5 to 0.98 m w.e. a−1 (except for the ETI model on Saint-Sorlin and Argentière glaciers). Consequently, regardless of the model, its use with parameters calibrated on another glacier introduces an uncertainty of ~0.70 m w.e. a−1 on the modelled ablation, which is ~20% of the SSMB.
For each ‘tested’ glacier, the value indicates the highest averaged difference (m w.e.) between the modelled (computed using each parameter set resulting from the ‘calibrated’ glaciers) and observed ablation for each stake. (See Section 4.3.2 for more details)

4.4. Model performance
4.4.1. Evaluation of melt models based on individual stake measurements
Using parameters calibrated at the glacier scale for the period 2004–12 and accumulation determined from winter measurements, model performance was tested by modelling the SSMB for each stake for the period 1995–2003 (i.e. outside the calibration period). The results presented in Table 5, column A, show that the performance of all the models was similar but that the correlations between the modelled and measured ablation strongly differed from one glacier to another. The highest correlations were found for Glacier d'Argentière and Mer de Glace where stake measurements span a large range of elevation (2370–3440 m a.s.l. and 1610–3570 m a.s.l. respectively), thus covering the widest range of ablation values (from 0 to −11 m w.e.). The lowest correlations were found for Glacier de Saint-Sorlin where the stakes are located between 2690 and 3260 m a.s.l., resulting in a narrower range of ablation values (from −0.5 to −6 m w.e.). This suggests that the better performance of the models on glaciers spanning a wide range of elevation is related to the link between summer ablation and elevation.
(A) Performance of each model in terms of SSMB simulations for all the stakes on the glacier over the period 1995–2003. The last two columns show model performance over a narrower range of elevation with (B) model parameters calibrated using all the stake measurements located over the entire glacier and (C) model parameters calibrated using only stake measurements located within the narrower range of elevation.

To eliminate the elevation effect, a reduced elevation range was selected (see Table 5, columns B and C), spanning a wide range of exposure. This study was carried out on Saint-Sorlin, Argentière and Mer de Glace, which each offer distinct exposures over a small elevation range.
First, the simulations were run using the model parameters calibrated at the glacier scale. The differences in determination coefficients between the models (column B), and in particular between the DD model and the models that take solar radiation into account, were not statistically significant at the 95% confidence level (Student's t test). This suggests that considering solar radiation does not improve model performance.
Next, the simulations were performed using the model parameters calibrated using only measurements made within the reduced elevation ranges (Table 5, column C). On Saint-Sorlin and Mer de Glace, models including solar radiation were statistically better than the DD model (at the 99 and 95% confidence level, respectively). On the other hand, for Glacier d'Argentière, the DD model appears to perform as well as the other models. This is probably the result of the narrower range of exposure of this glacier (see Fig. 1) and a SSMB variability mainly driven by time and hence temperature.
Our results showed that at the glacier scale, the SSMB spatial variability related to the elevation gradient of temperature was greater than that related to spatial variability of solar radiation. Consequently, for wide ranges of elevation, the influence of the solar factor is less than that of the temperature factor. As a result, a simple DD model appears to be as good as models that consider IPOT. Models using IPOT thus only provide better results if they are calibrated and validated over a narrow range of elevation and with different exposures.
4.4.2. Evaluation of melt models based on glacier-wide SMB modelling
The melt models were used to simulate the glacier-wide SMB of each glacier over the last two decades. For this purpose, the spatial distribution of WSMB was first obtained by kriging the annual WSMB measurements at each stake. Different approaches exist to estimate uncertainties. The Monte Carlo approach has been commonly used to estimate MB uncertainties in former studies (e.g. Van der Veen, Reference Van der Veen2002; Machguth and others, Reference Machguth, Purves, Oerlemans, Hoelzle and Paul2008). In this study, the Monte Carlo approach was used to assess the annual WSMB uncertainty considering a 95% interval (about ±2 standard deviations). Thousand independent random draws of WSMB were performed at each stakes, following a normal law, centred on the WSMB measurements, and with a standard deviation of 0.20 m w.e. (measurement uncertainty). The 95% interval is of ± 0.30 m w.e. for Glacier de Saint-Sorlin and Glacier de Gébroulaz, and ± 0.40 m w.e. for Glacier d'Argentière and ± 0.45 m w.e. for Mer de Glace.
Simulations were run using different DEMs to account for the changes in glacier geometry over time (see Section 2.2.3). Accounting for short-term (over the scale of a few years) changes in glacier geometry is not indispensable. However, changes in glacier surface geometry and slope should be accounted for over longer time periods (on the decadal scale), in particular to limit errors in the calculation of IPOT.
Finally, the modelled glacier-wide SMB were cumulated over the period 1995–2012 and compared with measured SMB (Fig. 7). For Glacier de Saint-Sorlin (Fig. 7a), all the melt models gave similar results. The difference between the most positive model (the HTI model) and the most negative model (the DD model) after 18 a of simulation was 4.56 m w.e. Note that the input WSMBs were identical for each model and consequently the differences between the models in the modelled glacier-wide SMB only result from the differences in modelled ablation.
Cumulative glacier-wide SMB over the period 1995–2012 simulated with the five models (coloured solid lines) for: (a) Glacier de Saint Sorlin, (b) Glacier d'Argentière, (c) Mer de Glace and (d) Glacier de Gébroulaz. Shaded areas represent the uncertainties of summer mass balance related to the accumulation error (for the sake of clarity, only uncertainties associated with the ATI model are shown). Black dots represent the cumulative measured glacier-wide SMB with cumulated uncertainties (black intervals).

Considering all four glaciers, the uncertainties in the modelled glacier-wide SMB resulting from the WSMB uncertainties were larger than the differences in ablation simulated by the different models. Consequently, it was not possible to draw conclusions concerning the performance of the melt models. In other words, a small uncertainty in WSMB leads to notable differences in the SSMB whichever melt model is used. The main reason is that changes in WSMB will affect the transition date from snow to ice, with a strong impact on albedo and associated effects on the SSMB.
5. DISCUSSION
5.1. Topographic controls on WSMB
We have shown in Section 3.2.2 that the spatial variability of WSMB is partly explained by elevation, due to the positive elevation gradient of precipitation and snowmelt events that can occur in the lower parts of the glaciers during early spring (i.e. before the WSMB measurements). This is in agreement with the results of former studies showing a positive gradient of snow depth with elevation (e.g. Rohrer and others, Reference Rohrer, Braun and Lang1994; Vincent and others, Reference Vincent, Vallon, Pinglot, Funk and Reynaud1997, Reference Vincent2007; Durand and others, Reference Durand2009; Lehning and others, Reference Lehning, Grünewald and Schirmer2011; Grünewald and others, Reference Grünewald, Bühler and Lehning2014), and this spatial distribution is quite typical for Alpine glaciers (e.g. Machguth and others, Reference Machguth, Eisen, Paul and Hoelzle2006). Nevertheless, the relationships between elevation and WSMB depend on the glacier area considered. At the scale of the accumulation area, the correlation was significant for Glacier d'Argentière, probably because both a positive gradient and a redistribution of solid precipitation from adjacent slopes increased the amount of snow. On the other hand, the correlation between WSMB and elevation was not significant in the accumulation area of Mer de Glace and Glacier de Saint-Sorlin, probably influenced by the local wind, which can affect snow depth variability. Due to these local effects, the relationships between topographic variables and WSMB were studied to better understand its spatial variability. Many studies have shown a significant correlation with topographic variables (e.g. slope and curvature) related to the spatial redistribution of snow by snowdrift and avalanches (e.g. Huss and others, Reference Huss, Bauder, Funk and Hock2008b; Grünewald and others, Reference Grünewald2013; Sold and others, Reference Sold2013; Revuelto and others, Reference Revuelto, López-Moreno, Azorin-Molina and Vicente-Serrano2014). Sold and others (Reference Sold2013) investigated an area dependent regression with elevation, curvature and slope, which performed better than the regression for the entire glacier. In particular, these authors pointed out that a linear elevation gradient is not representative of the entire glacier and that the deposition and redistribution of snow is strongly influenced by the local wind field. Huss and others (Reference Huss, Bauder, Funk and Hock2008b) suggested taking into account the spatial redistribution of snow by avalanches by decreasing accumulation linearly from 100% of rainfall to 0% between slope angles of 40°–60°. However, measurements of WSMB in steep areas are rare due to the limited portions of glaciers that present such steep slopes and because stake measurements are generally made in more accessible areas (moderate slopes). However, in our study, this limitation could explain the absence of correlation between WSMB and slope. We also tested the statistical significance of correlations with different topographic parameters but failed to find any topographic variable that explained the WSMB pattern. However, even if measurements do not cover the entire surface area of the glacier, the variability of the studied variables shown by the measurements represents the bulk of its areal extent. For instance, considering all the stakes of Glacier de Saint-Sorlin, the surface slope at the stakes ranges from 4° to 27° while for the entire glacier area the surface slope ranges from 0.5° to 57°. Steep slopes are indeed not captured by the stake network, but such steep slopes represent a small fraction of the total surface area: indeed, the ranges of slopes covered by the measurements represent 87% of the total area.
This highlights the complexity of finding a relevant model at glacier scale and confirms that the relationship between snow depth and topography is not universal (Grünewald and others, Reference Grünewald2013).
5.2. Analysis of uncertainties related to the different melt models
5.2.1. Temporal uncertainties and the equifinality problem
Several studies (Hock, Reference Hock2003; Carenzo and others, Reference Carenzo, Pellicciotti, Rimkus and Burlando2009; Gabbi and others, Reference Gabbi, Carenzo, Pellicciotti, Bauder and Funk2014) have raised the question of parameter stability over time. To study the influence of the calibration period on the simulations, we computed parameter sets for several calibration periods. These different parameter sets led to differences in the modelled ablation ranging from 0.20 to 0.44 m w.e. a−1 depending on the model used. However DD and ETI models showed higher uncertainties than the three others. From these results, we conclude that the differences in the modelled ablation related to the period used for the parameter calibration correspond to ~5–10% of the ablation.
In addition, the above quoted studies pointed out two problems that can arise when calibration is done at the seasonal scale. First, model parameters calibrated over one ablation season most probably depend on the meteorological conditions that prevailed during the season concerned. Second, several pairs of model parameters can produce very similar model performances (equifinality problem). In our study these problems were reduced by basing calibrations on a minimum period of 5 a and on numerous measurements.
Finally, Huss and others (Reference Huss, Funk and Ohmura2009) reported changes in the sensitivity of snowmelt to temperature at a multi-decadal timescale and recommended calibrating parameters using long-term datasets. Given our relatively short dataset (18 a), we are unable to draw conclusions on the long-term stability of the model parameters.
5.2.2. Spatial uncertainties related to the melt models
In Section 4.3.2, we performed a transferability analysis and concluded that, regardless of the model, the transfer of a model calibrated on one glacier to another glacier leads to an uncertainty of ~20% in the modelled ablation. This uncertainty is larger than the measurement uncertainty. No model appeared to offer better transferability than another. Carenzo and others (Reference Dozier, Green, Nolin and Painter2009) reported that the ETI model could be transferred with a maximum underestimation of melt rate of 14%; this is in agreement with our results.
In contrast with previous results (Pellicciotti and others, Reference Pellicciotti2005; Carenzo and others, Reference Carenzo, Pellicciotti, Rimkus and Burlando2009), our findings (Section 4.4.1) show that the weight given to the temperature factors in the different melt models is greater than the weight given to solar radiation when melt is calculated over large elevation ranges (see Table 5, column A). Indeed, at the glacier scale, the change in temperature associated with elevation is the main factor impacting the spatial variability of ablation. As a consequence, a variation in temperature has greater impact on the modelled melt than a variation in solar radiation. Based on analysis at an hourly scale, Pellicciotti and others (Reference Pellicciotti2005) and Carenzo and others (Reference Dozier, Green, Nolin and Painter2009) found that the ETI models are almost insensitive to variations in temperature but very sensitive to shortwave radiation variations. These authors concluded that temporal variations in turbulent fluxes and longwave radiation are of little importance compared with variations in shortwave radiation at this timescale. However, as already mentioned by Vincent and Six (Reference Vincent and Six2013), the conclusions of Pellicciotti and others (Reference Pellicciotti2005) and Carenzo and others (Reference Dozier, Green, Nolin and Painter2009) come from a statistical artefact. Indeed, both hourly melt data and shortwave radiation depend strongly on the diurnal cycle and linear correlations between these two variables are artificially high (r 2 = 0.98) and misleading.
Finally, our findings point to larger uncertainties in snowmelt sensitivity to temperature compared with ice melt (Section 3.2), suggesting larger uncertainties in the snow parameter values. These larger uncertainties are linked to the higher spatial variability of snow albedo than ice albedo, mainly due to local effects on properties such as the size and shape of the ice grains, the impurities they contain and their liquid water content (Warren, Reference Warren1982; Aoki and others, Reference Aoki, Motoyoshi, Kodama, Yasunari and Sugiura2007; Jin and others, Reference Jin, Charlock, Yang, Xie and Miller2008; Dozier and others, Reference Dozier, Green, Nolin and Painter2009; Dumont and others, Reference Dumont, Sirguey, Arnaud and Six2011).
5.3. Melt model abilities to compute SMB
Removing the impact of elevation on melt by dividing, at point scale, the ablation by the CPDD when computing the snow and ice DDF revealed a strong relationship between ice and snow DDFs and potential radiation (Fig. 3). This suggests that the spatial variability of snow and ice melt calculated at point scale strongly depends on the spatial variability of radiation fluxes. Considering a narrow range of elevation, the spatial variability of ablation is also controlled by solar radiation and temporal variability of ablation is controlled by temperature. As a consequence, temperature and potential radiation are the two main factors driving melt at these spatial scales. We showed that TI models that take these two effects into account perform better than a model based on temperature alone. However, at the glacier scale, changes in temperature related to elevation have the greatest impact on the spatial variability of ice and snowmelt. This is particularly true for glaciers that span a wide range of elevations (Heynen and others, Reference Heynen, Pellicciotti and Carenzo2013). In comparison with previous studies (Hock, Reference Hock1999; Pellicciotti and others, Reference Pellicciotti2005; Carenzo and others, Reference Carenzo, Pellicciotti, Rimkus and Burlando2009; Gabbi and others, Reference Gabbi, Carenzo, Pellicciotti, Bauder and Funk2014), we suggest that including solar radiation does not improve the performance of melt models at the glacier scale. Accordingly, when we compare the different empirical models used in this study, a DD model is sufficient for melt simulations at the glacier scale (e.g. Vincent, Reference Vincent2002).
5.4. SMB modelling over the coming decades
We investigated the performance of melt models with the aim of identifying the most appropriate model to simulate future glacier changes. Gabbi and others (Reference Gabbi, Carenzo, Pellicciotti, Bauder and Funk2014) concluded that models including solar radiation agree better with the observed changes in ice volume and concluded that ETI models are robust in time and better suited for long-term modelling than more empirical approaches (i.e. DD models), which are oversensitive to temperature fluctuations. However, here we have shown that the performance of each model cannot be assessed from glacier-wide SMB changes. Indeed, at glacier scale uncertainties in the annual SMB related to winter accumulation uncertainties exceeded the differences in modelled ablation (between the models or comparing modelled and measured ablation) irrespective, which model was used.
As a consequence, without a proper representation of winter accumulation, we cannot conclude irrespective of which model analyzed in this study is the most appropriate to simulate future glacier-wide SMB. For the same reason, the stability of the model parameters cannot be assessed from glacier-wide MB comparisons.
6. CONCLUSION
In the framework of ETI models, we investigated the sensitivity of seasonal glacier SMB to temperature, solar radiation, precipitation and topographical variables based on field measurements collected on four glaciers in the French Alps over the period 1995–2012. Regarding the WSMB, our results suggest a strong correlation between temporal changes in WSMB and inter-annual precipitation variability. The spatial changes in the WSMB are fairly well explained by elevation because of: the positive elevation gradient of precipitation; and snowmelt that occurs in the lower reaches of the glaciers during winter. The absence of correlation with other topographic variables confirms the influence of highly localized factors such as the wind field and points to the need for additional in situ measurements with a higher spatial resolution. Regarding SSMB, our study confirms that the observed temporal changes in ice and snowmelt can largely be explained by air temperature. When the temperature effect is negligible, i.e. when considering similar elevations with similar temperature values, our results suggest that the spatial variability of melt is mainly explained by solar radiation, supporting the results obtained by Vincent and Six (Reference Vincent and Six2013). Nevertheless, at the glacier scale, the change in temperature associated with elevation is the main factor that affects the spatial variability of ice and snow ablation, especially in the case of glaciers that extend over a wide range of elevations. In contrast to results obtained in previous studies (Hock, Reference Hock1999; Pellicciotti and others, Reference Pellicciotti2005; Gabbi and others, Reference Gabbi, Carenzo, Pellicciotti, Bauder and Funk2014), including solar radiation in melt models applied at the glacier scale did not improve the performance of the models. As a consequence, our results support the use of a classical DD model for long-term simulations of glacier-wide MB. Nevertheless, a study should be conducted over a longer time period to test the stability of the parameters.
Finally, our study underlines the strong impact of winter MB uncertainty on the simulated SSMB. Unlike Gabbi and others (Reference Gabbi, Carenzo, Pellicciotti, Bauder and Funk2014), we were unable to draw conclusions on melt model skills in simulating the glacier-wide MB. Indeed, taking these uncertainties into account led to a similar performance by all the models. Our study emphasizes that assessing winter MB is crucial to accurate simulations of the summer/annual MB, given the strong impact of changes in albedo on ablation. Additional studies should thus focus on the amount and spatial distribution of winter accumulation to improve glacier-wide MB simulations.
SUPPLEMENTARY MATERIAL
The supplementary material for this article can be found at https://doi.org/10.1017/jog.2016.110.
ACKNOWLEDGEMENTS
This study was conducted in the context of the French Service d'Observation GLACIOCLIM (http://www-lgge.ujf-grenoble.fr/ServiceObs/index.htm). We would like to thank everyone who helped collecting data during this glacier field campaign, and especially Bruno Jourdain. The work was made possible by the contributions of Labex OSUG@2020 (Investissements d'avenir – ANR10 LABX56) and the French Research Ministry. We are grateful to the Ministry of Economy, Trade and Industry (METI) of Japan and to the United States National Aeronautics and Space Administration (NASA) for the release of the ASTER GDEM. We thank Y. Durand, G. Giraud and S. Morin (CNRM-GAME/CEN) for providing the SAFRAN data. We also thank the scientific editor, T. Moelg and two anonymous reviewers for their comments and suggestions, which significantly improved the quality of the manuscript.


 Open access