




Introduction
Approximately 15–20 % of all grassland in Germany is used for horse grazing (Schmitz and Isselstein, Reference Schmitz and Isselstein2018), and the number of horses continues to rise both nationally and across Europe (Liljenstolpe, Reference Liljenstolpe2009; Schmitz and Isselstein, Reference Schmitz and Isselstein2018). Grasslands are among the most species-rich habitats for flora and fauna worldwide, particularly in temperate zones (Isselstein and Kayser, Reference Isselstein and Kayser2014; Petermann and Buzhdygan, Reference Petermann and Buzhdygan2021). Many of the grassland inhabiting species have adapted specifically to grassland environments and are often restricted to particular regions or grassland types (Lüscher et al., Reference Lüscher, Jeanneret, Schneider, Hector, Arndorfer, Balázs, Báldi, Bailey, Choisis, Dennis, Eiter, Elek, Fjellstad, Gillingham, Kainz, Kovács-Hostyánszki, Hülsbergen, Paoletti, Papaja-Hülsenbergen, Sarthou, Siebrecht, Wolfrum and Herzog2015) making them rare or endangered. While the term ´regioń is not used uniformly throughout the literature (Mukhopadhyay, Reference Mukhopadhyay1992; Omernik, Reference Omernik2004), we use it to refer to geographical areas that can be distinguished by their pedoclimatic conditions, agricultural structure, and management intensity. The grassland phytodiversity serves as reliable proxy for the presence and abundance of the biodiversity on different trophic levels (Koch et al., Reference Koch, Edwards, Blanckenhorn, Buholzer, Walter, Wüest and Hofer2013; Li et al., Reference Li, Schuldt, Ebeling, Eisenhauer, Huang, Albert, Albracht, Amyntas, Bonkowski, Bruelheide, Bröcher, Chesters, Chen, Chen, Chen, Ciobanu, Deng, Fornoff, Gleixner, Guo, Guo, Heintz-Buschart, Klein, Lange, Li, Li, Luo, Meyer, von Oheimb, Rutten, Scholten, Solbach, Staab, Wang, Zhang, Zhu, Schmid, Keping and Liu2024).
Several landscape- and field-scale factors are known to influence grassland phytodiversity including climate and topographic conditions (Buzhdygan et al., Reference Buzhdygan, Tietjen, Rudenko, Nikorych and Petermann2020; Gaujour et al., Reference Gaujour, Amiaud, Mignolet and Plantureux2012; Klaus et al., Reference Klaus, Jehle, Richter, Buchmann, Knop and Lüscher2023). In addition, the presence and distribution of landscape features such as hedges and tree rows also differ between regions and have been shown to affect grassland phytodiversity (Buzhdygan et al., Reference Buzhdygan, Tietjen, Rudenko, Nikorych and Petermann2020; Debinski and Holt, 2000; Gaujour et al., Reference Gaujour, Amiaud, Mignolet and Plantureux2012). Soil nutrient content and external nutrient inputs are among the field-scale factors that play a key role in shaping plant species occurrence (Wesche et al., Reference Wesche, Krause, Culmsee and Leuschner2012). High levels of nitrogen, phosphorous and potassium inputs are associated with a decrease in phytodiversity (Janssens et al., Reference Janssens, Peeters, Tallowin, Bakker, Bekker, Fillat and Oomes1998; Hejcman et al., Reference Hejcman, Klaudisova, Schellberg and Honsova2007; Kleijn et al., Reference Kleijn, Kohler, Báldi, Batáry, Concepción, Clough, Díaz, Gabriel, Holzschuh, Knop, Kovács, Marshall, Tscharntke and Verhulst2009; Klaus et al., Reference Klaus, Kleinebecker, Busch, Fischer, Hölzel, Nowak, Prati, Schäfer, Schöning, Schrumpf and Hamer2018). Conversely, species-rich grasslands are often found in low-productivity areas with nutrient-poor soils and low or no nutrient input (Fleurdean et al., Reference Fleurdean, Ruprecht, Molnár, Hutchinson and Hickler2018; Petermann and Buzhdygan, Reference Petermann and Buzhdygan2021; Riesch et al., Reference Riesch, Stroh, Tonn and Isselstein2018). Management systems and their intensity, also influence grassland phytodiversity (Jerrentrup et al., Reference Jerrentrup, Wrage-Mönnig, Röver and Isselstein2014; Tonn et al., Reference Tonn, Densing, Gabler and Isselstein2019). Grasslands that are managed more extensively with lower density of grazing animals and less defoliation frequency as well as no or less fertiliser application, have a higher potential to conserve plant and animal biodiversity and maintain ecosystem services (e.g., Fraser et al., Reference Fraser, Vallin and Roberts2022; Le Clec’h et al., Reference Le Clec’h, Finger, Buchmann, Gosal, Hörtnagl, Huguenin-Elie, Jeanneret, Lüscher, Schneider and Huber2019; Pakeman et al., Reference Pakeman, Hewison, Riach, Fisher, Hurskainen, Fielding and Mitchell2017, Reference Pakeman, Fielding, Everts and Littlewood2019) than more output-oriented systems. Unlike intensive dairy farming, which relies on homogeneous, high-yielding grasslands and large, consolidated areas, horse grazing systems often utilise smaller, fragmented grasslands with lower input levels and can sustain high phytodiversity (Huyghe et al., Reference Huyghe, De Vliegher, Van Gils and Peeters2014; Schmitz et al., Reference Schmitz, Hüppe, Recktenwald, Dingsfeld, Brinsa, Florek, Maulhardt and Isselstein2017).
At the within-field-scale, grazing systems and intensity affect biodiversity by influencing the grass sward structure (e.g., Pavlů et al., Reference Pavlů, Teowdroes, Nwaogu, Pavlů, Gaisler, Homolka and Pavlů2019; Tonn et al., Reference Tonn, Densing, Gabler and Isselstein2019). Extensive low-input grazing at low stocking rates leads to an uneven distribution of plant species composition and sward structure due to selective grazing behaviour (e.g., Adler et al., Reference Adler, Raff and Lauenroth2001; Rook and Tallowin, Reference Rook and Tallowin2003). This creates a patchy structure that generates different microhabitats and has been associated with increased species diversity compared to more homogeneous, mown grasslands (Fraser et al., Reference Fraser, Vallin and Roberts2022; Rook et al., Reference Rook, Dumont, Isselstein, Osoro, WallisDeVries, Parente and Mills2004; Tonn et al., Reference Tonn, Densing, Gabler and Isselstein2019). The extent of pasture patchiness depends on the choice of grazing animal species (Rook and Tallowin, Reference Rook and Tallowin2003) with horses as important creators of heterogeneity within pastures (Huyghe et al., Reference Huyghe, De Vliegher, Van Gils and Peeters2014; Schmitz et al., Reference Schmitz, Hüppe, Recktenwald, Dingsfeld, Brinsa, Florek, Maulhardt and Isselstein2017). From a management perspective, horses are traditionally considered difficult to manage due to their selective foraging, short biting, trampling and distinct toileting behaviour (Riehl, Reference Riehl2002; Schmitz and Isselstein, Reference Schmitz and Isselstein2020). The resulting highly patchy vegetation structure is characterised by closely grazed areas and taller, avoided, nutrient-rich areas (Chodkiewicz, Reference Chodkiewicz2019; Dumont et al., Reference Dumont, Rossignol, Loucougaray, Carrère, Chadoeuf, Fleurance, Bonis, Farruggia, Gaucherand, Ginane, Louault, Marion, Mesléard and Yavercovski2012).
Generally, short patches have been found to contain more plant species and fewer soil nutrients than tall patches (Tonn et al., Reference Tonn, Densing, Gabler and Isselstein2019). The heterogenising effect of grazing therefore stands in direct contrast to the homogenization produced by management practices like cutting (Fraser et al., Reference Fraser, Vallin and Roberts2022). While grazing-induced patchiness increases structural variability, it also causes substantial within-field variation in forage nutritive value in pastures (Siede et al., Reference Siede, Komainda, Tonn, Wolter, Schmitz and Isselstein2024; Clausecker et al., Reference Clausecker, Isselstein, Obermeyer and Komainda2025). From an agronomic perspective, this heterogeneity makes it difficult to provide consistently high-quality forage (Fleurance et al., Reference Fleurance, Farruggia, Lanore and Dumont2016; Siede et al., Reference Siede, Komainda, Tonn, Wolter, Schmitz and Isselstein2024). Horse grazing can intensify inequalities in forage quality within-fields, leading to overgrazed areas alongside rejected mature vegetation (Riehl, Reference Riehl2002). Such imbalances reduce the pasturés overall nutritional value and usability, and may increase the risk of metabolic disorders, e.g., through localized high-sugar intake on short vegetative patches (Longland and Byrd, Reference Longland and Byrd2006). Season and grass growth stage also play a role in terms of nutritive value, with the shooting stage, flowering and grain formation associated with the highest fructan (Fruc) concentrations (Kühbauch, Reference Kühbauch1972). Fruc is a reserve carbohydrate in plants and considered harmful for horse health (Dahlhoff, Reference Dahlhoff2003). Although clear species-specific effects on Fruc levels have been documented (Grässler and von Borstel, Reference Grässler and von Borstel2005), the relevance of plant species composition regarding the Fruc concentrations within mixed swards typically found under practical farming conditions remains therefore unclear. There are reservations regarding some grass species (e.g., Lolium species) in horse farming due to high Fruc concentrations, which seem be a cause for laminitis in horses (Harris et al., Reference Harris, Bailey, Elliot and Longland2006). In general, the implications of horse grazing for the forage nutritive value and nutrient distribution through animal excreta remain poorly understood and little is known about how within-field variation interacts with regional farming contexts.
Existing studies on the effects of horse grazing on botanical composition and forage nutritive value have focused on grasslands in heterogeneous landscapes with low land-use competition between intensive agricultural production and areas supporting ecosystem services (e.g., Fleurance et al., Reference Fleurance, Farruggia, Lanore and Dumont2016; Jouven et al., Reference Jouven, Vial and Fleurance2015; Schmitz and Isselstein, Reference Schmitz and Isselstein2020; Siede et al., Reference Siede, Komainda, Tonn, Wolter, Schmitz and Isselstein2024). However, regions differ in terms of landscape- and field-scale factors, as well as their interactions (Bettin et al., Reference Bettin, Komainda, Tonn and Isselstein2023; Gaujour et al., Reference Gaujour, Amiaud, Mignolet and Plantureux2012). This leaves open the question of how regional factors, such as pedoclimatic conditions and landscape heterogeneity, modulate the effects of grazing. In Germany, for instance, grassland-based livestock farming varies greatly from region to region. In addition, following the study of Socher et al. (Reference Socher, Prati, Boch, Müller, Baumbach, Gockel, Hemp, Schöning, Wells, Buscot, Kalko, Linsenmair, Schulze, Weisser and Fischer2013), the same management may lead to variable effects on grassland phytodiversity as a consequence of differences in soil type. Structural landscape differences often lead to variations in grazing management, herd size, and overall land-use intensity, which may in turn influence the spatial patch structure of grasslands. Such site- and region-specific effects on vegetation composition are also likely to influence forage quality and, more generally, the suitability of grasslands as a feed base for horses. This possible connection has hardly been empirically investigated and deserves systematic examination.
The present study, therefore, focuses on two contrasting regions in Germany: a mountainous area with lower annual precipitation and smaller farms, and a lowland area characterised by higher annual precipitation and larger farms. The aim is to understand how regional conditions and management practices influence the botanical composition and the forage nutritive value of horse grasslands used for grazing compared to cutting.
Materials and methods
Study area and design
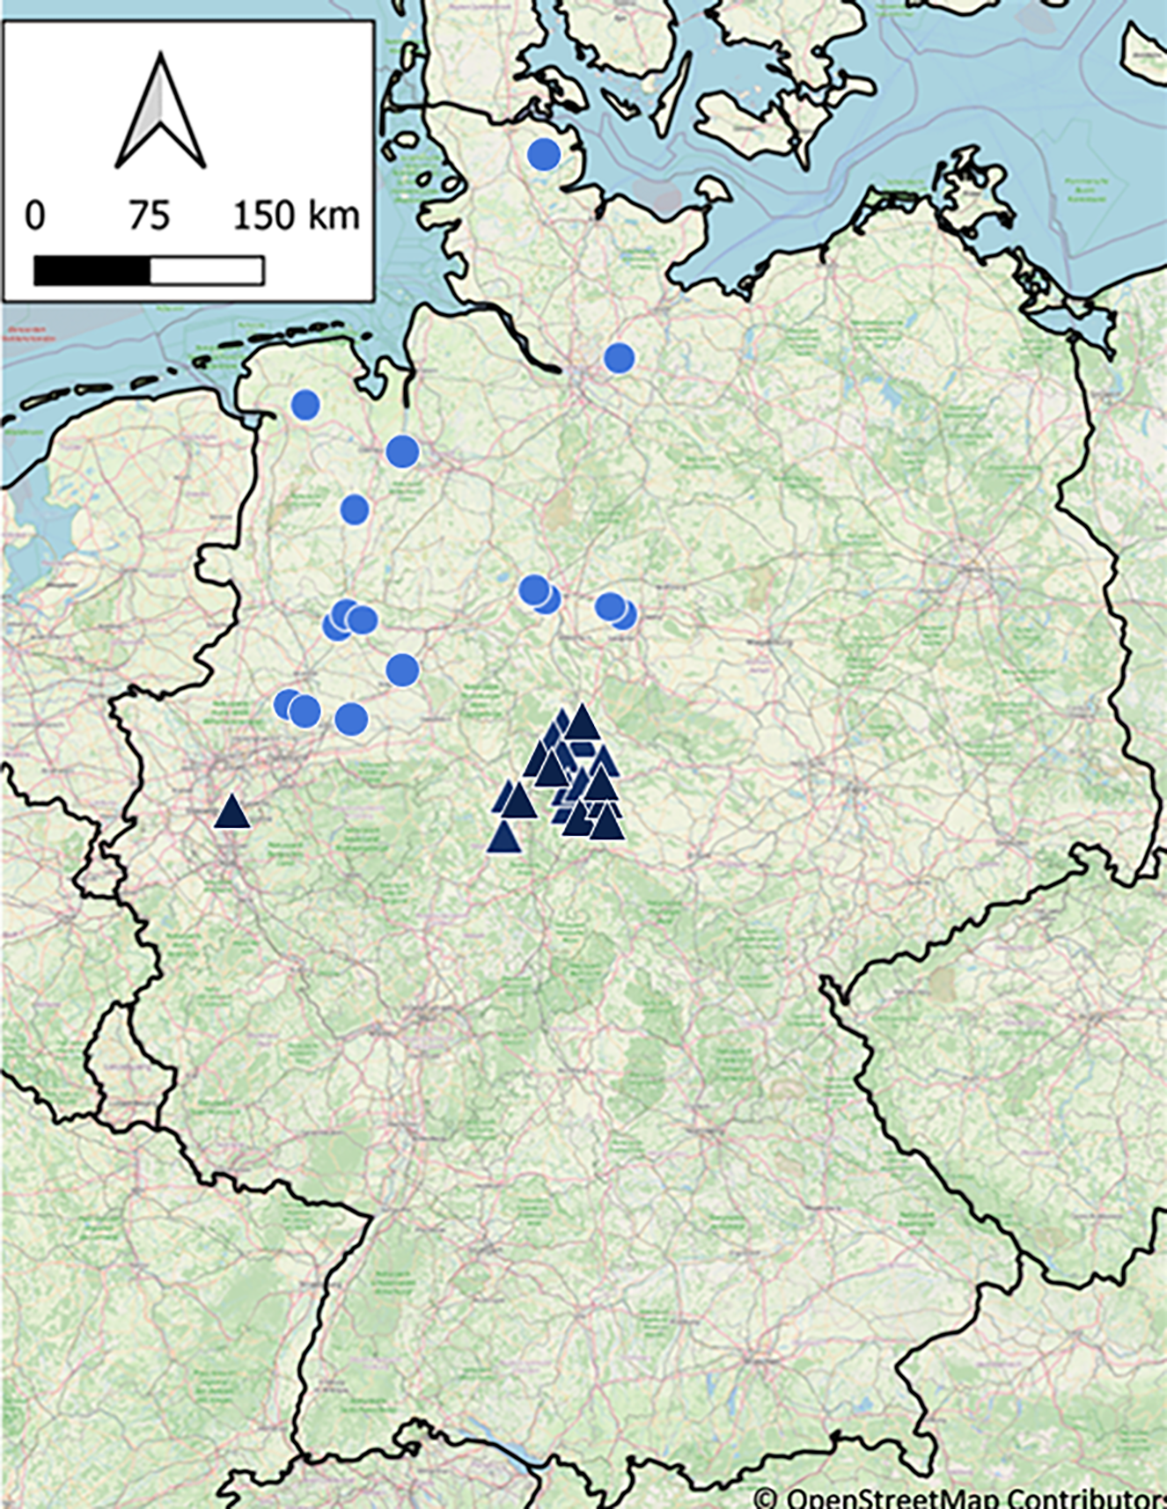
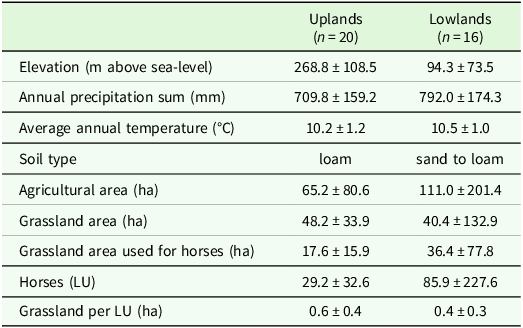
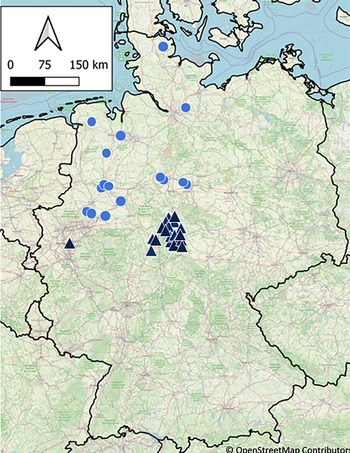
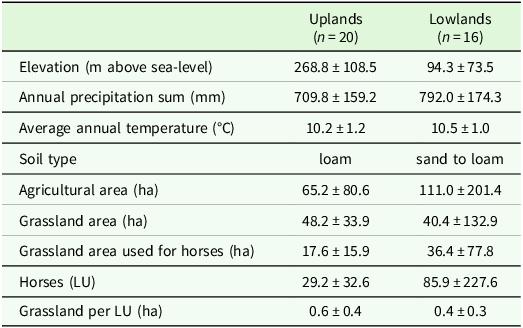
The study was conducted on 36 horse farms across two regions in Germany in the years 2023 and 2024: The Central mountain-hill range region (20 farms) and the Northwestern lowland region (16 farms) (Figure 1). The regional factor represents a composite of different pedoclimatic conditions and farm structures. The upland region is characterised by a hilly topography with a small-scale agricultural structure and a lower annual precipitation (Table 1). The soil type was mainly loam. In contrast, the lowland region consists mainly of plains with larger farm structures and a higher number of horses per farm (Table 1). The average grassland area used for horses in this region is higher, but grassland constitutes a lower proportion of the total agricultural area per farm (Table 1). The main soil type in this region was sandy to loam. All investigated farms in both regions represent semi-professional to professional horse husbandry with a minimum of four horses per farm, while small-scale hobby farms were not included.
Location of sample farms in the German uplands ( ) and the lowlands (
 ), OpenStreetMap Contributors.
Average elevation, climatic conditions (2018–2024, from closest German Weather Service Station) and structure of investigated farms, mean ± sd. LU: Livestock unit, 1 LU = 500 kg
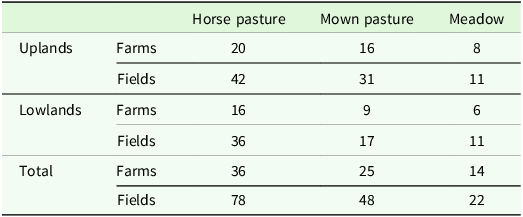
A nested stratified sampling design was applied, comprising a total of 148 grassland fields (details given in the Appendix, Table A1). On each farm, four grassland fields were investigated, representing two management types: two fields were exclusively grazed by horses and two fields were either mown or subjected to mixed management (mowing and grazing). In rare cases, horse pastures were grazed by cattle after horses (1 farm) and mown pastures were additionally grazed by cattle (1 farm) or geese (1 farm). The sampling design was not restricted to meadows that were only cut because this is not representative, as many German horse farms do not use purely cut meadows (Siede et al., Reference Siede, Komainda, Tonn, Wolter, Schmitz and Isselstein2024). Grassland systems were thus stratified into management that promotes sward heterogenization (grazing) versus sward homogenisation (mowing or combined mowing and grazing). Horse pastures were grazed for 4.5 ± 7.1 times on average per year with an average stocking density of 13.9 ± 16.6 livestock units (LU) per hectare. The horses grazed on it for 121 ± 65 days on average per year. Mown pastures were grazed for 2.5 ± 1.5 times on average per year with an average stocking density of 6.8 ± 5.4 LU per hectare and additionally cut for 1.5 ± 0.6 times per year. The horses grazed on it for 67 ± 50 days on average per year. Meadows were cut 1.8 ± 0.6 times per year on average.
Data collection
Data collection took place in May 2023 (Uplands 8 farms, Lowlands 7 farms) and May 2024 (Uplands 12 farms, Lowlands 9 farms), when the highest Fruc concentrations are expected (Dahlhoff, Reference Dahlhoff2003) and biomass accumulation typically peaks (Doležal et al., Reference Doležal, Lanta, Mudrák and Lepš2019; Hurtado-Uria et al., Reference Hurtado-Uria, Hennessy, Shalloo, Schulte, Delaby and ÓConnor2013). These differences may converge during other seasons of the year (Dahlhoff, Reference Dahlhoff2003). The interest of the current study lay in comparing regions and assessing within-site variability at a single point in time in order to detect relative effects, rather than quantifying season-long accumulated values. The data collection was conducted in two parts: (1) a structured interview with the farm manager to obtain information on farm structure and grassland management practices, and (2) a field survey. Data collection in the field was carried out by 36 trained citizen scientists, following a strict standardised protocol. Citizen scientists were instructed to visually distinguish between tall (≥10.5 cm compressed sward height) and short (≤5.5 cm compressed sward height) vegetation on pastures and mown pastures according to the concept of Ludvikova et al. (Reference Ludvíková, Pavlů, Pavlů, Gaisler and Hejcman2015). They were also trained to identify common grassland species and to use RGB photographs within the app (Flora Incognita) to either identify unknown species or verify uncertain identifications. On each of the four fields per farm, four 1 × 1 m subplots were selected: two located in short vegetation patches and two in tall vegetation patches (i.e., grazed and avoided patches in pastures). The short and tall subplots were paired and positioned 5 to 10 m apart to ensure similar environmental conditions such as soil type, moisture, slope, and exposure. For meadows, where patch types were less pronounced, the four subplots were chosen randomly but also paired and positioned 5 to 10 m apart.
Botanical composition
In each of the four 1 × 1 m subplots per field, plant species were identified and counted, and their yield proportion based on standing dry matter (DM) were estimated using the method of Klapp and Stählin (Voigtländer and Voss, Reference Vogtländer and Voss1979) following Bettin et al. (Reference Bettin, Komainda, Tonn and Isselstein2023). The DM is expressed in relation to the standing yield and not to the coverage ratio. Therefore, the DM percentages sum up to 100 %. Sampling spots were always chosen without trampling damage. The plant species richness and the yield proportion estimations per plant species were averaged per patch type (1 m2) for each field. The Shannon diversity index (H′) per subplot was calculated as follows (Magurran, Reference Magurran2003): H′ = −Σpi×ln(pi), with pi representing the relative percentage plant cover attributed to the ith investigated species. H′ quantifies the uncertainty about the identity of an individual that is randomly taken from the investigated community, with higher values indicating higher diversity and Hmax = ln (SR), with SR as species richness. The Shannon diversity values of individual subplots per patch type were subsequently averaged at the field level. Evenness was calculated as Shannon diversity divided by maximum Shannon index (Magurran, Reference Magurran2003).
Vegetation and soil sampling
Vegetation samples were collected by hand-plucking 4 to 6 handfuls of vegetation per subplot, simulating grazing by cutting at a bite height of 2 to 3 cm (Dumont et al., Reference Dumont, Rossignol, Loucougaray, Carrère, Chadoeuf, Fleurance, Bonis, Farruggia, Gaucherand, Ginane, Louault, Marion, Mesléard and Yavercovski2012; Dumont et al., Reference Dumont, Thórhallsdóttir, Farruggia and Norderhaug2013; Ménard et al., Reference Ménard, Duncan, Fleurance, Georges and Lila2002; Siede et al., Reference Siede, Juch, Pohlmann, Hamidi, Isselstein and Komainda2025). Samples from the two short and two tall patches were pooled separately within each field, resulting in two composite samples per field. All samples were dried at 60 °C for 48 h and ground to a particle size of 1 mm, in a two-step process. Crude nutrient analysis was conducted using Near-Infrared Reflectance Spectroscopy (NIRS) with a Phoenix 5000 device (Bluesun Sci, USA). Each sample was scanned twice. The concentrations of crude protein (CP), ash-free acid detergent fibre in organic matter (ADF), crude lipid (CL), crude fibre (CF), crude ash (CA), and fruc were determined. The NIRS prediction was based on a large forage calibration stored on a central server (VDLUFA Qualitätssicherung, NIRS GmbH, Kassel, Germany). The data sets for NIRS of the quality parameters CP, ADF, and CF contained 3169, 1088 and 2676 calibration samples, respectively. Standard errors of calibration for CP, ADF and CF were 0.76, 1.32 and 1.22 %, and the corresponding standard errors of cross validation were 0.77, 1.35, 0.31 and 1.24 %. Metabolisable energy (ME, MJ/kg DM) was calculated according to Wichert (Reference Wichert2011) using the following equation:
 $$ME\,\,({\rm MJ/kg\,\,DM}) = -3.54 + 0.0129 \times CP + 0.0420 \times CL \\ \,\,\,\,\,\,\,\,\,\,\,\,\,\,\,\,\,\,\,\,\,-0.0019 \times CF + 0.0185 \\ \,\,\,\,\,\,\,\,\,\,\,\,\,\,\,\,\,\,\,\,\,\,\,\,\times NfE\,\,(\rm all\,\,in\,\,g/kg\,\,DM)$$
The nitrogen-free extract (NfE) was calculated using the following equation:
 $$DM - (CA + CP + CL + CF)\,\,(\rm all\,\,in\,\,g/kg\,\,DM)$$
Soil samples were taken from the top 0 to 10 cm of each subplot and analysed for phosphorous (P) and potassium (K) (both CAL-extraction), and soil type and averaged per patch type within a field. The CAL method extracts plant-available nutrients using calcium lactate and acetic acid. Contents of P and K were determined by continuous flow analysis, coupled with a flame photometer for K or a UV/VIS spectrophotometer for P (San System, Skalar, the Netherlands). In addition, we investigated the relationship between the identity of dominant grass species in a patch and the Fruc concentration of the vegetation samples. Therefore, the samples were grouped in retrospect according to the yield proportion of the species present, and each sample was assigned to the grass species that was dominant. Due to the small sample size, species within the genius Bromus, Festuca, Lolium and Poa were pooled.
Statistical analysis
All statistical analyses were conducted using the software environment R (version 4.3.2) (R Core Team, 2023) assuming an α-level of <0.05. Linear mixed-effects-models were generated using the ‘nlme’-package (Pinheiro et al., Reference Pinheiro, Bates, DebRoy, Sarkar, Heisterkamp, Van Willigen and Ranke2023) to analyse agronomic and vegetation target variables in analyses of variance. Post hoc comparisons of means were conducted for significant influencing variables using Tukey’s HSD test in the ‘emmeans’-package (Lenth et al., Reference Lenth, Bolker, Buerkner, Giné-Vázquez, Herve, Jung, Love, Miguez, Riebl and Singmann2024). To first and overall assess the effect of management type on variability of target variables, the coefficient of variation (CV) was calculated for all parameters and all sampling points per field. Region and management type and all possible interactions were included as independent variables to analyse the CV in a first step. Farm number was treated as a random effect in all analyses. Agronomic target variables included the concentrations of CP, ADF, Fruc and ME as indicators of the forage nutritive value and the soil P and K contents as site parameters. Vegetation target variables included the SR, evenness and the percentage cover of grass per m2. Percentage grass cover values and percentage forb cover values were converted into proportions before analysis and logit-bound between 0 and 1. Due to missing data, four farms could not be included in the analysis of SR and 12 farms needed to be excluded in the analysis of evenness. The excluded farms were balanced over regions (Uplands 8 farms, Lowlands 4 farms). After verification that management affects heterogeneity in terms of CV, a second data analysis step followed, considering exclusively pastures and mown pastures. Here, the fixed and interaction effects of management, patch type and region were tested on all target variables. The patch serves as important explanatory variable for within-field heterogeneity (Clausecker et al., Reference Clausecker, Isselstein, Obermeyer and Komainda2025). Year was not included as a factor due to the snapshot design and the absence of repeated measurements.
In addition, a separate analysis was performed to investigate the relationship between dominant grass species identity and Fruc concentrations in each subplot. Differences in Fruc concentrations among dominant grass species were tested using a Kruskal-Wallis test per patch type. Furthermore, the correlation between Fruc and CP and between the proportion of Lolium species and forage Fruc concentration was assessed.
Results
Within-field variation in response to management
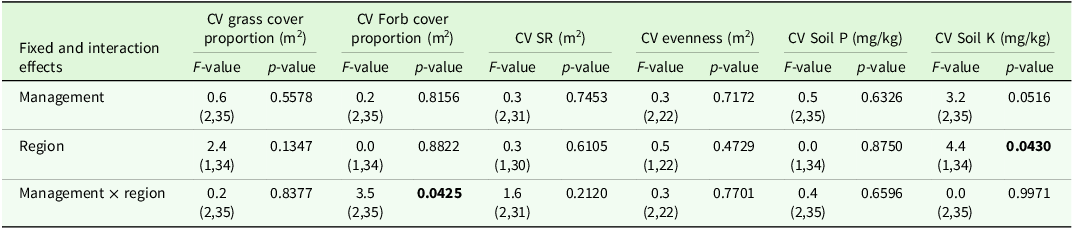
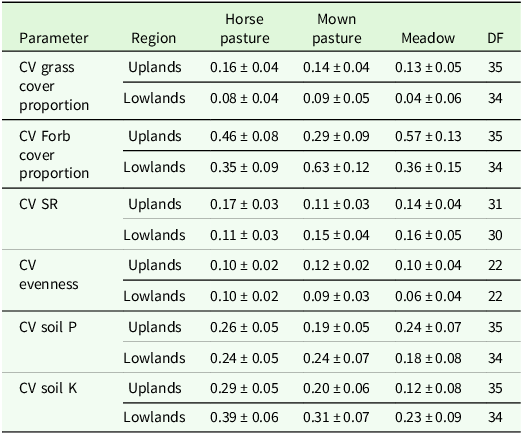
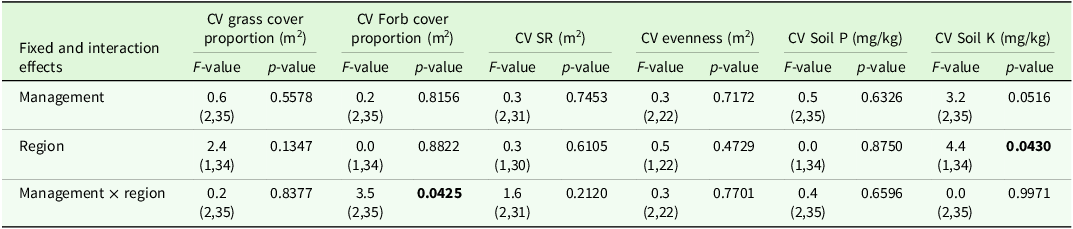
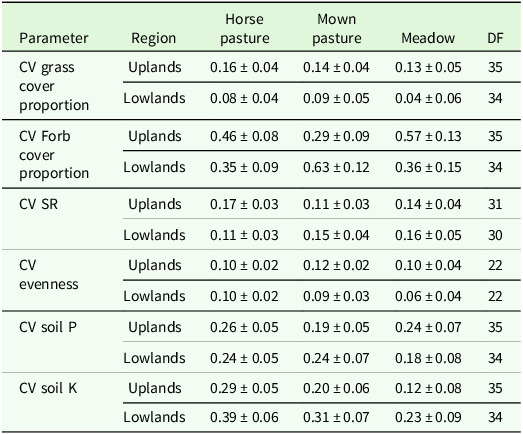
The analysis of variance for the CV indicated significant effects of region and management on some target variables (Table 2). Comparisons of means tended to show higher CVs in grazed sites compared to mown sites and these comparisons were significant for CV grass cover and CV soil K (Table 3).
Output of analyses of variance for the coefficient of variation (CV) of vegetation parameters of interest. Shown are F- and p-values for the main effects and interactions (P < 0.05 printed in bold font) of management and region. Degrees of freedom are displayed in parentheses. SR: species richness, Soil P: phosphorous content, Soil K: potassium content
Estimated means ± se of coefficient of variation (CV, unitless) of vegetation parameters of interest as affected by management type x region (SR, soil P and soil K) or the management type x region interaction. DF: degrees of freedom, SR: species richness, Soil P: phosphorous content, Soil K: potassium content
Vegetation target variables
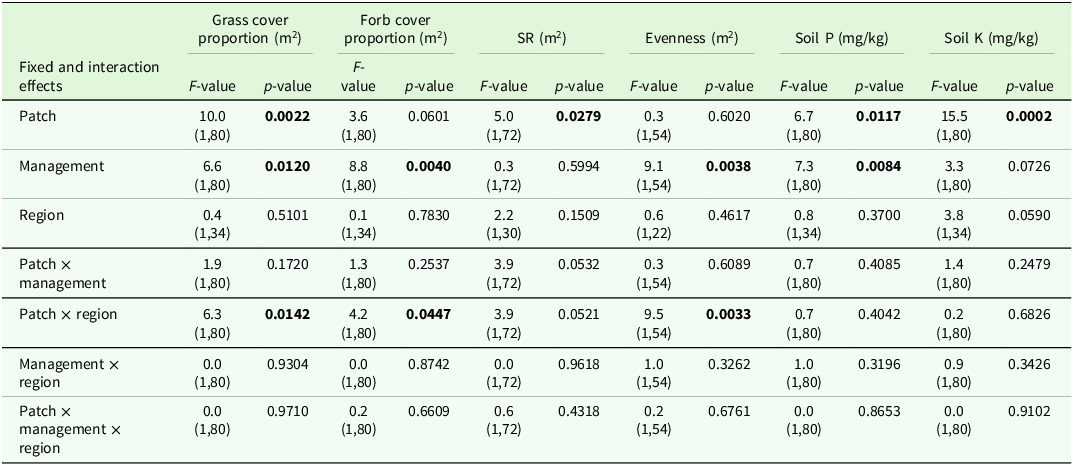
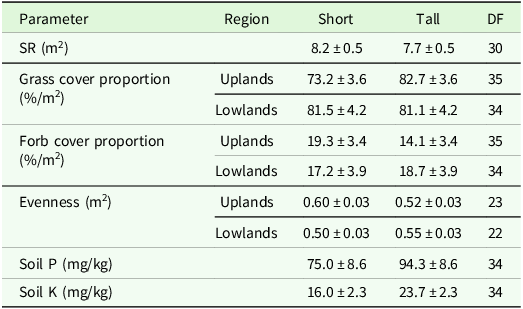
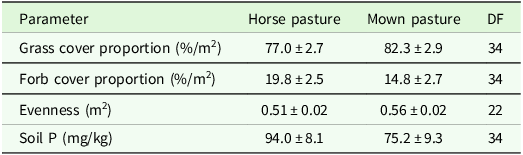
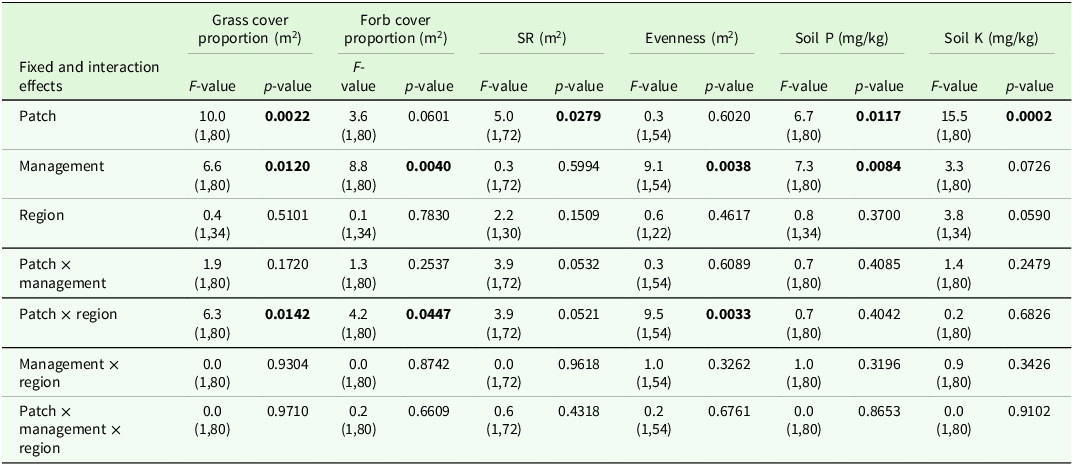
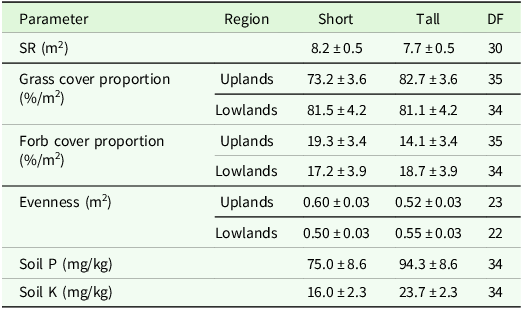
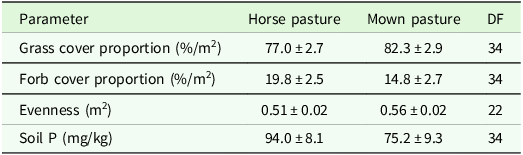
The higher variability in pastures and mown pastures can be explained by the significant interaction effect of patch type x region for evenness and grass cover percentage in the analysis of variance (Table 4). Comparisons of means showed a lower grass cover percentage, a higher forb cover proportion and a higher evenness in short patches compared to tall patches of the upland region (Table 5). In addition, the evenness of short patches was lower in the lowland compared to the upland region (Table 5). The total number of vascular plant species recorded was higher in the upland region (193 species) than in the lowland region (137 species). The main effect of patch was significant for the SR, soil P and soil K contents (Table 4). Tall patches had a lower SR and higher soil P and K contents than short patches (Table 5). The management type had a significant main effect on grass cover proportion, forb cover proportion, evenness and soil P content (Table 4). The evenness was lower in horse pasture compared to mown pasture (0.51 ± 0.02 < 0.56 ± 0.02) while the grass cover proportion was lower in horse pasture (0.77 ± 0.03 < 0.82 ± 0.03) and the forb cover proportion was higher in horse pasture (19.8 ± 2.5 > 14.8 ± 2.7; Table 6). Comparisons of means also revealed a significant difference in soil P contents among management types, with a higher value in horse pastures (horse pasture: 94.0 mg/kg, mown pasture: 75.2 mg/kg; Table 6).
Output of analyses of variance for the vegetation parameters of interest. Shown are F- and p-values for the main effects and interactions (P < 0.05 printed in bold font) of patch, management and region. Degrees of freedom are displayed in parentheses. SR: species richness, Soil P: phosphorous content, Soil K: potassium content
Estimated means ± se of different target variables as affected by patch type or the patch type x region interaction. DF: degrees of freedom, SR: species richness, Soil P: phosphorous content, Soil K: potassium content. The remaining cover proportion is legumes
Estimated means ± se of different target variables as affected by management type. DF: degrees of freedom, Soil P: phosphorous content
Agronomic target values
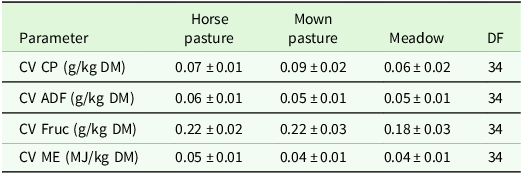
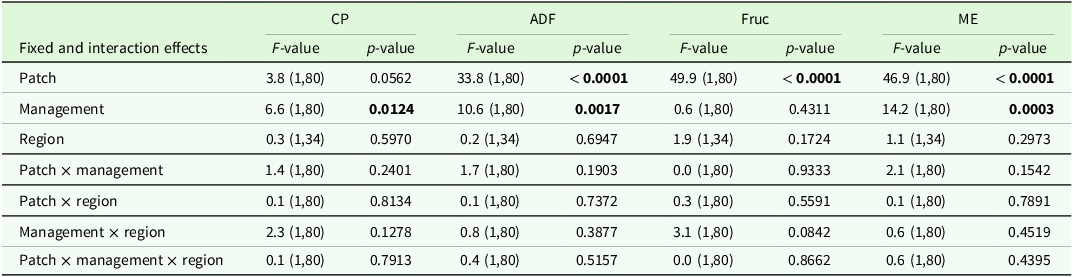
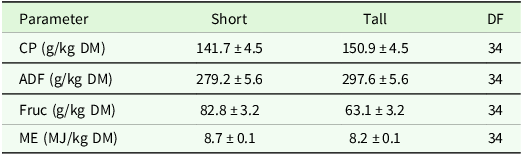
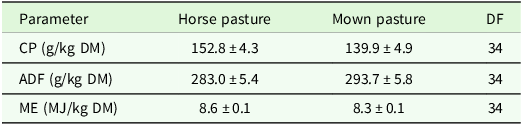
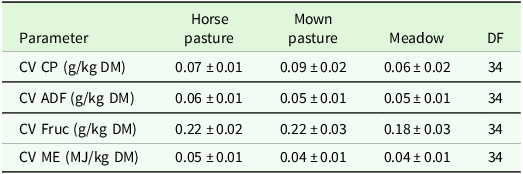
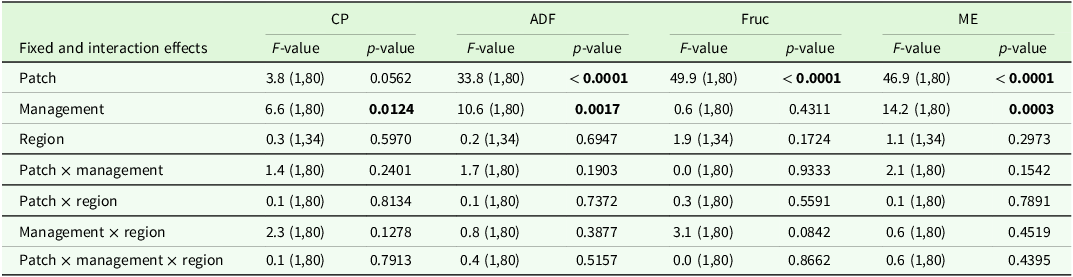
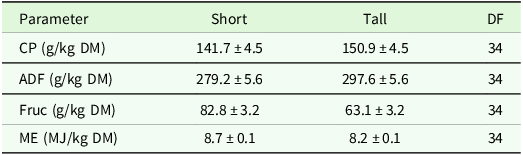
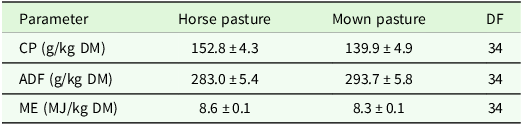
The analysis of variance for coefficients of variance of agronomic target values showed no significant differences between regions or management type, but a trend (P < 0.1) for management type in the ADF concentration (Table 7). Comparisons of means show slightly higher CV for ADF and ME in horse pasture and for Fruc in horse pasture and mown pasture (Table 8). The analysis of variance of effects on agronomic target variables showed a significant influence of patch type on all variables and of management on all variables but Fruc (Table 9). No significant interactions and no significant effect of region were found. Short patches were characterised by higher concentrations of Fruc and ME, while ADF and CP concentrations were significantly higher in tall patches compared to short patches (Table 10). Exclusively grazed horse pastures displayed significantly higher concentrations of CP and ME, along with lower concentrations of ADF compared to the grasslands under mowing or mowing combined with grazing (Table 11).
Output of analyses of variance for the coefficient of variation (CV) of agronomic target values of interest. Shown are F- and p-values for the main effects and interactions (p < 0.05) of management and region. Degrees of freedom are displayed in parentheses. CP: crude protein, ADF: acid detergent fibre in organic matter, Fruc: Fructan, ME: metabolisable energy

Estimated means ± se of coefficient of variation (CV, unitless) of forage nutritive value characteristics (CP, ADF, Fruc, ME) as affected by management type. ADF: acid detergent fibre in organic matter, CP: crude protein, DF: degrees of freedom, DM: dry matter, Fruc: Fructan, ME: metabolisable energy
Output of analyses of variance for the agronomic target values of interest. Shown are F- and p-values for the main effects and interactions (p < 0.05) of management and region. Degrees of freedom are displayed in parentheses. CP: crude protein, ADF: acid detergent fibre in organic matter, Fruc: Fructan, ME: metabolisable energy
Estimated means ± se of forage nutritive value characteristics (CP, ADF, Fruc, ME) as affected by patch type. ADF: acid detergent fibre in organic matter, CP: crude protein, DF: degrees of freedom, DM: dry matter, Fruc: Fructan, ME: metabolisable energy
Estimated means ± se as affected by management type (CP, ADF, ME). ADF: acid detergent fibre in organic matter, CP: crude protein, DF: degrees of freedom, DM: dry matter, ME: metabolisable energy
Dominant grass species and fructan concentration
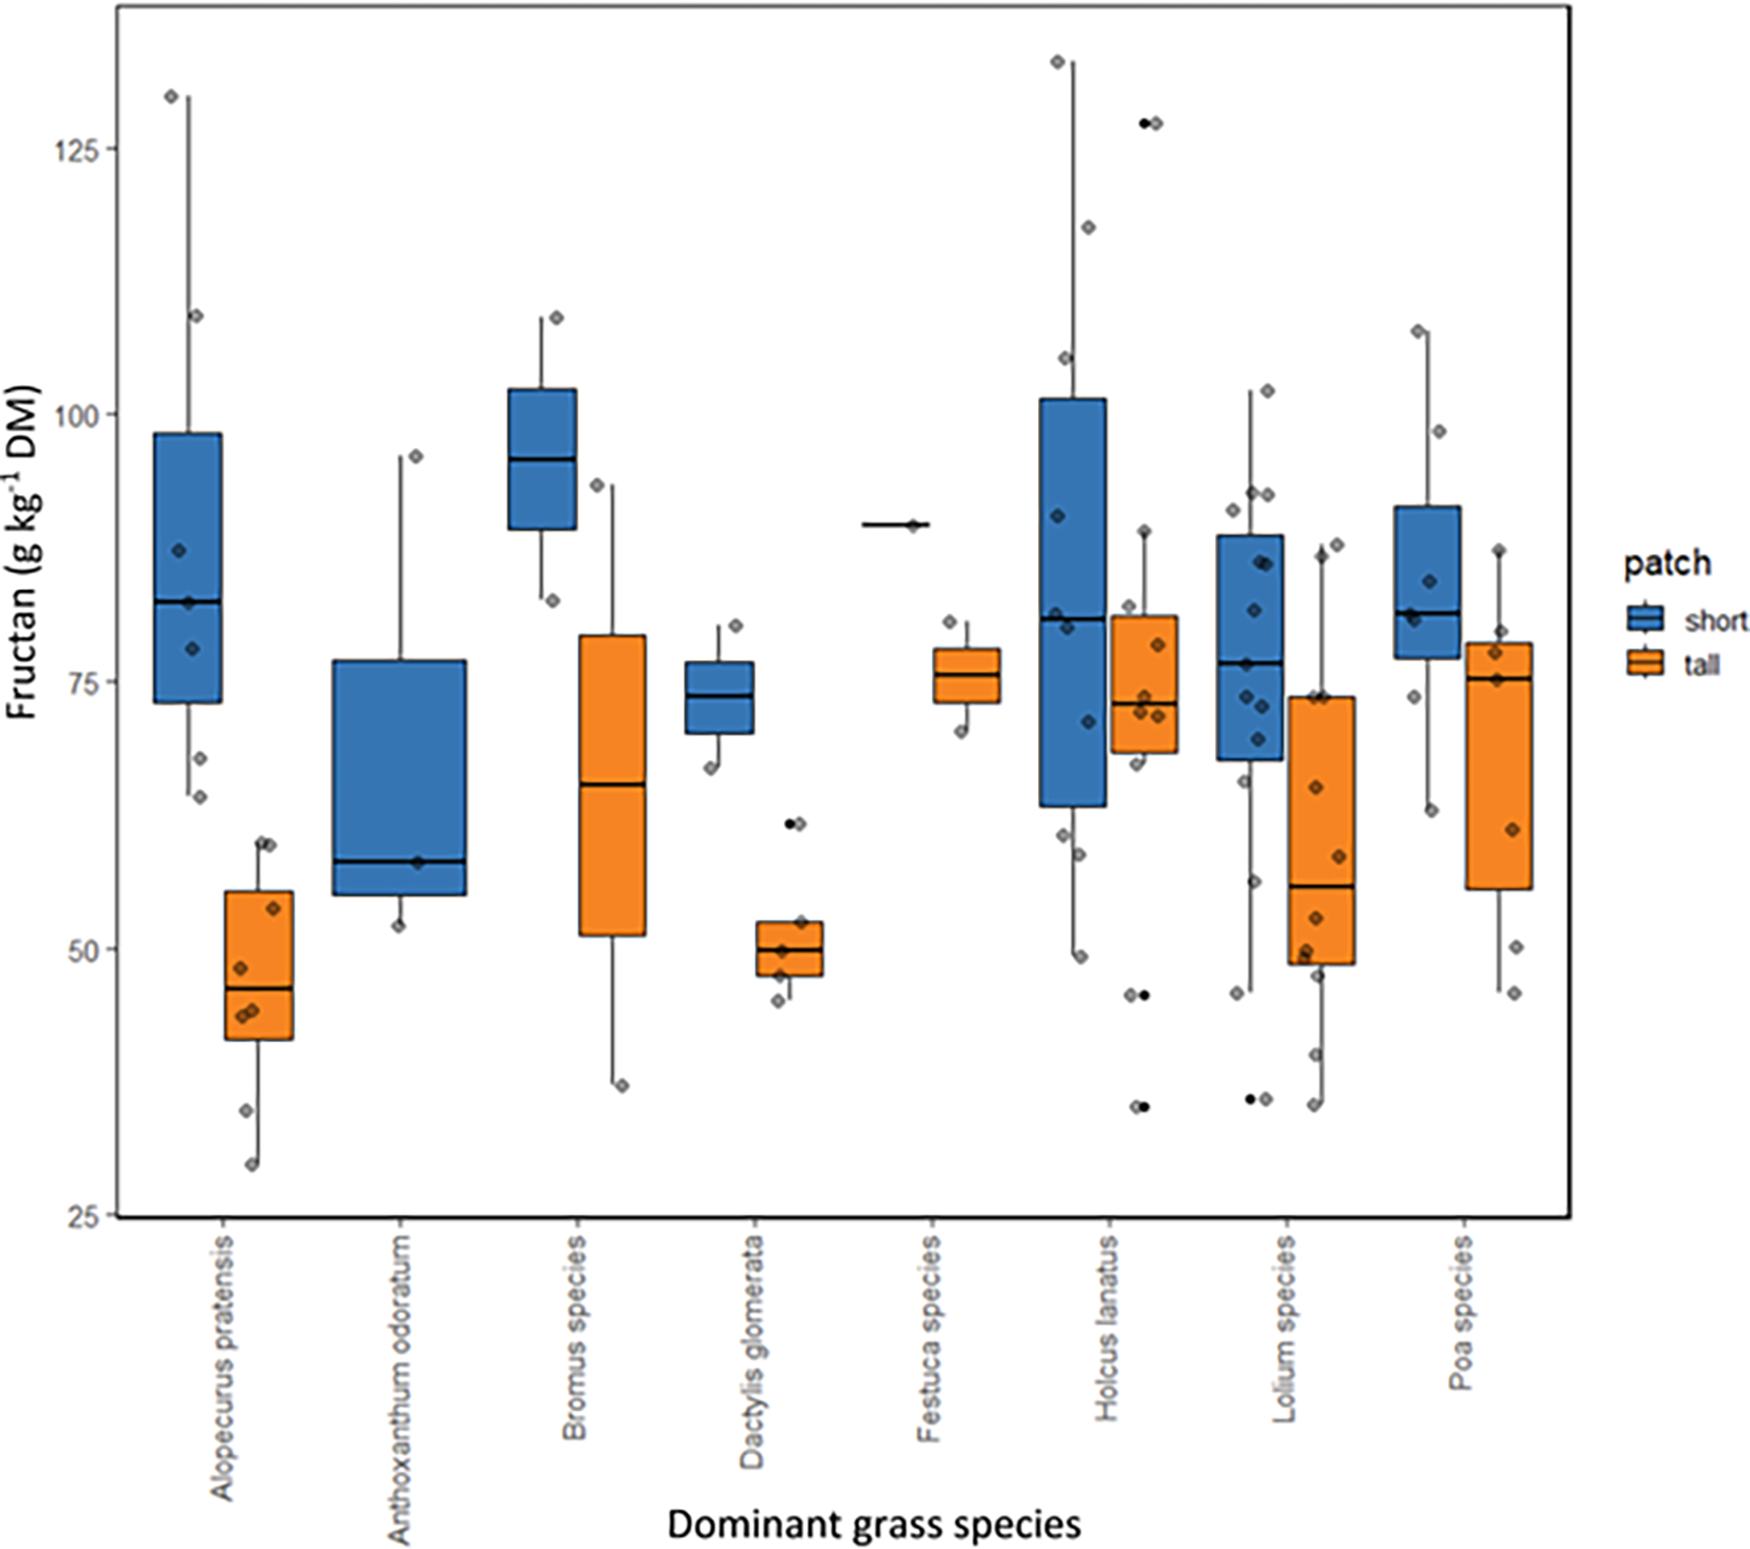
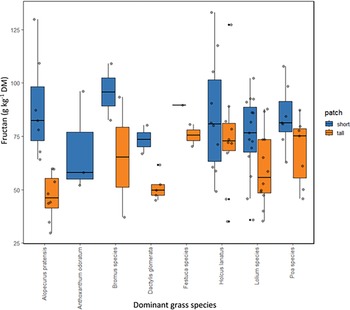
The yield proportion of the dominant grass species varied between 20.5 and 72.5 % for Alopecurus pratensis, 20.0 and 30.3 % for Anthoxanthum odoratum, 17.5 and 39.8 % for Bromus species, 12.8 and 45.0 % for Dactylis glomerata, 18.7 and 53.8 % for Festuca species, 8.0 and 50.3 % for Holcus lanatus, 13.4 and 83.4 % for Lolium species and 2.7 and 57.6 % for Poa species. The forage Fruc concentration did not differ significantly depending on the identity of the dominant grass species. The maximum Fruc concentration of 133.1 g/kg DM was found in subplots dominated by Holcus lanatus (45.0 % yield share) and the lowest Fruc concentration of 29.9 g/kg in a subplot with Alopecurus pratensis (21.5 % yield share) (Figure 2). The Kruskal-Wallis test per patch type revealed no significant differences in Fruc concentration between any of the patches with different dominant grass species.
Boxplots of fructan concentration (g/kg DM) in plots with different dominating grass species per patch type. The Kruskal-Wallis test for each patch type revealed no significant differences in fructan concentrations among patches dominated by different grass species. DM: dry matter.
Discussion
By studying grasslands used by 36 horse farms in two distinct regions of Germany, it was found that the coefficients of variation for the measured parameters were mostly lower under a more homogenising management type (meadows) than under more heterogenising management types (horse pasture and mown pasture). As a consequence, the analysis further revealed that patches in pastures (whether also mown or not) had mostly strong and significant influences on all target variables. Conversely, agronomic target values were not affected by region, but by patch and management type.
The role of sward structure and management in shaping grassland biodiversity
The higher evenness observed in short patches may be explained by the repeated grazing limiting the competitive ability of tall-growing species that would otherwise dominate due to profitable light competition (Eskelinen et al., Reference Eskelinen, Harpole, Jessen, Virtanen and Hautier2022; Spasiani et al., Reference Spasiani, Homem, de Lima, Guimarães, de Medeiros, Muir, de Oliveira, Boddey and Casagrande2023). Why this pattern is only apparent in the upland regions and not in the lowlands remains unclear, but possible explanations include differences in species composition between regions, less pronounced structural differences between short and tall patches, or regional differences in soil conditions. Soil analyses revealed consistently higher contents of P and K in tall patches, likely due to the accumulation of nutrients via animal excreta (Hunter and Bailey, Reference Hunter and Bailey2023). Horses typically avoid grazing in areas where they have defecated, which creates spatial variation in soil fertility within fields and subsequently affects plant community composition and sward structure (Aarons et al., Reference Aarons, O’Connor and Gourley2004; Kohler et al., Reference Kohler, Gillet, Gobat and Buttler2004; Pavlů et al., Reference Pavlů, Teowdroes, Nwaogu, Pavlů, Gaisler, Homolka and Pavlů2019). In the current study, horse pastures showed lower evenness in plant species composition compared to mown pastures and meadows, but no differences in SR were found. Previous studies have reported mixed effects of horse grazing on plant biodiversity in comparison with other grazing animals. For instance, Mutillod et al. (Reference Mutillod, Buisson, Tatin, Mahy, Dufrêne, Morvan, Mesléard and Dutoit2025) found higher functional richness but lower functional evenness on grasslands grazed by domestic horses compared to wild horses and sheep. Catling et al. (Reference Catling, Kostiuk and Thompson2015) observed increased evenness but no effect on SR in fields grazed by feral horses compared to non-grazed fields. Whereas Loucougaray et al. (Reference Loucougaray, Bonis and Bouzillé2004) and Mutillod et al. (Reference Mutillod, Buisson, Tatin, Mahy, Dufrêne, Mesléard and Dutoit2024) reported higher SR under horse grazing compared to cattle or sheep. In contrast, Fleurance et al. (Reference Fleurance, Sallé, Lansade, Wimel and Dumont2022) reported no significant effect of grazing by horses versus cattle on either metric. These findings underline the importance of management practices for grassland (Catorci et al., Reference Catorci, Gatti and Cesaretti2012).
Patch effect under grazing and mowing: Lack of significant interaction
Although regional differences were generally not very pronounced, some patterns suggest an interaction between regional context and vegetation structure. Stocking density is lower in the upland regions (8.1 ± 8.9 LU/ha, lowland region: 13.6 ± 14.9 LU/ha), which could allow horses greater foraging options and, consequently, a more pronounced long-term differentiation between short and tall vegetation. However, patches were the main driver of effects.
Surprisingly, no significant interaction was detected between patch type and management system for any of the measured variables. This is a notable finding, given that grazing management (e.g., by horses) is expected to intensify heterogeneity within grasslands (Rook and Tallowin, Reference Rook and Tallowin2003), thereby amplifying the effects of patches. In contrast, mowing is assumed to homogenise vegetation structure and reduce such contrasts (Fraser et al., Reference Fraser, Vallin and Roberts2022). The current findings suggest that grazing effects remain detectable even in mown pastures, indicating that horses can have a long-lasting influence on vegetation. Since a significant part of these effects are mediated through nutrient deposition, the impact of grazing can persist for several years. Furthermore, some areas classified as mown pastures or meadows may have historically been grazed. Taken together, these results imply that horse grazing leaves long-term traces in grassland vegetation and that compensatory management measures, such as intermittent mowing or topping are likely to have only a limited effect.
The current study revealed a significantly higher CP concentration in tall patches than in short ones - an unexpected result given the aforementioned findings. Both Fleurance et al. (Reference Fleurance, Farruggia, Lanore and Dumont2016) and Siede et al. (Reference Siede, Komainda, Tonn, Wolter, Schmitz and Isselstein2024) reported higher CP concentrations in short patches in horse-grazed grasslands than in tall patches. This is likely due to frequent defoliation promoting nutrient-rich regrowth and phenologically vegetative biomass. The latter study also found significant variation in CP concentration within the growing season and between farms within one region. Clausecker et al. (Reference Clausecker, Isselstein, Obermeyer and Komainda2025) also found elevated CP concentrations in short patches of cattle-grazed grasslands. One possible explanation for the opposite result lies in species-specific grazing behaviour: Horses tend to create distinct tall, ungrazed patches particularly in dung and urine zones (Chodkiewicz, Reference Chodkiewicz2019; Fleurance et al., Reference Fleurance, Sallé, Lansade, Wimel and Dumont2022; Ödberg and Francis-Smith, Reference Ödberg and Francis-Smith1976). These excreta-enriched microsites can locally increase nitrogen availability, potentially offsetting for the dilution effects associated with greater biomass accumulation (Virkajärvi et al., Reference Virkajärvi, Saarijärvi, Rinne and Saastamoinen2012). Additionally, elevated mineralisation rates in spring may further enhance nitrogen availability in these areas, amplifying CP concentrations (Peyraud and Astigarraga, Reference Peyraud and Astugarraga1998). Furthermore, the higher grass cover proportion in tall patches, particularly in the upland region, may contribute to this pattern, as grasses generally respond more strongly to nutrient inputs than dicotyledons (Wilman and Fisher, Reference Wilman and Fisher1996).
Klaus et al. (Reference Klaus, Jehle, Richter, Buchmann, Knop and Lüscher2023) demonstrated that grassland plant diversity is shaped not only by management practices, but also by indirect factors such as slope, elevation, and soil moisture at a landscape-scale. In the current study, the total number of vascular plant species recorded was higher in the upland region (193 species) than in the lowland region (137 species). Nevertheless, the results suggest that while both region and management have some influence, heterogeneity in the sward is more important in determining plant diversity in the current study under practical farming conditions.
Management and patch effect on soil P content
Higher soil P levels in horse pastures compared to mown grasslands observed in the current study support the interpretation by Dillard et al. (Reference Dillard, Wood, Wood, Feng, Owsley and Muntifering2015) that animal and pasture management has the greatest effect on soil P. Over time, repeated deposition of excreta in relatively stable locations can lead to localised P enrichment. P removal via mowing can theoretically counterbalance this accumulation, yet it is a slow process. Depending on management intensity and yield, annual P export typically ranges between 10 and 20 kg P/ha, which is modest compared to potential rates of nutrient input via grazing animals (Wendland et al., Reference Wendland, Diepolder and Capriel2012). For example, an increase of just 1 mg P per 100 g soil – corresponding to approximately 15 kg P/ha, assuming a soil bulk density of 1.5 g/cm3 and a rooting depth of 10 cm – would already approach the upper limit of what can be removed annually through mowing (Wendland et al., Reference Wendland, Diepolder and Capriel2012).
Evaluation of feed potential and implications for horse nutrition
In the following, we also evaluated the study’s results on forage nutritive value with respect to its suitability for horse feeding, a key consideration that highlights the potential trade-off between vegetation diversity and agronomic efficiency. Assuming a 500 kg horse, the daily energy requirement is approximately 53.8 MJ for maintenance, whereas a horse performing light work requires about 66.1 MJ per day (GfE, 2014). In the current study, the ME concentration was 8.7 MJ/kg DM in short patches and 8.2 MJ/kg DM in tall patches. Based on an estimated daily DM intake of 10 kg (GfE, 2014), this equates to 87 MJ and 82 MJ per day, respectively, which is above the requirement and potentially sufficient for most horses in Germany that are categorised as performing at least light work (Zasada et al., Reference Zasada, Berges, Hilgendorf and Piorr2013). In spring, when forage growth and nutrient concentrations are high, there is a heightened risk of overfeeding. Implementing measures to restrict feed intake (e.g., limiting grazing time) can help mitigate this risk. On average, an area of 0.45 ha of grassland is required to feed one horse (KTBL, 2009). In the current study, 0.6 ha of grassland on average per horse were available in the upland region, and 0.42 ha on average per horse in the lowland region. This indicates that, on average, the investigated grasslands are capable of meeting the nutritional needs of the grazing horses, and in some cases even have the potential to feed more animals without compromising the botanical benefit.
Fructan dynamics and implications for horse pasture management
Across both regions, Fruc concentrations were significantly higher in short patches than in tall ones. This pattern is particularly relevant in horse systems, given that elevated Fruc levels are associated with an increased risk of laminitis in horses (Harris et al., Reference Harris, Bailey, Elliot and Longland2006). Fruc functions as storage carbohydrate in grasses, serving as an energy reserve that buffers against environmental stress or carbon limitation (Virkajärvi et al., Reference Virkajärvi, Saarijärvi, Rinne and Saastamoinen2012). Consequently, Fruc concentrations often show a negative relationship with CP concentration (Sanada et al., Reference Sanada, Takai and Yamada2007). This trend was also evident in the current study, with a significant negative correlation (r = –0.29). While site-specific factors had some influence on Fruc concentration, the overall effect of region was secondary to vegetation structure and management. Unlike earlier studies (Grässler and von Borstel, Reference Grässler and von Borstel2005; Soufan, Reference Soufan2008), the current study found no significant correlation between the yield proportion of Lolium species and Fruc concentration (r = 0.05). However, the samples were always a mixture of species, and it was not known how the fluctuating proportion of remaining species was composed. Similarly, Gräßler and Borstel (Reference Grässler and von Borstel2005) compared the Fruc concentration of 20 different grass species, accessions and mixtures in Germany and reported the lowest Fruc concentration for Alopecurus pratensis (13 g/kg DM) in early first harvest. In contrast to the current findings, however, they observed low Fruc concentrations for Holcus lanatus (22 g/kg DM) and the highest values for Lolium perenne (up to 92 g/kg DM). Easton et al. (Reference Easton, Stewart, Lyons, Parris and Charrier2009) found Fruc concentrations up to 161 g/kg DM in spring in various ryegrass species in New Zealand. In the current study, no consistent pattern emerged between the identity of the dominant grass species and Fruc concentration. This suggests that the abundance of the dominant grass species alone may not be the primary driver of Fruc levels. Other influencing factors, such as temperature and seasonality, are likely to play a role, especially under mixed-sward field conditions (Chatterton et al., Reference Chatterton, Harrison, Bennett and Asay1989; Undersander, Reference Undersander2013).
Grazing clearly alters the composition of plant communities, which in turn affects carbohydrate and protein dynamics at the patch scale. Assuming an average horse weight of 500 kg and a daily DM intake of around 10 kg per horse per day (GfE, 2014), the estimated Fruc intake from short patches in the current study was approximately 817 g per horse per day, and about 630 g per horse per day from tall patches. Both values are well below the critical daily intake threshold of 1.5– 3.75 kg of Fruc per horse that has been reported to trigger laminitis (Crawford et al., Reference Crawford, Sepulveda, Elliott, Harris and Bailey2014; Longland and Byrd, Reference Longland and Byrd2006). Therefore, under the conditions studied, grazing on either vegetation type is unlikely to pose a significant laminitis risk from Fruc intake alone. Although, the measurements were conducted in May, a period during which energy, protein, and Fruc concentrations are typically highest within the grazing season and the risk of laminitis is high (Kagan et al., Reference Kagan, Kirch, Thatcher, Strickland, Teusch, Elvinger and Pleasant2011; Siede et al., Reference Siede, Komainda, Tonn, Wolter, Schmitz and Isselstein2024; Virkajärvi et al., Reference Virkajärvi, Saarijärvi, Rinne and Saastamoinen2012).
Study limitations, critical evaluation of the methodology and future perspectives
The current study is one of the few to apply a citizen science approach in this research context, demonstrating that such a method can yield relevant and scientifically valuable results. However, this approach also represents certain challenges. The data on the forage nutritive value represent a single point in time because sampling was only conducted once in spring. It is difficult to maintain the engagement and motivation of citizen scientists over an entire season, which often limits data collection to single time points. Consequently, the resulting dataset does not permit analysis of seasonal dynamics. However, the advantages of using a citizen science approach offset this limitation. This method has been shown to be both cost- and labour-efficient (Kosmala et al., Reference Kosmala, Wiggins, Swanson and Simmons2016; Simoniello et al., Reference Simoniello, Jencks, Lauro, Loftis, Weslawski, Deja, Forrest, Gossett, Jeries, Jensen, Kobara, Nolan, Ostrowski, Pounds, Roseman, Basco, Gosselin, Reed, Wills and Wyatt2019; Silvertown, Reference Silvertown2009), enabling data to be collected from a wide range of farms and different regions. Consequently, a large spatial area could be covered in the current study, thereby increasing the representativeness and generalizability of the findings. The success of this approach is supported by other citizen science studies about farming or biodiversity (e.g., Billaud et al., Reference Billaud, Vermeersch and Porcher2020; Dehnen-Schmutz et al., Reference Dehnen-Schmutz, Foster, Owen and Persello2016; Donnelly et al., Reference Donnelly, Crowe, Regan, Begley and Caffarra2013; Schmitz and Isselstein, Reference Schmitz and Isselstein2020), which have demonstrated that high-quality data can be obtained when participants receive prior training and follow a standardised, well-defined protocol. In the current study, this ensured consistency and reliability despite the decentralised nature of data collection.
Regarding the methodology, the somewhat stronger patch effects observed in the upland region may result from the inclusion of many fields managed as mown pastures rather than traditional meadows. In contrast to uniformly cut meadows, mown pastures can still exhibit heterogeneous vegetation patterns due to the combination of defoliation regimes and localised nutrient deposition (Socher et al., Reference Socher, Prati, Boch, Müller, Baumbach, Gockel, Hemp, Schöning, Wells, Buscot, Kalko, Linsenmair, Schulze, Weisser and Fischer2013). In addition, the following explanations may account for the absence of a patch × management interaction. Firstly, although mowing typically involves the removal of biomass, along with nutrients such as phosphorus and potassium, the actual export may be limited in extensive horse farming systems involving few cuts (Whitehead, Reference Whitehead2000). Consequently, regardless of management type, nutrient gradients between short and tall patches may remain weak. Secondly, a single-season sampling approach may not fully capture the temporal dynamics of nutrient cycling and the vegetation’s response to management, which could potentially blur any interaction effects. As the sampling was conducted in spring, before the first cut and grazing and when structural and compositional contrasts were still developing, these effects may have been underestimated (Clausecker et al., Reference Clausecker, Isselstein, Obermeyer and Komainda2025). Other possible explanations are the relatively small sample size and the considerable variability between farms.
Looking ahead, integrating remote sensing data offers a promising way to scale up. For instance, Hütt et al. (Reference Hütt, Isselstein, Komainda, Schöttker and Sturm2024) have used unmanned aerial vehicles to track biomass changes in pastures of a dairy farm. This opens up the possibility to extend the data collection spatially to larger areas, providing a valuable tool for landscape-level analysis and monitoring.
Conclusion
The current study showed that patch type and grassland management have a stronger influence than regional factors on vegetation and agronomic target values of grassland under horse farming under the current conditions reflecting the reality of horse farms in different German regions. Horse farmers should be aware of the amount of forage and the forage nutritive value of their pastures in order to provide optimal feed resources for their animals. However, this is complicated by the structural heterogeneity of horse pastures, which is why future studies should find ways to assess the dynamics and variability of horse grassland accounting for differences between short and tall patches.
Acknowledgements
We thank all participating citizen scientists for their valuable contributions to data collection. We are grateful to Jasmin Hiller, Heike Langholz, Roman Kaste, and Helena Rodemeier for their dedicated work in sample processing. Special thanks go to Dr. Peter Tillmann for his support with the NIRS analyses. Thank goes to the European Union and the Interreg programme who funded Franziska Clausecker as part of the DivGrass project 41-2-52-22.
Authors contributions
Franziska Clausecker: Data curation, formal analysis, investigation, methodology, writing – original draft, writing – review and editing.
Martin Komainda: Conceptualisation, methodology, supervision, writing – review and editing.
Friederike Riesch: Conceptualisation, methodology, supervision, writing – review and editing.
Johannes Isselstein: Conceptualisation, funding acquisition, methodology, project administration, supervision, writing – review and editing.
Funding statement
The data collection and analysis were funded by the University of Göttingen. The European Union and the Interreg programme funded Franziska Clausecker as part of the DivGrass project 41-2-52-22.
Competing interests
The authors state that they have no conflict of interest to declare.
Ethical standards
Not applicable.
Appendix
Total number of investigated farms and fields with different management in the two regions
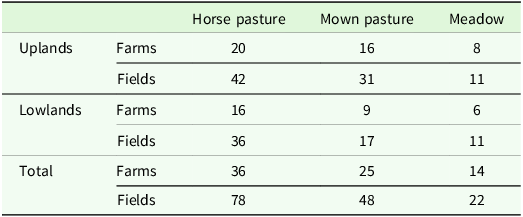
Investigated fields in total: 148.


 Open access

