INTRODUCTION
The classic access to justice narrative is a familiar one. It posits that individuals with civil legal problems are increasingly unable to afford—or find—lawyers to represent them. When they proceed pro se, these unrepresented litigants fare worse than their represented counterparts on average, raising concerns about equality before the law. Moreover, the growing number of pro se litigants imposes significant burdens on a court system already beset with expanding caseloads, shrinking budgets, and overworked staff. Calls for increased funding for legal aid, greater commitment to pro bono from the bar, and more self-help resources for the self-represented follow.
Although widely accepted, much of this narrative is being challenged in an era of renewed dedication to the empirical study of access to justice (Albiston and Sandefur Reference Albiston and Sandefur2013). For example, research on civil legal needs and dispute processing behavior undercuts assumptions about the obstacles to obtaining legal representation (Pleasance, Balmer, and Reimers Reference Pleasance, Balmer and Reimers2011; Sandefur Reference Sandefur2014, Reference Sandefur2016). Evaluations of legal interventions challenge the notion that full-service legal representation offers the only—or best—approach to enhancing access to civil justice (Greiner and Pattanayak Reference Greiner and Pattanayak2012; Sandefur and Clarke Reference Sandefur and Clarke2016). Moreover, the potential for pro bono and traditional legal aid services to address existing civil legal needs (Charn Reference Charn2009) and the efficacy of some self-help materials (Greiner, Jimenez, and Lupica Reference Greiner, Jimenez and Lupica2017) have also been called into question.
Yet empirical investigation of the most fundamental assumption of the access to justice narrative—the supposition that rates of pro se litigation are increasing—is limited. We lack comprehensive data on pro se litigation in state courts (Goldschmidt et al. Reference Goldschmidt1998; VanWormer Reference VanWormer2007; Sandefur Reference Sandefur2010), although existing evidence suggests that pro se litigation is increasing in that context (National Center for State Courts 2015; see also, e.g., Judicial Council of California 2004; New Hampshire Judicial Branch 2004). However, there is less empirical support for the assertion that pro se litigation is increasing in the federal district courts or, if it is, that it represents a change in the rate of self-representation. While scholars have assessed rates of representation in prisoner petitions (Schlanger Reference Schlanger2003, Reference Schlanger2015) and employment discrimination cases (Clermont and Schwab Reference Clermont and Schwab2004), the few studies that consider civil pro se litigation in the federal district courts more generally are limited to specific districts and narrow windows of time (Rauma and Sutelan Reference Rauma and Sutelan1996; Park Reference Park1997; Rosenbloom Reference Rosenbloom2002; Thompson Reference Thompson2010). Thus, we lack comprehensive, longitudinal analysis of civil pro se litigation in federal district courts.
This absence of empirical analysis in the context of a persistent popular narrative is consequential. Perceptions of legal phenomena are socially constructed (Haltom and McCann Reference Haltom and McCann2004) and may not comport with objective measures (Kritzer 1991; Haltom and McCann Reference Haltom and McCann2004).Without countervailing evidence, these narratives may be relied on to support legal change (Haltom and McCann Reference Haltom and McCann2004; Levy Reference Levy2013).
Indeed, there is evidence that federal courts have modified legal procedures as a result of both actual and assumed increases in pro se litigation. The Prisoner Litigation Reform Act of 1995 (PLRA), for example, was adopted to curtail inmate litigation that was largely pro se and had become more frequent in the period preceding the legislation (Schlanger Reference Schlanger2003; Struve Reference Struve2018). Around the same time, the Long Range Plan for the Federal Courts named pro se litigation more generally among its top priorities and recommended improved case management, increased staffing, and jurisdictional reforms (Judicial Conference of the United States 1995). Without assessing the continued accuracy of perceptions of increasing rates of pro se litigation, the more recent Strategic Plan for the Federal Judiciary, adopted in 2010 and updated in 2015, included similar provisions (Judicial Conference of the United States 2010, 2015). And, in 2016, the Federal Judicial Center (FJC) issued a handbook on nonprisoner pro se civil case management (Wood Reference Wood2016) that builds on studies of the impact of pro se litigation on district court staff and the measures undertaken by courts to “reduce the burden of pro se cases” (Stienstra, Bataillon, and Cantone Reference Stienstra, Bataillon and Cantone2011, v).
Thus, a contemporary empirical understanding of the scope of pro se litigation in federal court is important but absent. What makes the lack of any such analysis surprising is the fact that data on pro se litigation in federal courts have been available for a quarter century. Beginning in 1995, in response to concerns about rising rates of pro se litigation (Judicial Conference of the United States 1995), the Administrative Office of the U.S. Courts (AO) began collecting data on the presence of pro se litigants in each case filed in federal court. Summary data on the number of pro se litigants has been included in the Annual Report of the Director on the Judicial Business of the United States Courts each year since then. However, we are unaware of any synthesis of these summary data or deeper analysis using the individual filing data.
This article addresses this gap, offering a first step toward deepening our understanding of pro se litigation in federal district court. More specifically, we use data from the AO on all federal civil cases filed in district courts between 1999 and 2018 to address three questions. First, how have the rates and incidences of prisoner and nonprisoner pro se litigation changed over this period? Here we also consider the related question of whether pro se litigation is now imposing a greater burden on the judiciary. Second, for nonprisoner litigation, how does the scope of pro se litigation vary across different types of cases? To address this question, we evaluate rates of pro se litigation by jurisdictional basis and by type of case. Finally, we consider the relationship between pro se status and the trajectories of individual nonprisoner civil cases. The findings provide much-needed empirical grounding for doctrinal and policy debates regarding pro se litigation and identify important areas for future research.
The article proceeds as follows. We begin with an overview of existing research on the significance and prevalence of pro se litigation. Then, after describing the data and our analytic approach, we present the results. Finally, we discuss the implications of our findings and conclude.
EXISTING RESEARCH
Pro se litigation in the federal courts is significant for its impact on individual litigants, the development and enforcement of law, and the functioning of the federal court system. Yet, despite its import, pro se litigation in the federal courts has been largely overlooked in the empirical literature.
The Significance of Pro Se Litigation
While the Sixth Amendment guarantees individuals the right of self-representation (Faretta v. State of California 1975), pro se status is generally viewed as a function of resource constraints (Landsman Reference Landsman2012). Research on the emergence of disputes (e.g., Felstiner, Abel, and Sarat Reference Felstiner, Abel and Sarat1980–81; Miller and Sarat Reference Miller and Sarat1980–81; May and Stengel Reference May and Stengel1990) and the legal needs of individuals (e.g., Kritzer, Vidmar, and Bogart Reference Kritzer, Vidmar and Bogart1991; American Bar Association 1994; Genn Reference Genn1999) finds that individuals’ responses to legal problems vary by socioeconomic status. This includes individuals’ propensity and ability to access legal counsel, which is influenced by the capacity to pay legal fees (Yoon Reference Yoon2009; Mann and Porter Reference Mann and Porter2010; but see Kritzer Reference Kritzer2008), beliefs about lawyers’ effectiveness in resolving issues (American Bar Association 1994), familiarity with lawyers and legal institutions (May and Stengel Reference May and Stengel1990), and access to legal expertise through network ties (York Cornwell, Taylor Poppe, and Doherty Bea Reference York Cornwell, Taylor Poppe and Doherty Bea2017).
These patterns may be exacerbated by doctrinal changes that decrease the availability of legal services. Plaintiffs’ lawyers select cases with an eye toward recovering their costs (Kritzer Reference Kritzer1997) and are selective in the cases they accept (Gough Reference Gough, Lipsky, Avgar and Lamare2016). Doctrinal decisions that decrease the likelihood of success for plaintiffs pursuing federal claims (Miller Reference Miller2013) threaten the availability of legal representation. These trends, combined with increases in the cost of legal services (Hadfield Reference Hadfield2010), a decrease in the proportion of lawyer effort focused on individual rather than corporate issues (Heinz et al. Reference Heinz2005), and insufficient access to legal aid (Legal Services Corporation 2009), may contribute to the prevalence of pro se litigation, especially among disadvantaged individuals.
Exacerbating these dynamics, doctrinal decisions effectively limiting access to the federal courts may disproportionately affect pro se litigants. Many would-be litigants are diverted into a “private legal order” comprising internal grievance procedures and alternative dispute resolution forums (Edelman and Suchman Reference Edelman and Suchman1999, 943; Colvin Reference Colvin2011; Talesh Reference Talesh2013). Those whose disputes do enter the federal court system increasingly face heightened procedural obstacles that make it more difficult for them to pursue their claims, including increased pleading requirements, limitations on the scope of discovery, increased willingness to grant motions for summary judgment, and narrowed grounds for establishing personal jurisdiction (Spencer Reference Spencer2010; Miller Reference Miller2013; Subrin and Main Reference Subrin and Main2014; Chemerinsky Reference Chemerinsky2017). Pro se litigants may be especially vulnerable to these procedural obstacles (Hubbard Reference Hubbard2017).
When they do access the courts, pro se litigants lack lawyers’ relational capital, substantive legal knowledge, and familiarity with legal procedure (Sandefur Reference Sandefur2015), as well as their strategic expertise in applying this legal knowledge to unique situations (Shanahan, Carpenter, and Mark Reference Shanahan, Carpenter and Mark2016). Pro se litigants are less likely to present effective arguments and evidence and more likely to make procedural errors (Pardo and Lacey Reference Pardo and Lacey2005; American Bar Association 2010; Littwin Reference Littwin2011). Pro se status is also stigmatized in ways that may influence assessments of pro se litigants and their claims (Quintanilla, Allen, and Hirt Reference Quintanilla, Allen and Hirt2017).
These mechanisms may contribute to less favorable outcomes among pro se litigants (Engler Reference Engler2010; Sandefur Reference Sandefur2015; Taylor Poppe and Rachlinski Reference Taylor Poppe and Rachlinski2016). However, patterns of legal representation, selection effects, and unobserved variables hinder efforts to estimate the effect of self-representation (Taylor Poppe and Rachlinski Reference Taylor Poppe and Rachlinski2016). Studies employing randomization yield mixed results (Stapleton and Teitelbaum Reference Stapleton and Teitelbaum1972; Seron et al. Reference Seron, Frankel, Van Ryzin and Kovath2001; Greiner and Pattanayak Reference Greiner and Pattanayak2012; Greiner, Pattanayak, and Hennessy Reference Greiner, Pattanayak and Hennessy2012, Reference Greiner, Pattanayak and Hennessy2013), and meta-analysis suggests that the effect of self-representation differs by setting (Sandefur Reference Sandefur2015).
Yet, regardless of outcome, perceptions of procedural fairness shape assessments of the legitimacy of court decisions (Tyler Reference Tyler2006) and may differ for pro se litigants (Adler, Hensler, and Nelson Reference Adler, Hensler and Nelson1983). In addition, litigants who feel they cannot access the law because they are unable to obtain legal representation are less likely to hold favorable views of the legal system (Zimmerman and Tyler Reference Zimmerman and Tyler2010). Given that perceptions of procedural justice are important for assessments of legal institutions and willingness to comply with the law (Tyler Reference Tyler2006), pro se litigation may decrease legal legitimacy and compliance.
In addition, unequal access to legal representation may also influence the development and enforcement of law. Courts are passive, reactive institutions that can hear and decide only those cases that come before them (Fiss Reference Fiss1984). Accordingly, the implementation of law is a function of patterns of legal mobilization (Zemans Reference Zemans1982). Therefore, as inequalities in access to legal counsel shape legal mobilization, they influence the development and enforcement of law (Galanter Reference Galanter1974). The implications of these patterns may be particularly consequential in federal courts (Hammond Reference Hammond2019).
Finally, pro se litigation also has implications for court actors. Cases involving pro se litigants are perceived as imposing greater burdens on court staff (American Bar Association 2010). Restrictions on the unauthorized practice of law make it challenging for court clerks to know what information they are able to provide to pro se litigants (Rosenbloom Reference Rosenbloom2002). Judges struggle to remain neutral while also ensuring the ability of pro se litigants to access civil justice (Goldschmidt et al. Reference Goldschmidt1998). Moreover, successfully identifyting meritorious pro se claims requires significant court resources (Posner Reference Posner2017). Thus, increases in pro se litigation may threaten the efficient administration of the federal courts.
Existing Studies of Pro Se Litigation in Federal Court
Despite the potential import of pro se litigation, we know surprisingly little about its scope. Three studies offer empirical assessments of pro se litigation in federal district courts across case type, but each is limited to a single federal district: the Southern District of New York (Rosenbloom Reference Rosenbloom2002), the Northern District of California (Park Reference Park1997), or the Eastern District of Kentucky (Thompson Reference Thompson2010). Each study is also focused on a narrow time period and limited sample size. More problematic, however, is the fact that each neglects to include a control group of cases involving represented litigants. Thus, while the studies describe the causes of action brought by pro se litigants, the duration of their cases, and the case dispositions, comparisons cannot be made to the population of cases in which parties are represented.
An early analysis by the Federal Judicial Center provides a more comprehensive picture of civil pro se litigation in the ten busiest federal district courts between fiscal years 1991 and 1994 (Rauma and Sutelan Reference Rauma and Sutelan1996). That study found an overall pro se rate of 21 percent, although the rate increased from 15 percent to 24 percent over the period of the study. The study also documents variation in the rate of pro se filings across jurisdictions, from 12 percent to 33 percent among the districts observed. This raises questions about the potential variation in pro se rates across districts, a pattern documented in the criminal context by Goldschmidt and Steman (Reference Goldschmidt and Steman2015).
The study by the Federal Judicial Center and the single-jurisdiction studies reflect both stability and some variation—over time or jurisdiction—in the composition of nonprisoner pro se cases. Comparison with Rosenbloom (Reference Rosenbloom2002) is impossible given his categorization of cases, but the other three studies find that civil rights cases account for the largest share of nonprisoner pro se filings, which account for 35 to 44 percent of filings (Rauma and Sutelan Reference Rauma and Sutelan1996; Park Reference Park1997; Thompson Reference Thompson2010).Footnote 1 Contract, tort, and “other statutory claims” are the next largest sources of nonprisoner pro se litigation. Notably, Thompson (Reference Thompson2010) finds a substantial number of real property claims (16 percent of her sample), potentially reflecting the rise in foreclosures before and during the Financial Crisis.
However, the bulk of pro se cases are prisoner petitions, a result of both numerous filings and high rates of pro se status. These petitions have attracted the most attention within the limited literature on pro se civil litigation in federal courts, in part in conjunction with debates surrounding the PLRA (e.g., Schlanger Reference Schlanger2003). In her substantial analysis of the effects of the reform using AO data, Shlanger (Reference Schlanger2003, Table II.D., 1609) documents that the rate of pro se plaintiffs in inmate civil rights cases (95.6 percent) and habeas corpus cases (84.1 percent) dwarfs that observed in other types of cases: contracts (2.8 percent), non-product-liability torts (6.0 percent), product liability torts (1.5 percent), civil rights (29.8 percent), civil rights employment (20.1 percent), labor (3.9 percent), other statutory actions (6.9 percent), cases in which the United States is the plaintiff (11.17 percent), and other cases (20.9 percent). Her more recent work updates—and largerly reconfirms—these summary results (Schlanger Reference Schlanger2015). Both articles also highlight the low rate of success among pro se prisoner petitioners.
Finally, the issue of legal representation plays a tangential role in at least one other study of federal court litigation. Using data from the AO, Clermont and Schwab (Reference Clermont and Schwab2004) identify the proportion of plaintiffs in civil rights employment cases filed between 1998 and 2001 who were pro se. Interestingly, they find that the pro se rate varies substantially, from 4.9 percent to 20.76 percent, by the statute on which the cause of action was based. This raises interesting questions about the impact of legal representation on the legal theory of a case and the availability of legal representation across different types of empoyment discrimination cases.
This prior work leaves a number of questions unanswered. Is the number of pro se litigants actually increasing? If so, is this a function of growth in the total caseload, or an increase in the rate of pro se litigation? What of the burden that these cases impose on the judiciary: Is it increasing over time? If the rate of pro se litigation is increasing, is the change widespread or limited to particular kinds of cases or certain jurisdictions? Finally, is there a corresponding change in the trajectories of cases involving pro se litigants? In the next section we discuss the data and analytic approach that we use to address these questions.
DATA AND METHODS
The Administrative Office of the U.S. Courts (AO) collects data on individual civil case filings and dispositions to provide an official record of the business of the federal district courts.Footnote 2 Plaintiffs’ attorneys are required to complete a form describing their case at filing. The Federal Judicial Center assembles these data and generates a unified longitudinal database of civil case filings and terminations in district courts. We use this comprehensive longitudinal database, containing the universe of civil case filings and terminations in federal district courts, to address our research questions.
While the AO database has several technical drawbacks that must be accounted for,Footnote 3 it remains unique in its size and scope. It contains filing and termination dates,Footnote 4 the nature of suit or subject matter of the case (chosen from 125 fixed categories),Footnote 5 the jurisdictional basis of the case, the cause of action (the title and section of the U.S. Civil Statute under which the case was filed), the type and amount of damages claimed, the procedural stage of the case at termination, the procedural method of disposition, and the type and amount of damages awarded along with the prevailing party, if relevant. In addition, the AO database includes the class action status and other case attributes.
Most important for our research, the data include the pro se representation status of defendants and plaintiffs upon intake. While the complete AO database contains information on the universe of civil cases filed and disposed in federal district courts from 1979 through December 2018, the AO only began collecting data on pro se litigants in October 1995. Wide variation in the rates of pro se litigation reported in the following years suggest that the coding change may not have been implemented immediately in all jurisdictions.Footnote 6 For that reason, we restrict our analysis to cases filed between January 1999 and December 2018 (N = 5,456,372). As a result, our data obviously cannot test for or identify notable historical trends in pro se litigation occurring prior to 1999; however, the stated twenty-year period enables us to investigate contemporary trends in pro se litigation.
It is important to be clear that even within this twenty-year period, the information collected about litigants’ use of lawyers is limited. Our analyses rely on the PROSE variable, which indicates the presence of an unrepresented plaintiff, the presence of an unrepresented defendant, the presence of unrepresented plaintiff(s) and defendant(s), or the presence of only represented litigants at the time of filing. It does not allow us to distinguish between litigants who are unrepresented during the entirety of their case, those who obtain representation at some point, and those who have representation at filing but ultimately pursue their case pro se. In cases with multiple plaintiffs or defendants, it also does not indicate which plaintiff or defendant (or how many of the plaintiffs or defendants) are unrepresented.
Using these data, we investigate multiple questions about pro se litigants in federal courts. First, we investigate the scope of self-representation in federal courts over time as measured by the total volume, proportion, and judicial burden of cases involving at least one pro se litigant. This allows us to consider the extent to which the perceived rise in pro se litigants reflects general trends in federal court case filings. We then focus on variation in self-representation across different types of cases, describing dispute-based patterns of self-representation. Next, we consider variation in rates of pro se litigation across federal district court jurisdictions. Finally, we consider whether the trajectories of cases involving pro se litigants vary from those in which all parties are represented. We do so by assessing the relationship between pro se status and type of disposition, win rates at trial, and median amount awarded to successful plaintiffs.
RESULTS
The Scope of Pro Se Litigation over Time
Between 1999 and 2018, over 1,517,000 federal district court cases, or 28 percent of all cases filed, involved at least one pro se party. Although pro se litigation may involve only pro se plaintiffs, only pro se defendants, or at least one pro se plaintiff and defendant, we find that cases involving only pro se plaintiffs are the most common form of pro se litigation (see Figure 1). Indeed, cases involving pro se plaintiffs account for 91.2 percent of all pro se litigation, or 25.4 percent of total filings, during the period studied. In contrast, cases involving at least one pro se defendant and cases with at least one pro se party on both sides account for just 2.1 and 0.3 percent of total filings, respectively. While it is generally known that pro se plaintiffs account for a higher percentage of pro se litigation, our results show that cases involving pro se plaintiffs are more than ten times as prevalent as cases with pro se defendants.
Rate of Pro Se Litigation, by Pro Se Status and Year of Filing.

As Figure 2 illustrates, the volume and proportion of cases involving at least one pro se party remained stable over the observed twenty-year period. While the volume of pro se litigation fluctuates somewhat over time, there is no evidence of a steady increase or decrease. Indeed, comparing 1999 and 2018, one finds little movement in either the prevalence or rate of pro se litigation. In 1999, 74,074 cases, or 28.6 percent of all cases filed, involved at least one pro se party, while in 2018, 75,377 cases, or nearly 27.0 percent of cases, involved at least one pro se party. There are two points at which the rate of pro se litigation deviates from the relatively steady trend (see Figure 1), but only one—the increase in the rate of pro se litigation in 2016—is a function of variation in the prevalence of cases involving pro se litigants. We discuss the explanation for this anomaly below.
Count of Federal District Court Filings, by Pro Se Status and Year of Filing.

Thus, as an initial matter, we find little evidence of a lasting pro se explosion measured in absolute number or proportion of filings since 1999. Indeed, while no trend is visually apparent in Figure 1, we tested whether there is a monotonic trend of rates of pro se filings over time using the Mann-Kendall test (Mann Reference Mann1945). When testing whether pro se filings as a proportion of total filings increased or decreased through time, the Mann-Kendall test failed to identify any trend different from zero. Thus, we find no support for the claim that pro se filings have been increasing over time from Figure 1.
This holds true even when looking at the burden pro se cases impose on the federal judiciary. The Federal Judicial Center assigns a case weight to every type of case (equal to the nature of suit codes) filed in federal district courts, which is a function of the average number of minutes of a judge’s time consumed by that type of case.Footnote 7 By multiplying each case filed in a given year by the case weight assigned to the nature of suit code, we are able to estimate the total burden imposed on the court system in a given year. Figure 3 shows the percentage of the aggregate judicial workload attributable to pro se cases over time. The figure documents a clear pattern: Pro se cases represent just under one-fourth of the total judicial workload with little yearly variation between 1999 and 2018. Throughout the observed twenty-year period, the proportion of pro se cases by volume (approximately 28 percent) is 20 percent higher than the proportion of the total judicial burden attributed to pro se cases (approximately 23 percent). This suggests that pro se cases, on average, are types of cases that consume less judicial time than those in which all parties are represented. Here, again, a Mann-Kendall test did not identify any statistically significant time trend. Thus, again, we find no evidence to support the claim that pro se cases represent an increasing burden on the federal courts in recent years.
Percentage of Federal District Court Workload Generated by Pro Se Litigation, by Year of Filing.

Prisoner and Nonprisoner Pro Se Litigation over Time
It is possible that these summary results hide important variation across different types of cases. Consistent with prior studies highlighting the dramatically heightened rate of pro se litigation among prisoner petitions, we first divide cases on this basis. Following Schlanger (Reference Schlanger2003), we include within prisoner litigation cases seeking to vacate sentences, requesting mandamus relief, challenging prison conditions or the imposition of the death penalty, and raising prisoner civil rights claims.Footnote 8 These cases account for approximately 21 percent of all dispositions but over two-thirds, or 67 percent, of cases involving a pro se litigant. Figure 4 brings into sharp relief the disparity in pro se rates between prisoner and nonprisoner federal district court cases.
Rate of Pro Se Litigation among Prisoner and Nonprisoner Cases, by Year of Filing.
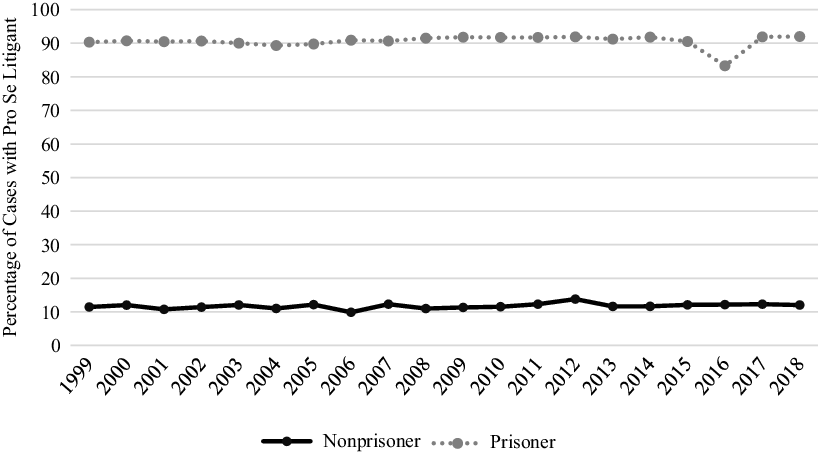
The rate of pro se litigation in prisoner cases remained remarkably consistent from 1999 to 2018, generally staying within a range bounded by 89 and 92 percent (see Figure 4). The year 2016 is an outlier in terms of prisoner pro se cases, with only 83 percent of prisoner cases involving at least one pro se litigant that year. However, this is a function of a 500 percent increase over the year prior in motions to vacate sentence, triggered by the Supreme Court’s decision in Welch v. United States (2016).Footnote 9 Prisoner filings, and the rate of pro se litigation, returned to more consistent levels in 2017 and remained stable in 2018. Underlying the aggregate results, we observe variation in rates of pro se litigation by basis of claim. Most notably, approximately 95 percent of prisoner claims involving prisoner conditions and civil rights proceeded pro se. In contrast, an average of only 14 percent of death penalty cases involve pro se litigants.
We next turn our attention to nonprisoner civil cases. Rates of self-representation among nonprisoners were relatively stable over the period observed. Between 1999 and 2018, the rate of nonprisoner federal cases involving at least one pro se party averaged 11.7 percent, ranging from 9.9 in 2006 to 13.8 percent in 2012 (see Figure 4). Confirming the visual impression of Figure 4, we failed to identify any statistically significant nonzero trend using a Mann-Kendall test for either prisoner or nonprisoner rates of pro se filings over time. To assess whether these findings vary among particular groups of cases, we report rates of pro se litigation by jurisdictional basis, type of case, and circuit of filing.
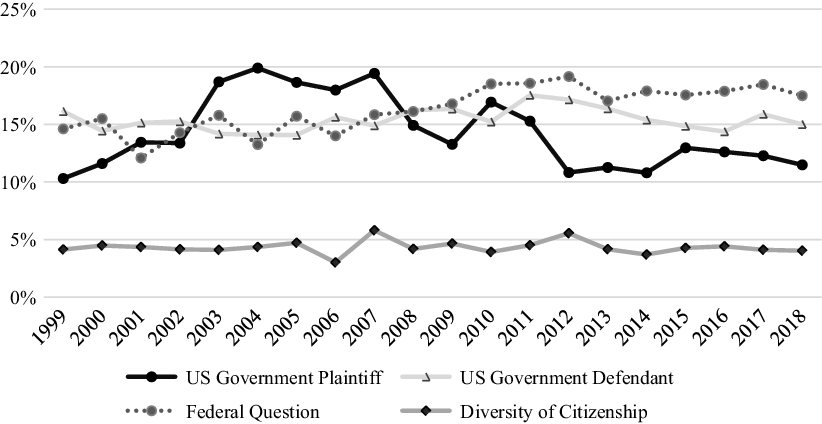
We first consider how pro se status varies with jurisdictional basis: United States as plaintiff, United States as defendant, federal question, and diversity of citizenship. In Figure 5, we find that rates of pro se litigation among cases in which the United States is a party and in those involving a federal question hover at around 15 percent. Rates of pro se litigation are noticeably lower among diversity-of-citizenship cases. Given that diversity jurisdiction cases often share more in common with cases in state court, where increases in pro se litigation have been most profound, this result is informative. Using a Mann-Kendall analysis, we did not identify any significant nonzero trend in the data presented in Figure 5, with the exception of a statistically significant (p < .01) increasing trend over time in the proportion of suits filed raising federal questions that involve pro se litigants. While statistically significant, the practical significance is small; indeed, the estimated slope of the trend line is equivalent to a yearly increase of 0.26 percent (or B = 0.0026) in the rate of pro se filings among claims raising federal questions.
Rates of Pro Se Litigation among Nonprisoner Cases by Jurisdictional Basis and Year of Filing.
We also find evidence of variation in rates of pro se litigation by type of case. Figure 6 presents the average rate of pro se litigation across categories of nonprisoner cases. We find that these patterns remain fairly stable over time. Consistent with earlier research, we document the highest rates of pro se litigation among civil rights cases, with 33 percent of nonemployment civil rights cases and 20 percent of employment civil rights cases involving at least one pro se party. By contrast, only 2 percent of torts product liability cases involve a pro se party. This allocation of legal services reflects the incentive structures that direct lawyers’ work (Hadfield 2000) and raises important questions about the efficacy of policy interventions designed to encourage private enforcement.
Average Rate of Pro Se Litigation among Nonprisoner Cases, by Category of Case.

Along with variation by type of case, we also find that rates of pro se litigation vary by federal circuit of filing. Scholars and policy makers have become increasingly concerned by geographic variation in access to legal representation (e.g., National Center for Access to Justice 2016; Law Society 2016), and the resources available to pro se litigants are known to vary by federal district (Stienstra, Bataillon, and Cantone Reference Stienstra, Bataillon and Cantone2011). Comparing average rates of pro se litigation by circuit, we find that the Third Circuit has a relatively low rate of nonprisoner pro se litigation: 7.0 percent for cases filed between 1999 and 2018. In contrast, the D.C. and Ninth Circuits have higher rates of pro se litigation, averaging 27.2 percent and 15.2 percent, respectively.
Figure 7 depicts the percentage of nonprisoner cases that involved at least one pro se litigant, by circuit and year of filing. With the exception of the D.C. Circuit, rates of pro se litigation by circuit do not follow a clear increasing or decreasing trend over time. However, the D.C. Circuit is not only an outlier in terms of the rate of pro se litigation, but the pattern over time. Forty-six percent of nonprisoner cases filed in the D.C. Circuit in 1999 involved at least one pro se party; by 2018, this rate had dropped to just under 22 percent, a 52.6 percent decrease. The unusually high rate of pro se litigation in the D.C. Circuit in 1999 and 2000 can be attributed to a relatively high volume of actions to collect on defaulted student loans (nature of suit code 152: Recovery of Defaulted Student Loans), which are associated with high rates of pro se representation.Footnote 10 Although the number of cases filed annually in the D.C. Circuit is smaller than in some other jurisdictions, the high rate of pro se representation in the circuit does not appear to be the result of wide variation within a small sample. While we reiterate that the D.C. Circuit is unique, using a Mann-Kendall test we did identify a statistically significant (p < .05) decreasing trend in the D.C. Circuit’s rate of pro se filings over time. However, this decreasing trend continues to upend the conventional wisdom that pro se litigation is increasing over time.
Rates of Nonprisoner Pro Se Litigation, by Circuit of Filing and Filing Year.

These bivariate descriptive analyses offer new insights into the scope of pro se litigation over time, by case type, and by jurisdiction. We next offer a statistical model of the probability that a case involves at least one pro se litigant. Table 1 reports the estimated odds ratios from a series of logistic regression models predicting the presence of at least one pro se litigant, taking into account year of filing, case type, and circuit of filing. A logistic regression offers an additional parametric test to identify trends over time. Models 1, 2, 3, and 4 suggest an increase in the odds of pro se litigation over time after adjusting for case type, circuit of filing, and jurisdictional basis, which are all significant below the p < .01 level. However, what is more striking than the statistically significant coefficient for filing year is the limited magnitude of the relationship between filing year and the odds of a case involving a pro se litigant. Given the large sample size and the variation evident in the descriptive data provided above, it is not surprising that the relationship is statistically significant. However, the practical interpretation of the coefficient, that a one-year increase is associated with a fraction of a 1 percent increase in the odds of a case filed involving pro se litigants, is inconsistent with perceptions of a dramatic increase in pro se litigation.
Odds Ratios from Logistic Regression Model Predicting the Presence of at Least One Pro Se Litigant among Nonprisoner Cases

The Trajectory of Pro Se Litigation
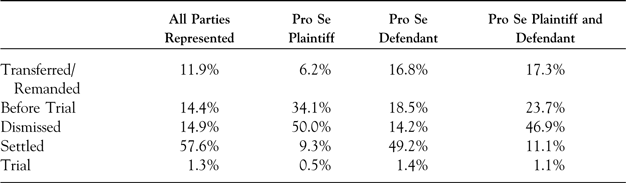
We next turn to the trajectory of cases involving pro se litigants. To begin, Table 2 indicates the percentage of cases that were transferred or remanded, terminated by adjudication of pretrial motion, dismissed, settled, or advanced to trial, by pro se status.Footnote 11 There is significant variation in how cases are disposed between cases involving at least one pro se litigant and those in which all parties are represented. Most notably, we find, consistent with other research on pro se litigation, that cases involving pro se plaintiffs are more frequently disposed before trial, relative to cases in which both parties are represented. Indeed, only 0.5 percent of cases involving a pro se plaintiff reach a jury or bench trial, compared to 1.1 percent of cases where both parties are represented by counsel, 1.4 percent of cases where only the defendant is pro se, and 1.3 percent where both plaintiff and defendant represent themselves pro se. Cases involving pro se plaintiffs are associated with higher rates of termination by pretrial adjudication, higher rates of dismissals, and lower rates of settlement. Cases involving pro se defendants have a similar disposition pattern to cases where all parties are represented; however, cases involving pro se defendants are slightly more likely to be transferred or remanded, terminated by pretrial motion adjudication, and tried relative to cases where no party is pro se.
Proportion of Cases Terminated at Various Procedural Points, by Presence and Role of Pro Se Litigant

We also find disparities in win rates by pro se status among those cases that proceed to trial. Table 3 indicates the percentage of cases won by the plaintiff and the median monetary amount awarded, if any, for each type of case, by the presence and role of pro se litigants. While the small number of cases in some categories requires caution in interpreting results, we find that win rates in cases where plaintiffs are represented by counsel are approximately 300 percent greater than those for cases involving pro se plaintiffs. Indeed, in every case category, win rates are lower among cases involving pro se plaintiffs relative to pro se defendants or where all parties are represented by counsel.
Percent of Plaintiff Wins at Trial and Median Award Amount, by Case Type and Pro Se Status
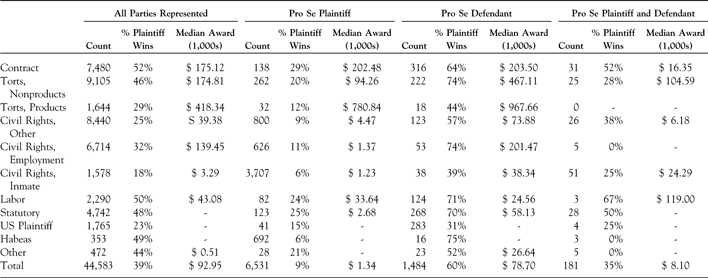
Finally, we also consider the amount of damages awarded in cases involving pro se litigants among those cases where the plaintiff won at trial (see Table 3). While the median award amount for plaintiffs in cases where both parties are represented is $92,950, it is only $1,340 for cases with at least one pro se plaintiff.Footnote 12 Trials involving a represented plaintiff and at least one pro se defendant result in a median award amount of $78,700. The median monetary damages awarded to plaintiffs where both plaintiff and defendant proceed pro se is $8,100 during the study period.
Thus, we find that the trajectories of cases involving pro se litigants differ, with pro se status associated with earlier dispositions, less favorable win rates, and less favorable award amounts for both plaintiffs and defendants. However, we are unable to control for unobserved case characteristics or selection effects in these descriptive analyses. Thus, further empirical investigation of the causes of observed variation is necessary. In short, we can confidently report that pro se representation is associated with inferior outcomes for the pro se party; however, future scholars should endeavor to explain why this is the case and why plaintiff pro se status is associated with more negative outcomes relative to defendant pro se status.
DISCUSSION AND CONCLUSION
While pro se litigation has long presented challenges to our adversarial system, attention to the topic is particularly timely. Recent doctrinal decisions that make it more difficult to access the federal courts (e.g., Subrin and Main Reference Subrin and Main2014) may be particularly consequential for pro se litigants (Hubbard Reference Hubbard2017). At the same time, debates among scholars and practitioners about the desirability of a civil Gideon right to legal representation have intensified as funding support for legal aid has declined (Abel Reference Abel2006; Barton and Bibas Reference Barton and Bibas2012) and government commitment to the topic has diminished (Benner Reference Benner2018). There is also a growing interest in the use of rigorous empirical methods to assess the effectiveness of various interventions aimed at assisting pro se litigants (Sandefur and Smyth Reference Sandefur and Smyth2011; Albiston and Sandefur Reference Albiston and Sandefur2013; Sandefur and Clarke Reference Sandefur and Clarke2016; Greiner, Jimenez, and Lupica Reference Greiner, Jimenez and Lupica2017).
As a foundational matter, however, assessing the impact of doctrinal reforms on pro se litigants and developing appropriate policy interventions require a deeper understanding of the scope of pro se litigation. In this study, we take a first step toward addressing this need by presenting a descriptive empirical analysis of the prevalence and rate of pro se litigation in federal district courts since 2000. The results document that a substantial number of federal district court cases filed each year involve at least one pro se litigant, who is most frequently a plaintiff. After adjusting for case type and circuit of filing, we find that the odds that a case filed in a federal district court involves at least one pro se litigant increase over time; however, we find no evidence of a dramatic increase in the rate of pro se litigation during this period.
Is the “pro se explosion” like the litigation explosion that wasn’t? Perhaps, although it is possible that earlier works decrying a pro se explosion reflect trends that predate our study. Indeed, many reference a jump in rates of pro se litigation in the mid 1990s, a possibility that we are unable to address given the limitations of the AO data. This suggests that the empirical assumptions underlying proposals that are more recent may be due for a reexamination. It also indicates the potential utility of additional data collection efforts; recourse to case-level data could generate insights about periods where the AO data are incomplete and would also facilitate analysis into variation in pro se status over the course of litigation.
It is also possible that perceptions of a dramatic increase in pro se litigation are a function of trends in state courts, which likely differ from those observed in federal courts. This raises interesting questions about why rates of pro se litigation might diverge so dramatically between state and federal trial courts. The jurisdictional requirements of the federal court system generally exclude many of the types of cases, such as family law cases, that have very high rates of pro se participation in state courts. Are jurisdictional requirements, and the resulting composition of the courts’ dockets, enough to explain such a divergence? On this point, it is notable that we find relatively low rates of pro se litigation among diversity jurisdiction cases, but a slightly increasing trend. Future research might shed light on the relationship between pro se status and patterns of filing in, and removal to, federal district courts.
It is also possible that pro se litigation has changed qualitatively in unobserved ways that make the cases more onerous for courts to administer. Our analysis of judicial workload offers little evidence that the burden imposed by pro se litigation has increased substantially over time, but it is possible that pro se cases have changed in ways that have not been incorporated into the judicial case weights and are otherwise impossible to observe with the AO data. For example, it is possible that the burden imposed by pro se cases has increased because courts are offering greater assistance to pro se litigants. Future research using data drawn from dockets and case files could investigate differences in pretrial and trial processes in cases involving pro se and represented litigants. If pro se cases have become more demanding on these dimensions, it might help to explain the perceived increase in the scope of pro se litigation despite a steady pro se filing rate.
While we find no evidence of a dramatic increase in pro se litigation rates, we do find consistently high rates of pro se litigation among some types of cases. High rates of self-representation among prisoners have been the focus of other scholarly work (e.g., Schlanger Reference Schlanger2003, Reference Schlanger2015), and our analysis of more recent data serves to extend these findings. There has been relatively less attention to the prevalence of pro se litigation in other areas of law (but see Clermont and Schwab Reference Clermont and Schwab2004). Our findings document wide variation in rates of pro se litigation by type of case, particularly between civil rights cases with different bases and different forms of torts. Additional research is needed to enhance our understanding of the dynamics that generate the observed variation in rates of pro se litigation and to consider changes in these processes over time. Such work could enhance our theoretical understanding of inequalities in legal mobilization and extend empirical scholarship on the relationship between the structure of the legal profession and the provision of legal services (Heinz et al. Reference Heinz2005; Hadfield Reference Hadfield2010).
We also document substantial differences in rates of pro se litigation across jurisdictions. This raises important questions about variation in access to justice across space, which is a topic of increasing interest to scholars and policy makers (Sandefur and Smyth Reference Sandefur and Smyth2011; National Center for Access to Justice 2016; Law Society 2016). Relevant to these patterns are consideration of spatial variation of individuals’ legal needs and the resources provided to pro se litigants by the courts (Stienstra, Bataillon, and Cantone Reference Stienstra, Bataillon and Cantone2011) and the availability of legal representation through pro bono (Sandefur Reference Sandefur2007) or legal aid (Florida Civil Legal Aid 2018). Variation in local court rules is another factor that could influence both rates of pro se litigation and the experiences of pro se litigants. Although challenging issues of endogeneity abound, mismatches between the availability of civil justice resources and rates of pro se litigation are an important area for future inquiry. In addition to its policy implications, this work could enhance our theoretical understanding of local legal culture and access to legal expertise as a form of social capital.
Finally, the findings of this study raise important questions about the trajectory of disputes involving pro se litigants. Given the limitations of our data, we can document only summary patterns, but we identify several ways in which cases involving pro se litigants differ. Isolating the causal effect of legal representation using the AO data is not feasible, but the data could help scholars to identify areas where pro se cases and cases in which all parties have legal representation differ most significantly. In addition, recent scholarship documents a long-term decline in plaintiff win rates in federal court, even after adjusting for pro se status (Lahav and Siegelman Reference Lahav and Siegelman2017). Future research might investigate more deeply the relationship between pro se status and win rates over time, particularly if information about docket composition and case information are incorporated.
This study offers much-needed descriptive empirical evidence regarding the scope of pro se litigation in federal courts. In doing so, it exposes the surprising dearth of empirical investigation of pro se litigation in this context and the limitations of the extant literature to correctly describe or explain the basics of pro se litigation. These results contradict the prevailing wisdom of academics, the judiciary, and court observers and offer a more nuanced portrait of how the civil litigation system operates by demonstrating that the burden of pro se litigation has remained remarkably unremarkable for the past two decades.


 Open access