
1. Introduction
Massivestars launch powerful, hypersonic winds. Despite playing a key role in the evolution of stars and their feedback on the interstellar medium, the mass carried by these winds is still largely uncertain due to difficulties in the determination of their properties (e.g. Puls, Vink, & Najarro Reference Puls, Vink and Najarro2008). In addition, massive stars are most likely found forming binary systems, which also affect their evolution (Sana et al. Reference Sana2012).
A rich phenomenology arises in massive binaries in which the stellar winds collide (dubbed colliding-wind binaries, CWBs), generating a region of strong shocks where relativistic particles can be accelerated (Eichler & Usov Reference Eichler and Usov1993). These particles produce broadband non-thermal radiation (e.g. Benaglia & Romero Reference Benaglia and Romero2003; Pittard & Dougherty Reference Pittard and Dougherty2006; Reitberger et al. Reference Reitberger, Kissmann, Reimer and Reimer2014; del Palacio et al. Reference del Palacio, Bosch-Ramon, Romero and Benaglia2016; Pittard, Romero, & Vila Reference Pittard, Romero and Vila2021). So far, more than 40 CWBs have been identified as particle accelerators, mainly by means of evidence of non-thermal emission found in the radio domain(De Becker & Raucq Reference De Becker and Raucq2013; De Becker et al. Reference De Becker, Benaglia, Romero and Peri2017). The energy budget of non-thermal particles depends on the kinetic power of the wind, which for a star with mass–loss rate
 $\dot{M}$
and wind velocity
$\dot{M}$
and wind velocity
 $v_\mathrm{w}$
is
$v_\mathrm{w}$
is
 $\approx 0.5 \dot{M} \, v_\mathrm{w}^2$
. In addition, particle acceleration is more efficient for fast shocks (e.g. Drury Reference Drury1983). With high mass–loss rates and wind velocities, Wolf–Rayet (WR) stars produce some of the most powerful shocks in this type of sources, although only a couple of CWBs made up by two WR stars are known (Rosslowe & Crowther Reference Rosslowe and Crowther2015)Footnote a.
$\approx 0.5 \dot{M} \, v_\mathrm{w}^2$
. In addition, particle acceleration is more efficient for fast shocks (e.g. Drury Reference Drury1983). With high mass–loss rates and wind velocities, Wolf–Rayet (WR) stars produce some of the most powerful shocks in this type of sources, although only a couple of CWBs made up by two WR stars are known (Rosslowe & Crowther Reference Rosslowe and Crowther2015)Footnote a.
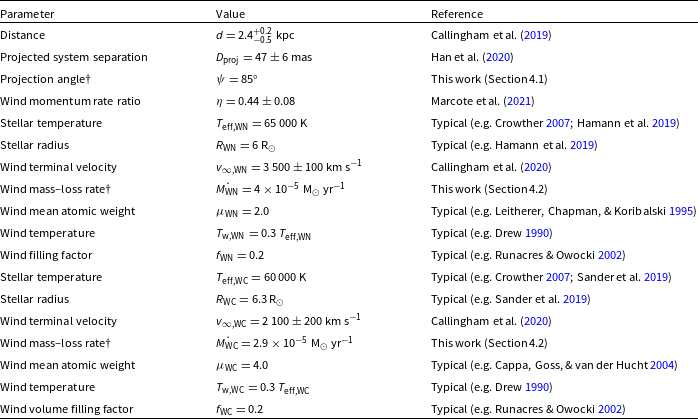
Parameters of the system Apep adopted in this work. Values marked with
 $\dagger$
were obtained in this work as described in the text.
$\dagger$
were obtained in this work as described in the text.
Multi-frequency radio continuum observations are a unique tool to investigate the physical processes undergoing in a source. In the case of CWBs, their radio emission has two contributions: a thermal one from the individual stellar winds, and a non-thermal one from the wind-collision region (WCR). On the one hand, the free–free emission from the individual stellar winds is steady and typically presents a flux density depending on frequency (
 $\nu$
) as
$\nu$
) as
 $S_\nu \propto \nu^{0.6}$
(Wright & Barlow Reference Wright and Barlow1975). On the other hand, the synchrotron emission from the WCR is likely to be modulated with the orbital period of the system. In addition, its spectral index is (intrinsically) negative, with a canonical value of
$S_\nu \propto \nu^{0.6}$
(Wright & Barlow Reference Wright and Barlow1975). On the other hand, the synchrotron emission from the WCR is likely to be modulated with the orbital period of the system. In addition, its spectral index is (intrinsically) negative, with a canonical value of
 $-0.5$
. However, this emission has to travel through the ionised stellar winds before reaching us. The free–free opacity to this radiation is frequency-dependent, being higher at lower frequencies. This can change drastically the observed spectrum, making the spectral index to be less negative or even positive (e.g. Dougherty et al. Reference Dougherty, Pittard, Kasian, Coker, Williams and Lloyd2003). The significance of the absorption depends on the square of the density of the absorbing medium (in this case, the stellar winds), and therefore this effect is more relevant in massive CWBs with dense stellar winds (del Palacio et al. Reference del Palacio, Bosch-Ramon, Romero and Benaglia2016). In conclusion, a complete sampling at low frequencies of the spectral energy distribution (SED) of the emission is required to investigate the interplay between absorption and emission processes in the stellar winds and the WCR.
$-0.5$
. However, this emission has to travel through the ionised stellar winds before reaching us. The free–free opacity to this radiation is frequency-dependent, being higher at lower frequencies. This can change drastically the observed spectrum, making the spectral index to be less negative or even positive (e.g. Dougherty et al. Reference Dougherty, Pittard, Kasian, Coker, Williams and Lloyd2003). The significance of the absorption depends on the square of the density of the absorbing medium (in this case, the stellar winds), and therefore this effect is more relevant in massive CWBs with dense stellar winds (del Palacio et al. Reference del Palacio, Bosch-Ramon, Romero and Benaglia2016). In conclusion, a complete sampling at low frequencies of the spectral energy distribution (SED) of the emission is required to investigate the interplay between absorption and emission processes in the stellar winds and the WCR.
The CWB Apep is a peculiar case of a CWB made up of two WR stars (Callingham et al. Reference Callingham, Tuthill, Pope, Williams, Crowther, Edwards, Norris and Kedziora-Chudczer2019). Recently, Marcote et al. (Reference Marcote, Callingham, De Becker, Edwards, Han, Schulz, Stevens and Tuthill2021) were capable of resolving its WCR using very long baseline interferometric observations (VLBI). This proved unambiguously the presence of relativistic electrons accelerated at the shocks and provided constraints on the system parameters. In particular, Marcote et al. (Reference Marcote, Callingham, De Becker, Edwards, Han, Schulz, Stevens and Tuthill2021) obtained the wind momentum rate ratio from the shape and position of the WCR. In this work, we aim to model the SED and emission morphology of the CWB Apep in order to better constrain the mass–loss rate of the stellar winds. The precise determination of
 $\dot{M}$
also allows us to reduce the uncertainties about the kinetic power of the stellar winds, and therefore in the efficiency at which the wind kinetic energy is converted into non-thermal particle energy through diffusive acceleration at the shocks. We also provide predictions of the high-energy emission from this system that are important for future observational campaigns in the X-ray and
$\dot{M}$
also allows us to reduce the uncertainties about the kinetic power of the stellar winds, and therefore in the efficiency at which the wind kinetic energy is converted into non-thermal particle energy through diffusive acceleration at the shocks. We also provide predictions of the high-energy emission from this system that are important for future observational campaigns in the X-ray and
 $\gamma$
-ray energybands.
$\gamma$
-ray energybands.
2. Target and observations
2.1. The colliding-wind binary Apep
This WN + WC system, located at a distance of
 $2.4^{+0.2}_{-0.5}\,\mathrm{kpc}$
(
$2.4^{+0.2}_{-0.5}\,\mathrm{kpc}$
(
 $RA = 16:00:50.48,\;DEC = -51:42:45.4;\;\mathrm{J}2000),$
was identified as a peculiar case of a CWB made up of two WR stars by Callingham et al. (Reference Callingham, Tuthill, Pope, Williams, Crowther, Edwards, Norris and Kedziora-Chudczer2019). The system presents a spectacular dust plume that adopts a pinwheel shape on large scales (hundreds of AU), most likely due to the orbital motion of the stars. In a following study, Callingham et al. (Reference Callingham, Crowther, Williams, Tuthill, Han, Pope and Marcote2020) derived the stellar wind velocities. The stars are separated by a projected distance
$RA = 16:00:50.48,\;DEC = -51:42:45.4;\;\mathrm{J}2000),$
was identified as a peculiar case of a CWB made up of two WR stars by Callingham et al. (Reference Callingham, Tuthill, Pope, Williams, Crowther, Edwards, Norris and Kedziora-Chudczer2019). The system presents a spectacular dust plume that adopts a pinwheel shape on large scales (hundreds of AU), most likely due to the orbital motion of the stars. In a following study, Callingham et al. (Reference Callingham, Crowther, Williams, Tuthill, Han, Pope and Marcote2020) derived the stellar wind velocities. The stars are separated by a projected distance
 $D_\mathrm{proj} \approx 47\,\mathrm{mas}$
(Han et al. Reference Han2020), which leads to a projected linear distance of 113 AU. In addition, Marcote et al. (Reference Marcote, Callingham, De Becker, Edwards, Han, Schulz, Stevens and Tuthill2021) presented VLBI observations with the Australian Long Baseline Array at 2.2 GHz in which the WCR could be resolved. The shape and position of the WCR allowed them to derive a wind momentum rate ratio of
$D_\mathrm{proj} \approx 47\,\mathrm{mas}$
(Han et al. Reference Han2020), which leads to a projected linear distance of 113 AU. In addition, Marcote et al. (Reference Marcote, Callingham, De Becker, Edwards, Han, Schulz, Stevens and Tuthill2021) presented VLBI observations with the Australian Long Baseline Array at 2.2 GHz in which the WCR could be resolved. The shape and position of the WCR allowed them to derive a wind momentum rate ratio of
 $\eta = 0.44\pm0.08$
, which implies a mass–loss rate ratio of
$\eta = 0.44\pm0.08$
, which implies a mass–loss rate ratio of
 $\dot{M}_\mathrm{WC}/\dot{M}_\mathrm{WN} = 0.73 \pm 0.15$
. However, it is not possible to derive the individual mass-loss rates from this relation alone. Marcote et al. (Reference Marcote, Callingham, De Becker, Edwards, Han, Schulz, Stevens and Tuthill2021) considered typical values of
$\dot{M}_\mathrm{WC}/\dot{M}_\mathrm{WN} = 0.73 \pm 0.15$
. However, it is not possible to derive the individual mass-loss rates from this relation alone. Marcote et al. (Reference Marcote, Callingham, De Becker, Edwards, Han, Schulz, Stevens and Tuthill2021) considered typical values of
 $\dot{M}$
for WN stars within
$\dot{M}$
for WN stars within
 $(2-10)\times10^{-5}\,\mathrm{M}_\odot\,\mathrm{yr}^{-1}$
and adopted a reference value of
$(2-10)\times10^{-5}\,\mathrm{M}_\odot\,\mathrm{yr}^{-1}$
and adopted a reference value of
 $\dot{M}_\mathrm{WN} = 5\times10^{-5}\,\mathrm{M}_\odot\,\mathrm{yr}^{-1}$
, although this value has a large uncertainty.
$\dot{M}_\mathrm{WN} = 5\times10^{-5}\,\mathrm{M}_\odot\,\mathrm{yr}^{-1}$
, although this value has a large uncertainty.
The known values of various parameters of the system are compiled in Table 1. In case that some specific value is unknown, we assume the typical value that corresponds to the given spectral type of the star.
2.2. Observations in the radio band
The system was observed with ATCA at 1.4 GHz revealing the brightest CWB with a flux density of
 $S_{1.4} = 166 \pm 15\,\mathrm{mJy}$
(Callingham et al. Reference Callingham, Tuthill, Pope, Williams, Crowther, Edwards, Norris and Kedziora-Chudczer2019). The additional flux density measurement at 19.7 GHz,
$S_{1.4} = 166 \pm 15\,\mathrm{mJy}$
(Callingham et al. Reference Callingham, Tuthill, Pope, Williams, Crowther, Edwards, Norris and Kedziora-Chudczer2019). The additional flux density measurement at 19.7 GHz,
 $S_{19.7} = 27.9 \pm 0.9\,\mathrm{mJy}$
, allowed Callinghamet al. (Reference Callingham, Tuthill, Pope, Williams, Crowther, Edwards, Norris and Kedziora-Chudczer2019) to derive a negative spectral index of
$S_{19.7} = 27.9 \pm 0.9\,\mathrm{mJy}$
, allowed Callinghamet al. (Reference Callingham, Tuthill, Pope, Williams, Crowther, Edwards, Norris and Kedziora-Chudczer2019) to derive a negative spectral index of
 $\alpha = -0.71 \pm 0.05$
. Additionally, Marcote et al. (Reference Marcote, Callingham, De Becker, Edwards, Han, Schulz, Stevens and Tuthill2021) presented VLBI observations at 2.2 GHz; they reported a flux density measurement of 60 mJy, though this is likely underestimated due to the VLBI observations resolving out the structure of the extended WCR. In any case, these observations proved unambiguously the presence of relativistic electrons accelerated at the WCR and the synchrotron nature of the radiation they produce. More recently, Bloot, Callingham, & Marcote (Reference Bloot, Callingham and Marcote2021) presented a more complete dataset at radiofrequencies comprising observations with the uGMRT (at 255 and 583 MHz), ASKAP (at 887.5 MHz) and ATCA (at 1–3 GHz). These observations revealed that the source is variable on timescales of several years. Nonetheless, in this work, we do not aim to explore the radio variability due to the large uncertainties in the orbital parameters of Apep. For this reason, we only include inour forthcoming analysis the ATCA observationsconducted in May 2017, and the uGMRT and ASKAP data obtained between 2018 and 2020 summarised in Bloot et al. (Reference Bloot, Callingham and Marcote2021). We also assume an additional 10% systematic error in flux density values due to calibration uncertainties.
$\alpha = -0.71 \pm 0.05$
. Additionally, Marcote et al. (Reference Marcote, Callingham, De Becker, Edwards, Han, Schulz, Stevens and Tuthill2021) presented VLBI observations at 2.2 GHz; they reported a flux density measurement of 60 mJy, though this is likely underestimated due to the VLBI observations resolving out the structure of the extended WCR. In any case, these observations proved unambiguously the presence of relativistic electrons accelerated at the WCR and the synchrotron nature of the radiation they produce. More recently, Bloot, Callingham, & Marcote (Reference Bloot, Callingham and Marcote2021) presented a more complete dataset at radiofrequencies comprising observations with the uGMRT (at 255 and 583 MHz), ASKAP (at 887.5 MHz) and ATCA (at 1–3 GHz). These observations revealed that the source is variable on timescales of several years. Nonetheless, in this work, we do not aim to explore the radio variability due to the large uncertainties in the orbital parameters of Apep. For this reason, we only include inour forthcoming analysis the ATCA observationsconducted in May 2017, and the uGMRT and ASKAP data obtained between 2018 and 2020 summarised in Bloot et al. (Reference Bloot, Callingham and Marcote2021). We also assume an additional 10% systematic error in flux density values due to calibration uncertainties.
In this work, we also report on the analysis of the radio emission at 150 MHz from the TIFR GMRT Sky Survey Alternative Data Release 1Footnote b (TGSS ADR1; Intema et al. Reference Intema, Jagannathan, Mooley and Frail2017). These data were taken between 2010 and 2012, so they are not simultaneous with the remaining dataset but also not too distant in time. The corresponding cutout is shown in Figure 1. We analyse the 25”-synthesised-beam image with the miriad software package (Sault, Teuben, & Wright Reference Sault, Teuben and Wright1995). The source Apep is not detected at this frequency; such non-detection yields an upper limit of
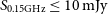 $S_{\rm 0.15GHz} \leq 10\,\mathrm{mJy}$
at a 1-
$S_{\rm 0.15GHz} \leq 10\,\mathrm{mJy}$
at a 1-
 $\sigma$
level.
$\sigma$
level.
Cutout from the GMRT 150 MHz all-sky radio survey (Intema et al. Reference Intema, Jagannathan, Mooley and Frail2017). The position of Apep is highlighted with a red circle. The synthesised beam is
 $25''\times25''$
and is shown in the bottom left corner. Contour levels at −30, 30, and 100 mJy beam−1 are also shown.
$25''\times25''$
and is shown in the bottom left corner. Contour levels at −30, 30, and 100 mJy beam−1 are also shown.
2.3. Observations in the X-ray band
Callingham et al. (Reference Callingham, Tuthill, Pope, Williams, Crowther, Edwards, Norris and Kedziora-Chudczer2019) analysed the X-ray data taken with the satellites XMM-Newton and Chandra; in these observations the system is completely unresolved, and therefore the observed spectrum is the sum of the individual stellar components and the WCR. They reported that the source is not variable and that the spectrum is predominantly thermal, as can be inferred by the presence of a strong Fe line. The spectrum is also significantly absorbed below 2 keV.
In this work, we are interested in studying the non-thermal emission originated in the WCR. With this end, we further investigate the possibility of constraining a putative power-law component in the hard X-ray spectrum, as can be expected for a bright CWB (e.g. Hamaguchi et al. Reference Hamaguchi2018; del Palacio et al. Reference del Palacio2020). Given that the source is not significantly variable, we choose to analyse the XMM-Newton observation ObsID 0201500101, for which the source is pointed closest to on-axis and is observed with all EPIC cameras. We reduce the observation and extract the source spectrum using SAS V19.0.0, and we use the software XSPEC V12.11.1 (Arnaud Reference Arnaud1996) for the spectral fitting. We focus our analysis on the spectrum
 $>3\,\mathrm{keV}$
, where the putative power-law component is more relevant.
$>3\,\mathrm{keV}$
, where the putative power-law component is more relevant.
Following Callingham et al. (Reference Callingham, Tuthill, Pope, Williams, Crowther, Edwards, Norris and Kedziora-Chudczer2019), we fit the spectrum with an apec model that is suitable for calculating the thermal emission of a high-temperature plasma. The absorption is modelled using a tbabs component and setting abundances to Wilms, Allen, & McCray (Reference Wilms, Allen and McCray2000) values. We obtain a total flux in the 3–10 keV band of
 $F_{3-10\,\mathrm{keV}} = (6.4\pm0.1)\times10^{-12}\,\mathrm{erg\,s}^{-1}\,\mathrm{cm}^{-2}$
. However, this value is only a loose upper limit of the actual non-thermal X-ray emission. Taking into account the emission from the relativistic particles in the WCR, the spectrum should be modelled as a combination of a thermal and a non-thermal (power-law) component, such as tbabs * (apec + po) (c.f. del Palacio et al. Reference del Palacio2020). For the power-law component, we fix the photon spectral index to the expected value of
$F_{3-10\,\mathrm{keV}} = (6.4\pm0.1)\times10^{-12}\,\mathrm{erg\,s}^{-1}\,\mathrm{cm}^{-2}$
. However, this value is only a loose upper limit of the actual non-thermal X-ray emission. Taking into account the emission from the relativistic particles in the WCR, the spectrum should be modelled as a combination of a thermal and a non-thermal (power-law) component, such as tbabs * (apec + po) (c.f. del Palacio et al. Reference del Palacio2020). For the power-law component, we fix the photon spectral index to the expected value of
 $\Gamma = 1 - \alpha = 1.71$
(see forthcoming Section 3); unfortunately, the normalisation of this component is poorly constrained by the data. We add a cflux multiplicative component to the power-law component to calculate its flux, obtaining a value of
$\Gamma = 1 - \alpha = 1.71$
(see forthcoming Section 3); unfortunately, the normalisation of this component is poorly constrained by the data. We add a cflux multiplicative component to the power-law component to calculate its flux, obtaining a value of
 $F_{3-10\,\mathrm{keV}} \approx 0.8^{+0.9}_{-0.8} \times$
 $10^{-12}\,\mathrm{\,erg\,s}^{-1}\,\mathrm{cm}^{-2}$
. However, the addition of the power-law component does not improve the quality of the fit and has to be taken with great caution; in fact, the lower limit of the retrieved flux is consistent with zero. Nonetheless, we can obtain a stringent 1-
$10^{-12}\,\mathrm{\,erg\,s}^{-1}\,\mathrm{cm}^{-2}$
. However, the addition of the power-law component does not improve the quality of the fit and has to be taken with great caution; in fact, the lower limit of the retrieved flux is consistent with zero. Nonetheless, we can obtain a stringent 1-
 $\sigma$
upper limit of the flux of the power law component of
$\sigma$
upper limit of the flux of the power law component of
 $F_{3-10\,\mathrm{keV}} < 1.7 \times10^{-12}\;\mathrm{\,erg\,s}^{-1}\,\mathrm{cm}^{-2}$
.
$F_{3-10\,\mathrm{keV}} < 1.7 \times10^{-12}\;\mathrm{\,erg\,s}^{-1}\,\mathrm{cm}^{-2}$
.
3. Emission model
We use the multi-zone model described in del Palacio et al. (Reference del Palacio, Bosch-Ramon, Romero and Benaglia2016) to calculate the non-thermal emission from the WCR. This model is suitable for adiabatic and quasi-stationary shocks with a laminar flow, as expected for systems separated by several AU such as Apep (e.g. Pittard Reference Pittard2009). Moreover, this extended model consistently incorporates the transport of relativistic particles along with the shocks and the emission they produce at each location in a 3D space. This allows us to properly correct the emission for position-dependent absorption along the line of sight. Below we present a brief summary of the model, and we refer the reader to del Palacio et al. (Reference del Palacio, Bosch-Ramon, Romero and Benaglia2016, Reference del Palacio2020) for further details.
The stars are separated by a linear distance
 $D=d\,D_\mathrm{proj}/\sin{\psi}$
, where
$D=d\,D_\mathrm{proj}/\sin{\psi}$
, where
 $\psi$
is the projection angle on the sky. We model the WCR at scales of the binary system separation, where the effects of orbital motion do not significantly affect its shape. The WCR structure is then treated as an axi-symmetric surface under a thin shocked shell approximation. The thermodynamic quantities at each shocked shell (one for each stellar wind) are calculated using analytical prescriptions. In particular, the magnetic field pressure is parameterised as a fraction
$\psi$
is the projection angle on the sky. We model the WCR at scales of the binary system separation, where the effects of orbital motion do not significantly affect its shape. The WCR structure is then treated as an axi-symmetric surface under a thin shocked shell approximation. The thermodynamic quantities at each shocked shell (one for each stellar wind) are calculated using analytical prescriptions. In particular, the magnetic field pressure is parameterised as a fraction
 $\eta_B$
of the thermal pressure at each position. Relativistic particles are assumed to accelerate in the WCR region and flow together with the shocked fluid. As they stream, particles cool down due to different processes and produce broadband radiation. This intrinsic emission is then corrected for absorption in the local matter and radiation fields. In Appendix A, we present a slight modification on how the particle energy distribution is calculated with respect to the base model in del Palacio et al. (Reference del Palacio2020).
$\eta_B$
of the thermal pressure at each position. Relativistic particles are assumed to accelerate in the WCR region and flow together with the shocked fluid. As they stream, particles cool down due to different processes and produce broadband radiation. This intrinsic emission is then corrected for absorption in the local matter and radiation fields. In Appendix A, we present a slight modification on how the particle energy distribution is calculated with respect to the base model in del Palacio et al. (Reference del Palacio2020).
The relativistic particle distribution injected at a given position in the WCR is a power law with the spectral index directly given by the radio observations through
 $p=-2\alpha + 1 = 2.42$
. This assumption is reasonable because radio-emitting electrons do not have time to cool, which would modify the electron energy distribution, and absorption effects are not significant at frequencies above 1.4 GHz (see below). The normalisation of this distribution is such that the injected power is a fraction
$p=-2\alpha + 1 = 2.42$
. This assumption is reasonable because radio-emitting electrons do not have time to cool, which would modify the electron energy distribution, and absorption effects are not significant at frequencies above 1.4 GHz (see below). The normalisation of this distribution is such that the injected power is a fraction
 $f_\mathrm{NT}$
of the total power available for particle acceleration (which is only a fraction of the total power of the stellar winds; del Palacio et al. Reference del Palacio, Bosch-Ramon, Romero and Benaglia2016). This power is distributed in electrons and protons as
$f_\mathrm{NT}$
of the total power available for particle acceleration (which is only a fraction of the total power of the stellar winds; del Palacio et al. Reference del Palacio, Bosch-Ramon, Romero and Benaglia2016). This power is distributed in electrons and protons as
 $f_\mathrm{NT} = f_\mathrm{NT,e} + f_\mathrm{NT,p}$
. We adopt a parameterisation
$f_\mathrm{NT} = f_\mathrm{NT,e} + f_\mathrm{NT,p}$
. We adopt a parameterisation
 $f_\mathrm{NT,e} = K_\mathrm{e,p} f_\mathrm{NT}$
, with
$f_\mathrm{NT,e} = K_\mathrm{e,p} f_\mathrm{NT}$
, with
 $K_\mathrm{e,p} = 0.02$
(e.g. Mertenet al. Reference Merten, Becker Tjus, Eichmann and Dettmar2017).
$K_\mathrm{e,p} = 0.02$
(e.g. Mertenet al. Reference Merten, Becker Tjus, Eichmann and Dettmar2017).
The more distinct signatures of the non-thermal emission can be found in the extremes of the energy spectrum: at low radio frequencies and at high-energy X-rays and
 $\gamma$
-rays. On the one hand, the emission in the low-frequency radio band is produced by the synchrotron mechanism. This radiation can be significantly attenuated by free–free absorption (FFA) in the ionised stellar winds. We consider an increased free–free opacity due to clumping in the stellar winds by a factor
$\gamma$
-rays. On the one hand, the emission in the low-frequency radio band is produced by the synchrotron mechanism. This radiation can be significantly attenuated by free–free absorption (FFA) in the ionised stellar winds. We consider an increased free–free opacity due to clumping in the stellar winds by a factor
 $f^{-1/2}$
, where
$f^{-1/2}$
, where
 $f\approx0.2$
is the volume filling factor of the wind (e.g. Runacres & Owocki Reference Runacres and Owocki2002). On the other hand, the non-thermal X-ray emission is produced by anisotropic inverse Compton (IC) up-scattering of stellar photons. This process can dominate the
$f\approx0.2$
is the volume filling factor of the wind (e.g. Runacres & Owocki Reference Runacres and Owocki2002). On the other hand, the non-thermal X-ray emission is produced by anisotropic inverse Compton (IC) up-scattering of stellar photons. This process can dominate the
 $\gamma$
-ray emission as well, competing with proton–proton inelastic collisions (p–p). Some
$\gamma$
-ray emission as well, competing with proton–proton inelastic collisions (p–p). Some
 $\gamma$
-ray photons with energy
$\gamma$
-ray photons with energy
 $\gtrsim 100$
GeV can be absorbed in the stellar radiation field creating secondary electron–positron pairs. In our model, we also calculate the wind thermal emission—relevant at high radio frequencies—using the standard expressions given by Wright & Barlow (Reference Wright and Barlow1975) for a spherically symmetric stellar wind.
$\gtrsim 100$
GeV can be absorbed in the stellar radiation field creating secondary electron–positron pairs. In our model, we also calculate the wind thermal emission—relevant at high radio frequencies—using the standard expressions given by Wright & Barlow (Reference Wright and Barlow1975) for a spherically symmetric stellar wind.
4. Results and discussion
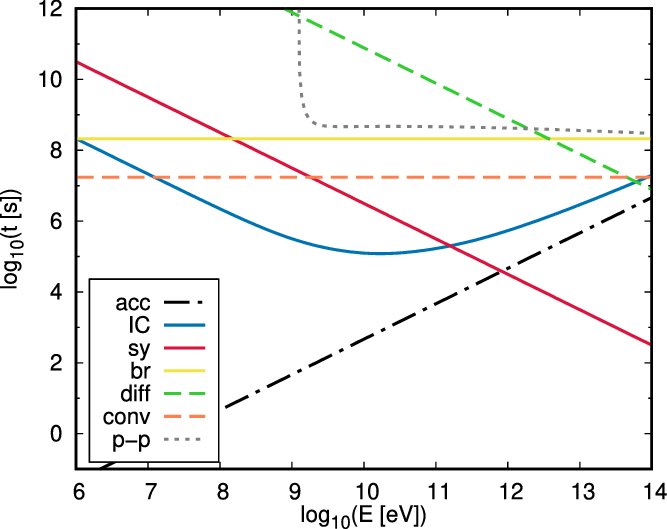
The non-thermal emission model considered here takes into account the inhomogeneity of the emitter and the variable conditions along with the shocks. We can, however, make a simplified discussion of the main properties that shape the particle energy distribution and the associated emission. In Figure 2, we show an example of the characteristic timescales for relativistic particles at a position close to the apex of the WCR for a given value of
 $\eta_B = 0.01$
; for other locations in the emitter and other values of
$\eta_B = 0.01$
; for other locations in the emitter and other values of
 $\eta_B$
, the overall behaviour is analogue. For the parameters of the Apep system, the electron energy distribution is governed by convective escape for
$\eta_B$
, the overall behaviour is analogue. For the parameters of the Apep system, the electron energy distribution is governed by convective escape for
 $E_\mathrm{e} < 100\,\mathrm{MeV}$
, whereas for
$E_\mathrm{e} < 100\,\mathrm{MeV}$
, whereas for
 $E_\mathrm{e} > 100\,\mathrm{MeV}$
the IC losses become dominant. Nonetheless, the IC interactions have a transition from the Thomson to the Klein–Nishina regime at
$E_\mathrm{e} > 100\,\mathrm{MeV}$
the IC losses become dominant. Nonetheless, the IC interactions have a transition from the Thomson to the Klein–Nishina regime at
 $E_\mathrm{e} \gtrsim 10\,\mathrm{GeV}$
, thus making this mechanism less efficient as the cross-section of the interaction drops. Depending on the magnetic field intensity, synchrotron cooling can overcome the IC losses at
$E_\mathrm{e} \gtrsim 10\,\mathrm{GeV}$
, thus making this mechanism less efficient as the cross-section of the interaction drops. Depending on the magnetic field intensity, synchrotron cooling can overcome the IC losses at
 $E_\mathrm{e} \gtrsim 100\,\mathrm{GeV}$
. The cooling of the high-energy electrons leads to a softening of the energy distribution at GeV energies and also to a slight increase in the distribution of lower energy electrons, thus changing the overall shape of the emitted SED. In the case of protons, cooling is negligible and the shape of their energy distribution is given by escape losses (Figure 2); except for the highest energies (
$E_\mathrm{e} \gtrsim 100\,\mathrm{GeV}$
. The cooling of the high-energy electrons leads to a softening of the energy distribution at GeV energies and also to a slight increase in the distribution of lower energy electrons, thus changing the overall shape of the emitted SED. In the case of protons, cooling is negligible and the shape of their energy distribution is given by escape losses (Figure 2); except for the highest energies (
 $\gtrsim\!10\,\mathrm{TeV})$
, the escape is convective and the energy distribution has the same shape as the injected spectrum. Finally, we note that the shock of the WN star wind is more powerful than the one from the WC star only by
$\gtrsim\!10\,\mathrm{TeV})$
, the escape is convective and the energy distribution has the same shape as the injected spectrum. Finally, we note that the shock of the WN star wind is more powerful than the one from the WC star only by
 ${\sim}20\%$
, so that both stellar wind shocks contribute to the observed fluxes.
${\sim}20\%$
, so that both stellar wind shocks contribute to the observed fluxes.
Example of characteristic timescales t for relativistic particles of energy E. These are calculated at the shock associated to the WN star in a position close to the apex of the WCR, assuming
 $\eta_B = 0.01$
. The acceleration timescale is shown with a dash-dotted line, electron radiative cooling timescales for IC scattering with stellar photons (from both stars), synchrotron, and relativistic Bremsstrahlung are shown with solid lines, and the diffusive and convective escape timescales are shown in dashed lines. The cooling time for protons (p–p) is shown in a dotted line.
$\eta_B = 0.01$
. The acceleration timescale is shown with a dash-dotted line, electron radiative cooling timescales for IC scattering with stellar photons (from both stars), synchrotron, and relativistic Bremsstrahlung are shown with solid lines, and the diffusive and convective escape timescales are shown in dashed lines. The cooling time for protons (p–p) is shown in a dotted line.
4.1. Radio emission maps
Given the axi-symmetry of the WCR at the spatial scales of interest, the morphology of the emission maps depends almost exclusively on the system orientation. We compute synthetic emission maps for different observing angles
 $\psi$
. We convolve these maps with a Gaussian beam of
$\psi$
. We convolve these maps with a Gaussian beam of
 $5.6'' \times 11.3''$
, and normalise the simulations in such a way that the integrated flux density in the map matches the flux density reported by Marcote et al. (Reference Marcote, Callingham, De Becker, Edwards, Han, Schulz, Stevens and Tuthill2021), that is,
$5.6'' \times 11.3''$
, and normalise the simulations in such a way that the integrated flux density in the map matches the flux density reported by Marcote et al. (Reference Marcote, Callingham, De Becker, Edwards, Han, Schulz, Stevens and Tuthill2021), that is,
 $S_{2\,\mathrm{GHz}} = 60\,\mathrm{mJy}$
Footnote c.
$S_{2\,\mathrm{GHz}} = 60\,\mathrm{mJy}$
Footnote c.
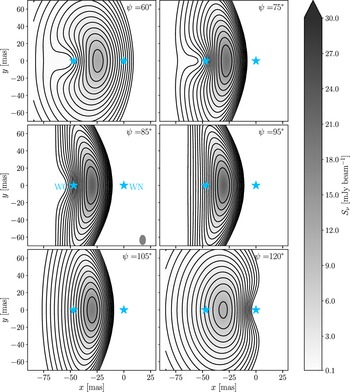
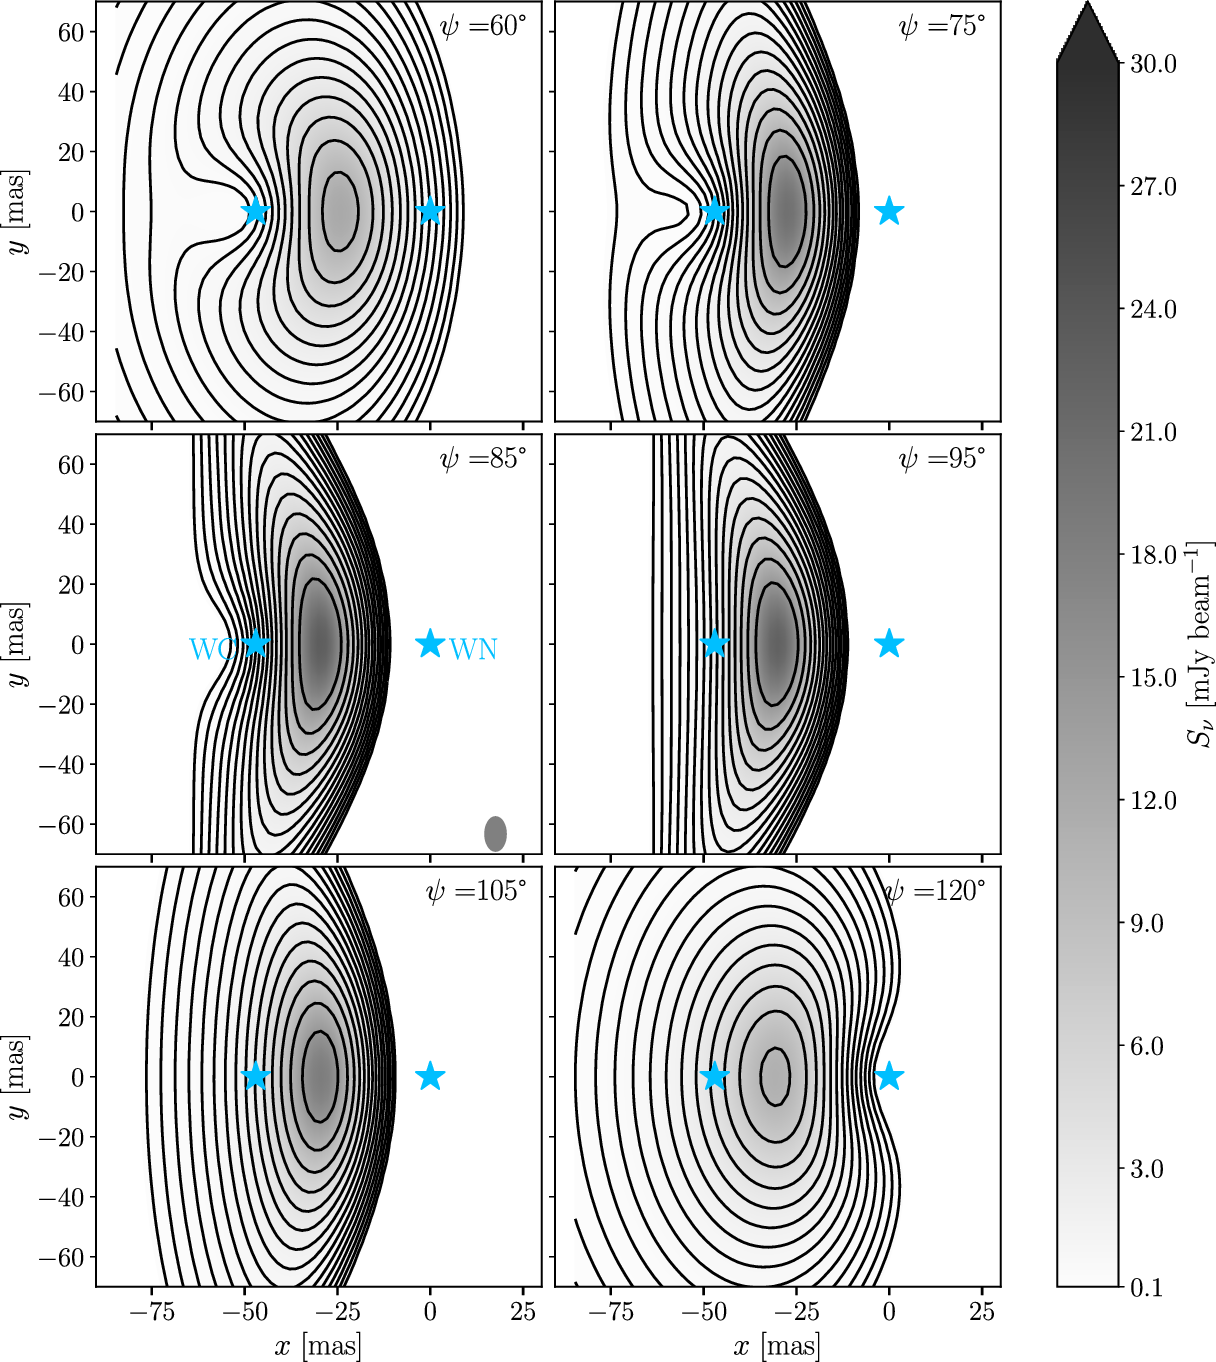
In Figure 3, we show the synthetic emission maps. For
 $\psi < 90^\circ$
, the WC star is in front, whereas for
$\psi < 90^\circ$
, the WC star is in front, whereas for
 $\psi> 90^\circ$
the WN is in front. Despite the fact that the measurement by Marcote et al. (Reference Marcote, Callingham, De Becker, Edwards, Han, Schulz, Stevens and Tuthill2021) is resolving out flux, we can constrain the value of
$\psi> 90^\circ$
the WN is in front. Despite the fact that the measurement by Marcote et al. (Reference Marcote, Callingham, De Becker, Edwards, Han, Schulz, Stevens and Tuthill2021) is resolving out flux, we can constrain the value of
 $\psi$
comparing by eye the synthetic maps with the observed one. Values of
$\psi$
comparing by eye the synthetic maps with the observed one. Values of
 $\psi < 65^\circ$
and
$\psi < 65^\circ$
and
 $\psi > 105^\circ$
lead to emission much more spatially diluted than the observed one, as can be appreciated from the contour levels and/or the colorscale. For this reason, we rule out these values leaving us with a tentative value of
$\psi > 105^\circ$
lead to emission much more spatially diluted than the observed one, as can be appreciated from the contour levels and/or the colorscale. For this reason, we rule out these values leaving us with a tentative value of
 $\psi = 85^\circ \pm 20^\circ$
. Additionally, the case with
$\psi = 85^\circ \pm 20^\circ$
. Additionally, the case with
 $\psi = 85^\circ$
shows the best agreement with the observed map, and we therefore fix this value hereafter. We note, however, that for the range of values of
$\psi = 85^\circ$
shows the best agreement with the observed map, and we therefore fix this value hereafter. We note, however, that for the range of values of
 $\psi = 65^\circ-105^\circ$
, the distance between the stars varies in less than 10%, and therefore the specific value adopted for
$\psi = 65^\circ-105^\circ$
, the distance between the stars varies in less than 10%, and therefore the specific value adopted for
 $\psi$
has little impact in the results obtained in the following sections.
$\psi$
has little impact in the results obtained in the following sections.
Synthetic emission maps using the model described in Section 3. The position of the WC (left) and WN (right) stars are shown, together with the synthesised beam in the bottom right corner of the middle left panel. The intensity of the wind-collision region emission is shown in grayscale, and we overplot the same contour levels as in Marcote et al. (Reference Marcote, Callingham, De Becker, Edwards, Han, Schulz, Stevens and Tuthill2021). The maps match well with the observed morphology for
 $\psi {\sim}85^\circ$
.
$\psi {\sim}85^\circ$
.
For consistency, we check whether this value is compatible with independent measurements by other authors. In particular, by modelling the IR spiral plume, Han et al. (Reference Han2020) found the following orbital parameters for the Apep system: inclination
 $i=25^\circ \pm 5^\circ$
, argument of periastron
$i=25^\circ \pm 5^\circ$
, argument of periastron
 $\omega=0^\circ \pm 5^\circ$
, and true anomaly at 2018 epoch
$\omega=0^\circ \pm 5^\circ$
, and true anomaly at 2018 epoch
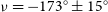 $\nu=-173^\circ \pm 15^\circ$
. Similar values (within errors) were also obtained by Bloot et al. (Reference Bloot, Callingham and Marcote2021) by modelling the lightcurve at radio wavelengths. We can derive the corresponding projection angle for these parameters as
$\nu=-173^\circ \pm 15^\circ$
. Similar values (within errors) were also obtained by Bloot et al. (Reference Bloot, Callingham and Marcote2021) by modelling the lightcurve at radio wavelengths. We can derive the corresponding projection angle for these parameters as
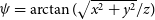 $\psi = \arctan{( \sqrt{x^2 + y^2}/z )}$
, where
$\psi = \arctan{( \sqrt{x^2 + y^2}/z )}$
, where
 $x=D\cos{(\omega-\nu)}\cos{(i)}$
,
$x=D\cos{(\omega-\nu)}\cos{(i)}$
,
 $y=D\sin{(\omega-\nu)}$
, and
$y=D\sin{(\omega-\nu)}$
, and
 $z=D\cos{(\omega-\nu)}\sin{(i)}$
are the coordinates of the secondary star. We obtain
$z=D\cos{(\omega-\nu)}\sin{(i)}$
are the coordinates of the secondary star. We obtain
 $\psi \approx 70^\circ$
, which is roughly consistent with the value we derive independently from the morphology of the emission maps.
$\psi \approx 70^\circ$
, which is roughly consistent with the value we derive independently from the morphology of the emission maps.
4.2. Radio spectral energy distribution
The shape of the SED at radio frequencies depends strongly on the stellar mass–loss rates. This is because the spectrum below 1 GHz is severely affected by FFA in the ionised stellar winds. Moreover, the thermal free–free emission is also relevant at frequencies above 10 GHz. Both features are more pronounced for higher values of
 $\dot{M}$
. We therefore carry out simulations for different values of
$\dot{M}$
. We therefore carry out simulations for different values of
 $\dot{M}_\mathrm{WN}$
(and, consistently, of
$\dot{M}_\mathrm{WN}$
(and, consistently, of
 $\dot{M}_\mathrm{WC}$
; see Section 2) and compute the radio SED in each case. All the SEDs are normalised such that
$\dot{M}_\mathrm{WC}$
; see Section 2) and compute the radio SED in each case. All the SEDs are normalised such that
 $S_{2\,\mathrm{GHz}} = 120\,\mathrm{mJy}$
; for doing this, we fix
$S_{2\,\mathrm{GHz}} = 120\,\mathrm{mJy}$
; for doing this, we fix
 $f_\mathrm{NT} = 0.1$
(
$f_\mathrm{NT} = 0.1$
(
 $f_\mathrm{NT,e} = 0.005$
) and vary the magnetic field intensity in the WCR through the parameter
$f_\mathrm{NT,e} = 0.005$
) and vary the magnetic field intensity in the WCR through the parameter
 $\eta_B$
. For the cases considered of
$\eta_B$
. For the cases considered of
 $\dot{M}_\mathrm{WN} = (2-8)\times10^{-5}\,\mathrm{M}_\odot\,\mathrm{yr}^{-1}$
, the
$\dot{M}_\mathrm{WN} = (2-8)\times10^{-5}\,\mathrm{M}_\odot\,\mathrm{yr}^{-1}$
, the
 $\eta_B$
-values are in the range (0.17–1.1)
$\eta_B$
-values are in the range (0.17–1.1)
 $\times 10^{-2}$
, with the lower values of
$\times 10^{-2}$
, with the lower values of
 $\eta_B$
corresponding to the greater values of
$\eta_B$
corresponding to the greater values of
 $\dot{M}_\mathrm{WN}$
. We show our results in Figure 4, together with the available observational data points.
$\dot{M}_\mathrm{WN}$
. We show our results in Figure 4, together with the available observational data points.
Modelled SED of Apep at radio frequencies for different values of the WNstar mass–loss rate, as indicated in the colorbar. We show the observational data points taken with the uGMRT and ATCA (Bloot et al. Reference Bloot, Callingham and Marcote2021), and the upper limit at 150 MHz calculated in this work from the GMRT 150 MHz all-sky radio survey (Intema et al. Reference Intema, Jagannathan, Mooley and Frail2017). Dotted lines show the total free–free from the stellar winds, dashed lines the synchrotron component from the wind-collision region, and solid lines are the sum of both.
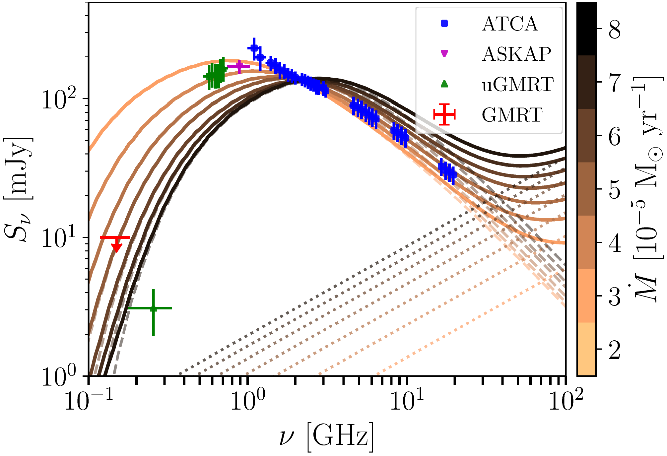
The available radio data allow us to put strong constraints on the value of
 $\dot{M}_\mathrm{WN}$
. The flux densities at 1–3 GHz allow us to characterise the intensity of the synchrotron spectrum, while the flux densities and upper limit below 1 GHz help us to infer the position of the FFA turnover frequency. Moreover, the flux density value at 19.7 GHz further constrains the combination of the synchrotron SED and the thermal free–free emission from the winds.
$\dot{M}_\mathrm{WN}$
. The flux densities at 1–3 GHz allow us to characterise the intensity of the synchrotron spectrum, while the flux densities and upper limit below 1 GHz help us to infer the position of the FFA turnover frequency. Moreover, the flux density value at 19.7 GHz further constrains the combination of the synchrotron SED and the thermal free–free emission from the winds.
Accordingto the results shown in Figure 4, the shape of the radio SED cannot be reconciled with low mass–loss rates,
 $\dot{M}_\mathrm{WN} < 3\times10^{-5}\,\mathrm{M}_\odot\,\mathrm{yr}^{-1}$
, as the flux density below 300 MHz would be highly overpredicted. In addition, high values of
$\dot{M}_\mathrm{WN} < 3\times10^{-5}\,\mathrm{M}_\odot\,\mathrm{yr}^{-1}$
, as the flux density below 300 MHz would be highly overpredicted. In addition, high values of
 $\dot{M}_\mathrm{WN} > 5\times10^{-5}\,\mathrm{M}_\odot\,\mathrm{yr}^{-1}$
lead to a significant absorption up to
$\dot{M}_\mathrm{WN} > 5\times10^{-5}\,\mathrm{M}_\odot\,\mathrm{yr}^{-1}$
lead to a significant absorption up to
 ${\sim}2\,\mathrm{GHz}$
, in tension with the data at 0.6–1.4 GHz, and they also lead to an overestimation of the total flux density at 19.7 GHz. Therefore, we conclude that the value of
${\sim}2\,\mathrm{GHz}$
, in tension with the data at 0.6–1.4 GHz, and they also lead to an overestimation of the total flux density at 19.7 GHz. Therefore, we conclude that the value of
 $\dot{M}_\mathrm{WN}$
is well-constrained to the range
$\dot{M}_\mathrm{WN}$
is well-constrained to the range
 $(3-5)\times10^{-5}\,\mathrm{M}_\odot\,\mathrm{yr}^{-1}$
, which leads to
$(3-5)\times10^{-5}\,\mathrm{M}_\odot\,\mathrm{yr}^{-1}$
, which leads to
 $\dot{M}_\mathrm{WC} \approx (2.2-3.7)\times10^{-5}\,\mathrm{M}_\odot\,\mathrm{yr}^{-1}$
. For these mass–loss rates, the model reproduces quite well the overall shape of the radio SED, but not the very pronounced decline suggested by the data at 255 MHz. Hereafter, we adopt a reference value of
$\dot{M}_\mathrm{WC} \approx (2.2-3.7)\times10^{-5}\,\mathrm{M}_\odot\,\mathrm{yr}^{-1}$
. For these mass–loss rates, the model reproduces quite well the overall shape of the radio SED, but not the very pronounced decline suggested by the data at 255 MHz. Hereafter, we adopt a reference value of
 $\dot{M}_\mathrm{WN} = 4 \times10^{-5}\,\mathrm{M}_\odot\,\mathrm{yr}^{-1}$
.
$\dot{M}_\mathrm{WN} = 4 \times10^{-5}\,\mathrm{M}_\odot\,\mathrm{yr}^{-1}$
.
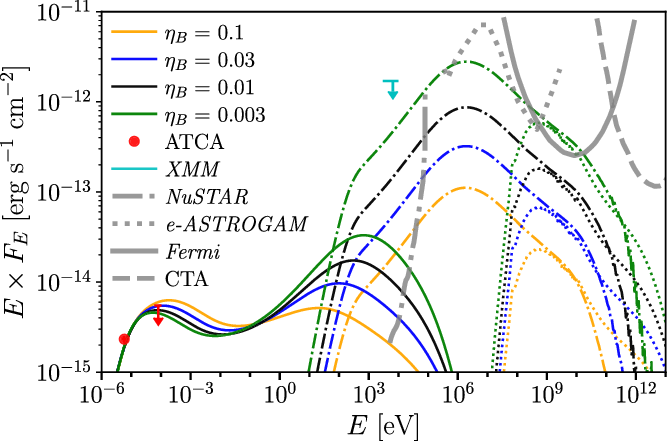
Modelled non-thermal SED of Apep for different values of
 $\eta_B$
. We show the observational data points taken with ATCA (Callingham et al. Reference Callingham, Tuthill, Pope, Williams, Crowther, Edwards, Norris and Kedziora-Chudczer2019) and the upper limit we derive from XMM-Newton data (Section 2.3). Dotted lines show the p–p component, dot-dashed lines the IC component, and solid lines the synchrotron component from the wind-collision region; all emission components are absorption-corrected. We also show the sensitivity curves for 1-Ms NuSTAR (Koglinet al. Reference Koglin2005), 1-yr e-ASTROGAM (de Angelis et al. Reference de Angelis2018), 10-yr Fermi-LAT (extracted from https://www.slac.stanford.edu/exp/glast/groups/canda/lat_Performance.htm for a broadband detection), and 100-h CTA (extracted from Funk, Hinton, & CTA Consortium 2013).
$\eta_B$
. We show the observational data points taken with ATCA (Callingham et al. Reference Callingham, Tuthill, Pope, Williams, Crowther, Edwards, Norris and Kedziora-Chudczer2019) and the upper limit we derive from XMM-Newton data (Section 2.3). Dotted lines show the p–p component, dot-dashed lines the IC component, and solid lines the synchrotron component from the wind-collision region; all emission components are absorption-corrected. We also show the sensitivity curves for 1-Ms NuSTAR (Koglinet al. Reference Koglin2005), 1-yr e-ASTROGAM (de Angelis et al. Reference de Angelis2018), 10-yr Fermi-LAT (extracted from https://www.slac.stanford.edu/exp/glast/groups/canda/lat_Performance.htm for a broadband detection), and 100-h CTA (extracted from Funk, Hinton, & CTA Consortium 2013).
Nonetheless, we caution that these estimates are subject to larger uncertainties when taking into account the uncertainties in the wind parameters, particularly in those adopted as typical values for high-mass stellar winds (Table 1). For instance clumping yields
 $\dot{M} \propto f^{-1/2}$
, so that variations in the assumed value of f within a factor of two would yield variations in the estimated values of
$\dot{M} \propto f^{-1/2}$
, so that variations in the assumed value of f within a factor of two would yield variations in the estimated values of
 $\dot{M}$
within a factor
$\dot{M}$
within a factor
 $\sqrt{2}$
. Additional uncertainties come from other system parameters, such as the distance d to the source, although in this case the values of
$\sqrt{2}$
. Additional uncertainties come from other system parameters, such as the distance d to the source, although in this case the values of
 $\dot{M}$
vary approximately by only
$\dot{M}$
vary approximately by only
 $\Delta d/d < 20\%$
.
$\Delta d/d < 20\%$
.
In addition, Callingham et al. (Reference Callingham, Tuthill, Pope, Williams, Crowther, Edwards, Norris and Kedziora-Chudczer2019) found observational evidence of anisotropy in the stellar winds, which is a feature not included in our model. Moreover, Bloot et al. (Reference Bloot, Callingham and Marcote2021) also favoured the presence of anisotropic winds in Apep by means of modelling the radio lightcurve using a one-zone approximation for the emitter. However, such a one-zone model treats the emitter as a point-like homogeneous region and is therefore incapable of accounting for the extended nature of the WCR and the fact that the emitted photons probe different regions of the stellar winds depending on their production site (e.g. Dougherty et al. Reference Dougherty, Pittard, Kasian, Coker, Williams and Lloyd2003). Thus, we expect that the actual impact of the wind anisotropies in the radio SED to be less significant than implied by Bloot et al. (Reference Bloot, Callingham and Marcote2021). With respect to the spherical wind approximation in our model, depending on the geometry of the system and the winds anisotropy, the anisotropy in the winds could potentially increase the opacity in the direction of the line of sight for photons coming from close to the bright apex of the WCR. Such a possibility could help to relieve the tension with the data at 255 MHz.
Finally,we note that the observations by Marcote et al. (Reference Marcote, Callingham, De Becker, Edwards, Han, Schulz, Stevens and Tuthill2021) only revealed the WCR, but they did not detect the individual stars. Therefore, we cannot rule out the possibility that the positions of the WR stars are exchanged. This means that in Figure 3 the WC could actually be the star to the right, having the strongest wind. In this scenario, the value of
 $\eta = 0.44$
, together with the wind terminal velocities, yield
$\eta = 0.44$
, together with the wind terminal velocities, yield
 $\dot{M}_\mathrm{WC} \approx 4\dot{M}_\mathrm{WN}$
. This leads to some complications, however. First, as shown previously, higher mass–loss rates can hardly be reconciled with the observed SED at high frequencies and with the non-detection of the individual WR stars by Marcote et al. (Reference Marcote, Callingham, De Becker, Edwards, Han, Schulz, Stevens and Tuthill2021). One would actually need to reduce
$\dot{M}_\mathrm{WC} \approx 4\dot{M}_\mathrm{WN}$
. This leads to some complications, however. First, as shown previously, higher mass–loss rates can hardly be reconciled with the observed SED at high frequencies and with the non-detection of the individual WR stars by Marcote et al. (Reference Marcote, Callingham, De Becker, Edwards, Han, Schulz, Stevens and Tuthill2021). One would actually need to reduce
 $\dot{M}_\mathrm{WN}$
to achieve the above constraint. This, in turn, would lead to lower absorption in the radio SED, which again is inconsistent with the observations at low frequencies. In addition, the lower wind kinetic power would demand an even more efficient conversion of wind kinetic power into non-thermal particles. We conclude that the adopted configuration, with the WN star to the right (i.e., having the strongest wind), seems to be the most plausiblechoice.
$\dot{M}_\mathrm{WN}$
to achieve the above constraint. This, in turn, would lead to lower absorption in the radio SED, which again is inconsistent with the observations at low frequencies. In addition, the lower wind kinetic power would demand an even more efficient conversion of wind kinetic power into non-thermal particles. We conclude that the adopted configuration, with the WN star to the right (i.e., having the strongest wind), seems to be the most plausiblechoice.
4.3. High-energy spectral energy distribution
Having solved the uncertainties in
 $\psi$
and
$\psi$
and
 $\dot{M}$
to a great extent, we now focus on the degeneracy of the two remaining free parameters in the model:
$\dot{M}$
to a great extent, we now focus on the degeneracy of the two remaining free parameters in the model:
 $\eta_B$
and
$\eta_B$
and
 $f_\mathrm{NT,e}$
. Such a degeneracy cannot be solved by radio data alone, but predictions in the high-energy domain can help to break this degeneracy (e.g. del Palacio et al. Reference del Palacio2020). Here, we calculate the expected fluxes in different energy bands accessible to current facilities. In particular, we report the fluxes in the hard X-ray energy range observable with the satellite NuSTAR (10–79 keV), the
$f_\mathrm{NT,e}$
. Such a degeneracy cannot be solved by radio data alone, but predictions in the high-energy domain can help to break this degeneracy (e.g. del Palacio et al. Reference del Palacio2020). Here, we calculate the expected fluxes in different energy bands accessible to current facilities. In particular, we report the fluxes in the hard X-ray energy range observable with the satellite NuSTAR (10–79 keV), the
 $\gamma$
-ray energy ranges observable by Fermi-LAT (
$\gamma$
-ray energy ranges observable by Fermi-LAT (
 $0.1-100\,\mathrm{Gev})$
and the forthcoming Cherenkov Telescope Array (CTA;
$0.1-100\,\mathrm{Gev})$
and the forthcoming Cherenkov Telescope Array (CTA;
 $0.1-100\,\mathrm{TeV})$
. We also compare the predicted fluxes in the MeV band with the expected sensitivity of the e-ASTROGAM mission (de Angelis et al. Reference de Angelis2018).
$0.1-100\,\mathrm{TeV})$
. We also compare the predicted fluxes in the MeV band with the expected sensitivity of the e-ASTROGAM mission (de Angelis et al. Reference de Angelis2018).
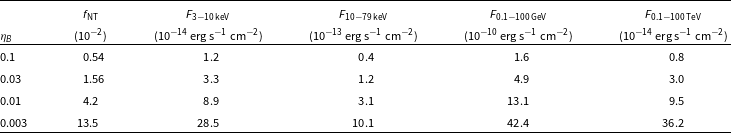
Fluxes in different energy bands for different values of
 $\eta_B$
. The selected energy bands correspond to the ones accessible by NuSTAR (3–79 keV), Fermi (0.1–100 GeV), and imaging air Cherenkov telescopes such as CTA (0.1–100 TeV).
$\eta_B$
. The selected energy bands correspond to the ones accessible by NuSTAR (3–79 keV), Fermi (0.1–100 GeV), and imaging air Cherenkov telescopes such as CTA (0.1–100 TeV).
We calculate the broadband SED for different scenarios that cover plausible physical conditions at the shocks. We explore different values of
 $\eta_B$
and fit the fraction of the available wind kinetic power transferred to relativistic electrons in the shocks needed to match the observed flux density at 2 GHz. For each of these scenarios, we also calculate the IC emission produced by the same population of relativistic electrons, and the p–p emission produced by the relativistic protons. The results are shown in Figure 5. We note that the synchrotron and IC SED deviate from a simple power law due to the efficient IC cooling of the high-energy electrons.
$\eta_B$
and fit the fraction of the available wind kinetic power transferred to relativistic electrons in the shocks needed to match the observed flux density at 2 GHz. For each of these scenarios, we also calculate the IC emission produced by the same population of relativistic electrons, and the p–p emission produced by the relativistic protons. The results are shown in Figure 5. We note that the synchrotron and IC SED deviate from a simple power law due to the efficient IC cooling of the high-energy electrons.
If we consider a case of high magnetic field given by
 $\eta_B = 0.1$
(
$\eta_B = 0.1$
(
 $B_\mathrm{WCR} {\sim}0.4\,\mathrm{G}$
), which is relatively close to the pressure equipartition condition, we obtain a corresponding value of
$B_\mathrm{WCR} {\sim}0.4\,\mathrm{G}$
), which is relatively close to the pressure equipartition condition, we obtain a corresponding value of
 $f_\mathrm{NT} = 5.4\times 10^{-3}$
. However, the strong magnetic field enhances the synchrotron emission from low-energy electrons that emit at
$f_\mathrm{NT} = 5.4\times 10^{-3}$
. However, the strong magnetic field enhances the synchrotron emission from low-energy electrons that emit at
 $\nu \gtrsim 10\,\mathrm{GHz}$
, surpassing the detected flux density at 19.7 GHz by a
$\nu \gtrsim 10\,\mathrm{GHz}$
, surpassing the detected flux density at 19.7 GHz by a
 ${\sim}30\%$
; this leads to a significant tension considering that the stellar winds should also have a relevant contribution at these frequencies (see Section 2.2). If we instead consider a low magnetic field case with
${\sim}30\%$
; this leads to a significant tension considering that the stellar winds should also have a relevant contribution at these frequencies (see Section 2.2). If we instead consider a low magnetic field case with
 $\eta_B = 0.001$
(
$\eta_B = 0.001$
(
 $B_\mathrm{WCR} {\sim}0.04\,\mathrm{G}$
), we obtain a high value of
$B_\mathrm{WCR} {\sim}0.04\,\mathrm{G}$
), we obtain a high value of
 $f_\mathrm{NT} = 0.42$
(
$f_\mathrm{NT} = 0.42$
(
 $f_\mathrm{NT,e} = 0.081$
), which yields an IC flux in the 3–10 keV band of
$f_\mathrm{NT,e} = 0.081$
), which yields an IC flux in the 3–10 keV band of
 $\gtrsim 9\times10^{-13}\,\mathrm{erg\,s}^{-1}\,\mathrm{cm}^{-2}$
that is in tension with the upper limits set by X-ray observations (Section 2.3). We can therefore rule out models with
$\gtrsim 9\times10^{-13}\,\mathrm{erg\,s}^{-1}\,\mathrm{cm}^{-2}$
that is in tension with the upper limits set by X-ray observations (Section 2.3). We can therefore rule out models with
 $\eta_B < 0.002$
as they overpredict the X-ray flux in the 3–10 keV band (Section 2.3). In conclusion, we can constrain
$\eta_B < 0.002$
as they overpredict the X-ray flux in the 3–10 keV band (Section 2.3). In conclusion, we can constrain
 $0.002 < \eta_B \leq 0.1$
. Below, we present a more detailed analysis of the cases
$0.002 < \eta_B \leq 0.1$
. Below, we present a more detailed analysis of the cases
 $\eta=0.003$
,
$\eta=0.003$
,
 $\eta=0.01$
,
$\eta=0.01$
,
 $\eta=0.03$
and
$\eta=0.03$
and
 $\eta=0.1$
.
$\eta=0.1$
.
For the values of
 $\eta_B \approx 0.003-0.1$
(
$\eta_B \approx 0.003-0.1$
(
 $B_\mathrm{WCR} {\sim}0.08-0.4\,\mathrm{G}$
), we derive corresponding values of
$B_\mathrm{WCR} {\sim}0.08-0.4\,\mathrm{G}$
), we derive corresponding values of
 $f_\mathrm{NT} \approx 0.005-0.13$
(
$f_\mathrm{NT} \approx 0.005-0.13$
(
 $f_\mathrm{NT,e} \approx (0.11-2.7)\times 10^{-3}$
), which can vary by a factor
$f_\mathrm{NT,e} \approx (0.11-2.7)\times 10^{-3}$
), which can vary by a factor
 $0.85-1.6$
when taking into account the uncertainty in the distance to the system. These values are consistent with those found for the CWB HD 93129A by del Palacio et al. (Reference del Palacio2020) (
$0.85-1.6$
when taking into account the uncertainty in the distance to the system. These values are consistent with those found for the CWB HD 93129A by del Palacio et al. (Reference del Palacio2020) (
 $\eta_B\approx0.02$
,
$\eta_B\approx0.02$
,
 $B_\mathrm{WCR} {\sim}0.5\,\mathrm{G}$
, and
$B_\mathrm{WCR} {\sim}0.5\,\mathrm{G}$
, and
 $f_\mathrm{NT,e}\approx6\times10^{-3}$
). Moreover, we show that the
$f_\mathrm{NT,e}\approx6\times10^{-3}$
). Moreover, we show that the
 $\gamma$
-ray emission comes from a combination of IC radiation and p-p interactions. However, the predicted fluxes are below the sensitivity of current
$\gamma$
-ray emission comes from a combination of IC radiation and p-p interactions. However, the predicted fluxes are below the sensitivity of current
 $\gamma$
-ray facilities by an order of magnitude, except in the most favourable scenarios (Figure 5). This is mainly due to the rather soft spectral index of the particle energy distribution (
$\gamma$
-ray facilities by an order of magnitude, except in the most favourable scenarios (Figure 5). This is mainly due to the rather soft spectral index of the particle energy distribution (
 $p=2.42$
). In addition, for photon energies
$p=2.42$
). In addition, for photon energies
 ${\sim}100\,\mathrm{GeV}$
,
${\sim}100\,\mathrm{GeV}$
,
 $\gamma-\gamma$
absorption is relevant and diminishes the flux of the source by
$\gamma-\gamma$
absorption is relevant and diminishes the flux of the source by
 $\approx 25\%$
. Nonetheless, a possible hardening of the particle energy distribution at high energies could potentially increase the
$\approx 25\%$
. Nonetheless, a possible hardening of the particle energy distribution at high energies could potentially increase the
 $\gamma$
-ray luminosity significantly (e.g. del Palacio et al. Reference del Palacio, Bosch-Ramon, Romero and Benaglia2016, Reference del Palacio2020). We also note that the radiation from secondary pairs created in
$\gamma$
-ray luminosity significantly (e.g. del Palacio et al. Reference del Palacio, Bosch-Ramon, Romero and Benaglia2016, Reference del Palacio2020). We also note that the radiation from secondary pairs created in
 $\gamma-\gamma$
interactions is negligible because the soft
$\gamma-\gamma$
interactions is negligible because the soft
 $\gamma$
-ray spectrum leads to much less power being radiated above 100 GeV than below 100 GeV, so the pair energetics is small. We summarise the predicted fluxes for each scenarioin Table 2.
$\gamma$
-ray spectrum leads to much less power being radiated above 100 GeV than below 100 GeV, so the pair energetics is small. We summarise the predicted fluxes for each scenarioin Table 2.
5. Conclusions
We present a detailed study of the non-thermal emission from the CWB Apep. The main results from this work are:
We constrain the observing projection angle to be
 $65^\circ \leq \psi \leq 105^\circ$
, with
$\psi\,{\sim}\,85^\circ$
the preferred value, by modelling the morphology of the emission maps.
$65^\circ \leq \psi \leq 105^\circ$
, with
$\psi\,{\sim}\,85^\circ$
the preferred value, by modelling the morphology of the emission maps.We establish upper limits of the non-thermal radio emission at 150 MHz of 10 mJy and of the non-thermal X-ray emission in the 3–10 keV energy band of
$1.7\times10^{-12}\,\mathrm{erg\,s}^{-1}\,\mathrm{cm}^{-2}$
.We estimate the stellar mass–loss rate of the WR stars to be
$\dot{M}_\mathrm{WN} \approx (4 \pm 1)\,\mathrm{M}_\odot\,\mathrm{yr}^{-1}$
and
$\dot{M}_\mathrm{WC} \approx (2.9 \pm 0.7)\,\mathrm{M}_\odot\,\mathrm{yr}^{-1}$
by modelling the radio SED (for a wind volume filling factor
$f \approx 0.2$
).We constrain the magnetic field intensity in the WCR and the fraction of energy converted into non-thermal particle acceleration. Namely, these values are
$\eta_B \approx 0.003-0.1$
(
$B_\mathrm{WCR} \approx 0.08-0.4\,\mathrm{G}$
) and
$f_\mathrm{NT,e} \approx (0.11-2.7)\times 10^{-3}$
.We predict the expected emission of the Apep system at high energies (hard X-rays and
$\gamma$
-rays). The CWB Apep is unlikely to be detected as a
$\gamma$
-ray source unless the particle energy distribution has a hardening at high energies.


We conclude that the detailed investigation of the non-thermal radiation from CWBs such as Apep can offer deep insights on the general picture of CWBs, both as particle accelerators and non-thermal sources.
Acknowledgements
S. d. P. acknowledgessupport by CONICET (PIP-0102) and ANPCyT (PICT-2017-2865); P. B. by ANPCyT (PICT-2017-0773). G. E. R. and V. B.-R. are supported by the Spanish Ministerio de Ciencia e Innovación (MICINN) under grant PID2019-105510GB-C31 and through the ‘Center of Excellence María de Maeztu 2020-2023’ award to the ICCUB (CEX2019-000918-M). V. B.-R. is also supported by the Catalan DEC grant 2017 SGR 643, and is Correspondent Researcher of CONICET, Argentina, at the IAR. We thank H. Intema for help with TGSS ADR1 data handling. This work was carried out in the framework of the PANTERA-StarsFootnote d initiative.
A. Particle energy distribution
The WCR is treated as a sum of one-dimensional emitters. Each of these is divided into smaller segments or ‘cells’. The relativistic particle distribution from one cell evolves as it reaches the next cell. To calculate this evolution, one has to take into account both the energy losses and the particle travel time along each cell, which depends on the cell size and the fluid velocity (e.g. Molina & Bosch-Ramon Reference Molina and Bosch-Ramon2018). Specifically, the particle energy distribution evolves as
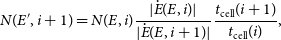 \begin{equation} N(E', i+1) = N(E, i) \frac{ |\dot{E}(E,i)|}{ |\dot{E}(E,i+1)|} \frac{t_\mathrm{cell}(i+1)}{t_\mathrm{cell}(i)}, \end{equation}
where
 $\left|\dot{E}(E, i)\right|$
is the cooling rate for particles of energy E at the i-cell. In the base model by del Palacio et al. (Reference del Palacio, Bosch-Ramon, Romero and Benaglia2016), the factor
$\left|\dot{E}(E, i)\right|$
is the cooling rate for particles of energy E at the i-cell. In the base model by del Palacio et al. (Reference del Palacio, Bosch-Ramon, Romero and Benaglia2016), the factor
 $t_{\rm cell}$
was not included, which can lead to errors in the estimated fluxes of
$t_{\rm cell}$
was not included, which can lead to errors in the estimated fluxes of
 ${\sim}10\%$
depending on the cell sampling adopted and the fluid acceleration.
${\sim}10\%$
depending on the cell sampling adopted and the fluid acceleration.