





Introduction
Despite global efforts to reduce gender inequality, disparities in social, economic, and political life persist, and women’s interests are underrepresented (Homola Reference Homola2019; Reher Reference Reher2018), particularly when women’s and men’s interests conflict (Persson, Schakel, and Sundell Reference Persson, Schakel and Sundell2024). Women also express lower political interest (Dassonneville and McAllister Reference Dassonneville and McAllister2018), efficacy (Fraile and de Miguel Moyer Reference Fraile and de Miguel Moyer2022), and ambition (Fox and Lawless Reference Fox and Lawless2014). While extensive research on these gender gaps exists, gaps in donations to political parties have received little attention yet may have crucial implications for gender gaps in representation, as donors’ interests are often prioritized (Canes-Wrone and Gibson Reference Canes-Wrone and Gibson2019, Gilens Reference Gilens2012).
Existing studies primarily treat gender as a secondary factor (Grant and Rudolph Reference Grant and Rudolph2002; Ponce and Scarrow Reference Ponce and Scarrow2011) and/or focus on North America (Grant and Rudolph Reference Grant and Rudolph2002; McMahon, Sayers, and Alcantara Reference McMahon, Sayers and Alcantara2023; Mehravar, Alcantara, and Roy Reference Mehravar, Alcantara and Roy2024; Tolley, Besco, and Sevi Reference Tolley, Besco and Sevi2022; Verba Reference Verba1995), raising questions of generalizability. In contrast to the US, where donations are central to campaigns and actively sought out, many European parties rely primarily on public funding. Still, donations remain relevant: the Labour and Conservative parties in the UK raised a combined £93 million ahead of the 2024 national election, while Italian parties do not receive any public funding, thus relying heavily on donations. Europe’s multiparty systems and weaker partisanship (Dalton and Wattenberg Reference Dalton and Wattenberg2002) limit the generalizability of North American results, and previous studies on Europe mostly leverage survey data, making results vulnerable to self-reporting bias and limiting analyses to donation frequencies and not allowing the study of amounts donated. The few studies that leverage data on donations from party finance reports, e.g., Fiorelli (Reference Fiorelli2017) and Feo, Fiorelli, and Piccio (Reference Feo, Fiorelli and Piccio2023), focus on the gender gap in receiving donations, that is to say, on candidates rather than donors.
This research note addresses some of the gaps in previous research by analyzing donation data from the UK (2004–2024), Italy (2018–2022), and Finland (2011–2023), countries differing in funding systems, electoral rules, and gender equality, which allows for a broader comparison across countries and an investigation of gender gaps in donation amounts and recipient parties.
The findings indicate a gender gap in donation frequency and amounts across all countries. The gap is smallest in Finland, a comparatively gender-equal country. Similarly, differences in donation amounts are minor in Finland but substantially vary over time in both Finland and the UK. The findings are inconsistent regarding which parties women tend to donate to – in the UK, green, left-leaning, and regionalist parties appear most likely to receive a donation from women, and right-wing parties the least likely, but the same patterns do not emerge in Italy and Finland.
The gender gap in donations
There are two main explanations for a gender gap in political donations. First, politics is often seen as a ‘man’s domain’ (Lawless and Fox Reference Lawless and Fox2010), associated with male-coded traits like competitiveness and assertiveness. These norms may reduce women’s political efficacy, leading to lower political participation, including donations. Second, in order to engage in politics, individuals need resources (Verba Reference Verba1995). For donations, the key resource is money. Women, on average, earn less than men in most countries, and the disparity in financial resources can contribute to a gender gap in donations. Women, who have fewer resources, are less likely to allocate them toward political donations. Perhaps for the same reason, women are also less likely to be approached by parties and asked to contribute (Grant and Rudolph Reference Grant and Rudolph2002). Women also express lower levels of political interest and hence have weaker incentives to donate.Footnote 1 Research from the United States (Gothreau and Sanbonmatsu Reference Gothreau and Sanbonmatsu2023; Thomsen and Swers Reference Thomsen and Swers2017) and Canada (Mehravar, Alcantara, and Roy Reference Mehravar, Alcantara and Roy2024; McMahon, Sayers, and Alcantara Reference McMahon, Sayers and Alcantara2023; Tolley, Besco, and Sevi Reference Tolley, Besco and Sevi2022) supports the notion that women are less likely to donate to political parties and, on average, contribute less than men. Notably, this gap is largely driven by differences in available resources; when simulating resource equivalency, women’s probability of donating to political parties becomes similar to men’s (Mehravar, Alcantara, and Roy Reference Mehravar, Alcantara and Roy2024). From this, I derive two theoretical expectations:
E1: Women donate less frequently to political parties than men.
E2: Women donate smaller amounts to political parties than men.
Beyond expecting a gender gap in donating to political parties, gender gaps in which parties are most likely to receive donations from women can also be expected. Electorally, women support left-leaning and green parties more frequently (Giger Reference Giger2009; Shorrocks Reference Shorrocks2021; van Ditmars and Shorrocks Reference van Ditmars and Shorrocks2024), likely because these parties tend to represent women’s interests to a larger extent (Caul Kittilson Reference Caul Kittilson2006; Keith and Verge Reference Keith and Verge2018). This could motivate them to donate more frequently to such parties (Francia, Green, Herrnson et al. Reference Francia, Green, Herrnson, Powell and Wilcox2005; Tolley, Besco, and Sevi Reference Tolley, Besco and Sevi2022). Additionally, evidence from North America also points out that women tend to donate more frequently to female candidates (Barber, Butler, Preece et al. Reference Barber, Butler and Preece2016; Grumbach, Sahn, and Staszak Reference Grumbach, Sahn and Staszak2022; Thomsen and Swers Reference Thomsen and Swers2017). Green and left-leaning parties tend to be more likely to nominate women as candidates and are more likely to nominate women for prominent positions such as ministers (Caul Reference Caul1999; Dahlerup Reference Dahlerup2007; Stockemer and Sundström Reference Stockemer and Sundström2018), all of which may inspire confidence and willingness to donate among women. Taken together, this leads to the theoretical expectation that:
E3: Left-leaning and green parties are more likely to receive donations from women than right-leaning parties.
Data
To test these expectations, I use original data on actual donations to political parties from three countries: the United Kingdom (2004–2024; n = 33,697), Finland (2011–2024; n = 1,031), and Italy (2018–2022; n = 9,591).Footnote 2 These countries were selected for three main reasons: while there exists moderate variation in party financing regulations, all three require donor identities to be published; variation in electoral systems, as the UK employs a majoritarian electoral system; party systems and number of parties; and variation in gender-equality contexts.Footnote 3 Notably, Italian party finance laws require data to be stored for three years before deletion, which limits data availability.
Despite some variation, the countries share similar party financing regulations, making them suitable for comparison. While both the UK and Finland provide partial public funding for political parties, Italy does not. This difference likely explains the variation in donation numbers: Italy reported over 9,600 individual donations over four years, and Finland just over 1,000 donations over 13 years, while the UK averages 2,400 donations annually. Finland imposes a €30,000 per-person annual donation limit, while Italy allows up to €100,000, and the UK has no limit. Crucially, all three countries require the publication of donor identities and donation amounts, although in Finland only donations exceeding €1,500 are disclosed. This may lead to an underestimation of the share of female donors if women tend to donate smaller amounts and an overestimation of the average donation amount by women for the case of Finland.Footnote 4 Finland is still the most fitting case among the Nordic countries – Swedish parties, by law, do not need to publish the identity of donors, and while Danish parties disclose the identity of donors, their reports do not include the amount donated. Similarly, while Italy’s restricted time span is not ideal to analyze gender patterns over time, among Mediterranean countries, Spain only requires donor identities to be made public for extremely large donations (above €25,000, and no party has reported such a large donation since 2016), while collecting information on donor identities in Portugal requires physically visiting the Entity of Political Accounts and Financing, making data collection for these cases not feasible.
The three chosen countries also vary on several other aspects relevant to the question at hand: in terms of gender equality, Finland is known for its high political gender equality, expressed i.a. in the high share of female MPs (45.5% of MPs in 2025) and its high ranking on the Global Gender Gap Indicator (2nd), with the UK ranked 14th in the GGI and Italy substantially lower at 87th. Additionally, the countries differ in their electoral systems and the number of parties in parliament, which helps explore whether contextual conditions affect any observed gendered patterns in donations.
The data was collected via information available from Transparency International Italy, the UK Electoral Commission, and Finland’s Election Unit at the Ministry of Justice. As the data spans more than a decade, all donation amounts were adjusted for inflation to 2020 values and, in the case of the UK, converted to Euros.Footnote 5 Since the UK does not impose a donation limit, donations vary widely, with inflation-adjusted amounts ranging from £15 to £8,949,771. However, such exceptionally large donations, such as the donation of nearly £9 million, are typically made by deceased individuals or wealthy business owners donating as private individuals. Because these large donations are overwhelmingly made by men, I exclude observations that are outliers based on the size of the donation amountFootnote 6 , reducing potential bias in analyzing gender differences. This results in a final sample of 29,432 observations. While the Italian donation data already includes a gender identifier, gender in the British and Finnish data was inferred using an automated coding scheme based on historical birth records (Blevins and Mullen Reference Blevins and Mullen2015), with 1980 as the reference year for the name registry. For names that could not be automatically coded, which was predominantly the case in Finland, a research assistant manually determined gender through online searches and verified 10% of the automatically coded names.Footnote 7
In addition to donor gender, the datasets include the donation amount and the recipient but no other donor characteristic. The data does not allow for regression analysis with multiple donor characteristics (such as location, age, education, or even if the same donor donates repeatedly, as parties are not required to report such information), but it allows for a detailed, descriptive exploration of gender dynamics in donations. It also provides valuable insights not typically available in surveys, such as donation amounts and which parties individuals donate to.
Results
Gender gaps in donation shares
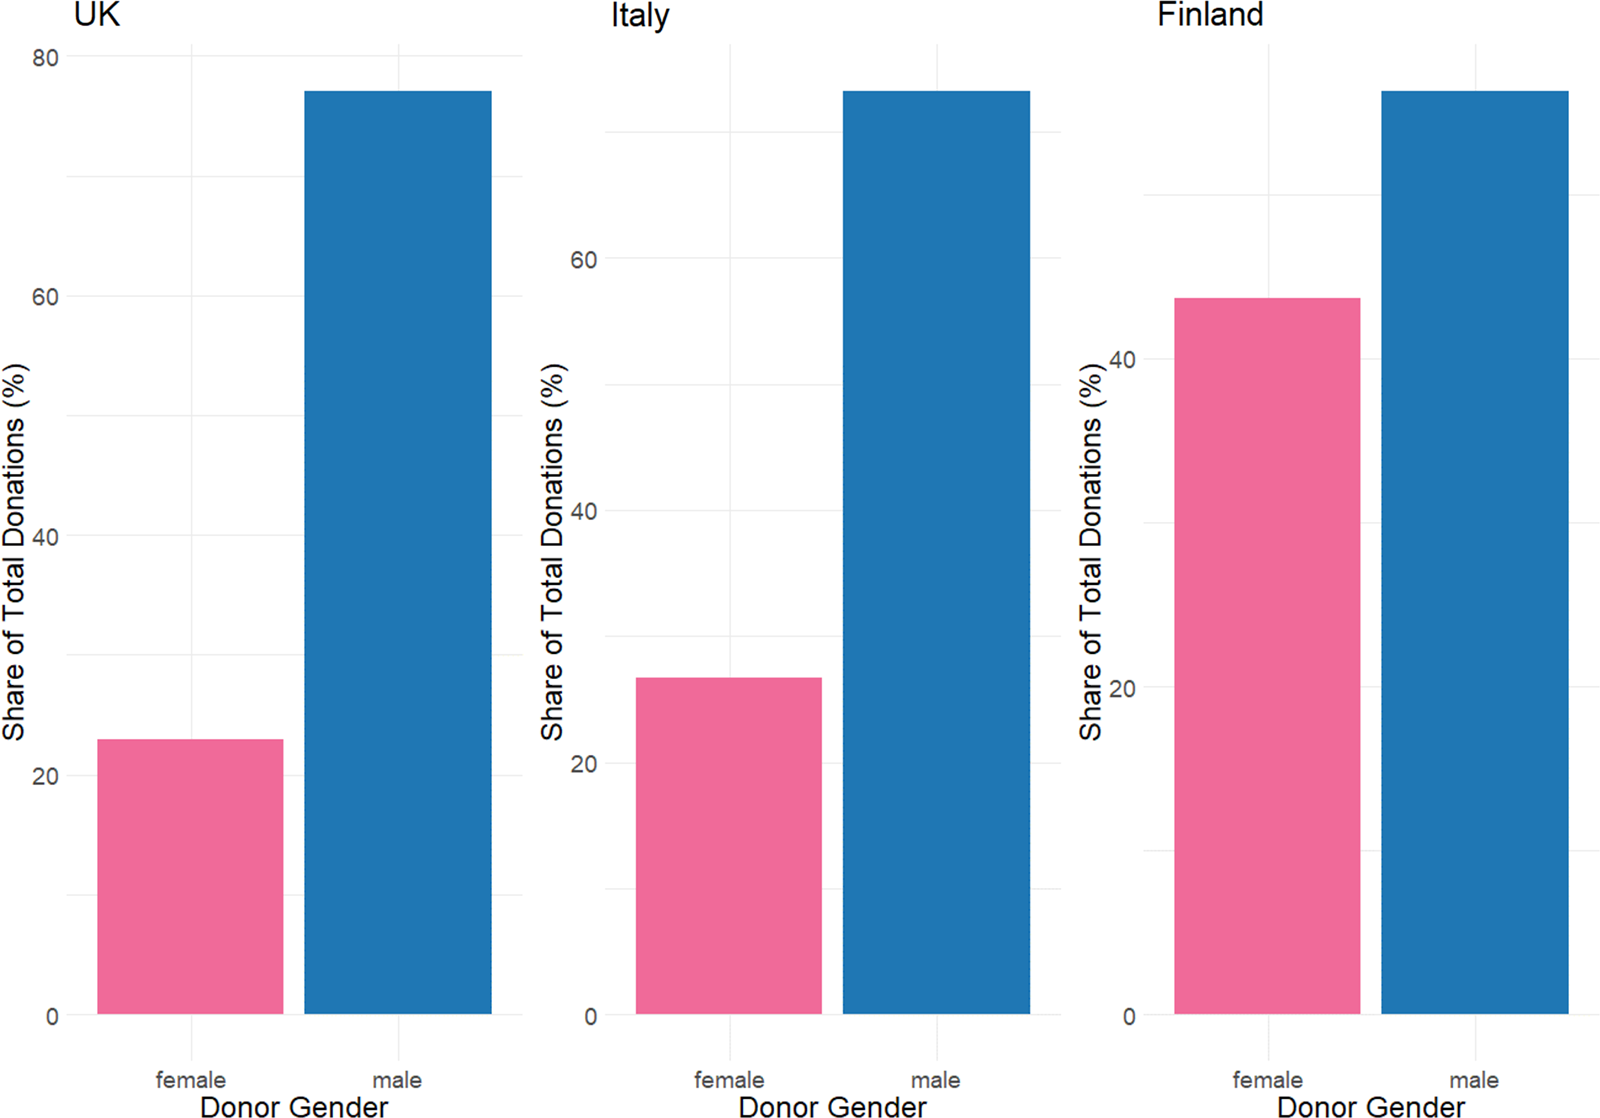
Figure 1 illustrates the gendered distribution of donations across the three countries, pooled over time. As shown and consistent with the first expectation, there is a noticeable gender gap in the share of donations made by women and men, although the gap varies across countries. In the UK and Italy, women make up approximately 23% and 26% of donations, respectively. Finland has a significantly smaller gender gap, with women contributing around 44% of all donations. One potential explanation for this difference is Finland’s stronger focus on gender equality. Finland’s ‘state feminism’ approach actively promotes gender equality through policies like expanding paternity leave and increasing female representation in politics, which may reduce the gender gap in donation frequencies (Holli and Kantola Reference Holli and Kantola2005, Reference Holli and Kantola2007).
Share of donations by gender, pooled.
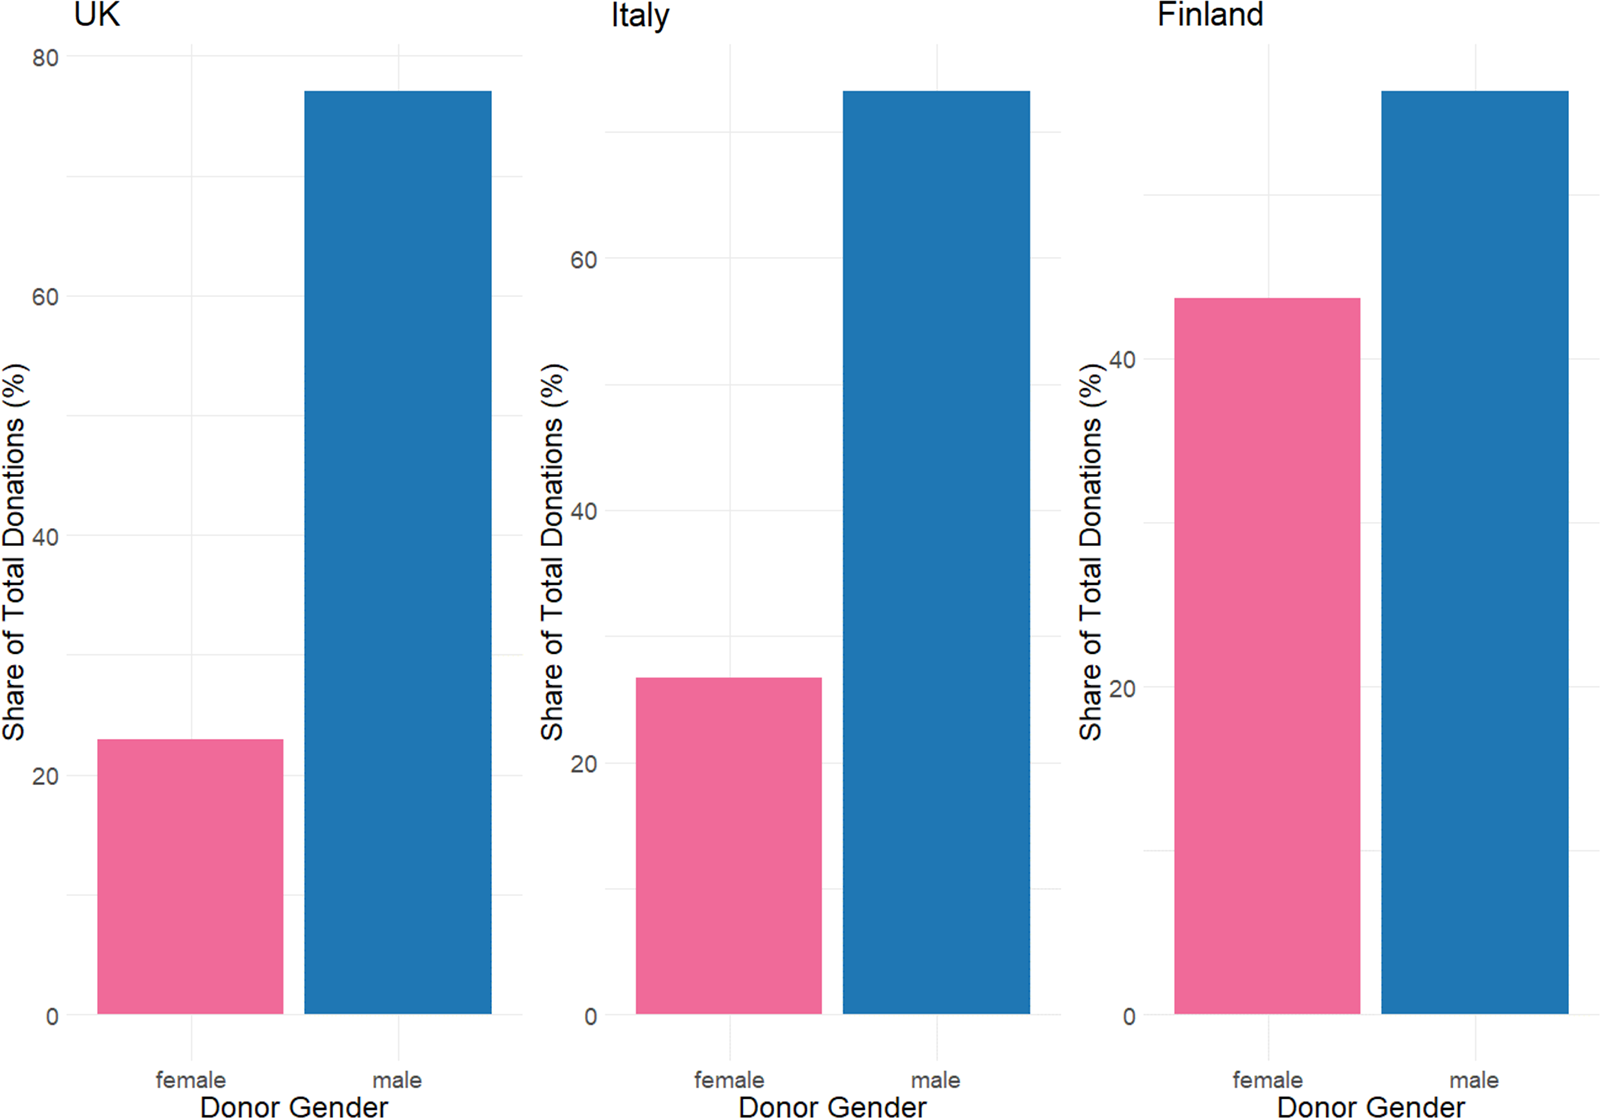
Figure 1 Long description
The bar graph compares the share of total donations by gender in the UK, Italy, and Finland. Each country has two vertical bars, one for female donors and one for male donors. The x-axis represents the countries: the UK, Italy, and Finland, while the y-axis represents the share of total donations in percentage. In the UK, female donors contribute approximately 20 percent, while male donors contribute around 80 percent. In Italy, female donors contribute around 30 percent, and male donors contribute about 70 percent. In Finland, female donors contribute approximately 50 percent, and male donors contribute around 50 percent. The color scheme uses pink for female donors and blue for male donors. All values are approximated.
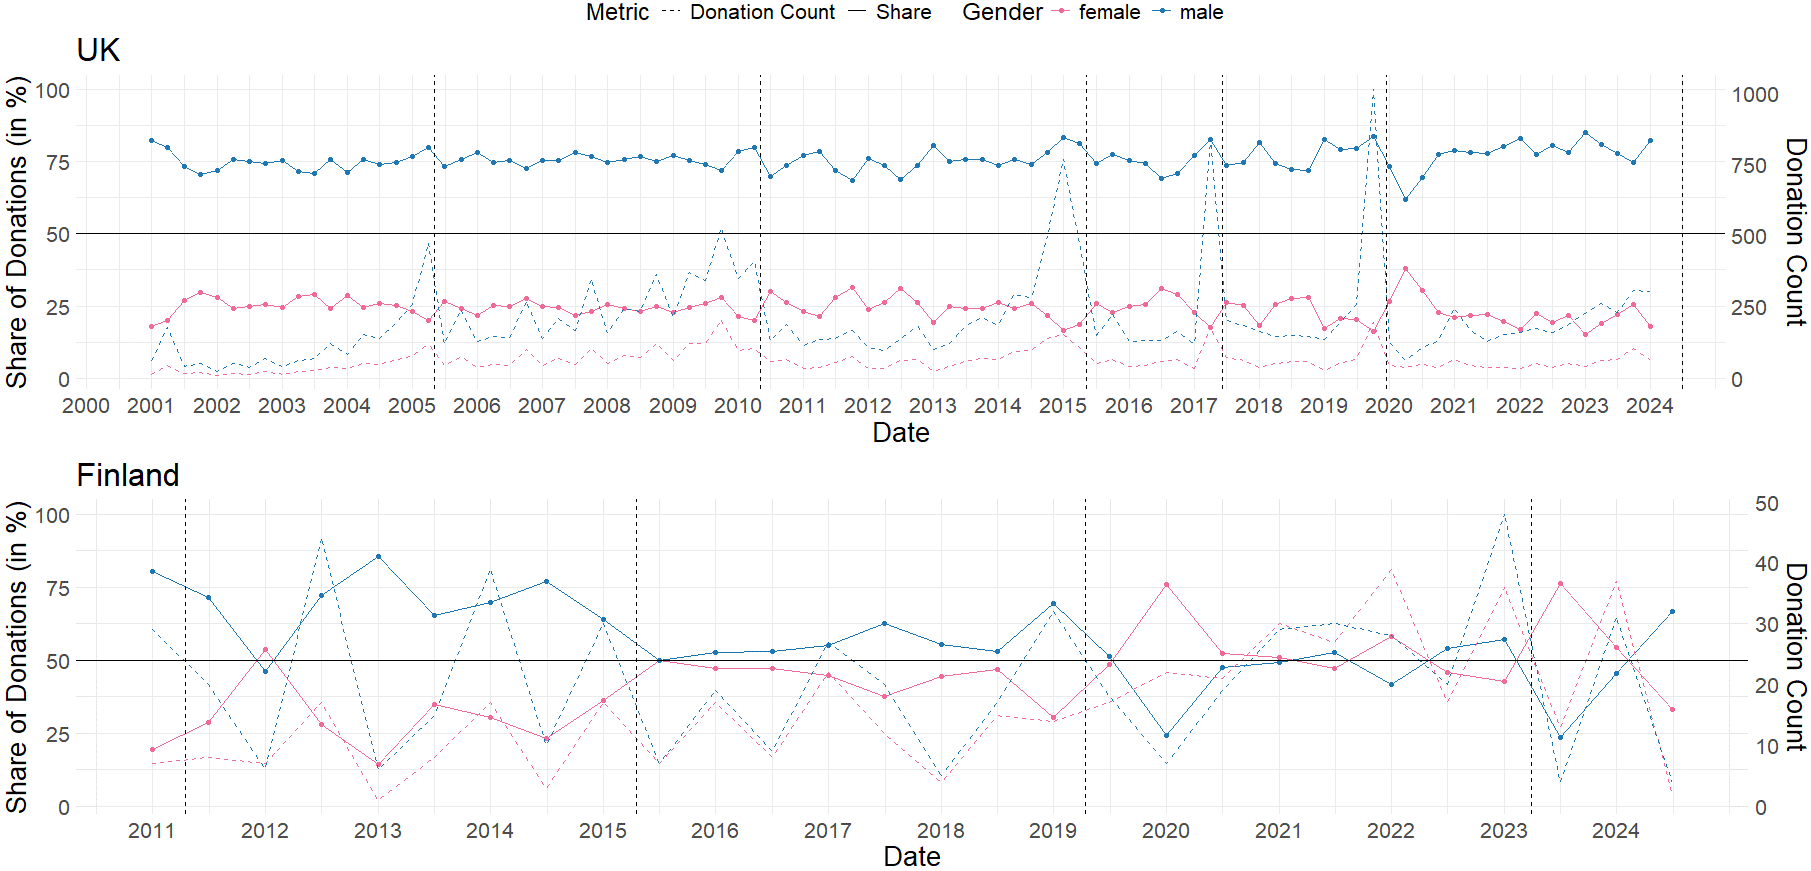
Do donation shares vary over time? While the Italian data is limited (spanning only four years), the UK and Finland datasets allow for a more detailed analysis. These datasets include specific information on when donations were received (UK) or reported to the oversight agency (Finland). Donations in the UK were aggregated into quartiles, while for Finland, data was aggregated by half-year periods due to the smaller number of donations. Figure 2 presents donation shares over time for the UK and Finland, with solid lines representing the share of donations by gender and dashed lines indicating the count of donations for each gender.Footnote 8 Vertical dashed lines in the figure indicate election dates.
Share of donations by gender over time.
Notes: Solid lines represent the percentage share of donations split by gender; dashed lines represent the number of donations by gender. Dashed vertical lines indicate the timing of national parliamentary elections. Data for the UK is aggregated by quartile; data for Finland is aggregated per half-year.
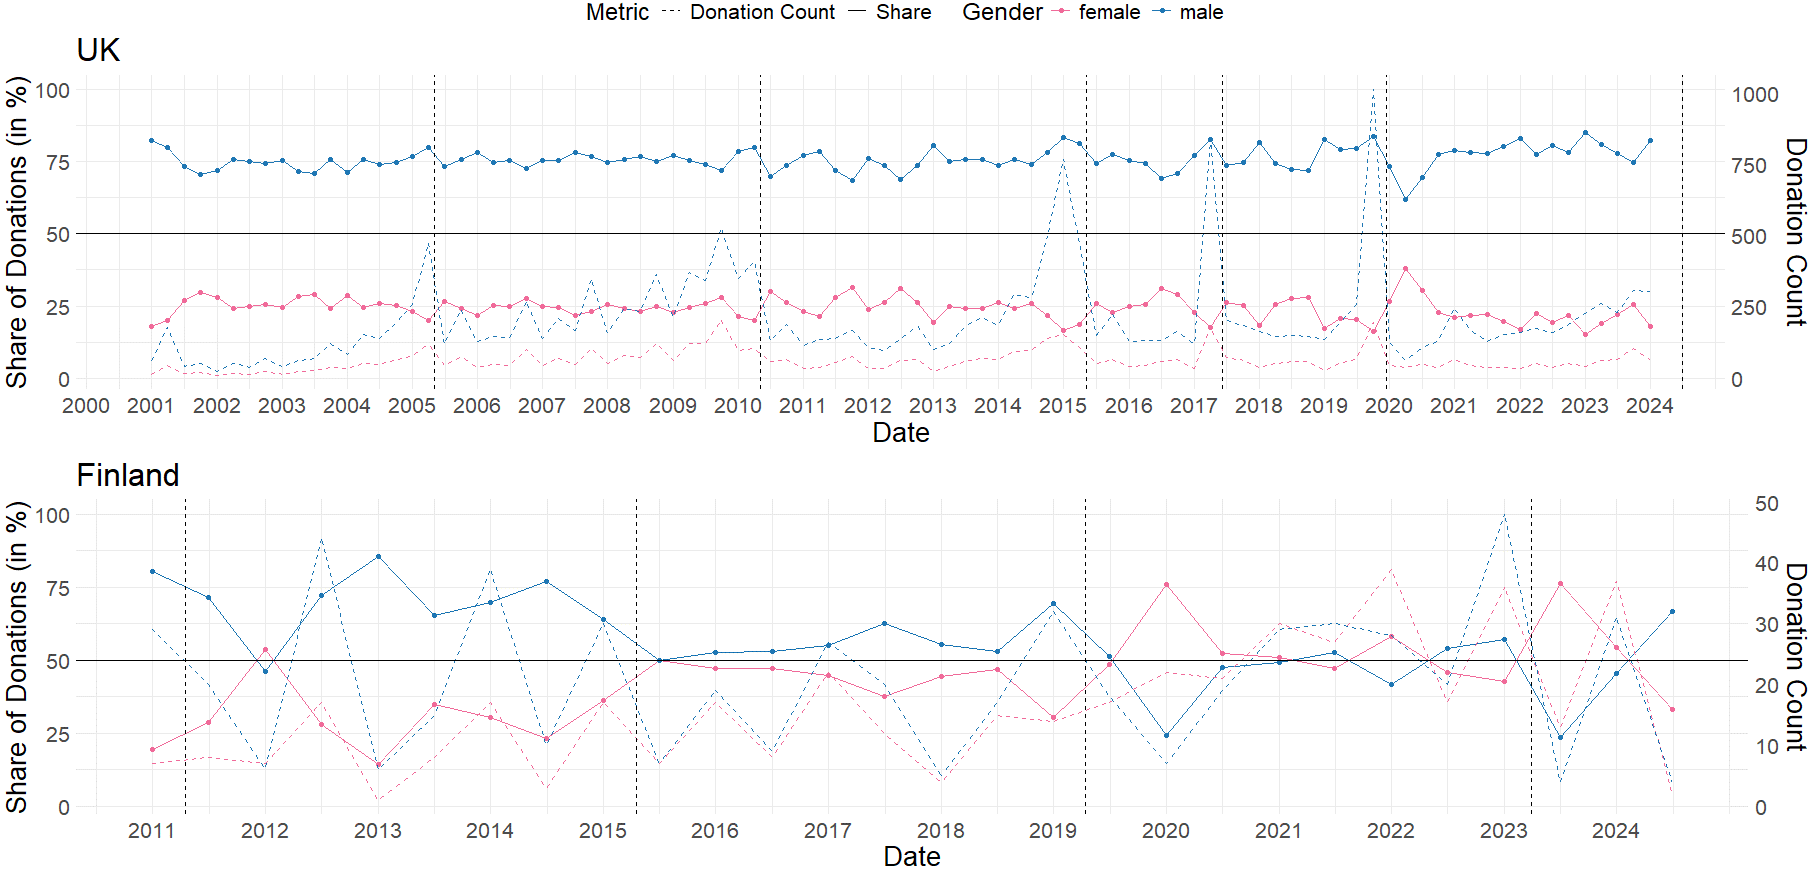
Figure 2 Long description
The line graph presents data on the share of donations by gender over time for the UK and Finland. The x-axis represents the years from 2000 to 2024 for the UK and from 2011 to 2024 for Finland. The y-axis on the left shows the share of donations in percentage, while the y-axis on the right indicates the donation count. The graph includes lines for female and male donors, with the share of donations depicted by solid lines and the donation count by dashed lines. In the UK, the share of donations from male donors consistently remains higher than that from female donors, with fluctuations in the donation count over the years. In Finland, the share of donations by gender shows more variability, with periods where female donors’ share exceeds that of male donors. The donation count in Finland also varies significantly over the years. All values are approximated.
From these graphs, two main conclusions emerge: first, while there is variation in the share of donations by gender over time, the gender gap remains relatively stable in the UK. In contrast, Finland shows more fluctuation, with women donating more frequently than men in some periods. This pattern is typically driven by a decline in male donations rather than an increase in female donations. Second, gender gaps in donation shares seem particularly pronounced before elections. Both donations in the UK and Finland show a rise from both genders before elections. However, donations from men increase more sharply than those from women and decline more after the election, suggesting that men may be more influenced by elections in terms of their likelihood to donate.
The reasons behind these patterns are difficult to determine with the available data. One possible explanation is that men may find elections, which are often perceived as competitive, particularly salient, resulting in higher levels of interest and incentives to donate than women. Political parties might target male donors more aggressively before elections, knowing that men are more likely to donate. Future research should investigate these patterns further.
To conclude this part, there is support for the idea that men, on average, donate more frequently than women (E1), which resonates with previous research on gender differences in political engagement and gendered political behavior. This effect is less pronounced in Finland compared to Italy and the UK. In Finland, the gender gap in donation frequency is more volatile over time, while in the UK, men consistently make up the majority of donors.
Gender gaps in donation amounts
This section assesses potential gender gaps in donation amounts, beginning with an examination of the patterns of donation sums pooled over time. Table 2 presents the median donation amounts and the 25% and 75% quantile ranges in brackets for both women and men, as well as the gender difference across the three countries.Footnote 9
First, Table 1 reveals that median donation amounts in the UK are, on average, substantially higher than in Finland and Italy. The median donation in the UK is approximately €3,073, compared to the lower, though still substantial, median amounts of €695 in Italy and €1,860 in Finland for donations over e1 500 (noting that these sums are relatively high compared to the average monthly salary in their respective countries). This difference is particularly interesting given that while both the UK and Finland provide public funding for political parties, Italian parties do not receive state funding.
Gender differences in median donation amounts (pooled)

Table 1 Long description
The table presents median donation amounts across three countries: the UK, Italy, and Finland, with a focus on gender differences. It includes four columns: Country, Pooled, Men, Women, and Difference. The UK shows the highest median donation amount at 3,072.85, with men donating 3,315 and women donating 2,718, resulting in a significant difference of 597. Italy has a median donation amount of 695.04, with men donating 694 and women donating 747, showing a slight difference of -53. Finland has a median donation amount of 1,860.13, with men donating 1,880 and women donating 1,800, resulting in a difference of 80. The table reveals that median donation amounts in the UK are substantially higher than in Finland and Italy. The median donation in the UK is approximately 3,073, compared to 695 in Italy and 1,860 in Finland. This difference is particularly interesting given that while both the UK and Finland provide public funding for political parties, Italian parties do not receive state funding.
Notes: 25% and 75% quantile values in brackets. Signif. Codes: *** <0.01, ** <0.05, * <0.1.
In both the UK and Finland, men tend, on average, to donate more than women, with statistically significant median donation amount differences of €597 and €80, respectively. In Italy, the median donation by women is slightly higher (€53), though this difference is not statistically significant. The differences in donation amounts are also reflected in the 25% and 75% quartiles, and while the 25% quartile is approximately €200 lower for women than for men in the UK and Finland, the 75% quartile is more than €2,000 higher for men than for women in both countries. Hence, the gender gap exists among both small and large donors but is more pronounced among large donors in Finland and the UK, while the 25% is the same for both genders in Italy, and the 75% is even larger for women in Italy. Therefore, while there is a pronounced gender gap in the frequency of donations in the UK and Italy, the gap in donation amounts is only significant in the UK and Finland. However, it is much smaller in Finland compared to the UK. To reiterate, this might be partially due to the imposed disclosure threshold of €1,500 in Finland, which might hide smaller donations by either gender.
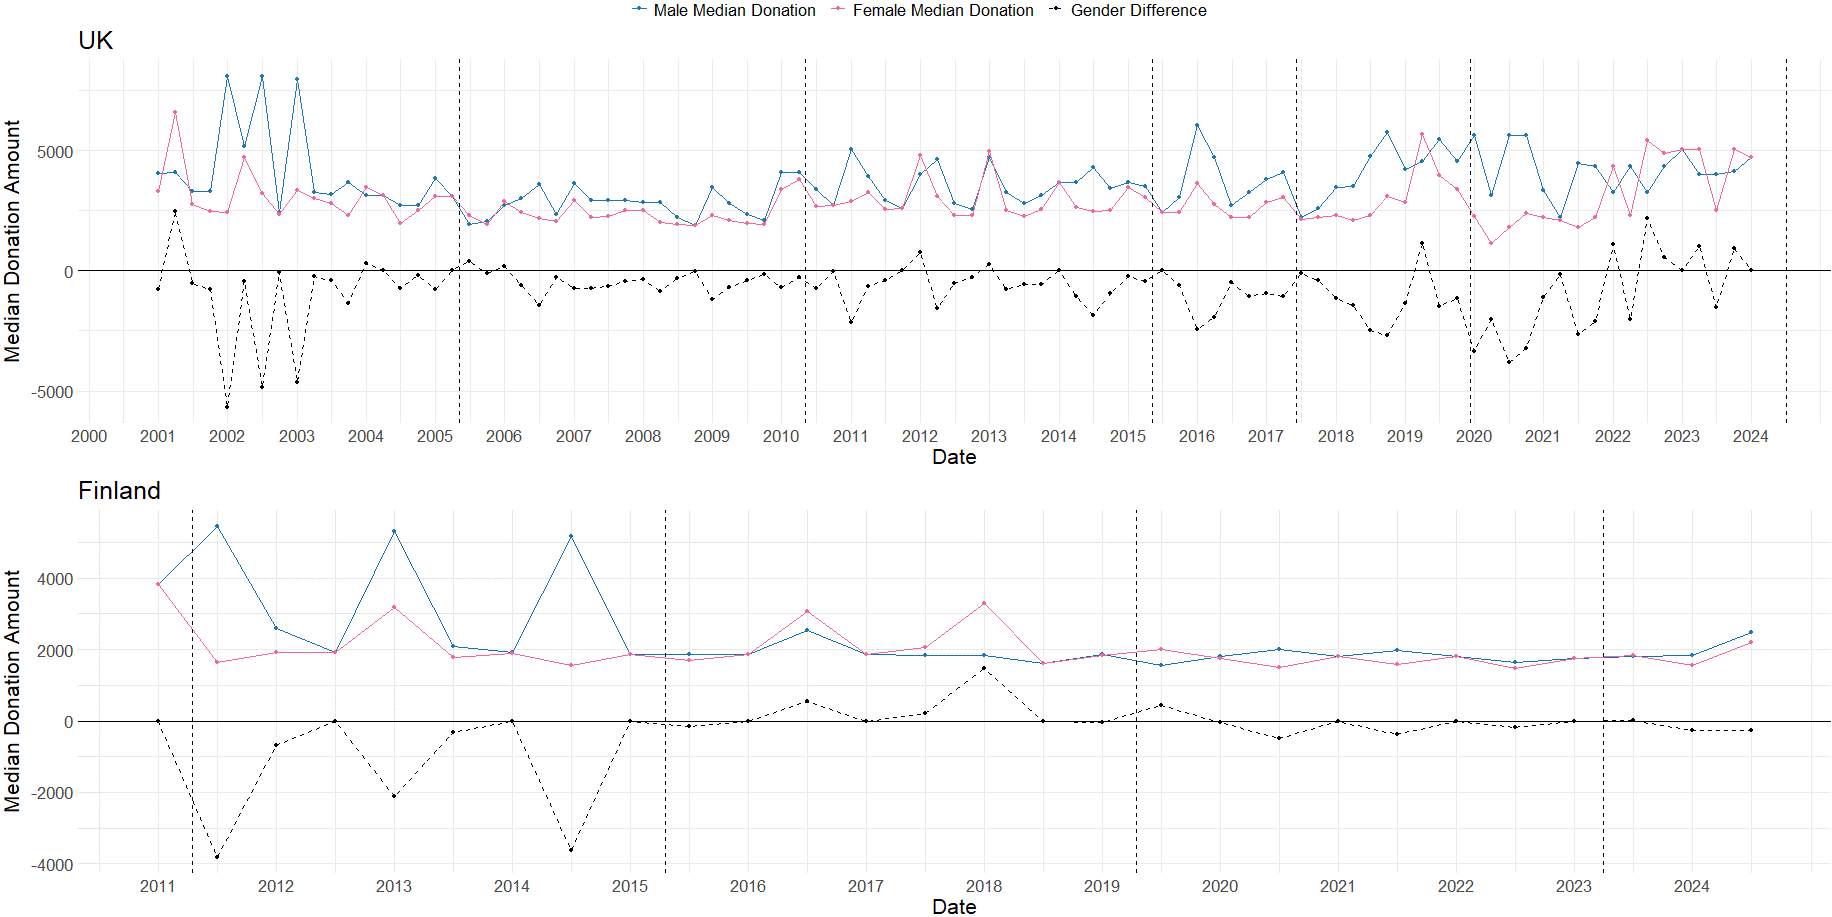
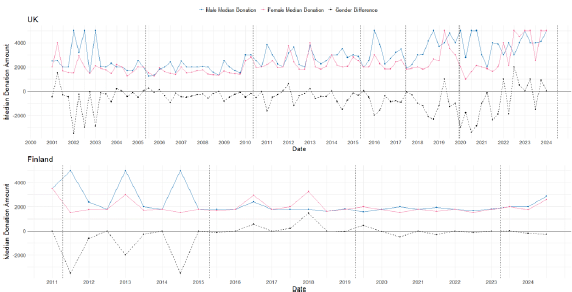
Next, I investigate the gendered dynamics over time, displayed in Figure 3. Following the approach used in Figure 2, data was aggregated quarterly for the UK and half-yearly for Finland.Footnote 10 The solid-colored lines represent the median donation amounts made by men (blue) and women (red). The dashed black line represents the gender difference in the median donation amounts, with negative values indicating that the median donation by men was larger than that by women, and positive values indicating the opposite. Dashed vertical lines indicate the timing of elections.
Gender differences in donation amounts over time.
Notes: Solid lines represent the median donation amount split by gender. The dashed black line represents the gender gap (male-female) in median donation amounts. Dashed vertical lines indicate the timing of national parliamentary elections. Data for the UK is aggregated by quartile; data for Finland is aggregated per half-year.
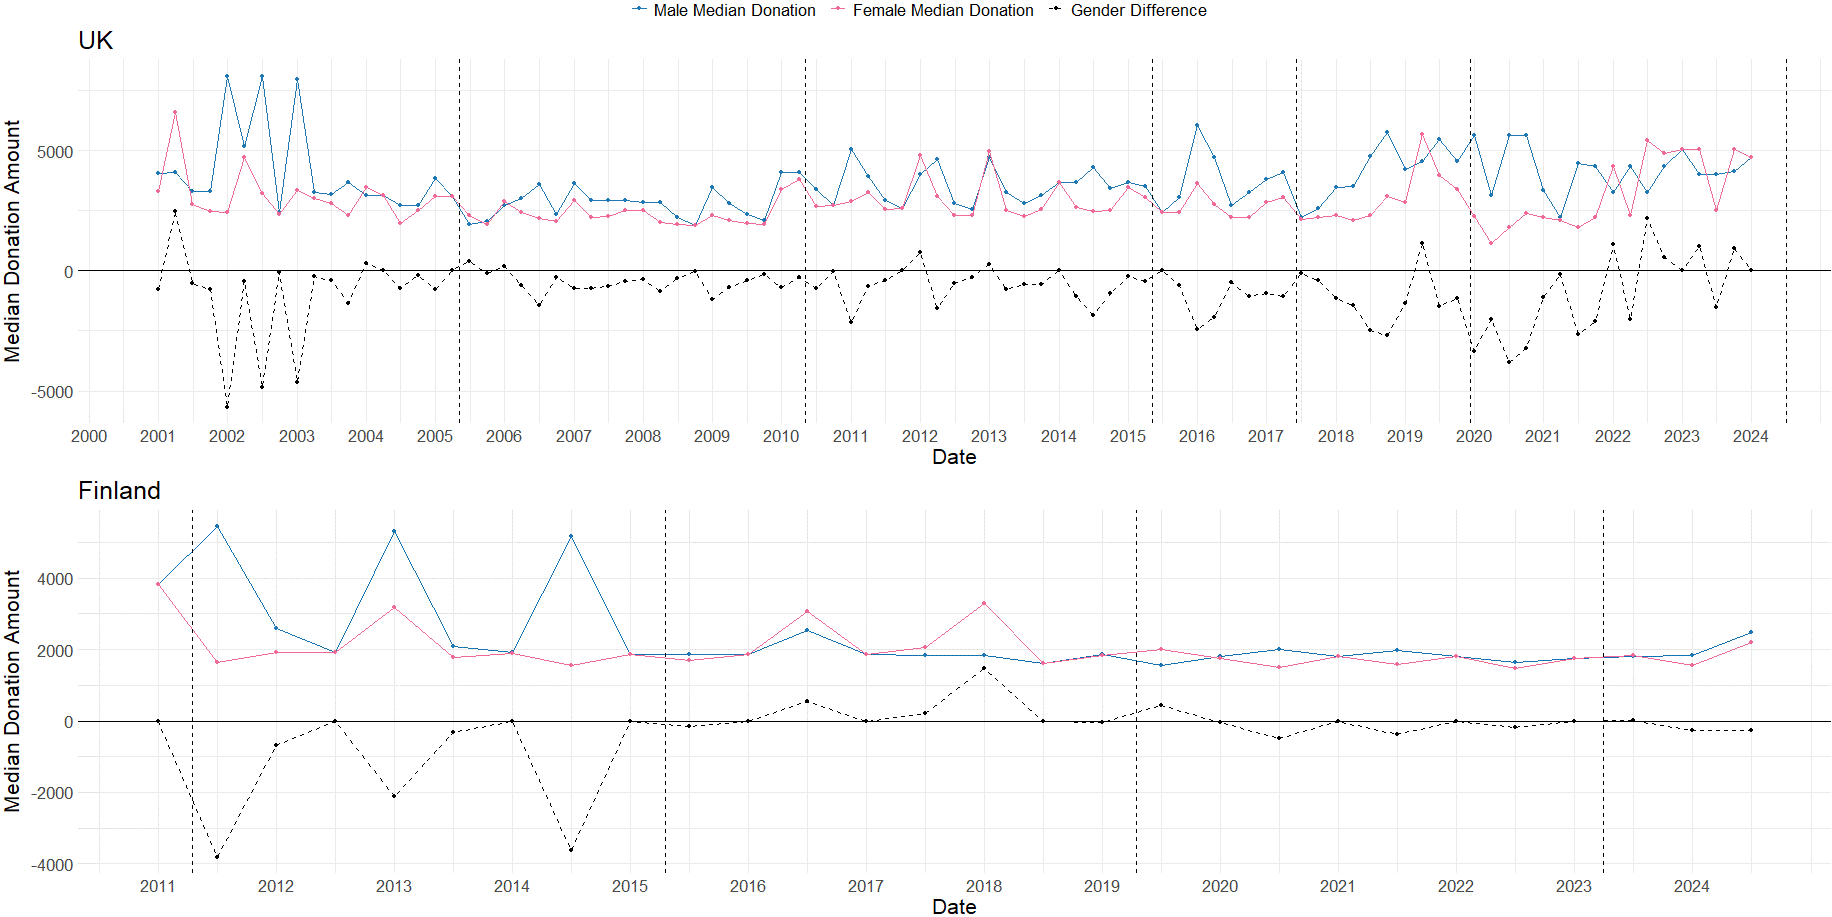
Figure 3 Long description
The image contains two line graphs showing gender differences in donation amounts over time for the UK and Finland. The top graph represents the UK, while the bottom graph represents Finland. Each graph has three lines: one for male median donation, one for female median donation, and one for gender difference. The x-axis represents the date, ranging from 2000 to 2024 for the UK and from 2011 to 2024 for Finland. The y-axis represents the median donation amount, with values ranging from negative to positive. The male median donation line is in blue, the female median donation line is in red, and the gender difference line is in black. The graphs show fluctuations in donation amounts over time, with notable peaks and troughs. The gender difference line indicates the disparity between male and female donations, with variations in both positive and negative directions. All values are approximated.
The overtime analysis largely confirms the findings from the pooled data. While in several quartiles in the UK, men donate higher amounts than women, the gender gap in median donation amounts is less pronounced than the gender gap in donation frequency. The overtime analysis also reveals patterns not seen in the pooled data. For Finland, the finding that women donate less than men does not hold for most periods past 2015, after which gender differences in donation amounts are minimal. At time points at which the gaps in donation amounts become more pronounced, few donations are registered by Finnish parties (e.g., in mid-2014, when the median donation amount for male donors is about €3,000 higher than for women, only seven donations from women and fourteen by men were registered); hence, gender gaps in donation amounts in either direction seem driven by a few large donations, and conclusions on the gender gap should be made with caution. In contrast, the UK analysis relies on substantially higher numbers of donations at any time point, and the gender difference seems more volatile over time, particularly past-2016.
While one can only speculate about the reason for this increase in volatility, one possibility is that the Brexit vote in 2016 might have increased politicization of both genders, while the Covid-19 pandemic decreased the income of many women taking on additional childcare responsibilities. Finally, the finalization of Brexit at the end of 2020 might have provided new incentives for female donors.Footnote 11
Interestingly, while a more pronounced gender gap in the share of donations appears just before elections in Finland and the UK, this pattern does not replicate in the median donation amounts. In fact, the gender gap in median donation amounts is close to zero before most elections, with women donating similar amounts in the quartile preceding most elections. Generally, the gender gap in donation amounts is much less pronounced at many time points than the gap in donation frequency. This suggests an interesting tension between donation frequency and donation amounts, which could indicate that women might have less interest in donating to political parties rather than fewer financial resources to do so, although this reasoning remains speculative given the data at hand.
Additionally, there are notable spikes in median donation amounts by women in 2001/2002, 2012, 2019, and 2022/2023 in the UK and in 2018 for Finland during mid-electoral cycles. In many cases, this pattern is driven by an increase in the median amount donated by women, rather than a drop in the amount donated by men. An intuitive explanation for this could be that these spikes coincide with local elections, as women are more engaged in local politics because decisions affecting women are often made at the local level (Bauer Reference Bauer2020; Coman and Shair-Rosenfield Reference Coman and Shair-Rosenfield2025; Huddy and Terkildsen Reference Huddy and Terkildsen1993; Tolley, Lawlor, and Fortier-Chouinard Reference Tolley, Lawlor and Fortier-Chouinard2023). However, data in both cases is reported only at the national level, but neither the UK nor Finland held local elections around the times when donation amounts from women spiked. While Finland held local elections in 2021, 2017, and 2012, local elections in the UK are held on a rolling basis, with not all municipalities holding elections simultaneously. Thus, there does not appear to be an easy or straightforward explanation for the spikes in women’s median donation amounts mid-electoral cycle.
Which parties are likely to have female donors?
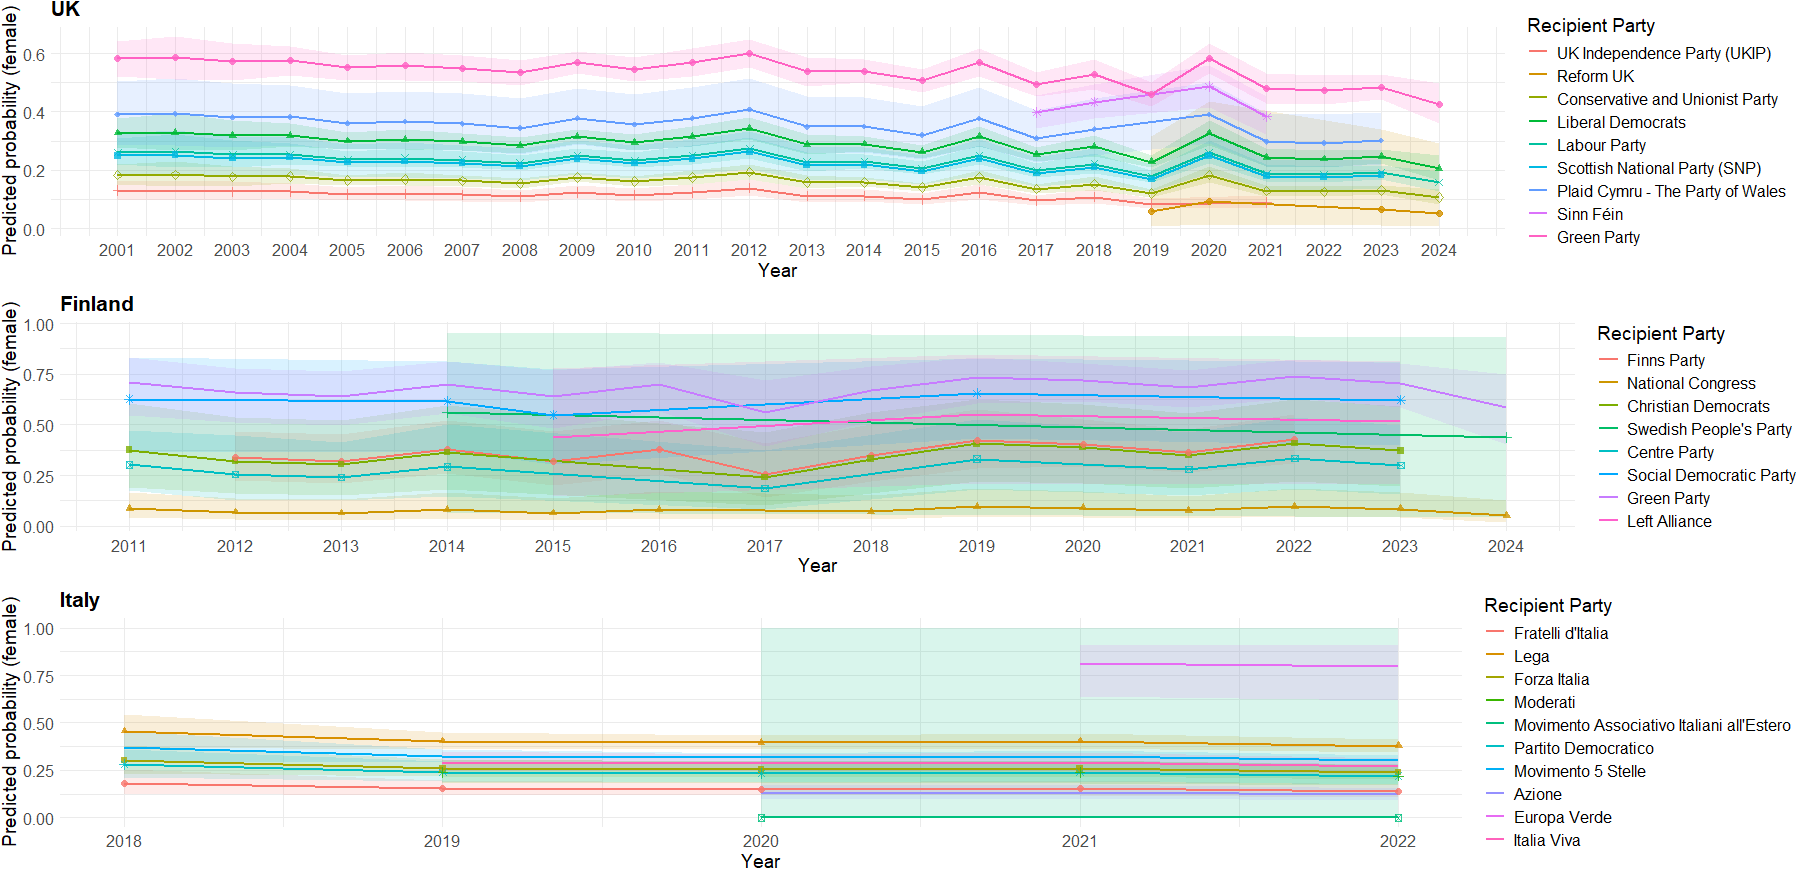
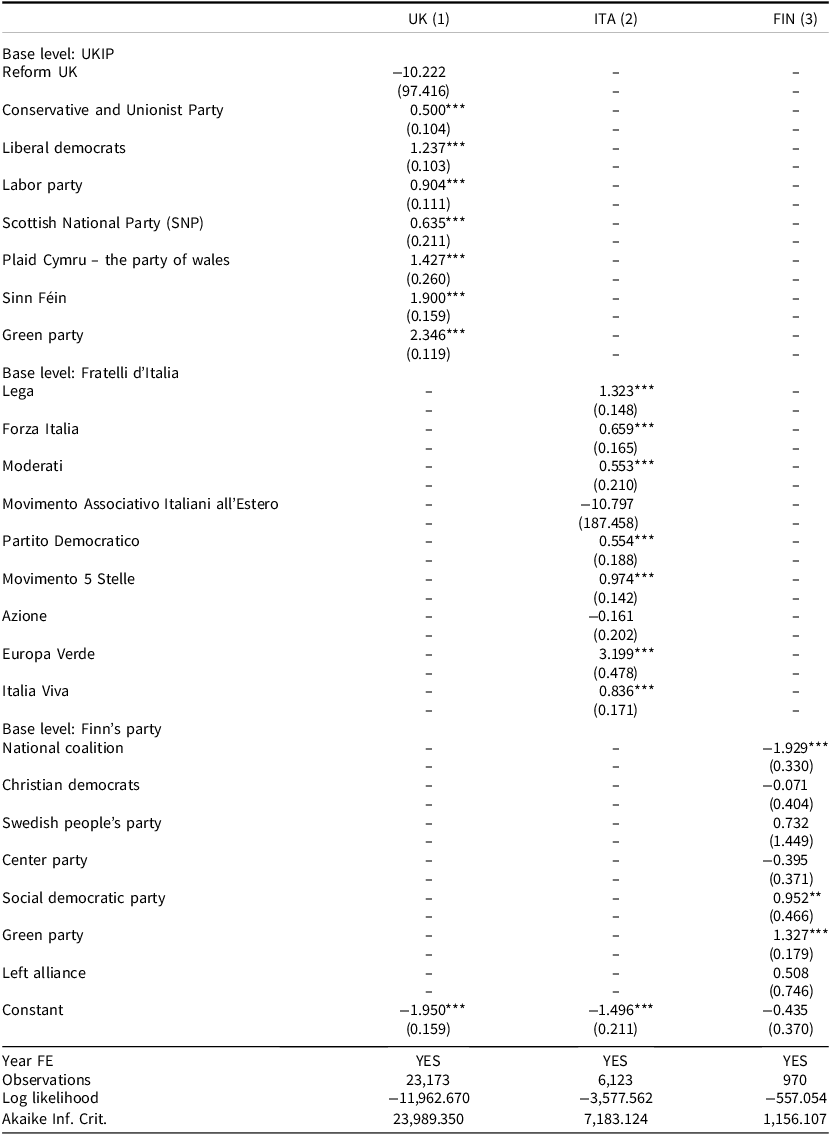
The final set of analyses examines which political parties are most likely to receive donations from female donors. Figure 4 presents the predicted probabilities for each party of a donor being female, based on three logistic regression models. All models include year-fixed effects. Detailed numerical results are available in Table A3 in the Appendix below.
Likelihood of a female donor by party.
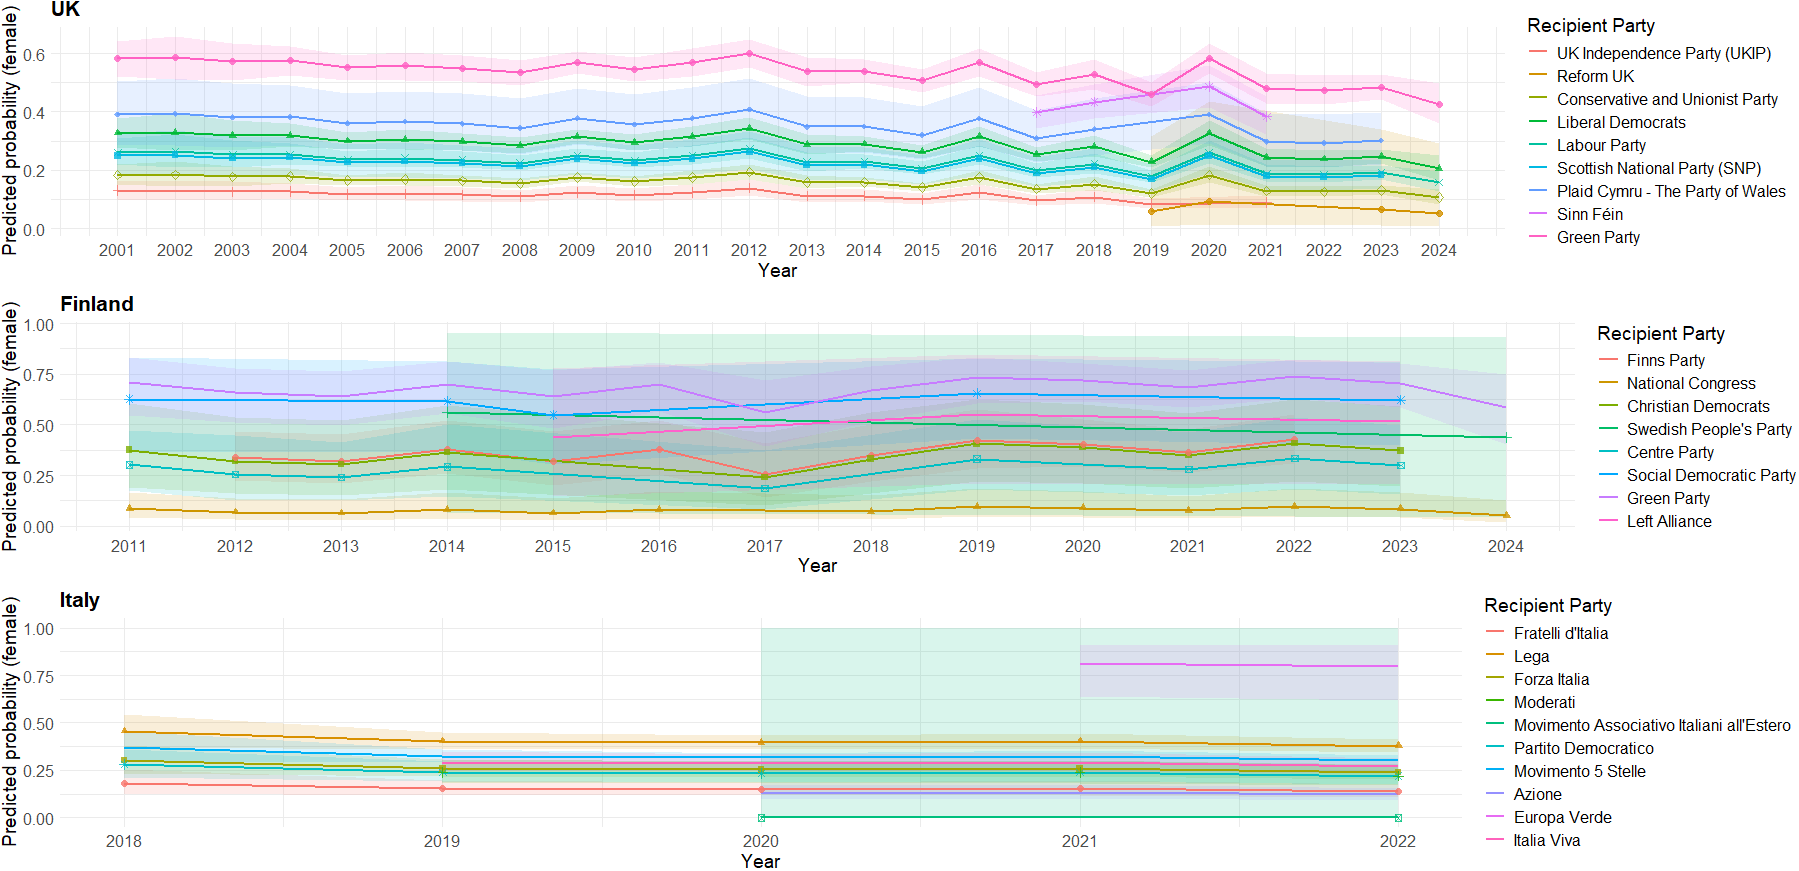
Figure 4 Long description
The image contains three line graphs showing the likelihood of a female donor by party in the UK, Finland, and Italy over time. Each graph represents a different country and includes multiple lines, each corresponding to a different political party. The x-axis represents the year, while the y-axis represents the predicted probability of a female donor. The UK graph spans from 2001 to 2024, the Finland graph from 2011 to 2024, and the Italy graph from 2018 to 2022. Each line graph shows trends and variations in the likelihood of female donors for different parties over the specified years. The UK graph includes parties such as the UK Independence Party, Reform UK, Conservative and Unionist Party, Liberal Democrats, Labour Party, Scottish National Party, Plaid Cymru, The Party of Wales, Sinn Fein, and the Green Party. The Finland graph includes parties like the Finns Party, National Congress, Kokoomus, Christian Democrats, Swedish People’s Party, Centre Party, Social Democratic Party, Green Party, and Left Alliance. The Italy graph includes parties such as Fratelli d’Italia, Lega, Forza Italia, Azione, Movimento Associativo Italiani all’Estero, Partito Democratico, Movimento 5 Stelle, Europa Verde, and Italia Viva. The lines show fluctuations in the predicted probability of female donors for each party over the years. All values are approximated.
The results in Figure 4 largely support the expectation that green and left-leaning parties are most likely to receive donations, but the evidence to the contrary, that women would be least likely to donate to right-leaning parties, is rather mixed. Across all three cases, the party with the highest predicted probability of receiving a donation by a woman is a green party (ITA: Europa Verde). In the UK, this is followed by the regionalist parties Sinn Féin and Plaid Cymru, while in Finland, the Social Democratic Party has the second highest predicted probability of receiving a donation by a female donor, although this is based on a very small number of donations overall (24), while UKIP and Reform UK have the lowest probabilities of receiving a donation by a female donor, with Reform UK receiving no donations from women since 2019 and only receiving 11 donations overall.
Contrastingly, in Italy the right-wing party Lega Nord is the second most probable recipient of a donation from a woman, aligning with the also comparatively high probability of the Finnish right-wing party Finn’s Party receiving a donation from a woman (around 0.4, fifth highest predicted probability). Hence, while in Finland parties more to the left are more likely to receive donations from female donors, among the centrist and right-leaning parties the probability does not decrease with an increase in more right-leaning positions, although the indifference among the Finnish center and right-leaning parties is partially driven by small numbers of observations.
The parties that have received a substantial proportion of donations in Finland are the Green party, the National Congress, and the Finns Party, with women clearly dominating donations to the Green party (about 75% of donations are made by women), and the opposite being apparent for the Finns Party and the National Congress (1/3 of donations to the Finns Party and about 10% of donations to the National Congress were made by women). A potential reason for this finding and the finding that the Italian Lega has a relatively high probability of receiving a donation by a woman might be that in more gender-equal contexts and in contexts in which radical right parties recently increased their popularity (like Lega did between the 2018 and 2022 elections), women who support right-leaning parties might be less sensitive to potential penalties for openly supporting a radical right party (Harteveld, Dahlberg, Kokkonen et al. Reference Harteveld, Dahlberg, Kokkonen and Van Der Brug2019; Harteveld and Ivarsflaten Reference Harteveld and Ivarsflaten2018). An alternative explanation could be that these parties successfully changed their image of ‘men’s parties’ by emphasizing gender equality, particularly in relation to their anti-immigration and anti-Islam language (Akkerman Reference Akkerman2015; Scrinzi Reference Scrinzi2017), and strategically nominating women to attract female voters (Weeks, Meguid, Caul Kittilson et al. Reference Weeks, Meguid, Caul Kittilson and Coffé2023). However, given the nature of the data, one can only speculate about such mechanisms, leaving deeper investigations of this issue to future research.
Overall, while for the UK the results show that women are more likely to donate to green parties and regional parties and least likely to donate to right-leaning parties, this expectation does not hold in the case of Italy, and in the case of Finland, evidence is rather mixed.
Conclusion
The findings of this research note indicate that women donate less frequently than men in all three countries, the UK, Italy, and Finland, although the gap is less pronounced in Finland than in the other two countries. These findings align with previous research from North America (McMahon, Sayers, and Alcantara Reference McMahon, Sayers and Alcantara2023; Tolley, Besco, and Sevi Reference Tolley, Besco and Sevi2022), where similarly sized gender gaps were found (between 32 and 37% of donations are made by women), as well as Janusz’s (Reference Janusz2025) study on Brazil, which reported that women make up approximately 29% of donors.
When investigating the gender gap in donation frequency over time, it appears that, at least in the UK’s case, the gender gap is quite persistent over time. This result might initially seem surprising, but once one considers that gender equality has stagnated since the early 2000s (Afonso and Blanco-Arana Reference Afonso and Blanco-Arana2025) and gender gaps in political interest and efficacy persist (Fraile and de Miguel Moyer Reference Fraile and de Miguel Moyer2022), the results might be more intuitive. Additionally, when looking at the patterns over time, the gender gap in donation shares seemingly becomes particularly pronounced just before elections. This raises important questions about what motivates men to donate more frequently in the lead-up to elections compared to women. The available data does not allow answering these questions, which warrants attention in future research.
Contrasting findings from North America indicate that the gender gap in donation amounts is not entirely consistent over time. In the Finnish case, the gender gap in donation amounts is almost non-existent past 2015, while the gap in the UK varies little prior to 2016. Post-2016, in the UK the donation amount gap varies substantially. While it is impossible to determine the cause of this based on the data at hand, it is possible that the 2016 Brexit vote, as well as the finalization of Brexit, resulted in differences in donation patterns, as did the decrease of disposable income for women during the Covid-19 pandemic. This variation opens up new avenues for research to explore the factors driving changes in the gender gap in donation amounts.
Furthermore, the results show mixed results regarding the parties that are likely to receive donations from female donors. While in all three countries, green parties have the highest probability of receiving a donation from a woman, only in the UK are other left-leaning and regionalist parties likely to next receive a donation and right-leaning parties the least likely to receive a donation from a woman. In Finland and Italy, counter to the theoretical expectation, the right-leaning parties, the Finns Party and Lega, have rather higher probabilities of receiving a donation by a woman, raising questions about women’s motives when donating to specific causes and whether right-leaning parties have successfully convinced female voters that they are no longer ‘men’s parties’.
While providing interesting insights, the data unfortunately do not allow me to examine how other individual-level characteristics of donors – such as age, education, employment, or migration background – might intersect with gender to influence donation patterns, what motivates donors to donate, or whether the same individual donates several times. In addition, the limited data availability for the case of Italy limits conclusions on overtime patterns in this context. Similarly, the restriction on the Finnish data that only donor names of donations larger than €1 500 are published could lead to an underestimation of the gap in donation amounts if smaller donors are primarily women and an overestimation of the frequency gap. Finally, due to the nature of the data, no causal conclusions can be drawn, and all analysis should be interpreted as descriptive in nature. Despite these limitations, this research note highlights intriguing patterns that contribute to understanding why women’s interests remain underrepresented in political donations.
Taken together, the results have important implications for research, raising questions about how motivations to donate differ between women and men and how this varies across the electoral cycle. Furthermore, given the finding that gender gaps in donation frequency do not translate into gender gaps in donation amounts, further research should also investigate whether it is donation amounts or donation frequencies that drive parties’ responsiveness to donors to untangle further whether and how donations result in the (under-)representation of women’s interests, as previous research highlights that donors’ interests are often prioritized by political parties (Canes-Wrone and Gibson Reference Canes-Wrone and Gibson2019; Gilens Reference Gilens2012).
Data availability statement
Data is publicly available.
Financial support
The author acknowledges funding received by the European Commission for the Horizon RESPOND project Grant Agreement No 101132405.
Competing interests
No conflict of interest to be declared.
Appendix
Additional information on the cases and data transformations
The three cases chosen for the analysis in this research note vary only moderately in their party finance systems, and particularly in regard to donations. In Finland, parties receive state subsidies based on how many seats in parliament they achieved, and parties that reach at least 2% of the votes are entitled to partial party support. In 2023, political parties in Finland received a total of €34.57 million in government subsidies and registered €7.1 million in donations. It should, however, be noted that 2023 was an election year in Finland, and the registered donation amount in 2024 was considerably lower at €3.59 million (c.f. Oversight of political party funding in 2024 – Report of the National Audit Office R10/2025 VP). Donations to political parties are capped at €30,000 per person per year, and donations are allowed by both private individuals and legal persons. For donations above €1,500, the name of the donor must be made public. According to a recent data collection effort headed by the investigative journalism team, Follow the Money, despite the disclosure requirement being set to €1,500, for more than 90% of the total donation amount received by political parties in Finland, donors are identifiable.
In the United Kingdom, similar to Finland, political parties do receive financial support from the government. However, in general, this financial support is lower compared to other sources of income of parties; in total, parties in the UK received €16 million of public subsidies in 2023, while reporting a total of €69 million in donations from both natural and legal persons. Parties, hence, rely to a larger extent on donations in the UK compared to Finland.
Finally, in Italy, parties do not receive any direct public funding after the Law on New Norms for the Reimbursement of Expenses (1999, amended 2011) was abolished by decree in 2014. Since then, parties primarily rely on private sources of income (Feo, Fiorelli, and Piccio Reference Feo, Fiorelli and Piccio2023). In 2018, private money, e.g., from donations, constituted between 40.8% (Partido Democratico) and 100% (Movimento 5 Stelle) of parties’ income, with other income sources primarily being membership fees, a ‘party tax’ that elected officials pay to their parties, and other income the party generates through their own activities (e.g., investments, courses, …) (Fiorelli Reference Fiorelli2022).
Gender gaps in donation sums re-run with the full UK data
Gender differences in median donation amounts
Gender differences in median donation amounts (pooled)

Table A1 Long description
The table presents data on gender differences in median donation amounts in the UK. It includes four columns: Pooled, Men, Women, and Difference. The rows display the median donation amounts for each category. The Pooled column shows a median donation amount of 3,748. The Men column indicates a median donation amount of 4,627 with a quantile range of 2,245 to 12,470. The Women column shows a median donation amount of 2,940 with a quantile range of 1,907 to 7,871. The Difference column highlights a gender difference of 1,687. The table also includes notes explaining that 25% and 75% quantile values are in brackets and provides significance codes: 0.01, 0.05, 0.1.
Notes: 25% and 75% quantile values in brackets. Signif. Codes: ***<0.01, **<0.05, *<0.1.
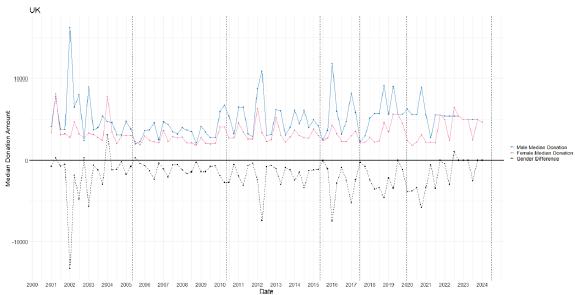
Gender differences in donation amounts over time, full sample.
Notes: Solid lines represent the median donation amount split by gender. The dashed black line represents the gender gap (male-female) in median donation amounts. Dashed vertical lines indicate the timing of national parliamentary elections. Data for the UK is aggregated by quartile.
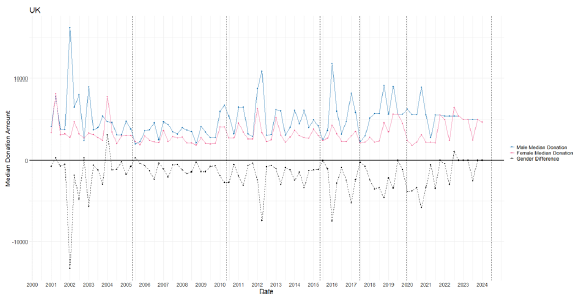
Figure A1 Long description
A line graph displays gender differences in donation amounts over time, full sample. The x-axis represents the years from 2000 to 2024, while the y-axis represents the median donation amount ranging from negative 10000 to positive 10000. The graph includes three lines: one for male median donation, one for female median donation, and one for gender difference. The male median donation line fluctuates significantly, with peaks around 2001, 2012, and 2016, reaching values above 10000. The female median donation line also shows fluctuations but remains generally lower than the male median donation line. The gender difference line oscillates around the zero mark, indicating varying differences between male and female donations over the years. All values are approximated.
Gender gaps in donation sums re-run with nominal amount
Gender differences in donation amounts over time, nominal amounts.
Notes: Solid lines represent the median donation amount split by gender. The dashed black line represents the gender gap (male-female) in median donation amounts. Dashed vertical lines indicate the timing of national parliamentary elections. Data for the UK is aggregated by quartile.
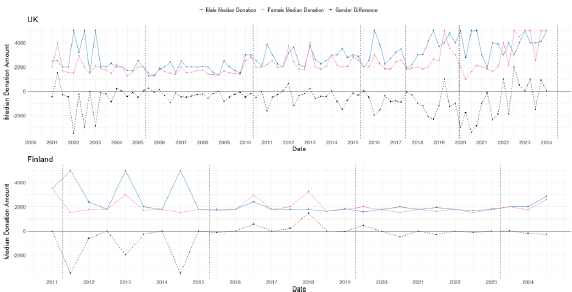
Figure A2 Long description
The image contains two line graphs. The first graph shows the UK’s median donation amounts by gender from 2000 to 2024. The x-axis represents the years, and the y-axis represents the median donation amount in Euros. The graph includes three lines: one for male median donations, one for female median donations, and one for the gender difference. The second graph shows Finland’s median donation amounts by gender from 2011 to 2024. The x-axis represents the years, and the y-axis represents the median donation amount in Euros. This graph also includes three lines: one for male median donations, one for female median donations, and one for the gender difference. Both graphs indicate fluctuations in donation amounts over time, with the UK showing more significant variations compared to Finland. The gender difference line oscillates around the zero mark, indicating periods where either gender donated more. All values are approximated.
Gender gaps in donation amounts normalized by threshold for Finland
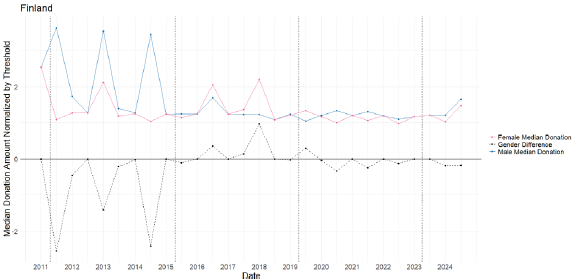
In this section, I present the results of the analysis involving donation amounts for Finland using a normalized measure of these amounts. To normalize, I divided the donation amounts by 1500 (the reporting threshold) instead of expressing the gaps in donation amounts as a multiple of the threshold. This means that a value of 1.0 is interpreted as the donation (gap) being exactly at the reporting threshold, while a value of 2.0 means the donation (gap) is twice the threshold (€3,000).
The pooled median donation in Finland is 1.24 times the disclosure threshold, closely matching men’s median donation (1.25) and slightly exceeding women’s median donation (1.20). This implies that the typical male donation is approximately 25% above the threshold, while the typical female donation is about 20% above it. The quartile values show more pronounced gender differences: for women, 25% of donations are exactly at the threshold, and 75% fall below 1.4 times the threshold (approx. €2,100), indicating a tight concentration around the minimum reportable amount. For men, however, the distribution is considerably more dispersed, with a higher lower quartile (1.17) and an upper quartile exceeding three times the threshold (3.04), suggesting that a subset of male donors contributes substantially larger amounts.
Gender differences in median donation amounts, pooled

Notes: 25% and 75% quantile values in brackets. Signif. Codes: ***<0.01, **<0.05, *<0.1.
Gender gap in donation amounts over time for Finland: amounts normalized to disclosure threshold.
Notes: Solid lines represent the median donation amount split by gender. The dashed black line represents the gender gap (male-female) in median donation amounts. Dashed vertical lines indicate the timing of national parliamentary elections. Data for Finland is aggregated per half-year.
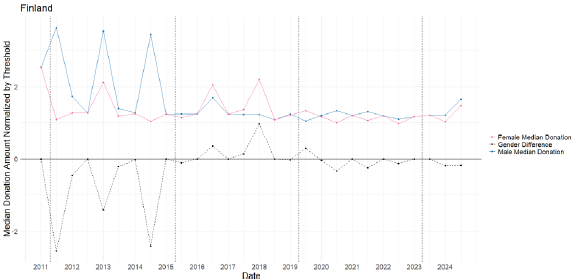
Figure A3 Long description
The line graph illustrates the gender gap in donation amounts over time for Finland, with amounts normalized to the disclosure threshold. The x-axis represents the years from 2011 to 2024, while the y-axis shows the median donation amount normalized by threshold. The graph includes three data lines: Female Median Donation in red, Male Median Donation in blue, and Gender Difference in black. Female and male median donations fluctuate over the years, with notable peaks and troughs. The gender difference line oscillates around the zero mark, indicating varying disparities between male and female donations. All values are approximated.
Share of donations and donation amounts over time in Italy
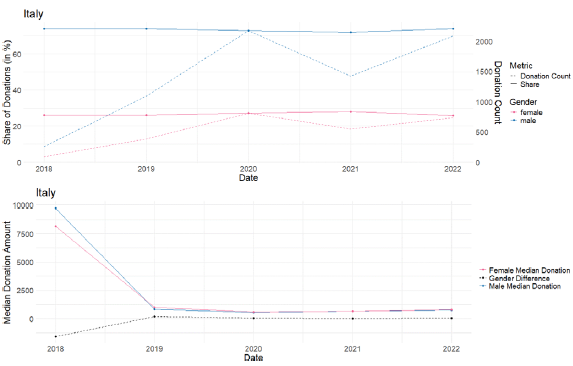
Gender gap in the share of donations and donation amount over time for Italy.
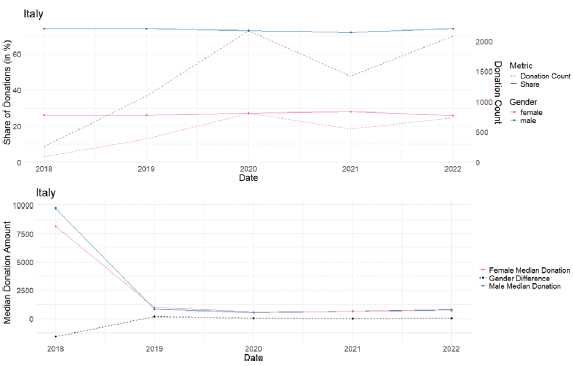
Figure A4 Long description
The image contains two line graphs depicting the gender gap in the share of donations and donation amount over time for Italy. The top graph shows the share of donations in percentage on the left y-axis and donation count on the right y-axis, with the x-axis representing the years from 2018 to 2022. The graph includes two lines, one for female donors and one for male donors, indicating the share of donations. The bottom graph shows the median donation amount on the y-axis and the years from 2018 to 2022 on the x-axis. It includes three lines representing female median donation, gender difference, and male median donation. The top graph shows that the share of donations from female donors increases over time, while the share from male donors decreases. The bottom graph shows a significant drop in the median donation amount for both genders from 2018 to 2019, after which the amounts stabilize with minor fluctuations. The gender difference in median donation amount remains relatively small and stable over the years.
Logistic regression results
Likelihood of a female donor for different parties
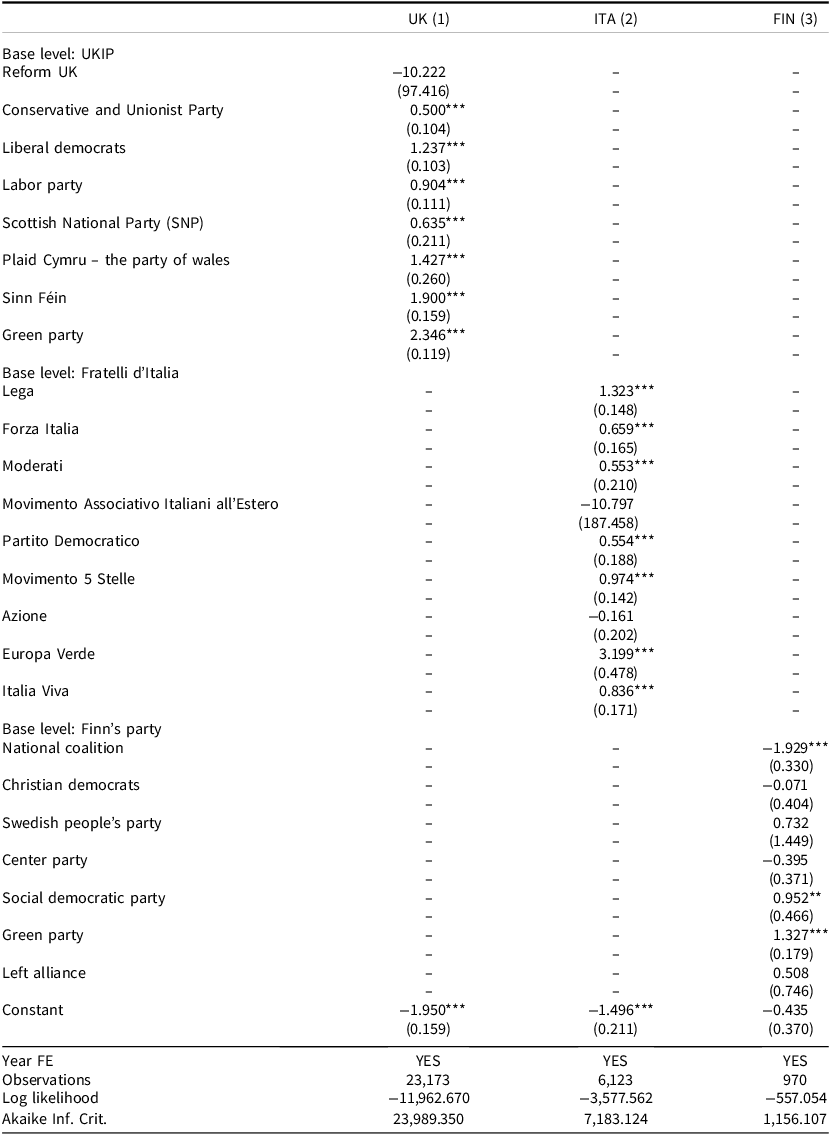
Table A3 Long description
The table presents data on the likelihood of female donors for various political parties in the UK, Italy, and Finland. It includes base levels and specific party data. The UK section lists parties such as UKIP, Reform UK, Conservative and Unionist Party, Liberal Democrats, Labor Party, Scottish National Party, Plaid Cymru, Sinn Fein, and Green Party. The Italy section includes parties like Lega, Forza Italia, Moderati, Movimento Associativo Italiani all’Estero, Partito Democratico, Movimento 5 Stelle, Azione, Europa Verde, and Italia Viva. The Finland section lists parties such as National Coalition, Christian Democrats, Swedish People’s Party, Center Party, Social Democratic Party, Green Party, and Left Alliance. The table also includes statistical values such as constants, year fixed effects, number of observations, log likelihood, and Akaike Information Criterion. Notable trends include high likelihood values for certain parties and significant variations across countries.
Note: *p < 0.1; **p < 0.05; ***p < 0.01




 Open access

