


Introduction
In Japan, tuberculosis (TB) notification rate has declined about 60-fold in the past seven decades, from 698 per 100 000 population in 1951 to 12.3 per 100 000 population in 2018 [1]. However, about 5000 smear-positive TB cases are still reported annually [1] and these potentially infectious cases pose a public health threat to the community. TB outbreaks involving hospitals, including psychiatric hospitals, workplaces, the military, schools, prisons and sometimes the homeless, have also been reported [Reference Ota and Isshiki2–Reference Endo10].
Outbreak investigations of communicable diseases, including detection, prevention and response to outbreaks, are considered as an important part of the health systems [Reference Bloland11], because they not only provide a scientific basis for implementing control measures to terminate the threats to the public's health but also opportunities for research about a problem and training of health personnel [Reference Goodman, Buehler and Koplan12].
In 1993, the Ministry of Health and Welfare (MHW) of Japan started collecting reports from prefectures on ‘group infections’, defined as more than 20 cases of latent tuberculosis infection (LTBI), occurring in more than two households, and caused by one and the same source, modifying the old definition proposed by Drion et al. [Reference Drion, Peters and Kromsigt13]. One case of TB disease is equivalent to six of LTBI in the definition. The Ministry has periodically provided brief feedback reports on the TB outbreaks; however, the feedback reports only included very brief analyses of time trends and transmission sites where the TB outbreaks often occurred [14]. This study aims to further epidemiologically describe the TB outbreaks reported to the Ministry from 1993 to 2015, in terms of time, place and transmission site, and compare the number of cases of TB disease and LTBI by site to explore the population at risk of TB outbreaks.
Methods
A TB outbreak was arbitrarily defined in our study as an event in which three or more laboratory- or clinically diagnosed cases of TB disease were found in a well-defined setting such as a workplace, health or welfare facility, school, restaurant or household, to focus on medium to large TB outbreaks and to exclude small ones.
As noted in the introduction, in 1993 the MHW (currently the Ministry of Health, Labour and Welfare, MHLW) began to collect reports of TB outbreaks from prefectures and large cities all over Japan. A brief feedback from the MHLW is available on its website, which lists outbreaks that occurred from 1993 up to the end of 2015 [14]. The data were doubly entered in Microsoft Excel sheets and discrepancies were later resolved. The variables available were the time (year and month) when the index TB case was diagnosed, the prefectures and, in the outbreaks that occurred after 2002, the names of large cities (but not other administrative divisions), and the transmission sites in which the outbreaks occurred, as well as the numbers of cases of TB disease, LTBI, and persons under observation or follow-up. There were some outbreaks in which multiple sites involved in the outbreak were listed. When this was the case, two of the authors (MO and YH) individually and arbitrarily decided the main location of the outbreak, and then a third researcher (SH) decided the final site if there were discrepancies between the two initial reviewers. The 2005 census data for the whole of Japan and the prefectures were used for calculating the rates of TB outbreaks per 1 million persons.
The data were analysed in terms of time (yearly trend and seasonality), place (by prefecture and large city) and the transmission site. The seasonality was compared by month and consecutive 2-month periods. In comparing the occurrence of TB outbreaks by prefecture, the numbers of TB outbreaks per 1 million population in prefectures were calculated and compared. The numbers of TB outbreaks and the numbers of cases of TB disease and LTBI per transmission site were also calculated and compared among them.
R (Ver. x64 4.0.2, The R Foundation for Statistical Computing, Vienna, Austria) was used for all the statistical analyses, including calculating 95% confidence intervals. Pearson's correlation analysis was used for the trend of the yearly data. Student's t test was used for comparisons of the averages of two groups. Tukey's honestly significant difference test was used for multiple comparisons of data in groups. A P value of <0.05 was considered statistically significant.
An institutional ethical review was not necessary because this study utilised data that were already public and did not involve patients' identification or confidential information.
Results
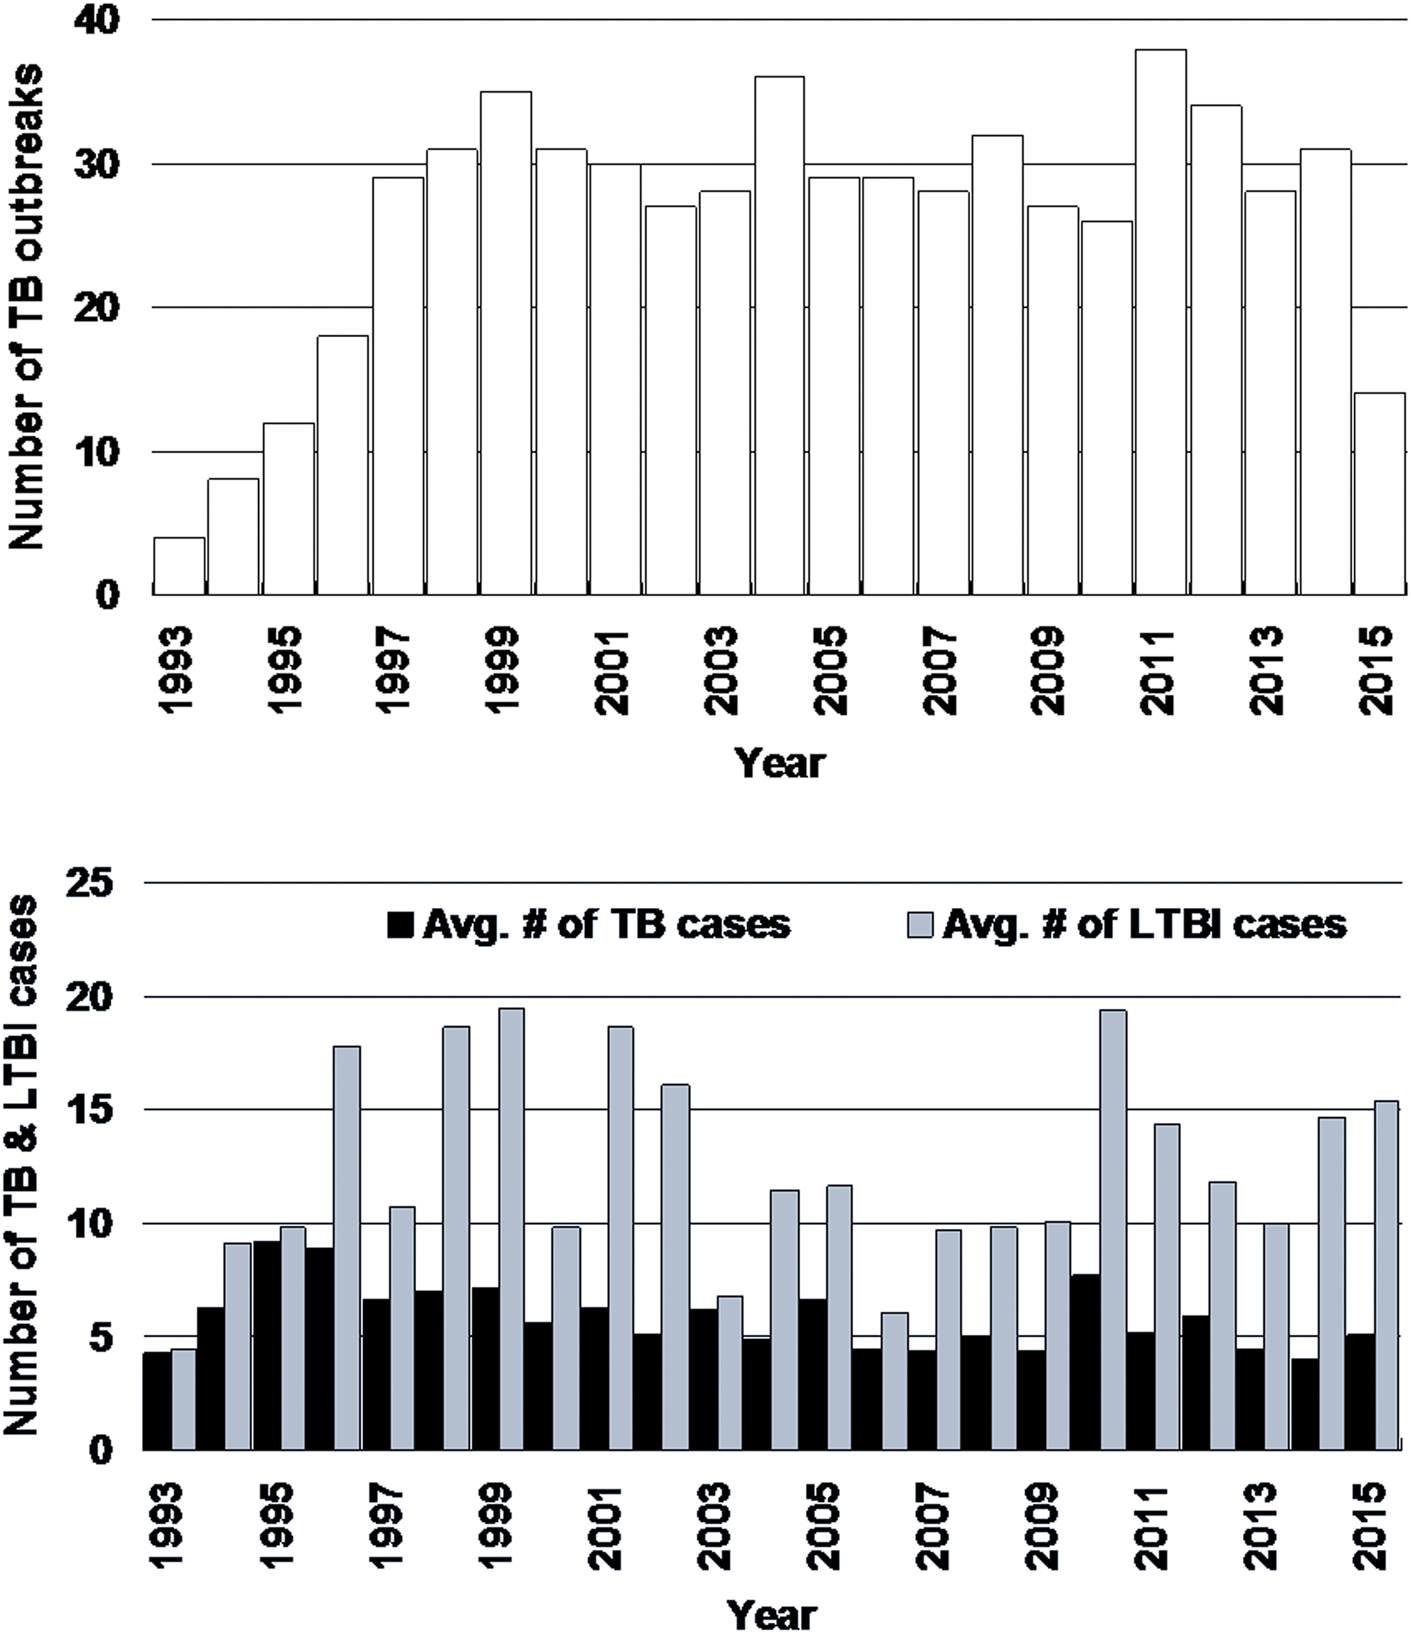
A total of 605 TB outbreaks with three or more cases of TB disease were found from 1993 through 2015. In 20 (3.0%) TB outbreaks, the two researchers' decisions on the main sites in which TB outbreaks occurred were different and the third researcher finally resolved the main sites. The average number of TB cases was 5.8 (95% confidence interval (CI): 5.3–6.2) per outbreak (range: 3–69), whereas the average number of LTBI cases was 12.8 (95% CI: 11.3–14.4) per outbreak (range: 0–152). The long-term trend of the outbreaks is shown in Figure 1 (upper). On average, 26.3 outbreaks (95% CI: 22.4–30.2) were reported per year and the number of reports exhibited an increasing trend with statistical significance (r = 0.45, 95% CI: 0.05–0.73). The average numbers of TB and LTBI cases per outbreak is shown in Figure 1 (lower). The average number of TB cases significantly decreased from 6.4 cases (95% CI: 5.7–7.1) per outbreak from 1993 to 2005, to 5.1 cases (95% CI: 4.6–5.6) per outbreak from 2006 to 2015 (P < 0.002). On the other hand, the number of LTBI cases did not significantly change (P = 0.28): it was 13.6 (95% CI: 11.1–16.1) per outbreak in 1993–2005, whereas it was 12.0 (95% CI: 10.3–13.6) per outbreak in 2006–2015. The average numbers of TB outbreaks that occurred in months in which the index TB patient was diagnosed are shown in Figure 2. The highest number (65) of TB outbreaks occurred in Mays (mean: 2.8, 95% CI: 2.0–3.6), whereas the lowest (37) in Decembers (mean: 1.6, 95% CI: 1.0–2.2). When compared by the consecutive 2-months period, the April–May period had the highest average number of TB outbreaks, with 5.5 (95% CI: 4.4–6.8) outbreaks per 2 months, whereas the December–January period the lowest, with 3.4 (95% CI: 2.3–4.5) outbreaks per 2 months and the difference was statistically significant (P < 0.05).
Long-term trend of tuberculosis outbreaks (upper) and the average numbers of cases of tuberculosis disease and latent tuberculosis infection (lower), Japan, 1993–2015 An increasing trend is exhibited (r = 0.45, 95% confidence interval: 0.05–0.73). # = number, AVG = average, TB = tuberculosis, LTBI = latent TB infection.
Distribution of tuberculosis outbreaks by month in Japan, 1993–2015. The month is defined as the one in which the index case of the tuberculosis outbreak was diagnosed. J = January, F = February, M = March, A = April, J = June, J = July, A = August, S = September, O = October, N = November, D = December. The error bars indicate 95% confidence intervals.

Tokyo had 120 outbreaks, followed by Osaka (n = 62), Kanagawa (n = 37), Aichi (n = 35) and Fukuoka prefectures (n = 31). The fewest were in Fukui and Yamanashi (both: n = 0), Tottori, Tokushima and Yamaguchi prefectures (all: n = 2). After 2002, large cities where the outbreaks occurred were also specified in the list. The city of Osaka had 19 outbreaks, followed by Yokohama (n = 10), Nagoya and Fukuoka (both n = 9) and Kyoto and Kawasaki (both n = 7). The rate of TB outbreaks occurring per 1 million persons by prefecture is shown in Figure 3. The prefectures with the highest rates of TB outbreaks were mostly in western Japan, including Saga (10.4 per 1 million people), Shimane (9.4) and Oita (9.1), but some were also in eastern Japan, including Tokyo (9.5), and Yamagata prefectures (7.4). The prefectures with the lowest rates of TB outbreaks were Fukui and Yamanashi (both: 0.0), Yamaguchi (1.3), Gifu (1.4) and Shizuoka (1.6).
Geographic distribution of tuberculosis outbreaks per 1 million population in Japan by prefecture, 1993–2015.

Table 1 shows the number of TB outbreaks that occurred and the average numbers of cases of TB disease and LTBI found by transmission site. Workplaces in general had the highest number of outbreaks (n = 253), followed by health facilities (n = 140), schools (n = 58) and welfare facilities (n = 49). Psychiatric hospitals had a significantly higher average number of TB cases (8.5 cases per outbreak, 95% CI: 6.7–10.3) than the workplaces (5.0 per outbreak, 95% CI: 4.6–5.4) and families (3.8 per outbreak, 95% CI: 3.4–4.2). The nursing homes also had a significantly higher average number of TB cases (8.5 cases per outbreak, 95% CI: 4.1–13.0) than families. In terms of LTBI cases, schools (29.0 per outbreak, 95% CI: 20.1–37.9) and prisons (38.9 per outbreak, 95% CI: 18.0–59.8) had higher average numbers than most of the other transmission sites. Of note, the average number of LTBI cases in schools decreased significantly from 35.1 (95% CI: 22.5–47.7) per outbreak in 1993–2005 to 16.5 (95% CI: 9.3–23.7) in 2006–2015. No other transmission sites exhibited a significant difference between the two periods (data not shown).
The numbers of outbreaks and the average numbers of cases of tuberculosis disease and latent tuberculosis infection by transmission site in Japan, 1993–2015

avg = average, CI = confidence interval.
a–rThe pairs the same superscript letters denote the pairs with statistically significant difference (P < 0.05).
Discussion
We analysed 23 years of data on 605 TB outbreaks reported in Japan and found that the number of TB outbreaks increased in the last two decades, the index cases of the outbreaks were more often found from April to May than from December to January, and the outbreaks occurred more often per 1 million persons in western Japan. The average number of TB patients found per outbreak was highest in psychiatric hospitals and nursing homes, and the average number of LTBI patients found was highest in schools and prisons.
The number of outbreaks has been increasing, probably because as the incidence of TB decreases, TB cases may stand out more and TB outbreaks may more easily be detected [Reference Drion, Peters and Kromsigt13]. Another reason would be that physicians and the public in general have become much less aware of TB and the diagnostic delay, as well as the delay in health seeking, has become longer, leading to increasing outbreaks. It is also possible that in early years of collecting the reports of TB outbreaks, particularly from 1993 to 1996, the local health staff members might not have been aware of the directive of the National TB Programme (NTP) and TB outbreaks might have been underreported. The index cases of the TB outbreaks were more often diagnosed in April to May than in December to January, probably because the 4 months preceding April to May (i.e. December to March) are in the winter when the average temperature is less than 10 °C in Japan [15], the windows of most buildings are shut to keep them warm inside, and ventilation is poor, facilitating TB transmission indoors [Reference Matsumoto7, Reference Raffalli16]. TB outbreaks occurred more often per 1 million population in western Japan, probably because the TB incidence is higher than average there [1]. Tokyo, the capital, had the fourth highest rate of outbreaks because the TB incidence is relatively high there [1]. However, another possibility is that occurrence of outbreaks reflects the quality or deficit of TB or communicable disease control practices of the prefecture, including delays in health-seeking of TB patients, diagnosis by physicians and contact investigations, as the top three prefectures in TB outbreaks per 1 million people were not the top three for TB notification rates. Osaka, Hyogo, and Tokyo (i.e. urban prefectures) were the regular top three prefectures for years [1]. The psychiatric hospitals involved in the outbreaks had more cases of TB disease than the workplaces in general, probably because in psychiatric hospitals in Japan, the patient's mental rather than physical condition is concentrated on and the delays of TB diagnosis tend to be longer [Reference Ota and Isshiki2, Reference Tasaka17]. Another reason is that most psychiatric hospitals accommodate long-term inpatients and once a patient develops smear-positive TB in a ward other patients, and possibly staff members working in the same ward, may easily be exposed. Schools and the prisons had larger numbers of LTBI cases than most other settings, probably because these facilities have larger numbers of persons as contacts and a sputum smear-positive case can easily transmit TB bacilli to others nearby [Reference Tasaka6–Reference Homma and Itoh8]. These facilities may also have an environment in which the air exchange rate is low, causing more TB transmission among contacts [Reference Matsumoto7]. After 2006 when interferon-gamma release assays (IGRAs) [Reference Ogiwara18–Reference Sester21] were introduced in Japan, the average number of TB disease per outbreak reduced significantly because it became easier for the health authorities to specifically determine those who were likely to be infected with TB and they may have been able to prevent them from developing TB disease via prophylaxis [Reference Tasaka17]. The introduction of IGRAs may also have resulted in a reduced number of cases of LTBI thereafter; however, it was only visible in the TB outbreaks in schools where most cases of LTBI found were children and young adults. This is because in late 2007 the criteria of LTBI treatment was revised to cover all the age-groups [Reference Yamagishi22], whereas before 2007 only children and young adults up to 30 years of age were eligible for LTBI treatment [23], and the reduction of the number of the cases of LTBI enabled by the introduction of IGRAs was cancelled by the increased coverage of LTBI treatment.
There are a few review studies on TB outbreaks in the past. In the Netherlands, 44 TB outbreaks with more than six TB cases occurred from 1960 to 1964 [Reference Drion, Peters and Kromsigt13]. They found a median of 6 to 10 TB cases per outbreak, which is similar to our findings, whereas the commonest transmission sites were different. They were family or close relations (n = 16), followed by ‘business and university’ (n = 10), and ‘schools’ (n = 8). In Cataluña, Spain, from 1998 to 2002, 27 TB outbreaks affecting 69 secondary cases of TB disease were reported (on average 3.6 TB cases per outbreak), of which the majority (n = 19) occurred within family members, six in the community and one each in school and the workplace [Reference Bran24]. The US Centers for Disease Control and Prevention (US-CDC) conducted two review studies on TB outbreaks for which the US-CDC provided epidemiological assistance [Reference Mitruka25, Reference Mindra26]. From 2002 to 2008, 27 TB outbreaks with more than three culture-confirmed TB cases occurred, with a median of ten cases of TB disease per outbreak [Reference Mitruka25]. The commonest transmission sites were ‘drug houses’ (n = 17), homeless shelters (n = 5), and correctional facilities (n = 4). From 2009 to 2015, 21 TB outbreaks occurred and the median number of cases of TB disease was nine. The commonest transmission sites were households (n = 9), overnight homeless facilities (n = 8), and local jails (n = 8)[Reference Mindra26]. According to a review article on school TB outbreaks in China, 41% of the index patients were found in winter (December to February), followed by 28% in spring (March to May)[Reference Bao27], possibly because the Chinese study focused on school TB outbreaks.
There are some strengths and limitations to this study. The original data of this study were collected by the MHLW based on the directive of the NTP and the data are considered representative. Another strength is the large number of outbreaks included in the list without changing the reporting criteria for 23 years. On the other hand, one of the limitations would be that the study is based on secondary, brief data disclosed by the MHLW and the data are not comprehensive, limiting analysis on detailed factors such as the characteristics of TB in the cases. In addition, we had to rely exclusively on the classifications made by the MHLW, particularly the transmission sites. Second, the study was conducted in a country with a medium-burden of TB and the findings may not be generalisable to other countries. Third, since the outbreak reports from prefectures might not have been the final reports and the numbers of cases of TB disease and LTBI, not the final ones, the scope of the outbreaks might have been larger than described here. Even so, there were not any review reports on such a large number of TB outbreaks before and the authors believe it is of importance that this be published. Finally, the original data that MHLW disclosed did not clearly mention that the outbreaks were confirmed by molecular epidemiological evidence. However, the restriction fragment length polymorphism (RFLP) technique became available in Japan around 1995 and analysis of variable numbers tandem repeats (VNTR) became available around 2005 [Reference Takahashi28–Reference Matsumoto and Iwamoto32], so the authors believe that most outbreaks, particularly after 2000, were validated with the use of molecular epidemiology, exemplified by the TB outbreak reports [Reference Ota and Isshiki2, Reference Fujikawa4, Reference Tasaka6, Reference Homma and Itoh8–Reference Endo10, Reference Tasaka17].
There are several recommendations that can be made based on the findings of this and previous reports. As shown in our study, it is quite useful to collect and analyse the findings of TB outbreaks. Thus, countries, particularly those that have resources to investigate TB outbreaks, should collect and analyse the findings of such outbreaks, and share lessons learnt from them. We believe it will surely help TB surveillance systems to improve their capability to detect TB outbreaks, one of their major roles [Reference Dato, Wagner and Fapohunda33]. This would in addition strengthen general health systems in terms of prevention, detection and responses to disease outbreaks [Reference Bloland11, Reference Hagan34]. Because disease outbreaks are ‘natural experiments’, they present opportunities to address questions germane to both basic and applied epidemiology [Reference Goodman, Buehler and Koplan12, Reference Nsubuga35]. Since the introduction of IGRA for contact and outbreak investigations after 2006 seems to be reducing the number of TB cases per outbreak, the use of IGRA should be more widely adopted for such investigations, particularly in countries where BCG vaccination coverage is high and the results of tuberculin skin testing are likely to be confusing. Since psychiatric hospitals, nursing homes, schools and prisons had large numbers of cases of TB disease and LTBI when TB outbreaks occurred, they should strengthen TB screening for inpatients, clients, students, inmates and staff members with periodic chest X-ray examinations, if indicated. Since the capacity to respond to TB outbreaks varies, depending on the prefecture and city, the MHLW should build that capacity at the central level to provide technical assistance on-site such as TB mass screening, treatment and prophylaxis against MDR-TB, and epidemiology, as has been done in the US [36] and in Japan for acute communicable diseases [37]. The MHLW should also provide more detailed information on the outbreaks so that researchers can further analyse them and provide insights into TB outbreaks to the public health community.
Acknowledgements
This study was partially supported by the Japan Agency for Medical Research and Development (Grant #: JP20fk0108127).
Conflict of interest
None declared.
Data
The data we used are open for the public in the URI indicated in reference 14.


 Open access