


Introduction
The green bug aphid, Schizaphis graminum (Rondani) (Hem: Aphididae), is a destructive pest of small grains, especially wheat, Triticum aestivum L. (Morkunas et al., Reference Morkunas, Mai and Gabryś2011). Although this pest prefers wheat, it can also successfully feed on 70 graminaceous species including barley, sorghum, oat, and rye, as well as on wild grasses (Burd et al., Reference Burd, Porter, Puterka, Haley and Peairs2006). Schizaphis graminum damages crops by feeding on the phloem, which leads to decreased yield, reduced grain quantity and quality, as well as increased transmission of plant viruses (Gregg and Russell, Reference Gregg and Russell2005). The application of insecticides is the most effective and straightforward way to control aphids (Verkerk et al., Reference Verkerk, Neugebauer, Ellis and Wright1998). However, environmental concerns about insecticide use have led to the development of non-chemical control methods. In consequence, integrated management of aphid populations has been developed using biological controls, resistant cultivars, and microbe-based fertilisers (Disi et al., Reference Disi, Simmons and Zebelo2019). A group of plant-beneficial microorganisms, known as plant growth-promoting rhizobacteria (PGPR), colonises the rhizosphere and internal tissue of plants and has been widely used as biofertilisers (Vessey, Reference Vessey2003). PGPRs stimulate plant growth directly by producing phytohormones, solubilising nutrients, and fixing atmospheric nitrogen, or indirectly by synthesising siderophores and antimicrobial metabolites (Lareen et al., Reference Lareen, Burton and Schafer2016; Rashid and Chung, Reference Rashid and Chung2017). A notable increase in the growth and yield of several key crops in response to inoculation with PGPR has been reported in the previous studies (Biswas et al., Reference Biswas, Ladha and Dazzo2000; Khalid et al., Reference Khalid, Arshad and Zahir2004; Kumar et al., Reference Kumar, Maurya, Raghuwanshi, Meena and Tofazzal2016). Moreover, PGPRs can enhance induced plant resistance against pests and pathogens by modulating phytohormone production in plants like salicylic acid, jasmonic acid, and ethylene (Ramamoorthy et al., Reference Ramamoorthy, Viswanathan, Raguchander, Prakasam and Samiyappan2001; Robert-Seilaniantz et al., Reference Robert-Seilaniantz, Grant and Jones2011). Induced systemic resistance is characterised by the readiness of the plant to response more rapidly to herbivore attacks because of a primed defence state (Pieterse et al., Reference Pieterse, Zamioudis, Berendsen, Weller, van Wees and Bakker2014; Schädler and Ballhorn, Reference Schädler, Ballhorn, Cánovas, Lüttge and Matyssek2016). An increase in plant resistance induced by PGPRs has been found in various crops: in corn against Helicoverpa zea (Boddie) (Lep: Noctuidae) (Bong and Sikorowski, Reference Bong and Sikorowski1991), in cucumber against Diabrotica undecimpunctata Barber (Col: Chrysomelidae) (Zehnder et al., Reference Zehnder, Kloepper, Yao and Wei1997), in cotton against Helicoverpa armigera (Hubner) (Lep: Noctuidae) (Qingwen et al., Reference Qingwen, Ping, Gang and Qingnian1998), in bell pepper against Myzus persicae (Sulzer) (Hem: Aphididae) (Herman et al., Reference Herman, Nault and Smart2008), in canola against Brevicoryne brassicae Linnaeus (Hem: Aphididae) (Sattari Nasab et al., Reference Sattari Nasab, Pahlavan Yali and Bozorg-Amirkalaee2019), and in wheat against S. graminum (Veselova et al., Reference Veselova, Burkhanova, Rumyantsev, Blagova and Maksimov2019).
Inoculated plants with PGPRs have various negative effects on the biological characteristics and foraging behaviours of herbivores through altering profiles of primary and specialised metabolites in plants (Sattari Nasab et al., Reference Sattari Nasab, Pahlavan Yali and Bozorg-Amirkalaee2019; Serteyn et al., Reference Serteyn, Quaghebeur, Ongena, Cabrera, Barrera, Molina-Montenegro, Francis and Ramirez2020; Shakarami et al., Reference Shakarami, Mardani-Talaee and Moradi2021). This can affect the plant’s resistance or its attractiveness to insect herbivores (Rashid and Chung, Reference Rashid and Chung2017). The increased primary metabolites in plants treated with PGPR can facilitate the synthesis of plant defensive secondary metabolites. For example, wheat plants treated with Bacillus subtilis (Ehrenberg) showed an increase in certain secondary metabolites, such as phenols, which negatively influenced the biological parameters of Sitobion avenea (Fabricius) (Shakarami et al., Reference Shakarami, Mardani-Talaee and Moradi2021). Numerous studies also show PGPR ability to stimulate a range of defence enzymes in host plants, in response to herbivore infestation (Rajendran et al., Reference Rajendran, Samiyappan, Raguchander and Saravanakumar2007; Saravanakumar et al., Reference Saravanakumar, Lavanya, Muthumeena, Raguchander, Suresh and Samiyappan2008; Veselova et al., Reference Veselova, Burkhanova, Rumyantsev, Blagova and Maksimov2019). Nevertheless, to the best of our knowledge, there is little information concerning the utility of different PGPRs on wheat metabolites or on the foraging behaviours/performance of the green bug aphid. In this study, we aimed to enhance our understanding of how various strains of PGPRs (Pseudomonas geniculata Wright, Azospirillum oryzae Xie and Yokota, Pseudomonas brassicacearum Achouak, Azotobacter chroococcum Beijerinck) affect S. graminum behaviour and fitness through modulating wheat plant-induced resistance response. Accordingly, the first objective was to study the preference and performance of S. graminum on PGPR-treated plants versus untreated ones. The second objective was to investigate how PGPRs alter the primary and secondary metabolite levels in plants infested by aphids, as well as the metabolic changes occurring in the aphids themselves.
Materials and methods
Plant and insect culture
This study was carried out in the greenhouse and pest management laboratory at the Department of Plant Protection, College of Agriculture, Ferdowsi University of Mashhad, Iran. We utilised winter wheat, the ‘Pishgam’ cultivar, a popular variety widely grown in Khorasan Razavi province, with seeds sourced from the Agricultural Research Station at Ferdowsi University of Mashhad. The seeds were sown in 3-l plastic pots (18 cm in diameter and 17 cm in depth) filled with sterilised sandy-clay soil in a 2:1 ratio for rearing an aphid colony and conducting the experiment. The plants were kept under standard greenhouse conditions, with a 14:10 light/dark photoperiod, a temperature of 26 ± 2°C, and a relative humidity of 70 ± 10%. The S. graminum colony used in this research was initially obtained from a stock culture at the plant pathology laboratory of Shiraz University. This colony was maintained on wheat (cv. Pishgam) within a net-covered cage (60 × 70 cm in height and diameter) under similar environmental conditions. All experiments in this study utilised third-generation aphids.
PGPR treatment
Wheat seeds were treated with four species of PGPR prior to planting: (1) P. geniculata, (2) A. oryzae, (3) P. brassicacearum, and (4) A. chroococcum, along with a control group soaked in sterile water. These PGPRs were purchased from a commercial product of Biorun Company in Karaj, Iran. The surface-sterilised wheat seeds (with 0.02% sodium hypochlorite) were immersed in 10 ml of each PGPR solution (1 × 10⁸ colony-forming units, cfu/ml) for 3 h, while the control seeds were soaked in 10 ml of sterile water (Sudhakar et al., Reference Sudhakar, Thajuddin and Murugesan2011). After soaking, the seeds were air-dried on filter paper for 10 min before being planted in sterile soil. They were sown in 3-l plastic pots (18 cm in diameter and 17 cm in depth) filled with sterilised sandy-clay soil in a 2:1 ratio, and were kept under standard greenhouse conditions with a 14:10 light/dark photoperiod, a temperature of 26 ± 2°C, and 70 ± 10% relative humidity.
Scanning electron microscopic study
A study utilising electron microscopy was performed to investigate the presence and colonisation of various PGPR genera on plant roots, compared to those of non-inoculated control plants. Seven-day-old seedlings were randomly chosen from treatments of A. chroococcum, A. oryzae, P. brassicacearum, and a control group for scanning electron microscopy analysis (one species from each PGPR genus was used). Tissue samples from the roots of the inoculated seedlings were preserved in 2% glutaraldehyde (prepared in 0.1 M cacodylate buffer) at a temperature of 8°C for 1.5 h. The samples were then rinsed twice in the same buffer for 10 min each, followed by post-fixation in 1% OsO4 for 4 h. Dehydration was carried out using a series of ethanol concentrations: 30%, 50%, 70%, 85%, and 95% for 15 min each, followed by two washes in 100% ethanol for 15 min each. For the scanning electron microscopy, the critical point drying technique was employed, along with sputter coating, and imaging was performed using an Amary 1600 scanning electron microscope operating at 20 kV.
PGPR treatment effects on aphid preference
Aphid preference for PGPR-treated wheat plants was determined using a four-choice settlement assay in a completely randomised block design with seven replications. Each replicate (a circle shape cage, 45 cm in diameter and 40 cm in height) contained four pots, each including a plant with six intact leaves, representing one of the following treatments: A. chroococcum, A. oryzae, P. brassicacearum, and a control with a non-inoculated plant. In this experiment, between two Pseudomonas species, only P. brassicacearum was chosen due to its demonstrated greater efficacy against aphids in a preliminary experiment compared to P. geniculata (S. Mirzamohamadi, personal observation). Pots were arranged side-by-side inside the cage, and a circular foil sheet was adjusted over the pot surface in a way that only the plant stems stand out from the sheet. Thereafter, vials containing 60 wingless aphids were placed at the centre of the paper. The number of aphids on the plants per treatment was recorded after 1, 3, 6, and 24 h. The experiment was conducted in a greenhouse condition at 25 ± 5°C and 16:8 L:D light/dark photoperiod. The data collected at each time point (number of aphids on the plants) were analysed using a generalised linear model with a binomial distribution and overdispersion, using a logit link function. The number of aphids on the plants for each specific treatment was bound as one variable in relation to the total number of aphids on the plants across all treatments, using the cbind function in R software 4.0.2.
PGPR treatment effects on aphid performance
Each of the four PGPR treatments and the control group received eight wheat plants. For each treatment, at least 35 female S. graminum were randomly selected from the stock culture and transferred, with five aphids placed individually on the middle surface of fully expanded leaves (approximately 4 weeks old). Each aphid was enclosed in a ventilated clip cage measuring 3 × 1.5 × 1.5 cm. They were allowed to feed, colonise, and reproduce for 24 h, and then all adults and all young aphids except one first instar were removed. The remaining aphid was weighed on a microbalance, placed back on the plant, and allowed to mature into an adult. Once it reached maturity and began reproducing, all newly born offspring were counted and removed from the clip cage to calculate daily fecundity. The process continued until the last aphid died. The performance of the aphids was assessed by measuring immature development time (t), the mean relative growth rate (MRGR), and estimating the intrinsic rate of natural increase (rm). MRGR was calculated by weighing individual nymphs at birth (<1 day old) and again when they began reproducing. The formula for MRGR is MRGR = [ln(weight at the start of reproduction) – ln(weight at birth)]/t, where t represents the time (in days) between the two weighings (Van Emden, Reference Van Emden1969; Hosseini et al., Reference Hosseini, Ashouri, Enkegaard, Goldansaz, Nassiri-Mahalati and Hosseininaveh2010). The rm was computed using the equation provided by Birch (Reference Birch1948) as follows:
 \begin{equation*}\sum ^{l_x}{m_x}{e^{ - rx}} = 1,\end{equation*}
where lx is the probability of surviving to age x, mx is the average fecundity at age x, e is the base of natural logarithms, and r is the per capita instantaneous population growth rate (number per day).
Other parameters of the fertility life table, including the net reproductive rate 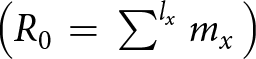 $\left( {{R_{0\,}} = \,\mathop \sum \nolimits^ {l_{x\,}}{m_x}\,} \right)$, the finite rate of increase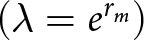 $\,\left( {\lambda = {e^{{r_m}}}} \right)$, the mean generation time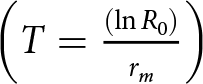 $\left( {T = \frac{{\left( {\ln {R_0}} \right)}}{{{r_m}}}} \right)$, and the doubling time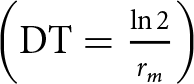 $\left( {{\text{DT}} = \frac{{\ln 2}}{{{r_m}}}} \right)$, were likewise calculated (Carey, Reference Carey1993). The jackknife method was employed to generate pseudo-values for comparing differences in R 0, λ, T, DT, and rm (Meyer et al., Reference Meyer, Ingersoll, McDonald and Boyce1986; Maia et al., Reference Maia, Luiz and Campanhola2000). To evaluate the impact of various PGPRs on the performance of S. graminum, the life table parameters of the aphid and MRGR were analysed using one-way ANOVA (Analysis of variance). The statistical differences among the means were compared using Tukey’s post hoc honest significant difference (HSD) test at P < 0.05. Prior to conducting the ANOVA, the data were checked for normality using the Shapiro–Wilk test and homogeneity of variances using Levene’s test.
Interactive effects between PGPR treatment and aphid infestation on protein, carbohydrate, total phenolic content, and enzyme activity in plants
A complete randomised design with a factorial arrangement was employed, consisting of four replications. The plants were treated with PGPRs either with or without aphids, leading to four treatment groups: (1) Control, with no PGPRs and no aphids; (2) Aphids, with aphids but no PGPRs; (3) PGPRs, with PGPRs but no aphids; and (4) PGPRs + Aphids, with both PGPRs and aphids. In groups 2 and 4, 20 aphids were placed on five leaves of approximately 4-week-old plants using clip cages (four aphids) to allow feeding, while groups 1 and 3 received empty clip cages. Chemical analyses were conducted at 0, 24, and 72 h post-infestation (hpi) on detached-infested leaves of plants from all treatment combinations. The aphids remained on the plants for the duration of the experiment and were removed just prior to the measurement times.
The total protein content in plants was determined according to the Bradford (Reference Bradford1976) method, with absorbance readings taken at 595 nm. Bovine serum albumin served as the standard for the calibration curve. The soluble carbohydrate content was measured according to the Van Handel (Reference Van Handel1965) method, where absorbance was recorded at 485 nm and calculated using a standard glucose curve. The total phenolic content was determined using the method by Zieslin and Zaken (Reference Zieslin and Zaken1993). For this, 1 g of plant tissue was mixed with 10 ml of 80% methanol at 70°C for 15 min. The reaction mixture contained 1 ml of the methanolic extracts, 5 ml of distilled sterilised water, and 250 µl of Folin–Ciocaltean reagent (1N). This solution was kept at 25°C, and absorbance was measured at 725 nm using a spectrophotometer. A calibration curve was plotted for the standard solution of gallic acid (0–100 ppm), and the phenolic content was reported as milligrams of gallic acid per gram of plant material.
To prepare the extraction of oxidative enzymes, 0.2 g of leaves was homogenised in a mortar with 1 ml of 100 mM phosphate buffer (pH 7.0). The resulting mixture was then centrifuged at 13,000 rpm for 20 min at 4°C. The supernatant was collected and stored in 1.5 ml Eppendorf tubes at −20°C until use.
The activity of peroxidase (PO) was determined following the method given by Chance and Maehly (Reference Chance and Maehly1955). The reaction mixture consisted of 1.5 ml of 100 mM sodium phosphate buffer (pH 7.0), 0.120 ml of 10 mM H2O2, 0.480 ml of 20 mM guaiacol, and 0.4 ml of the enzyme extract. The increase in absorbance was recorded for 3 min at 1-min intervals at a wavelength of 470 nm.
The polyphenol oxidase (PPO) spectrophotometer assay was performed following the method established by Mayer et al. (Reference Mayer, Harel and Shaul1965). The reaction mixture consisted of 1.5 ml of 0.1 M sodium phosphate buffer (pH 6.5) and 200 µl of the enzyme extract. The reaction was initiated by adding 200 µl of 0.01 M catechol, and the enzyme activity was measured as the change in absorbance at 495 nm/min/g fresh weight.
The catalase (CAT) activity was assayed according to the procedure of Aebi (Reference Aebi1984). The reaction mixture consisted of 50 mM potassium phosphate buffer, 10 mM H2O2, and the enzyme extract solution. The enzyme activity was expressed by the change in absorbance at 240 nm/min/g fresh weight. A blank sample contained the same mixture but without the enzyme extract.
The chemical data were analysed by two-way ANOVA. Before conducting ANOVA, all data were checked for normality and homogeneity of variance. The statistical differences among the means of treatments were analysed using Tukey’s post hoc HSD test at P < 0.05.
PGPR treatment effects on PO and PPO activities of wheat green aphid
Thirty aphids were collected for both 24 and 72 h after their release onto plants from different treatments mentioned in the previous experiment and were then frozen in liquid nitrogen. The samples for analysis were kept at −80°C. The aphids were placed in phosphate buffer (0.1 M, PH 7) and homogenised at 0°C. The homogenate was then centrifuged at 4°C, and the supernatant was used for further enzymatic activity analyses. The activity of PPO was measured using the method described by Miles (Reference Miles1964). The reaction mixture consisted of 0.2 M phosphate buffer (PH 7.4), the extract, and a 10 mM catechol solution. The mixture was incubated at 30°C for 30 min. The absorbance reading was compared with a control that contained only 0.2 M phosphate buffer (PH 7.4) without the extract. Measurements were taken using a TECAN Infinite 200 microplate reader at a wavelength of 460 nm. The activity of PO was determined using the method described by Fehrmann and Dimond (Reference Fehrmann and Dimond1969). The reaction mixture consisted of 0.1 M phosphate buffer (PH 7.0), the extract, distilled water, 0.2 M pyrogallol, and 3% H2O. The whole was incubated at 30°C for 25 min, and then a 25% trichloroacetic acid solution was added. Absorbance was measured at 430 nm against a blank that contained 0.1 M phosphate buffer (PH 7.0) instead of the extract. The protein content was determined using the Bradford (Reference Bradford1976) method, with a calibration curve established using a core albumin solution.
Result
Scanning electron microscopic observation
Scanning electron microscopy revealed that roots of wheat plants inoculated with A. chroococcum, A. oryzae, and P. brassicacearum were successfully colonised (fig. 1A–D).
SEM of root surface of wheat seedlings 7 days after being treated with PGPRs, including A. chroococcum (A), A. oryzae (B), P. brassicacearum (C), and control (D).

Figure 1 Long description
The image A shows a scanning electron microscopy view of the root surface of wheat seedlings treated with A. chrococcum, displaying successful colonization with numerous bacterial cells. The image B shows the root surface treated with A. oryzae, featuring visible bacterial colonization. The image C shows the root surface treated with P. brassicacearum, showing bacterial presence on the surface. The image D shows the control root surface without bacterial colonization, appearing smooth and uncolonized.
PGPR treatment effects on aphid preference
The number of aphids on plants treated with different PGPRs and a control group was assessed at 1, 3, 6, and 24 h post-experiment. At 1, 3, and 6 h after infestation, no significant differences in aphid counts were found among the PGPR treatments (table 1); however, the control group had a significantly higher number of aphids compared to the PGPR treatments during these time points (table 1). Nevertheless, at 24 h post-infestation, significant differences in aphid numbers were observed across all treatments (F 3, 24 = 27.05, P < 0.001), with plants treated with A. chroococcum showing the lowest aphid counts compared to the other treatments (table 1).
The number of aphids (mean ± SE) settled on wheat plants treated with different PGPRs under laboratory conditions (preference test) after 1, 3, 6, and 24 h (n = 7)

Table 1 Long description
The table measures the mean number of aphids on wheat plants treated with different plant growth-promoting rhizobacteria (PGPRs) over time. At 1 hour, the control group had the highest mean number of aphids, significantly more than any PGPR treatment. This trend continued at 3, 6, and 24 hours, with the control group consistently showing higher aphid numbers. Among the PGPR treatments, Pseudomonas brassicacearum had slightly more aphids than Azospirillum oryzae and Azotobacter chrococcum at all time points. The differences between PGPR treatments were not statistically significant, while the control group consistently differed significantly from all PGPR treatments. The data suggest that PGPR treatments reduce aphid settlement compared to untreated controls.
Note: Means within a column followed by different letters indicate that they were significantly different (P < 0.01).
PGPR treatment effects on aphid performance
Aphid developmental time of the immature stage and survival
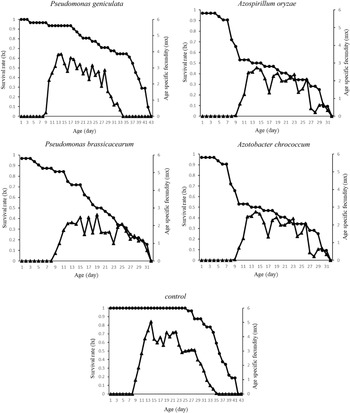
The developmental time of the immature stages of S. graminum was significantly influenced by different PGPR treatments (F 4, 155 = 8.64, P < 0.001, table 2). The nymphs of S. graminum had the longest developmental time of 9.71 ± 0.12 days when wheat plants were treated with A. oryzae, while the shortest time of 7.91 ± 0.45 days was found in the control group. Also, the nymphal survival rates (lx) were recorded as 0.95, 0.68, 0.82, 0.65, and 1 for the treatments P. geniculata, A. oryzae, P. brassicacearum, A. chroococcum, and the control, respectively (fig. 2).
Schizaphis graminum survival rate (lx) ( ) and age-specific fecundity (mx) (
 ) on wheat plants treated with different PGPR treatments (P < 0.01).

Figure 2 Long description
Five line graphs depict survival rate and age-specific fecundity of various bacterial species over time. Each graph has two y-axes: survival rate (percent) on the left and age-specific fecundity (number) on the right, with age (days) on the x-axis. The first graph, labeled 'Pseudomonas geniculata', shows survival rate starting at 100 percent and gradually decreasing, while fecundity fluctuates with peaks and troughs. The second graph, 'Azospirillum oryzae', displays a similar trend with survival rate decreasing steadily and fecundity showing fluctuations. The third graph, 'Pseudomonas brassicacearum', also shows a decline in survival rate and variable fecundity. The fourth graph, 'Azotobacter chroococcum', presents a decrease in survival rate and fluctuating fecundity. The fifth graph, labeled 'control', shows survival rate starting at 100 percent, decreasing over time and fecundity with peaks and troughs. Each graph illustrates the relationship between survival and fecundity for the respective bacterial species over a period of days.
Fecundity, adult longevity, immature duration time, and reproduction period (mean ± SE) of S. graminum under different PGPR treatments (n = 35)

Table 2 Long description
The table compares the effects of different PGPR treatments on fecundity, adult longevity, immature duration time, and reproductive period of S. Graminum. The control group exhibited the highest fecundity and adult longevity, with 75.5 eggs per female per day and 26.4 days, respectively. In contrast, Azotobacter chrococcum had the shortest adult longevity at 8.62 days and the lowest fecundity at 15.87 eggs per female per day. Pseudomonas geniculate and Azospirillum oryzae showed similar immature duration times, while Pseudomonas brassicacearum had significantly lower adult longevity and fecundity compared to the control. The data suggest that the control condition is more favorable for S. Graminum's reproductive success compared to the PGPR treatments.
Note: Means within a column followed by different letters indicate that they were significantly different (P < 0.01).
Aphid fecundity and longevity
The fecundity of S. graminum showed significant differences across all treatments (F 4, 155 = 51.55, P < 0.001, table 2). The lowest fecundity was recorded with the A. chroococcum treatment (15.87 ± 3.23), while the highest was observed in the control group (75.5 ± 3.21). The maximum daily fecundity (mx) reached 3.86 on P. geniculata (day 14), 3.5 on A. oryzae (day 13), 2.62 on P. brassicacearum (day 19), 2.75 on A. chroococcum (day 14), and 5.03 on the control (day 14) (fig. 2). The adult longevity of S. graminum was also significantly affected by PGPR treatments (F 4, 155 = 28.11, P < 0.001, table 2). The shortest adult longevity was observed with A. chroococcum (8.62 ± 1.61 days), while the longest was in the control group (26.4 ± 0.82 days).
Aphid life table parameters
The life table parameters of S. graminum were significantly influenced by different PGPR treatments (table 3). The net reproductive rate (R 0) showed notable differences across the treatments (F 5, 152 = 61451, P < 0.01), ranging from 15.37 ± 0.10 to 75.47 ± 0.10 females per generation, with the lowest and highest values for A. chroococcum and control treatments, respectively. The intrinsic rate of increase (rm) was also significantly affected by different PGPR treatments (F 5, 152 = 17338, P < 0.01), with the lowest rm value of 0.17 ± 0.0004 per day on A. chroococcum, and the highest of 0.27 ± 0.0002 per day on the control treatment. The finite rate of increase (λ) also varied significantly, with the lowest value of 1.18 ± 0.0005 per day on A. chroococcum and the highest of 1.31 ± 0.0002 per day on the control treatment (F 5, 152 = 18173, P < 0.0001). The mean generation time (T) for S. graminum differed significantly among the PGPR treatments (F 5, 152 = 3437, P < 0.0001), with the longest T value of 17.01 ± 0.008 days observed with A. oryzae and the shortest T value of 14.94 ± 0.01 days with P. brassicacearum. Similarly, the effect of PGPR treatments on doubling time (DT) was significant (F 5, 152 = 9606, P < 0.0001), with the highest DT value of 4.02 ± 0.01 days on A. chroococcum and the lowest of 2.54 ± 0.001 days on the control treatment.
Life table parameters (mean ± SE) of S. graminum under different PGPR treatments (n = 35)

Table 3 Long description
The table compares life table parameters of S. Graminum under different PGPR treatments, including reproductive rate, net reproduction, growth rate, generation time, and doubling time. The control group exhibited the highest reproductive and growth rates, with a reproductive rate of 0.272 and a growth rate of 1.31. In contrast, Azotobacter chrococcum had the lowest reproductive rate and growth rate, with values of 0.171 and 1.19, respectively, and the longest doubling time of 4.02 days. Pseudomonas geniculate showed a relatively high reproductive rate and growth rate, while Azospirillum oryzae had a longer generation time. The data suggest significant differences in life table parameters across treatments, indicating varied impacts on S. Graminum's population dynamics.
Note: Means within a column followed by different letters indicate that they were significantly different (P < 0.01).
Aphid body weight and MRGR
The body weight of the first nymphal aphids (F 4, 45 = 4.63, P < 0.01) and adults (F 4, 45 = 4.56, P < 0.01) was significantly affected by different PGPR treatments (table 4). Similarly, the various PGPR treatments had a notable impact on the MRGR of aphids (table 4, F 4, 45 = 29.88, P < 0.001). The lowest MRGR recorded was 0.183 ± 0.01 with the A. chroococcum treatment, while the highest was 0.24 ± 0.006 in the control treatment.
Mean relative growth rate (MRGR) and body weight (mean ± SE) of S. graminum on wheat in relation to PGPR treatments (n = 20)

Table 4 Long description
The table compares the mean relative growth rate and body weight of S. Graminum on wheat across different PGPR treatments. The control group exhibited the highest mean relative growth rate and body weight, with values of 0.24 and 1.02 micrograms, respectively. In contrast, Azotobacter chrococcum showed the lowest values, with a mean relative growth rate of 0.183 and a body weight of 0.62 micrograms. Pseudomonas geniculate and Pseudomonas brassicacearum had similar body weights, but Pseudomonas brassicacearum had a slightly higher growth rate. Azospirillum oryzae had moderate values in both categories. The data suggests significant differences in growth rates and body weights depending on the treatment, with the control group generally outperforming the PGPR treatments.
Note: Means within a column followed by different letters indicate that they were significantly different (P < 0.01).
Interactive effects between PGPR treatment and aphid infestation on protein, carbohydrate, total phenolic content, and oxidative enzymes in plants
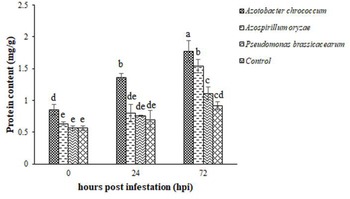
The findings indicated a notable interaction between PGPR treatments and the timing of infestation regarding protein content (F 6, 36= 2.77, P= 0.02). The highest protein content was recorded in plants treated with A. chroococcum at 72 hpi, while the lowest protein content was observed in all other treatments at 0 hpi, except for A. chroococcum (fig. 3).
Effects of PGPR treatments and timing post aphid infestation on protein content (mean ± SE) in wheat. Means with different letters were significantly different (Tukey’s HSD test; P < 0.05).

Figure 3 Long description
A bar graph showing protein content in milligrams per gram on the y-axis and hours post infestation in hours on the x-axis. The graph compares four treatments: Azotobacter chrococcum, Azospirillum oryzae, Pseudomonas brassicacearum and Control. At 0 hours post infestation, Azotobacter chrococcum has the highest protein content, followed by Azospirillum oryzae, Pseudomonas brassicacearum and Control. At 24 hours, Azospirillum oryzae shows the highest protein content, with Azotobacter chrococcum, Pseudomonas brassicacearum and Control following. At 72 hours, Azotobacter chrococcum again has the highest protein content, followed by Azospirillum oryzae, Pseudomonas brassicacearum and Control. Different letters above the bars indicate significant differences between the treatments at each time point.
Additionally, there was a significant interactive effect of PGPR treatments and infestation timing on carbohydrate content (F 6, 36= 2.13, P = 0.05). The highest carbohydrate content was observed in plants treated with PGPRs at 72 hpi, whereas the lowest carbohydrate content was found in the control plants at 0 hpi (fig. 4).
Effects of PGPR treatments and timing post aphid infestation on carbohydrate content (mean ± SE) in wheat. Means with different letters were significantly different (Tukey’s HSD test; P < 0.05).

Figure 4 Long description
A bar graph illustrating carbohydrate content in wheat measured in milligrams per gram at three different time points: 0, 24 and 72 hours post infestation. The x-axis is labeled 'hours post infestation (hpi)' and the y-axis is labeled 'Carbohydrate content (mg/g)'. Four treatments are compared: Azotobacter chroococcum, Bacillus aryabhattai, Pseudomonas brassicacearum and control. At 0 hours, the control has the lowest carbohydrate content, while Azotobacter chroococcum has the highest. At 24 hours, Bacillus aryabhattai shows the highest content and the control remains the lowest. At 72 hours, Azotobacter chroococcum and Bacillus aryabhattai have similar high values, with the control still being the lowest. Different letters above the bars indicate significant differences between treatments at each time point.
The total phenolic content in the plants was notably affected by the interaction between PGPR treatments and the timing of infestation (F 6, 36= 2.38, P ≤ 0.05). Throughout the time intervals studied, both PGPR-treated and control plants showed an increasing trend in total phenolic content. The highest content was recorded in plants treated with A. chroococcum at 72 hpi, while the lowest content was observed in all other treatments at 0 hpi, except for A. chroococcum (fig. 5).
Effects of PGPR treatments and timing post aphid infestation on total phenol content (mean ± SE) in wheat. Means with different letters were significantly different (Tukey’s HSD test; P < 0.05).

Figure 5 Long description
A bar graph illustrating total phenol content in wheat measured in milligrams per gram at 0, 24 and 72 hours post infestation. The x-axis is labeled 'hours post infestation (hpi)' and the y-axis is labeled 'total phenol content (mg/g)'. Four treatments are compared: Azotobacter chroococcum, Azospirillum oryzae, Pseudomonas fluorescens and Control. At 0 hours, all treatments show similar low phenol content, with values ranging from 0.1 to 0.2 mg/g. At 24 hours, Azotobacter chroococcum shows increased phenol content, reaching approximately 0.5 mg/g, while other treatments show lower values. At 72 hours, Azotobacter chroococcum reaches the highest phenol content, approximately 0.8 mg/g, followed by Azospirillum oryzae and Pseudomonas fluorescens with lower values. Different letters above the bars indicate significant differences between treatments at each time point.
The activities of three key enzymes PO, PPO, and CAT were analysed in wheat plants treated with PGPR and control plants infested with aphids at 0, 24, and 72 hpi. Both PGPR-treated and control plants showed an increasing trend in PO activity from 0 to 72 hpi. However, the activity was significantly higher in plants treated with A. chroococcum compared to the other treated and control plants (fig. 6). For example, in A. chroococcum-treated plants, notable PO activity was recorded even at 0 hpi, showing a 5-fold increase, followed by a 2.8-fold increase at 24 hpi, and a 2.2-fold increase at 72 hpi compared to the control plants.
Effects of PGPR treatments and timing post aphid infestation on PO (mean ± SE) in wheat. Means with different letters were significantly different (Tukey’s HSD test; P < 0.05).

Figure 6 Long description
A bar graph illustrating peroxidase activity in wheat plants at 0, 24 and 72 hours post infestation. The x-axis is labeled 'hours post infestation (hpi)' and the y-axis is labeled 'Peroxidase activity (Unit per mg FW)'. Four treatments are compared: Azotobacter chroococcum, Bacillus megaterium, Pseudomonas fluorescens and Control. At 0 hours, Azotobacter chroococcum shows the highest activity, followed by Bacillus megaterium, Pseudomonas fluorescens and Control. At 24 hours, Azotobacter chroococcum remains highest, with Bacillus megaterium and Pseudomonas fluorescens showing similar activity and Control being the lowest. At 72 hours, Azotobacter chroococcum shows a significant increase, followed by Bacillus megaterium, Pseudomonas fluorescens and Control. Different letters above bars indicate significant differences.
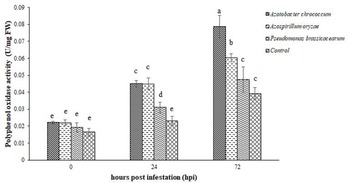
Data indicated that both PGPR-treated and control plants exhibited a significant increase in PPO activity after aphid infestation, with varying time intervals (F 6, 36 = 5.2, P < 0.01). The highest level of PPO activity was recorded in plants treated with A. chroococcum, showing approximately a 2.1-fold increase compared to the control at 72 hpi. Other treatments demonstrated a range of increases in PPO activity, from low (1.2-fold for P. brassicacearum) to moderate (1.6-fold for A. oryzae) compared to the control at the same time point (fig. 7).
Effects of PGPR treatments and timing post aphid infestation on PPO (mean ± SE) activity in wheat. Means with different letters were significantly different (Tukey’s HSD test; P < 0.05).

Figure 7 Long description
A bar graph illustrating Polyphenol oxidase activity in wheat measured in microgram per gram fresh weight at three time intervals: 0, 24 and 72 hours post infestation. The x-axis is labeled 'hours post infestation (hpi)' and the y-axis is labeled 'Polyphenol oxidase activity (microgram per gram FW)'. Four treatments are compared: Azotobacter chrococcum, Bacillus megaterium, Pseudomonas brassicacearum and Control. At 0 hours, all treatments show similar activity levels. At 24 hours, Azotobacter chrococcum shows the highest activity, followed by Bacillus megaterium, Pseudomonas brassicacearum and Control. At 72 hours, Azotobacter chrococcum exhibits the highest activity, significantly higher than other treatments, with Bacillus megaterium, Pseudomonas brassicacearum and Control showing lower activity levels. Different letters above bars indicate significant differences between treatments.
Plants treated with PGPR exhibited a notable increase in CAT activity compared to the control (F 6, 36 = 3.6, P < 0.01). The most significant rise in CAT activity, approximately 2.7-fold higher than the control, was recorded in plants treated with A. chroococcum at 72 hpi (fig. 8). In contrast, the smallest increase in CAT activity, only 1.2-fold higher than the control, was observed in plants treated with P. brassicacearum at 72 hpi.
Effects of PGPR treatments and timing post aphid infestation on CAT (mean ± SE) in wheat. Means with different letters were significantly different (Tukey’s HSD test; P < 0.05).

Figure 8 Long description
A bar graph illustrating Catalase activity in wheat measured in units per gram fresh weight at three time points: 0, 24 and 72 hours post infestation. The x-axis is labeled 'hours post infestation (hpi)' and the y-axis is labeled 'Catalase activity (units per gram fresh weight)'. Four treatments are compared: Acetobacter chrococcum, Azospirillum brasilense, Pseudomonas brassicacearum and Control. At 0 hours, the activity is lowest across all treatments, with the Control showing the least activity. At 24 hours, activity increases, with Acetobacter chrococcum showing the highest increase. At 72 hours, Acetobacter chrococcum exhibits the highest activity, marked by the letter 'a', indicating a significant difference from other treatments. Azospirillum brasilense and Pseudomonas brassicacearum show moderate activity, marked by 'b' and 'c', respectively, while the Control remains the lowest, marked by 'd'.
Effects of PGPR treatment on PO and PPO activities of wheat green aphid
The PGPR treatments significantly influenced PO activity in aphid tissues (F 3, 24 = 92.34, P < 0.01), as did the time treatments (F 3, 24 = 16.51, P < 0.01), but their interaction was not significant (F 3, 24 = 0.48, P = 0.69). The highest value of PO activity occurred in aphid tissues on the A. chroococcum treatment, whereas the lowest value was found in the control (fig. 9). Also, the peak PO activity was observed at 72 h (0.0013 ± 0.00003), while the lowest value was at 24 h (0.0011 ± 0.00003).
Effects of PGPR treatments on PO and PPO activities (mean ± SE) in aphid tissue. Means with different letters were significantly different (Tukey’s HSD test; P < 0.05).

Figure 9 Long description
A bar graph comparing enzyme activity of peroxidase and polyphenol oxidase. The x-axis lists treatments: Azotobacter chroococcum, Azospirillum oryzae, Pseudomonas brassicacearum and Control. The y-axis shows enzyme activity in micromoles per minute per milligram protein. Azotobacter chroococcum has the highest peroxidase activity, followed by Azospirillum oryzae, Pseudomonas brassicacearum and Control. Polyphenol oxidase activity is highest in Azospirillum oryzae, followed by Azotobacter chroococcum, Pseudomonas brassicacearum and Control. Different letters above bars indicate significant differences.
The PPO activity in aphid tissues showed significant variation based on PGPR treatments (F 3, 24 = 52.73, P < 0.01) and time treatments (F 3,24 = 37.48, P < 0.01). However, there was no significant interaction between PGPR treatments and time intervals regarding PPO activity (F 3,24 = 1.03, P = 0.39). The highest and lowest values of PPO activity in aphid tissues were observed in A. chroococcum and control treatments, respectively (fig. 9). The highest PPO activity was recorded at 72 h (0.0064 ± 0.0001), while the lowest was at 24 h (0.0041 ± 0.0001).
Discussion
Wheat suffers yield losses due to herbivorous insects, particularly S. graminum, throughout all growth stages, with increased prevalence in late winter and early spring (Nuessly et al., Reference Nuessly, Nagata, Burd, Hentz, Carroll and Halbert2008). Although the population of S. graminum is primarily controlled with insecticides (Hays et al., Reference Hays, Porter, Webster and Carver1999), concerns about the environmental impacts of these chemicals have led to the exploration of alternative control methods. One such method involves enhancing wheat resistance through PGPR application, which has proven to be an effective strategy for aphid management (Mardani-Talaee et al., Reference Mardani-Talaee, Razmjou, Nouri-Ganbalani, Hassanpour and Naseri2017; Veselova et al., Reference Veselova, Burkhanova, Rumyantsev, Blagova and Maksimov2019). Our study’s findings indicate that the application of PGPRs alters some secondary metabolites related to plant resistance (phenolic compound) and the nutritional content (protein and carbohydrate) in wheat, potentially leading to antixenosis and antibiosis effects on S. graminum.
The preference assay results demonstrated that wheat treated with PGPRs was less attractive to aphids compared to the control wheat, with A. chroococcum treatment being the least preferred. This observation supports the idea that PGPR-treated wheat induces antixenosis resistance against S. graminum. Likewise, research by Serteyn et al. (Reference Serteyn, Quaghebeur, Ongena, Cabrera, Barrera, Molina-Montenegro, Francis and Ramirez2020) showed that pea aphid, Acyrthosiphon pisum, exhibited significantly reduced probing behaviour on bean plants treated with Bacillus amyloliquefaciens compared to those on untreated plants. Moreover, the oviposition preference study of H. zea found that female moths preferred control maize plants over those treated with PGPRs (Simmons-Elliott et al., Reference Simmons-Elliott, Tolosa and Zebelo2023). The current study’s finding on aphid non-preference for PGPR-treated wheat, along with similar results from other studies, is probably related to the production of toxic chemicals (deterrents) and the release of volatile organic compounds (repellents), which together may deter herbivorous insects.
Wheat plants treated with PGPRs exhibited negative impacts on the biological characteristics of S. graminum, suggesting a resistance mechanism based on antibiosis. The various PGPR traits had a significant effect on the developmental time of the immature stages of S. graminum, similar to findings for Aphis gossypii Glover (Hem: Aphididae) on cotton (Fahimi et al., Reference Fahimi, Ashouri, Ahmadzadeh, Hoseini-Naveh, Asgharzadeh and Maleki2014). Among the treatments, the immature stages of S. graminum on plants treated with A. oryzae had the longest developmental time. The fecundity and reproduction period of S. graminum on plants treated with different PGPRs were also significantly lower compared to those on control plants. Specifically, the aphids fed on the plants treated with A. chroococcum exhibited the lowest reproductive rate and the shortest reproduction duration compared to other treatments. This finding aligns with previous studies that have documented a significant negative impact of PGPR on the fecundity and reproduction periods of various pests, including grape phylloxera, Daktulosphaira vitifoliae (Fitch) (Hem: Phylloxeridae) on grapevine (Adam et al., Reference Adam, Makee and Idris2012) and B. brassicae on canola (Sattari Nasab et al., Reference Sattari Nasab, Pahlavan Yali and Bozorg-Amirkalaee2019). The decrease in the fecundity and reproduction period of S. graminum suggests that wheat plants treated with PGPRs are less suitable for this aphid, likely due to alterations in the secondary metabolite profile and a decline in food quality. Similarly, Saravanakumar et al. (Reference Saravanakumar, Lavanya, Muthumeena, Raguchander, Suresh and Samiyappan2008) found that applying a mix of three Pseudomonas fluorescence (Flugge) strains to rice plants reduced the fecundity of the leaffolder Cnaphalocrocis medinalis (Guenee) (Lep: Crambidae) by producing PPO and lipoxygenase. Additionally, the longevity of adult females of S. graminum exposed to PGPR traits was significantly shorter than those on control, aligning with the results of Sattari Nasab et al. (Reference Sattari Nasab, Pahlavan Yali and Bozorg-Amirkalaee2019), who noted that the longevity of adult B. brassicae on canola plants treated with PGPR was significantly lower compared to the control.
The life table parameters of S. graminum were influenced by various PGPR treatments. The lowest values of rm, R 0, and λ in aphids were found on plants treated with A. chroococcum, while the control plants exhibited the highest values for these parameters. Similar findings have been reported regarding the significant negative effects of PGPRs on the life table parameters of pests like A. gossypii on cucumber (Fahimi et al., Reference Fahimi, Ashouri, Ahmadzadeh, Hoseini-Naveh, Asgharzadeh and Maleki2014), M. persicae on bell pepper (Mardani-Talaee et al., Reference Mardani-Talaee, Razmjou, Nouri-Ganbalani, Hassanpour and Naseri2017), T. absoluta on tomato (Mohamadi et al., Reference Mohamadi, Razmjou, Naseri and Hassanpour2017), and B. brassicae on canola (Sattari Nasab et al., Reference Sattari Nasab, Pahlavan Yali and Bozorg-Amirkalaee2019). In this study, S. graminum exhibited significantly longer mean generation time (T) and doubling time (DT) when feeding on plants treated with A. oryzae and A. chroococcum, respectively. These results align with those of Fahimi et al. (Reference Fahimi, Ashouri, Ahmadzadeh, Hoseini-Naveh, Asgharzadeh and Maleki2014), where the P. fluorescens strain PF169 significantly increased T and DT for A. gossypii on the cucumber plant. The low r m values for S. graminum on wheat treated with A. chroococcum were likely stemmed from a combination of poor fecundity and shorter reproduction period. Furthermore, our results indicated that PGPR treatments had a significant effect on the MRGR of S. graminum, with the highest value observed in control plants and the lowest in those treated with A. chroococcum.
The interaction between plants and PGPRs results in alterations to primary metabolites, including proteins and carbohydrates that are essential for energy production, as well as precursors needed for the biosynthesis of secondary metabolites (Bi and Felton, Reference Bi and Felton1995). This, in turn, enhances the plant’s defence mechanisms (known as priming) against future biotic stress (Pineda et al., Reference Pineda, Zheng, van Loon, Pieterse and Dicke2010). The findings of this study indicate a significant enhancement in the protein and carbohydrate content of wheat plants inoculated with PGPRs, with the most pronounced increases observed in plants treated with A. chroococcum at 72 hpi. These results align with the research conducted by Al-Erwy et al. (Reference Al-Erwy, Al-Toukhy and Bafeel2016), which reported significant elevations in total carbohydrate and mineral content in wheat plants inoculated with PGPRs, specifically Azotobacter and Rhizobium species. PGPRs are known to facilitate the uptake of nitrogen by roots, thereby optimising the carbon/nitrogen ratio through the upregulation of compounds associated with nitrogen metabolism, including proteins and nitrogen-based defence mechanisms (Bhat et al., Reference Bhat, Mishra, Jan, Bhat, Kamal, Rahman, Shah and Jan2023). In addition, PGPRs may improve photosynthetic efficiency and regulate carbohydrate metabolism by increasing nutrient absorption, elevating plant hormone levels, and influencing their associated signalling pathways (Su et al., Reference Su, Zhao, Dhondt-Cordelier and Vaillant-Gaveau2024).
Carbohydrates play a crucial role in providing the energy required for defensive mechanisms and act as signalling molecules that regulate the expression of genes involved in the production of carbon-based defence compounds (Roitsch et al., Reference Roitsch, Balibrea, Hofmann, Proels and Sinha2003; Bolton, Reference Bolton2009). We hypothesised that when plants are exposed to insect herbivores, they benefit from a microbial community that enhances nutrient utilisation and promotes the translocation of these nutrients from the rhizosphere to the aboveground parts of the plant, thereby mitigating the stress induced by herbivory (Pineda et al., Reference Pineda, Zheng, van Loon, Pieterse and Dicke2010).
Wheat plants subjected to treatment with PGPRs showed an increase in total phenolic content over time. The highest total phenolic content was recorded in plants treated with A. chroococcum at 72 hpi. Phenolic compounds are biologically active secondary metabolites that play a crucial role in the synthesis of physical defence structures and/or the formation of defensive chemical compounds (Singh et al., Reference Singh, Kaur and Kariyat2021). These compounds can exert direct toxicity towards herbivores or mediate various signalling pathways that lead to the production of diverse toxic metabolites (Wójcicka, Reference Wójcicka2010; Helmi and Mohamed, Reference Helmi and Mohamed2016). So, phenolic compounds generally exhibit anti-feeding and deterrent effects against a wide range of herbivore insects. For instance, dihydrochalcones and polar phenolic compounds found in wheat have a significant deterrent effect against S. graminum (Dreyer and Jones, Reference Dreyer and Jones1981). Furthermore, phenolic acids from European filbert and chlorogenic acid from yellow maize have been shown to act as antifeedants against Myzocallis coryli (Goeze 1778) (Hemiptera: Aphididae) and Ostrinia nubilalis (Hubner 1796) (Lepidoptera: Crambidae), respectively, thereby exemplifying nature’s inherent pest control mechanisms (Mao et al., Reference Mao, Burt, Ramputh, Simmonds, Cass, Hubbard, Miller, Altosaar and Arnason2007; Gantner et al., Reference Gantner, Najda and Piesik2019).
The results of our study, in conjunction with previous research, highlight the injurious effects of elevated phenolic compounds in plants treated with PGPR on the fitness of herbivores. Mardani-Talaee et al. (Reference Mardani-Talaee, Razmjou, Nouri-Ganbalani, Hassanpour and Naseri2017) demonstrated that phenolic compounds in PGPR-treated bell pepper leaves significantly reduced both the fecundity and growth rate of the M. persicae population. Likewise, Sattari Nasab et al. (Reference Sattari Nasab, Pahlavan Yali and Bozorg-Amirkalaee2018) reported that PGPR colonisation in canola plants enhances systemic resistance against B. brassicae, which was attributed to an increase in phenolic compounds. Phenolics exert adverse effects on insect herbivores by inducing oxidative disturbances in their midguts through complex mechanisms (Urbańska et al., Reference Urbańska, Leszczynski, Lukasik and Matok1998; Chrzanowski et al., Reference Chrzanowski, Leszczyński, Czerniewicz, Sytykiewicz, Matok, Krzyzanowski and Sempruch2012).
In the present study, the application of PGPR resulted in increased activities of PO, PPO, and CAT enzymes in wheat plants across all time intervals when compared to control plants. Specifically, the highest enzyme activities were recorded in plants treated with A. chroococcum at 72 hpi. These results are in line with previous studies indicating that elevated levels of PPO and PO in B. subtilis-treated tomato plants led to a reduction in the MRGR and intrinsic rate of natural increase (rm) of A. gossypii (Sudhakar et al., Reference Sudhakar, Thajuddin and Murugesan2011). Additionally, strains of Bacillus spp., including B. subtilis and B. thuringiensis, have been shown to suppress the viability of S. graminum through the activation of PO, CAT, and defence-related genes in wheat (Veselova et al., Reference Veselova, Burkhanova, Rumyantsev, Blagova and Maksimov2019). PO, PPO, and CAT are critical enzymes involved in the detoxification of reactive oxygen species (ROS) and play significant roles in plant-induced defence responses, which negatively affect herbivorous insect growth and development (Han et al., Reference Han, Wang, Bi, Yang, Huang, Zhao, Hu and Cai2009; Singh et al., Reference Singh, Kaur and Kariyat2021).
The results of this study indicate that the application of PGPRs positively influenced the levels of oxidative enzymes in aphids. Notably, a significant increase in the activities of PO and PPO was observed in S. graminum after 24 and 72 h of exposure. This finding aligns with the results reported by Pourya et al. (Reference Pourya, Shakarami, Mardani-Talaee, Sadeghi and Serrão2021), which demonstrated that antioxidant enzymes, including CAT and PO, exhibited the highest activity in S. avanae (Fabricius) when reared on wheat plants treated with Biofarm (comprising Azotobacter, Azospirillum, and Pseudomonas). The elevated oxidative enzyme activities in the tissues of aphids feeding on PGPR-treated plants suggest that these PGPRs may induce the production of allelochemical compounds that stimulate the antioxidant system of aphids, which are responsible for metabolizing allelochemical compounds (Bi and Felton, Reference Bi and Felton1995).
PO and PPO are crucial in neutralising quinones derived from plants, facilitating the formation of melanin pigments that facilitate the absorption of food by aphids (Dampc et al., Reference Dampc, Kula-Maximenko, Molon and Durak2020). According to our results, the increased enzymatic activity observed in S. graminum may be associated with the neutralisation of secondary phenolic metabolites induced by PGPRs in the wheat plants. We hypothesise that the decreased performance of S. graminum on wheat inoculated with PGPRs is a consequence of raised metabolic activity due to elimination of toxic compounds (Veselova et al., Reference Veselova, Burkhanova, Rumyantsev, Blagova and Maksimov2019).
In conclusion, the findings from this study indicate that wheat plants treated with PGPR exhibited negative effects on the life history parameters of S. graminum. It was also determined that A. chroococcum emerged as the most effective treatment among the PGPRs for the management of S. graminum. The current study showed that A. chroococcum enhances plant fitness through the biosynthesis of higher levels of secondary metabolites, which may alter the nutrient quality of wheat plants, consequently negatively impacting the performance of S. graminum, including poor fecundity and shorter reproduction period. The integration of PGPRs with other pest management tactics could facilitate the development of effective control programmes, potentially reducing the reliance on insecticides for aphid management. However, it is important to note that the laboratory and greenhouse conditions under which this study was conducted may not fully represent the complexities of natural environments. Therefore, to obtain more precise results, it is necessary to conduct further research under field conditions.
Acknowledgements
The authors gratefully acknowledge Biorun Company for the facilities essential to completion of this work.
Financial support.
This work was supported by the Ferdowsi University of Mashhad under grant number 3/48129.
Competing interests
The authors report no conflict of interest