

Introduction
Felon disenfranchisement policies revoke the voting rights of individuals convicted of committing certain serious or notorious crimes, such as murder, arson, or bribery (National Conference of State Legislatures 2024). While ostensibly race-neutral, felon disenfranchisement bars Black Americans from voting at greater rates than White Americans (Uggen et al. Reference Uggen, Larson, Shannon and Stewart2024). This has led some to argue that felon disenfranchisement is used to deter rising Black political power (Kelly Reference Kelly2017). For example, following the 1965 Voting Rights Act (VRA), which enshrined greater protections for voters of color, states that began coverage under Section 5 of the VRA started incarcerating (and thus, disenfranchising)Footnote 1 Black Americans to a greater extent, likely in an attempt to curtail the “fundamental threat to the encompassing White-dominated political order (Eubank and Fresh Reference Eubank and Fresh2022, 793–94)” that Black enfranchisement was seen as.
This prior work suggests part of the motivation for felon disenfranchisement is politically strategic—defined here as using election policy to limit the political influence of out-groups—and is based on the (perceived) threat of rising Black political power. More specifically, perceptions of large or undue Black political influence foster political racial threat, or feelings that White political power is under threat (Blalock Reference Blalock1967). This threat motivates White Americans to support policies they believe may mitigate that threat, which is where felon disenfranchisement comes in. Due to the racialization of crime, wherein Black individuals are perceived to be more violent or criminal (Chiricos et al. Reference Chiricos, Padgett, Bratton, Pickett and Gertz2012; Peffley, Hurwitz, and Sniderman Reference Peffley, Hurwitz and Sniderman1997; Quillian and Pager Reference Quillian and Pager2001) and are also more likely to be convicted of felonies and subsequently disenfranchised (Uggen et al. Reference Uggen, Larson, Shannon and Stewart2024), felon disenfranchisement provides an avenue through which Black political influence could be curtailed, and to a greater extent than White political influence. Further, because Black Americans are more likely to identify as Democrats and hold more liberal policy positions (Griffin and Newman Reference Griffin and Newman2008; Kinder and Sanders Reference Kinder and Sanders1996), White Republicans and conservatives likely feel more threatened by Black political power, leading perceived political threat to increase felon disenfranchisement support to a greater extent among White Americans on the political right.
Despite the clear implications of political racial threat for White support of felon disenfranchisement, we have little evidence that political racial threat fosters support for felon disenfranchisement among White Americans. To date, most research into racial threat effects uses either indirect material/non-attitude measures of Black political power (e.g., the percent of the locale that is Black) or focus on distinct racial attitudes like symbolic threat (e.g., perceptions of Black crime rates), general affect (e.g., feeling thermometers), or racial resentment (Behrens, Uggen, and Manza Reference Behrens, Uggen and Manza2003; Chiricos et al. Reference Chiricos, Padgett, Bratton, Pickett and Gertz2012; Coll, Torres, and Tolbert Reference Coll, Torres and Tolbert2025; Eubank and Fresh Reference Eubank and Fresh2022; Giles and Buckner Reference Giles and Buckner1993; Key Reference Key1949; Newman Reference Newman2013). However, doing so requires making several additional assumptions about the relationship between material measures of threat, perceptions of threat, and subsequent policy support, while also not distinguishing political racial threat from other racial attitudes, as discussed elsewhere (Blalock Reference Blalock1967; Chiricos et al. Reference Chiricos, Padgett, Bratton, Pickett and Gertz2012; Chiricos, Hogan, and Gertz Reference Chiricos, Hogan and Gertz1997; Eitle, D’Alessio, and Stolzenberg Reference Eitle, D’Alessio and Stolzenberg2002; Newman Reference Newman2013; Pickett et al. Reference Pickett, Chiricos, Golden and Gertz2012) and below.
Expanding on previous work, we examine how perceptions of political racial threat influence support for felon disenfranchisement among White Americans. Doing so alleviates the need to make additional assumptions linking material measures of threat to perceptions of threat and subsequent policy support while also allowing this study to isolate political threat from other racial attitudes or contextual factors. Using data from the 2020 and 2024 ANES, we find that White Americans who feel more politically threatened are significantly more supportive of felon disenfranchisement, effects that are more pronounced for White conservatives and Republicans. Further, these results hold after controlling for economic and symbolic threat, general Black affect, crime spending preferences, and Black population size, demonstrating the independent influence of perceptions of political racial threat on support for felon disenfranchisement. These results suggest political racial threat influences support for felon disenfranchisement among White Americans, particularly those on the political right.
This study adds to a growing literature examining how racial attitudes influence public support for voter qualifications like felon disenfranchisement. While previous studies have argued general racial animus, racial resentment, and symbolic racial threat influence support for restricting the franchise (Chouhy, Lehmann, and Singer Reference Chouhy, Lehmann and Singer2022; Coll Reference Coll2024; Coll, Torres, and Tolbert Reference Coll, Torres and Tolbert2025; Wilson, Owens, and Davis Reference Wilson, Owens and Davis2015) this study suggests a strategic political motivation to felon disenfranchisement support: White Americans may support felon disenfranchisement partially out of a belief it will limit the rise of Black political power, particularly White Americans on the political right. Juxtaposed against the purported reason for felon disenfranchisement—to ‘protect the purity of the ballot box’—these results suggest felon disenfranchisement support is highly racialized, potentially for the purpose of politically disenfranchising politically opposed racial groups. And, when combined with previous evidence of racial and political considerations factoring into support for (non-White/non-citizen) voting rights (Alarian and Zonszein Reference Alarian and Zonszein2025; Whitaker and Giersch Reference Whitaker and Giersch2021), these results further demonstrate the pervasiveness of political racial threat in modern voting rights opinions.
Felon Disenfranchisement
Felon disenfranchisement refers to a suite of policies that revoke the right to vote for individuals convicted of committing certain serious or notorious crimes, such as murder, arson, or bribery (National Conference of State Legislatures 2024). As shown in Figure 1, 48 states currently have some form of felon disenfranchisement policies, though considerable variation exists even within categories of disenfranchisement policies (National Conference of State Legislatures 2024). 23 states only disenfranchise citizens while individuals are incarcerated for certain felonies. 15 states disenfranchise citizens not only during incarceration, but also until the individual has completed their sentence, potentially including probation, parole, and/or paid all fines and restitutions. 10 states disenfranchise throughout incarceration, probation/parole, and even post-sentence completion, including disenfranchising voters permanently or until re-enfranchised via government approval (e.g., governor, judge, or board). Only two states and D.C. do not disenfranchise felons (D.C. not pictured).
Distribution of felon disenfranchisement policies in the United States.
Source: National Conference of State Legislatures (2024). Graph by authors.

Though ostensibly race neutral, felon disenfranchisement legally bars Black Americans from voting at higher rates than White Americans. The Sentencing Project—a non-profit, non-partisan research and advocacy organization that focuses on criminal justice reform—estimates Black disenfranchisement rates at roughly 4.5% of the Black American adult population, or a total of 1.3 million, around the time of the 2024 election (Uggen et al. Reference Uggen, Larson, Shannon and Stewart2024). The size of the total disenfranchised Black population is larger than the population of 11 individual states. Black Americans are disenfranchised at more than three times the rate of non-Black Americans. State variation of Black disenfranchisement rates range from as low as less than 1% in states like Connecticut, Hawaii, Maryland, and Massachusetts, to around 7-9% in Alabama, Arkansas, Iowa, Virginia, Wisconsin, and Wyoming, 10–13% in Arizona, Florida, Kentucky, South Dakota, to roughly 1 in 6 Black Americans being disenfranchised in Tennessee. Many of the states with the largest disenfranchised populations also have more stringent disenfranchisement policies. Lastly, “[w]hereas 9 states disenfranchised at least 5 percent of their African American adult citizens in 1980, 15 states do so today (Uggen et al. Reference Uggen, Larson, Shannon and Stewart2024, 10),” reflecting the growing disenfranchisement of Black Americans.
With the widespread use of these policies and significant disenfranchisement of Black Americans, several studies have sought to examine why individuals—particularly White Americans—support disenfranchising felons. Some argue that a general predisposition towards punitive attitudes increases support for felon disenfranchisement (Chouhy, Lehmann, and Singer Reference Chouhy, Lehmann and Singer2022). Additionally, numerous previous studies find support for felon disenfranchisement is linked to race, racial contexts, and racial attitudes (Behrens, Uggen, and Manza Reference Behrens, Uggen and Manza2003; Chiricos et al. Reference Chiricos, Padgett, Bratton, Pickett and Gertz2012; Chiricos, Welch, and Gertz Reference Chiricos, Welch and Gertz2004; Coll Reference Coll2024; Coll, Torres, and Tolbert Reference Coll, Torres and Tolbert2025; Wilson, Owens, and Davis Reference Wilson, Owens and Davis2015). White Americans tend to be more supportive of felon disenfranchisement, and this support is amplified by context and attitudes: felon disenfranchisement support is higher among White Americans residing in areas that (they think) have more or more (assumedly) violent Black Americans, and among White Americans who hold a greater dislike or resentment towards Black Americans or think they are more violent.
Taken together, prior work argues that support for felon disenfranchisement stems from crime concerns and affect-based racial attitudes. While we agree that these factors likely influence felon disenfranchisement support, we argue that there are likely also political motivations undergirding support for disenfranchising convicted felons. Specifically, applying the racial threat framework to support for felon disenfranchisement policies, this study argues that political racial threat in the form of perceiving Black individuals as having too much political influence motivates White Americans to strategically support felon disenfranchisement as a means to alleviate the threat of Black political influence.
Political Racial Threat and Support for Felon Disenfranchisement
The racial threat framework posits perceived economic, symbolic, or political threats from racial out-groups foster strategic support for candidates and policies thought to alleviate that threat (Blalock Reference Blalock1967). That is, individuals may strategically support certain candidates or policies for the purposes of obtaining some goal (e.g., Kane Reference Kane2017). Within the racial threat framework, that goal is the alleviation of some perceived (economic, symbolic, or political) racial threat. For example, those who feel economically threatened by racial outgroups are more supportive of limiting immigration (Mangum Reference Mangum2019), as doing so may alleviate the economic threat of immigrants “stealing” jobs. Symbolic racial threats to safety and values motivate supporting harsher criminal justice policies (Chiricos, Welch, and Gertz Reference Chiricos, Welch and Gertz2004), as harsher criminal justice policies are perceived to alleviate the symbolic threat of “violent” and “morally deviant” non-White individuals threatening White safety and values. Threats to political power foster support for racially conservative candidates (Giles and Buckner Reference Giles and Buckner1993), as racially conservative candidates are thought to enact social policies to protect White political dominance.
In these examples, individuals strategically support candidates or policies they believe will alleviate some perceived racial threat. Applying the racial threat framework to support for felon disenfranchisement policies, we argue that the Black-White divide in American politics (Griffin and Newman Reference Griffin and Newman2008; Kinder and Sanders Reference Kinder and Sanders1996) creates conditions that foster political racial threat, which motivates White Americans to seek out policies to alleviate that threat (Blalock Reference Blalock1967). Because felon disenfranchisement not only revokes the right to vote (i.e., political power), but revokes Black voting rights at much higher rates (Uggen et al. Reference Uggen, Larson, Shannon and Stewart2024) and is likely perceived to affect Black Americans more given stereotypes of the violent Black criminal (Peffley, Hurwitz, and Sniderman Reference Peffley, Hurwitz and Sniderman1997), felon disenfranchisement represents one such policy to limit the perceived threat of Black political power.
First, the Black-White divide in American politics creates conditions under which political racial threat can manifest. On average, Black Americans are more likely than White Americans to identify as Democrats, vote for the Democratic Party, identify as liberal, and support more liberal policies (Griffin and Newman Reference Griffin and Newman2008; Kinder and Sanders Reference Kinder and Sanders1996).Footnote 2 These differences, when coupled with perceptions of outsized Black political influence, foster political racial threat as White Americans not only perceive Black Americans as having different political leanings than White Americans, but also politically powerful enough to put into place their distinct policy preferences. This is particularly important as recent evidence suggests White Americans may view politics as a zero-sum game (Jardina Reference Jardina2019; Norton and Sommers Reference Norton and Sommers2011).
Second, when faced with racial threat, White Americans may seek to lessen that threat (Blalock Reference Blalock1967; Newman Reference Newman2013; Pickett et al. Reference Pickett, Chiricos, Golden and Gertz2012). For political racial threat, the solution is to limit the political influence of the racial out-group. One direct way to limit political influence is to simply limit who is legally allowed to vote (Keyssar Reference Keyssar2009), such as through more stringent voter qualifications. Voter qualifications refer to the requirements individuals must meet to be eligible voters, limiting the franchise to only those deemed to be qualified electors. By defining who is allowed to participate, these policies, by definition, structure political influence. For example, Springer (Reference Springer2014) shows how voter qualifications like property requirements, literacy tests, and poll taxes deterred voter turnout during the 20th century. By removing the right to vote, even temporarily, felon disenfranchisement represents a voter qualification that can be used to limit political influence. Unlike property requirements, literacy tests, and poll taxes, forms of felon disenfranchisement are still used today and by nearly every state in the nation.
Third, felon disenfranchisement represents an ideal policy to limit Black political influence. Felon disenfranchisement does not just limit the political influence of felons, but it systemically limits Black political influence to a much greater extent and is likely perceived to affect Black Americans more. As discussed above, felon disenfranchisement legally bars Black Americans from voting at higher rates relative to their population size than White Americans (Uggen et al. Reference Uggen, Larson, Shannon and Stewart2024). Further, the racialization of crime may foster the perception that Black Americans are more likely to commit crimes, and thus, more likely to be convicted of felonies and disenfranchised. Race and violence have become synonymous such that “the stereotype of Blacks as criminals is widely known and is deeply embedded in the collective consciousness of Americans (Quillian and Pager Reference Quillian and Pager2001, 722).” That is, many Americans think Black Americans are (more) likely to be violent and commit criminal acts (Chiricos, Welch, and Gertz Reference Chiricos, Welch and Gertz2004; Peffley, Hurwitz, and Sniderman Reference Peffley, Hurwitz and Sniderman1997), including crimes punishable by disenfranchisement like armed robbery, breaking and entering, and the like (Chiricos et al. Reference Chiricos, Padgett, Bratton, Pickett and Gertz2012). This perception of the Black criminal may foster a belief that Black Americans are more likely to commit crimes and be disenfranchised, a belief supported by racial patterns of felon disenfranchisement (Uggen et al. Reference Uggen, Larson, Shannon and Stewart2024).
Given the potential for the Black-White divide in American politics to foster perceptions of Black political racial threat among White Americans and the ability of felon disenfranchisement to unduly curtail Black political influence, this study argues that perceptions of political racial threat will increase support for felon disenfranchisement among White Americans. Formally,
H1: Perceptions of political racial threat will increase support for felon disenfranchisement among White Americans.
Further, if the relationship between perceptions of Black influence and felon disenfranchisement support is due to perceptions of political racial threat, above and beyond racial threat more generally, then perceptions of outsized Black influence should have a larger effect on those who are more threatened by Black political power. Given the distribution of partisanship and policy preferences by race, wherein Black Americans tend to affiliate with the Democratic Party and are more likely to hold liberal policy preferences, this threat should be greatest among White Republicans and conservatives who are more likely to hold differing candidate and policy preferences than the more Democratic/liberal-leaning Black American community (Hawley Reference Hawley2011).
As discussed above, the theoretical basis for supporting felon disenfranchisement conditional on perceived undue Black influence is political threat; that Black Americans have different political preferences than White Americans such that large Black power fosters support for a policy perceived to limit that power. Given that Black Americans, on average, are more likely to identify with and support Democratic/liberal policies and candidates (Griffin and Newman Reference Griffin and Newman2008; Kinder and Sanders Reference Kinder and Sanders1996), the threat of rising Black influence is likely more threatening to White Republicans and conservatives who hold different partisan and ideological leanings than the more Democratic and liberal leaning Black populace.
At the same time, some White Democrats or liberals may also think Black Americans have too much political power (e.g., relative to their size in the population). However, left-leaning White Americans may not see the same strategic calculation to support felon disenfranchisement, as doing so would result in increased disenfranchisement of their partisan and ideological compatriots. That is, left-leaning White Americans may still think Black Americans have too much political power but feel less threatened by that power since that power is more politically aligned with their own preferences.
However, if considerations were merely affective, for example, and not political, then we should expect White Republicans and Democrats who believe Black Americans have too much political power to have higher levels of support for felon disenfranchisement. If, on the other hand, considerations are politically strategic, we would not expect White Democrats who feel Black Americans have too much political power to support felon disenfranchisement at the same rate as similarly politically threatened White Republicans. These differing degrees of threat caused by similar perceptions of Black political power may lead White Republicans/conservatives to feel more threatened by Black political power, and thus, more likely to support election policies that have the potential to curtail that threat than White Democrats/liberals.
H2: Perceptions of political racial threat will increase support for felon disenfranchisement more among White Republicans than White Democrats.
H3: Perceptions of political racial threat will increase support for felon disenfranchisement more among White conservatives than White liberals.
While the above suggests political racial threat is tied to felon disenfranchisement support, it is not entirely certain that this will be the case. For example, previous work suggests other attitudes, such as perceptions of crime or subscribing to conservative or punitive ideologies (e.g., Chouhy, Lehmann, and Singer Reference Chouhy, Lehmann and Singer2022), tend to dominate felon disenfranchisement support considerations. Additionally, many Americans (ostensibly) subscribe to an ethos that emphasizes democracy and equality (Poloni-Staudinger and Wolf Reference Poloni-Staudinger and Wolf2019). Last, some previous work suggests that telling individuals an election policy will politically disadvantage a racial outgroup may reduce support for that policy (Wilson and Brewer Reference Wilson and Paul2016). However, the expectations outlined above are in line with several previous studies suggesting that the decisions to enfranchise certain groups, as well as whether or not to support certain election policies, are, in part, political.
Numerous studies suggest the enfranchisement of women was, in part, done for political reasons (Keyssar Reference Keyssar2009; Teele Reference Teele2018). For example, Teele (Reference Teele2018) finds legislative support for women’s enfranchisement is partially tied to the potential to mobilize women voters and the degree of competition in one’s state. Specifically, states with more women’s suffrage movement affiliates and high competition were more likely to enfranchise women. The author attributes this to politicians strategically using enfranchisement to enhance their political fortunes.
Studies come to similar conclusions examining the decisions to extend voting rights to immigrants, non-citizens, and citizens of color (Keyssar Reference Keyssar2009). Alarian and Zonszein (Reference Alarian and Zonszein2025) use survey experiments to demonstrate that Americans are more (less) supportive of non-citizen voting when non-citizens are described as voting for (against) their political party. Whitaker and Giersch (Reference Whitaker and Giersch2021) uncover similar findings regarding Puerto RicanFootnote 3 voting rights. They find Republicans are less supportive of Puerto Rican voting rights, particularly after learning Puerto Ricans may be more likely to support Democratic candidates.
Last, there is an abundance of evidence suggesting support for election policies is conditional on whether one believes those policies help their in-group or hinder their out-group, with individuals more supportive of those policies that provide an in-group advantage or an out-group disadvantage (Biggers Reference Biggers2019; Biggers and Bowler Reference Biggers and Bowler2022; Kane Reference Kane2017; McCarthy Reference McCarthy2019). Using a two-wave study, Biggers and Bowler (Reference Biggers and Bowler2022) find partisans are more supportive of election policies they think will politically favor their party, including policies the respondents previously identified as being unfair.
We add to this literature by examining the link between political racial threat and felon disenfranchisement, demonstrating whether politically racial considerations factor into support for (felon) voting rights. Like these previous works, we argue that political calculations in the form of perceptions of Black political threat influence support for felon disenfranchisement, particularly among those on the political right.
On the Use of Perceptions of Threat Over Material Measures
As theorized above and operationalized below, we expect perceptions of political racial threat to influence support for felon disenfranchisement and measure these perceptions via respondents’ perceived levels of Black and White political influence. Though numerous studies have used material measures (e.g., minority population size or changes) to examine racial threat hypotheses (Behrens, Uggen, and Manza Reference Behrens, Uggen and Manza2003; Newman Reference Newman2013), using perceptions of threat has several advantages over using material measures. Perceptions of threat are more theoretically in line with the racial threat hypothesis, do not require making the same additional assumptions as using material measures, isolate political threat from alternative sources of threat and other racial attitudes, and provide greater confidence in the racial threat literature by using an alternative measure of racial threat. These issues are discussed briefly below, given they have been highlighted by several previous works (Blalock Reference Blalock1967; Chiricos, Hogan, and Gertz Reference Chiricos, Hogan and Gertz1997; Newman Reference Newman2013; Pickett et al. Reference Pickett, Chiricos, Golden and Gertz2012). See also Chiricos et al (Reference Chiricos, Welch and Gertz2004), Coll (Reference Coll2024), and Pickett et al. (Reference Pickett, Chiricos, Golden and Gertz2012), who have all used subjective measures to examine felon disenfranchisement support.
First, using perceptions of threat is more theoretically sound than using material measures. Within the racial threat theory, prejudicial attitudes and behaviors are influenced by perceptions of threat, which are, themselves, expected to be influenced by material measures (Blalock Reference Blalock1967).Footnote 4 For example, Blalock’s (Reference Blalock1967) own Toward a Theory of Minority Group Relations, regarded as a central text in racial threat theory (Dollar Reference Dollar2014, 1), frequently asserts that perceptions of threat play a central role in prejudicial and discriminatory attitudes and behaviors.Footnote 5 Further, as shown in Blalock’s (Reference Blalock1967, 29, 102) own theoretical diagrams, material measures influence attitudes and behaviors through their effects on perceptions of threat. Taken together, this suggests perceived threat is the key quantity of interest influencing racial attitudes/behaviors, with material measures acting as a one-step-removed proxy for said threat.
Second, using material measures assumes individuals are aware of the value of those measures, that those measures translate into racial threat, and that those measures translate into racial threat equally for all individuals. As Newman (Reference Newman2013, 377) remarks, “in order for the competitive group processes presumed by minority group size to activate hostility among Whites toward minorities, these competitive relations have to be perceived and translated into the belief that these groups pose a threat (emphasis added by authors).” For instance, using the percent of the locale that is Black assumes individuals are aware of the size of the local Black population, are threatened by that size and population, and are threatened to a similar degree.
However, past work shows Americans are poor estimators of the local racial composition (Sigelman and Niemi Reference Sigelman and Niemi2001).Footnote 6 Further, they are systematically bad at estimating racial and ethnic population sizes conditional on perceived threat (Nadeau, Niemi, and Levine Reference Nadeau, Niemi and Levine1993), the concept material measures purport to measure. Thus, one’s local racial context may not be a good proxy for perceived threat, with the extent to which actual contexts correlate with perceptions of threat conditional on whether one actually views that group as a threat.
This then brings up the second and third assumptions, that all White Americans are threatened by Black Americans and to the same degree. Using material measures as a proxy for threat assumes individuals within that area see that group as a threat and that each individual is similarly threatened by that group (size). However, this is likely not the case. For example, Pickett et al. (Reference Pickett, Chiricos, Golden and Gertz2012) demonstrate that perceptions of neighborhood racial composition have differential effects on perceptions of crime conditional on whether the respondent thinks Black Americans are violent (i.e., more symbolically threatening). Those perceiving Black Americans as more violent are more likely to link large Black population sizes with perceptions of crime, demonstrating that the extent to which Black population sizes proxy for perceptions of threat is conditional on whether the individual sees Black populations as threatening. Blalock (Reference Blalock1967, 31) recognized this limitation of material measures nearly sixty years ago, writing, “[t]here is also the possibility that different kinds of people will not be similarly motivated [to discriminate against minorities] by the minority percentage variable.” Coupled with the finding that individuals are systematically incorrect about local racial population dynamics, these findings suggest material measures may make a poor and inaccurate proxy for perceptions of threat. However, survey measures of perceived threat do not require individuals to be aware of their local racial compositions, nor assume everyone within the locale is threatened and threatened to the same degree by that composition.
Third, using survey measures directly priming political racial threat allows this study to isolate political racial threat from other forms of threat and other racial attitudes more generally. Regarding other forms of threat, and as discussed by Blalock (Reference Blalock1967, 155), it is difficult to parse political, economic, and symbolic threat influences via material measures like local racial composition.Footnote 7 A large minority population may represent an economic threat (e.g., minority groups perceived as ‘taking White jobs’), may pose a political threat (e.g., minority group perceived as an oppositional voting bloc), and may pose a symbolic threat (e.g., minority group perceived as exhibiting deviant behaviors and holding deviant attitudes) (see also Chiricos et al. (Reference Chiricos, Padgett, Bratton, Pickett and Gertz2012, 15)). In fact, Blalock (Reference Blalock1967, 155) specifically mentions this as a limitation of using material measures over subjective ones, but ultimately uses material measures due to the then-limitations of large-scale survey research. Yet, numerous previous studies have used nearly identical material measures while arguing that the same measure represents different threat motivations, leading Eitle (Reference Eitle, D’Alessio and Stolzenberg2002, 557) to remark,
The often observed association between the size of the black population and the amount of social control imposed on blacks has been interpreted as consistent with one of three conceptually distinct perspectives: (1) the political threat hypothesis, (2) the economic threat hypothesis, and (3) the threat of black crime hypothesis (emphasis added by authors).
Thus, using material measures makes it difficult to distinguish between sources of threat. Further, they also conflate numerous other racial attitudes that may also influence policy support. For example, the size of the local racial population has been found to influence other racial attitudes (e.g., out-group affect (Glaser Reference Glaser1994)) that previous studies also find influence felon disenfranchisement support (Coll, Torres, and Tolbert Reference Coll, Torres and Tolbert2025). Using material measures conflates the impact of these alternative racial attitudes in much the same way that it fails to distinguish between sources of threat. Survey measures, by directly priming political threat, help to isolate political threat from other motivations.
Last, even if all of the above issues were absent from the theoretical and methodological motivations of this study, there is still value in using a different measurement of the independent variable than those frequently used by previous. As mentioned in the manuscript, previous studies have examined how material measures of Black political influence or non-material measures of perceived symbolic threat affect felon disenfranchisement support. Alongside all of the aforementioned reasons for using subjective measures of Black political power, we contribute to this literature simply by switching from the overused local minority population size or perceived symbolic threat indicators to a different measure, providing greater confidence in the racial threat hypothesis overall.
However, there are also limitations to using survey-based measures (e.g., social desirability (Huddy and Feldman Reference Huddy and Feldman2009)), and using material measures also has its advantages (e.g., not relying on survey data). Scholars should weigh the pros and cons of each approach in light of their research question and existing work to determine which approach is better suited for their analyses. Given the aforementioned issues with material measures and dearth of research on perceptions of political racial threat and felon disenfranchisement, we use subjective measures of political racial threat.
Data and Methods
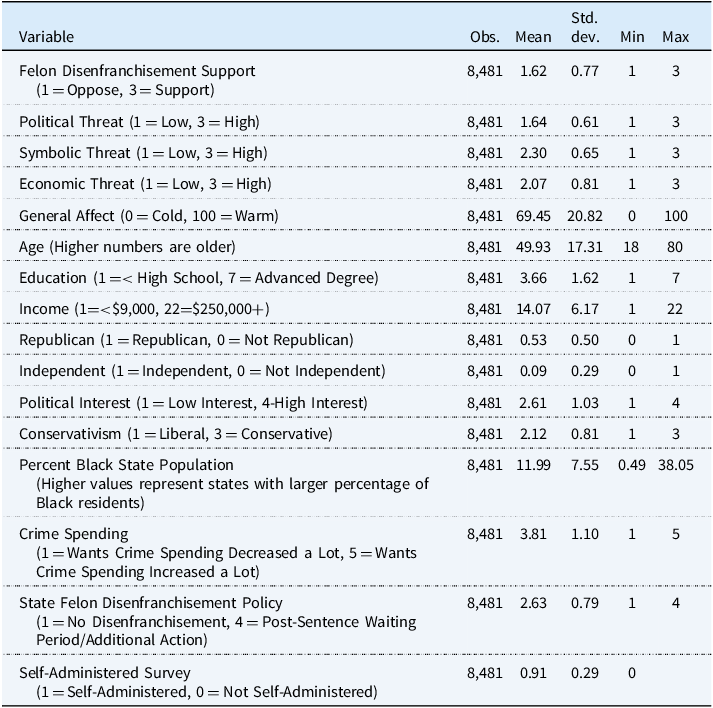
Data for this study come from the 2020 and 2024 American National Election Studies (ANES, American National Election Studies 2021, 2025), include 8,481 White Americans,Footnote 8 and are weighted using the ANES-provided weights. The ANES provides the benefit of a large and nationally representative sample of (White) Americans, as well as questions on felon disenfranchisement support, perceptions of political racial threat, and related respondent attitudes and characteristics. Summary statistics for all variables included in this study can be found in Table 1. Replication materials can be found at the Harvard Dataverse .
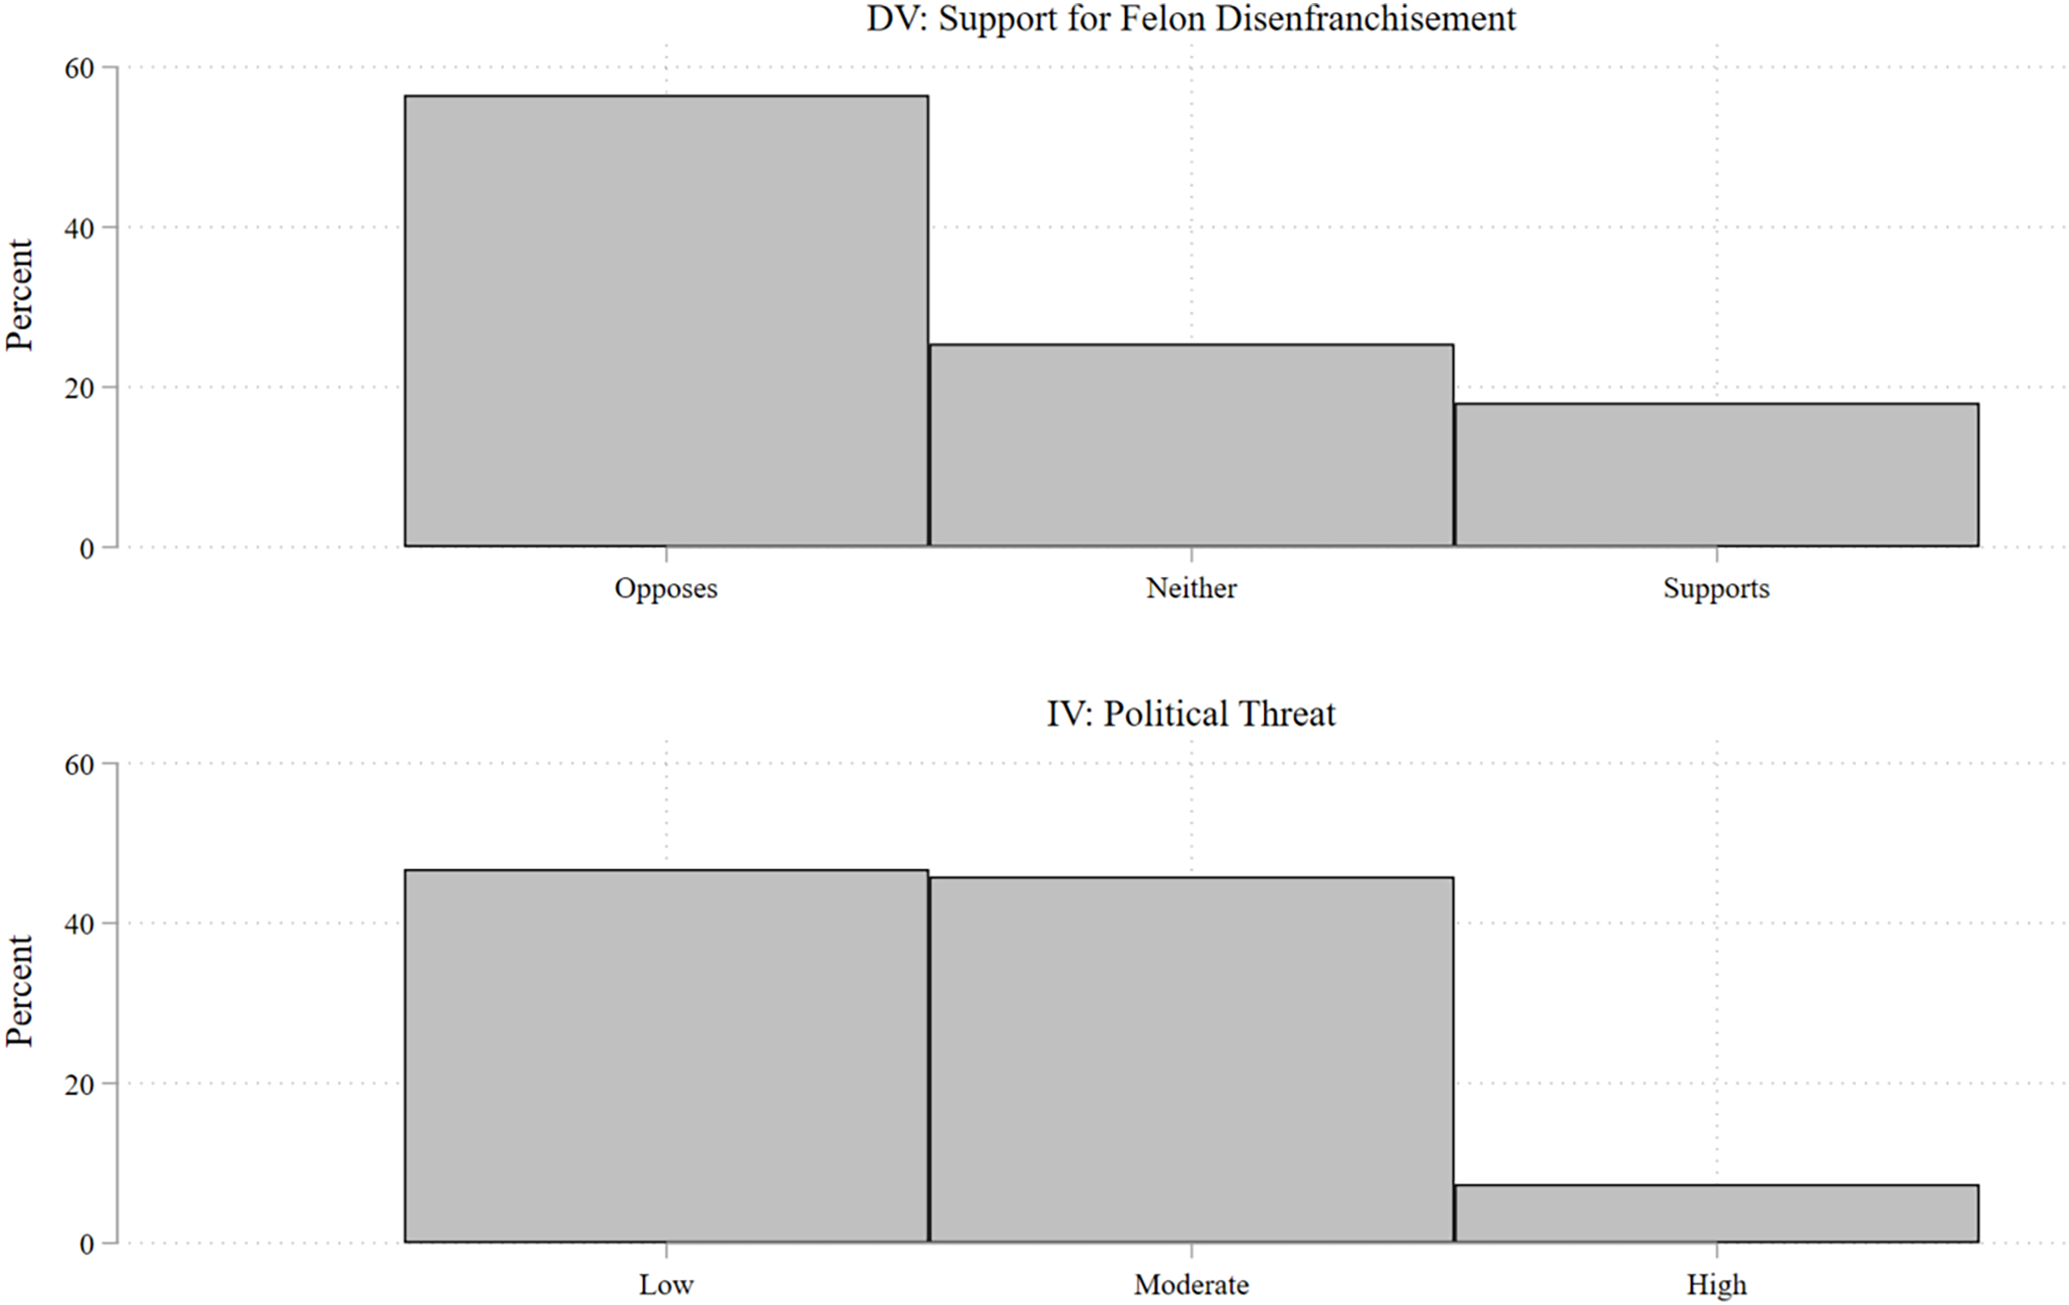
The dependent variable, felon disenfranchisement support, is measured via a three-pointFootnote 9 scale capturing whether the respondent opposes (1), is ambivalent/unsure (2), or supports (3) post-sentencing felon disenfranchisement.Footnote 10 In total, 56% of White Americans oppose felon disenfranchisement, just over a quarter of White Americans neither support nor oppose the policy, and the remaining 18% support disenfranchising felons (see top panel in Figure 2, which details the distribution of the sample across independent (bottom panel) and dependent (top panel) variables).
Summary statistics

Distribution of independent and dependent variables.

To measure political racial threat, respondents were asked two questions gauging perceptions of Black or White political influence (separately): “How much influence do [blacks/Whites] have in US politics?” too little (1), the right amount (2), or too much (3). By directly priming perceptions of racial political influence in US politics, this question taps into perceptions of the extent to which these two groups have political power, the core concept motivating political racial threat (Blalock Reference Blalock1967). To measure perceptions of political racial threat, we then subtract perceptions of White political influence from Black political influence, resulting in a composite measureFootnote 11 of the perceived relative political power balance. Subtracting these two measures creates a measure of political racial threat that simultaneously takes into account whether the out-group is perceived as more politically powerful than the in-group (e.g., do Black Americans have “too much” political power while White Americans have “too little”). As discussed by Blalock (Reference Blalock1967), it is not just that in-groups see out-groups as having some political power, but that their power threatens the in-group’s power.
The Black-White political power difference variable originally spanned five categories, from White Americans having much more power (1), to equal power (3), to Black Americans having much more political power (5). However, unsurprisingly, very few respondents think Black (White) Americans are much more politically powerful than White (Black) Americans. As such, we collapse this variable into a trichotomous measure of whether the respondent thinks White Americans are more politically influential (1, reference group, 43% of the sample), which we term low political racial threat; there is no difference (2, 50%), moderate political racial threat; and whether Black Americans are more politically influential (3, 7%), high political racial threat.Footnote 12
As a further test of the political threat hypothesis, we also expect the effects of Black political influence to differ by partisan identification and ideology. As applied above, the political racial threat hypothesis asserts that White individuals support restrictive election policies under the assumption that those policies will limit the power of a racial group that they are politically in conflict with. Given that Black Americans tend to lean more heavily liberal and Democratic, perceptions of Black power should pose the greatest threat to those on the political right: conservatives and Republicans. To measure party affiliation, we use a binary variable of whether the respondent identifies as a Republican (1 = Republican, 0 = Not Republican), as well as a binary variable denoting whether the respondent is an independent/non-partisan (1 = Independent, 0 = Not Independent), with Democrats serving as the omitted reference group in the models below.Footnote 13 Ideology is captured using a three-point variable of liberal (1), moderate (2), or conservative (3).Footnote 14
There are several reasons beyond political racial threat that one may support felon disenfranchisement.Footnote 15 For example, White Americans may support felon disenfranchisement because they want to use that policy to punish an outgroup they do not like, because they view the outgroup as symbolic or economic threats, or simply to prevent crime, to name a few explanations.Footnote 16 These alternative explanations suggest support for felon disenfranchisement is likely multifaceted. In an attempt to isolate politically strategic support from these alternative reasons, we also control for alternative racial and crime-related attitudes.Footnote 17
First, we include two measures of other sources of racial threat, symbolic racial threat (proxied by perceptions of Black violence) and economic racial threat (proxied by whether respondents think White Americans lose jobs to non-White Americans). Under the racial threat framework, both forms of threat may influence White discriminatory attitudes and behaviors, but for different reasons than political racial threat (Blalock Reference Blalock1967). As such, controlling for symbolic and economic threat assists in isolating the influence of political racial threat.
Next, we include a measure of Black affect (proxied by a feeling thermometer). It may be that any relationship between perceptions of Black political influence and support for felon disenfranchisement is driven by a general affect held towards Black Americans rather than strategic policy support. Including a measure of Black affect allows this study to ensure that political racial threat is driving the relationship at hand.
Felon disenfranchisement is both an election policy and criminal justice policy. Past work demonstrates that those with more anti-crime attitudes are more supportive of felon disenfranchisement (Chouhy, Lehmann, and Singer Reference Chouhy, Lehmann and Singer2022), and that crime has been racialized (Hurwitz and Peffley Reference Hurwitz and Peffley1997), suggesting crime-related attitudes may influence felon disenfranchisement support. As such, we also control for crime spending preferences in an attempt to separate out the influence of general crime attitudes from the more specific political racial threat motivation.
While the aforementioned racial attitude measures are just that, attitudes, we also control for a non-attitudinal measure of racial threat. Specifically, we include a measure of the percent of the state population that is Black.Footnote 18 Such a measure is frequently included as a proxy for racial threat (e.g., Behrens et al. (Reference Behrens, Uggen and Manza2003)), dates back to at least V.O. Key’s (Reference Key1949) Southern Politics, is the operationalization of racial threat utilized by Blalock’s (Reference Blalock1967) Towards a Theory of Minority Group Relations,Footnote 19 and has been argued to capture economic, political, and symbolic threat (Eitle, D’Alessio, and Stolzenberg Reference Eitle, D’Alessio and Stolzenberg2002). Controlling for Black population size allows this study to distinguish between material and perceived measures of threat, while also accounting for the contextual effects that occur through alternative avenues of threat.
With that said, additional models were estimated, including other material measures (e.g., percent of the state legislature that is Black). Including these measures has little to no bearing on the statistical and substantive relationship between perceptions of threat and support for felon disenfranchisement (i.e., the main quantity of interest). Further, these alternative measures tend not to improve model fit above the inclusion of the Black population variable and have little, if any, direct effect on the dependent variable. Further, the high correlation between measures of Black population size and other potential measures of threat renders it difficult to disentangle whether any effect of measures like Black political representation is not merely effects due to Black population size (e.g., Fraga (Reference Fraga2016)).
We also include several demographic, political, and contextual covariates that have previously been found to influence racial attitudes and support for election policies. The demographic covariates include age, education, and income. The political covariates include political interest, as well as the aforementioned partisan and ideological measures. The contextual covariates include the stringency of existing felon disenfranchisement policies in the respondent’s state, alongside the aforementioned Black population size measure. Last, we also include year and survey mode fixed effects.
The dependent variable is ordinal, capturing the degree to which the respondent feels politically racially threatened from low (1) to high (3). A common approach taken to model ordered data is ordered logistic regression. However, ordered logistic regression assumes parallel lines (proportional odds) or that a single variable’s coefficients are similar across categories of the dependent variable. Additional analyses (see Appendix F) suggest this assumption is violated, as it usually is in practice (Williams Reference Williams2016). From here, researchers often continue with the assumption-violated ordered logistic regression model, use multinomial logistic, linear regression, or, as we do, generalized ordered logistic regression (Williams Reference Williams2006).
Generalized ordered logistic regression models the ordered structure of the dependent variable, but with a partial relaxing of the parallel lines assumption (Williams Reference Williams2006). It does so by using a stepwise process that identifies which variables do and do not violate the assumption.Footnote 20 Those that do not violate the assumption are constrained to have constant values across dependent variable categories, while coefficients for those variables found to violate the assumption are allowed to vary across dependent variable categories. After all variables that meet the parallel lines assumption are constrained and those that do not are allowed to vary, a global Wald test is used to determine whether the resulting model violates the parallel lines assumption.Footnote 21 The final coefficients can be interpreted similarly to those found under an ordered logistic regression model (Williams Reference Williams2006, 64); e.g., positive coefficients indicate greater support.Footnote 22 However, for unconstrained variables, their effects may differ across dependent variable categories.
Utilizing generalized ordered logistic regression provides several advantages to the above-mentioned alternative approaches (Williams Reference Williams2006, Reference Williams2016). It does not assume parallel lines for all independent variables like ordered logistic regression, more directly models the ordered dependent variable than multinomial logistic or linear regression, and is more parsimonious than multinomial logistic regression. Results using ordered logistic regression (Appendix B), multinomial logistic regression (Appendix C), and linear regression (Appendix D) come to similar conclusions.
Analyses
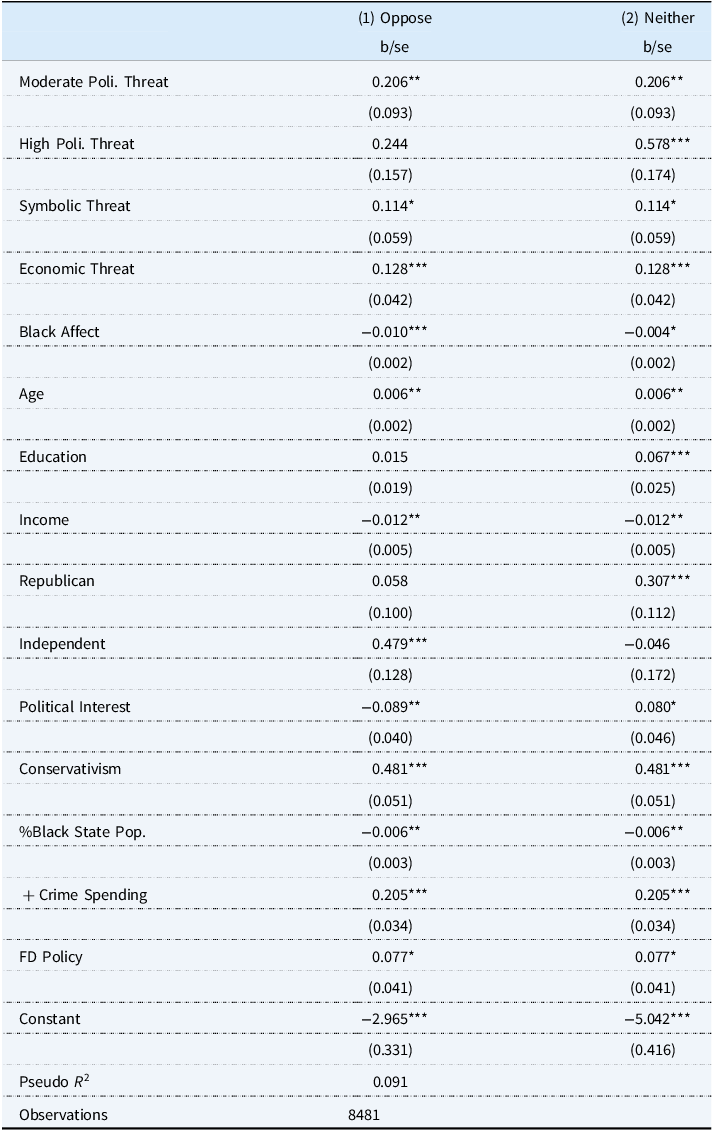
We begin the analyses by examining support for felon disenfranchisement conditional on perceptions of political racial threat among the full sample of White Americans. Results are reported in Table 2. For interpretation, Figure 3 displays a predicted probability plot estimating the predicted probability of opposing (diamond), being neutral to (triangle), or supporting (circle) felon disenfranchisement conditional on perceiving low (left coefficients), moderate (middle coefficients), or high (right coefficients) political racial threat. Plot markers are slightly offset from their true position on the x-axis to reduce overlap and aid in interpretability. All estimates were computed holding all other covariates at their mean or modal values.
Perceptions of Black political influence and support for felon disenfranchisement among White Americans

Generalized ordered logistic regression predicting support for felon disenfranchisement (higher values=greater support). Independent variable reference group is low political racial threat. All models estimated with robust standard errors clustered by state and include survey mode and year fixed effects. *0.10 **0.05 ***0.01.
Perceptions of Black political influence and support for felon disenfranchisement among White Americans.
Note: Estimates derived from columns 1–2 in Table 2 holding all other variables at their mean or modal values. 95% confidence intervals shown.

Examining patterns to felon disenfranchisement support in Figure 3, results reiterate what we found above, that most White Americans oppose felon disenfranchisement. However, we also see some evidence that political racial threat perceptions condition White felon disenfranchisement support. Specifically, White Americans who feel more politically racially threatened are roughly 5 percentage points less likely to oppose disenfranchisement (diamond), 3 points less likely to be ambivalent (triangle), and 8 points more likely to support disenfranchisement (circle) as racial threat increases from low to medium or high. With that said, Table 2 suggests racial threat may influence some more than others. Among those on the fence (column 2), moderate and high threat is associated with being more supportive of disenfranchising felons. However, only moderate threat, not high threat, significantly increases support among the already-opposed (column 1). This suggests those on the fence may be more moved by racial threat than those with stronger opinions.
The control variables largely operate as expected, with older voters and more conservative voters being more likely to support felon disenfranchisement, as are Republicans compared to Democrats. We also find that economic threat, symbolic threat, and crime spending preferences are tied to greater felon disenfranchisement support, while positive Black affect is associated with lower support. Interestingly, we find that those in states with larger Black populations are actually less supportive, possibly as we have already controlled for many of the pathways through which a negative effect may occur (e.g., increased threat or negative affect). Last, those in states with more stringent felon disenfranchisement policies are more supportive.
Next, we examine the extent to which the patterns uncovered in Table 2 and Figure 3 are conditional on partisanship and ideology. As mentioned above, we argue the relationship between perceptions of Black-White political power and support for felon disenfranchisement is partially a politically strategic relationship wherein those who would gain, politically, from disenfranchising felons are more likely to support felon disenfranchisement, given the greater political benefit derived from policy implementation. Because of the racial patterns to partisanship and ideology described above, coupled with the racialization of crime, this results in White Republicans and conservatives receiving a larger political payoff from felon disenfranchisement.
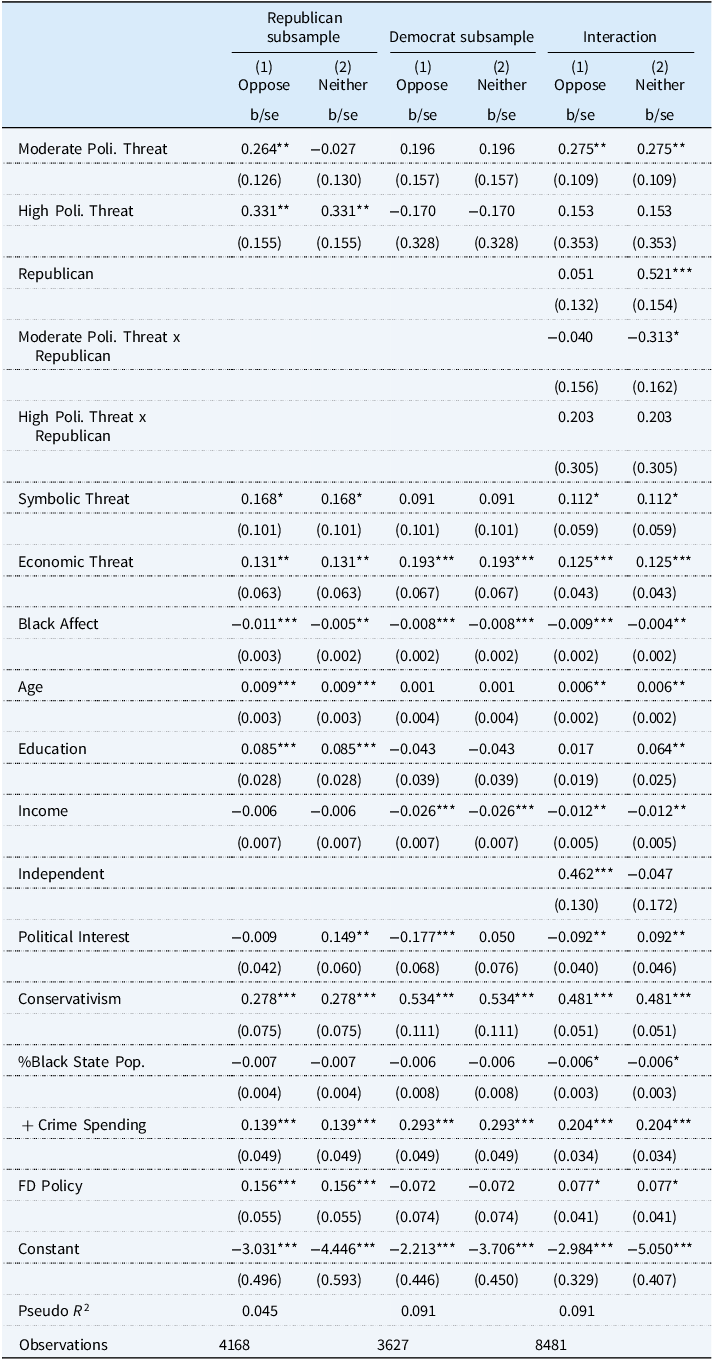
Table 3 examines the effects of perceived political racial threat across parties. The first two columns replicate Table 2 but among a subsample of Republicans. The following two columns do the same but among Democrats. The last two include the full sample with interactions between Republican partisanship and perceived political racial threat. Figure 4a provides the predicted probability plots for the Republican and Democrat subsample models, while Figure 4b does the same based on the interaction coefficients.
Perceptions of Black political influence and support for felon disenfranchisement among White Americans by party

Generalized ordered logistic regression predicting support for felon disenfranchisement (higher values=greater support). Independent variable reference group is low political racial threat. All models estimated with robust standard errors clustered by state and include survey mode and year fixed effects. *0.10 **0.05 ***0.01.
a. Perceptions of Black political influence and support for felon disenfranchisement among White Americans by party (Subsamples). b. Perceptions of Black political influence and support for felon disenfranchisement among White Americans by party (Interactions).
Note: Estimates derived from columns 1–4 (a) and 5–6 (b) in Table 3 holding all other variables at their mean or modal values. 95% confidence intervals shown.

By both specifications, results generally suggest that racial threat affects Republicans and Democrats differently. More politically threatened White Republicans are more supportive and less oppositional towards felon disenfranchisement than less politically threatened White Republicans. At the same time, felon disenfranchisement policy preferences appear less sensitive to political racial threat among White Democrats. These results support Hypothesis 2, that perceptions of political racial threat will be associated with greater support for felon disenfranchisement among White Republicans more than White Democrats.
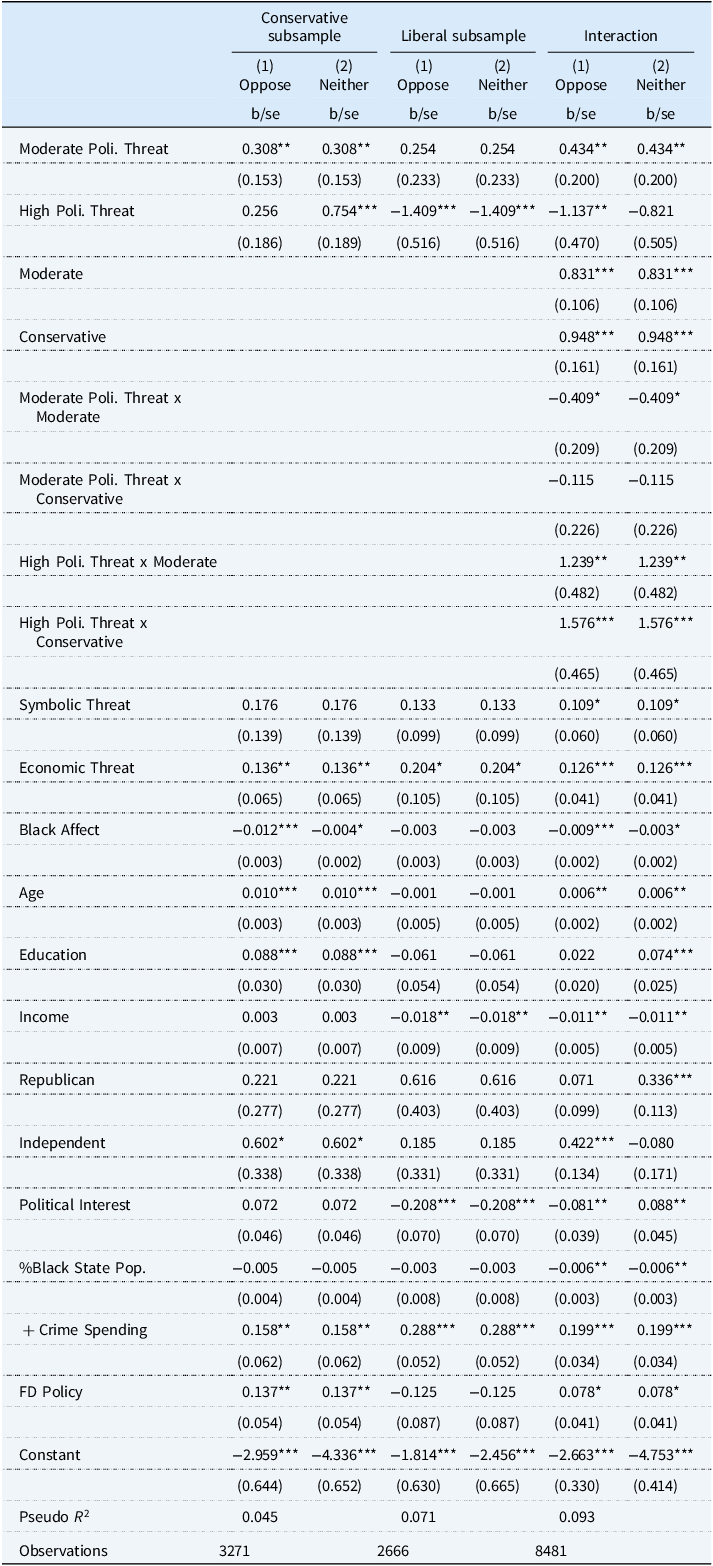
Turning to ideology, Table 4 and Figure 5a–b replicate Table 3 and Figure 4a–b, but differentiating between conservatives and liberals rather than Republicans and Democrats. Again, we find that those on the political right who feel more politically threatened are more supportive of felon disenfranchisement, while those on the political left who feel more threatened are actually less supportive (compared to their respective less-threatened co-partisans), and to substantive degrees. This latter finding suggests liberal respondents may not feel threatened by large Black political influence, further highlighting the issue of assuming (material or subjective) measures Black power automatically translates into perceptions of political threat. With that said, results are in line with Hypothesis 3, as racially threatened conservatives have greater support for felon disenfranchisement than liberals who perceive similar racial power dynamics. Combined with the above evidence of partisan-conditional political racial threat effects, this evidence of ideology-conditional political racial threat further demonstrates that perceptions of undue Black political power likely foster greater perceptions of political threat among White Americans on the political right than those on the political left, and that this political threat is tied to greater support for disenfranchising felons, of which Black Americans comprise a greater proportion than White Americans.
Perceptions of Black political influence and support for felon disenfranchisement among White Americans by ideology

Generalized ordered logistic regression predicting support for felon disenfranchisement (higher values = greater support). Independent variable reference group is low political racial threat. All models estimated with robust standard errors clustered by state and include survey mode and year fixed effects. *0.10 **0.05 ***0.01.
a. Perceptions of Black political influence and support for felon disenfranchisement among White Americans by ideology (Subsamples). b. Perceptions of Black political influence and support for felon disenfranchisement among White Americans by ideology (Interaction).
Note: Estimates derived from columns 1–4 (a) and 5–6 (b) in Table 4 holding all other variables at their mean or modal values. 95% confidence intervals shown.

Conclusion
Felon disenfranchisement has a long history of deterring Black political influence (Behrens, Uggen, and Manza Reference Behrens, Uggen and Manza2003; Eubank and Fresh Reference Eubank and Fresh2022; Kelly Reference Kelly2017; Uggen et al. Reference Uggen, Larson, Shannon and Stewart2024), but to what extent does the political threat of Black power affect White Americans’ support for disenfranchising felons? Applying the political racial threat framework to felon disenfranchisement support, this study finds that politically threatened White Americans are more supportive of revoking felon voting rights, particularly White conservatives and White Republicans. These effects persist even controlling for economic and symbolic threat, general Black affect, crime spending preferences, and Black state population size, demonstrating perceptions of political racial threat influence support for felon disenfranchisement independent of considerations of other forms of threat, a general like/dislike of Black Americans, crime spending attitudes, and state racial composition.
Combined with past work examining racial attitudes and support for felon disenfranchisement (Chiricos et al. Reference Chiricos, Padgett, Bratton, Pickett and Gertz2012; Wilson, Owens, and Davis Reference Wilson, Owens and Davis2015), this study further demonstrates the influence of racial considerations in who should be allowed to vote. Additionally, alongside previous studies of racial threat and policy support (Newman Reference Newman2013; Winter Reference Winter2006), this study contributes additional evidence that perceptions of racial threat alter policy support, adding political racial threat and felon disenfranchisement support to the list of affected policy areas. Last, coupled with previous work examining support for voting rights (Alarian and Zonszein Reference Alarian and Zonszein2025; Teele Reference Teele2018; Whitaker and Giersch Reference Whitaker and Giersch2021), we also demonstrate that politically racial considerations influence when White Americans support extending or restricting the franchise. As Americans continue to grapple with the decision of whether to disenfranchise felons, it is important to consider how the racial underpinnings of support for such policies conflict with the original legal moralism argument from which such policies were borne before widespread Black enfranchisement (Schroedel et al. Reference Schroedel, Rogers, Dietrich and Garcia2024).
Moving forward, future work should build on the findings presented here to further test the relationship between political racial threat and support for voter qualifications. For examples, to what extent does this relationship differ based on the racial/ethnic group dyad (e.g., Black respondents and perceptions of Asian political influence) or by voter qualification (e.g., other forms of felon disenfranchisement, mental competency), what are some ways to test causal and mediating mechanisms (e.g., survey experiments, mediation analyses), and to what extent do these relationships differ along other covariates (e.g., political knowledge, personal history with crime)?
Supplementary material
To view supplementary material for this article, please visit https://doi.org/10.1017/rep.2025.10047
Data availability statement
Replication data and documentation will be available at the Harvard Dataverse.
Funding statement
There was no funding provided for this study.
Competing of interest
There are no conflicts of interest.


 Open access