

INTRODUCTION
Oil palm (Elaeis guineensis Jacq.) has become increasingly popular as a source of revenue in rural Indonesia, providing smallholder farmers with the opportunity to increase their income and improve their livelihoods (Budidarsono et al., Reference Budidarsono, Rahmanulloh and Sofiyuddin2012; Edwards, Reference Edwards2015; Lee et al., Reference Lee, Ghazoul, Obidzinski and Koh2013; Sheil et al., Reference Sheil, Casson, Meijaard, Van Noordwijk, Gaskell, Sunderland-Groves, Wertz and Kanninen2009). Initially, most smallholder plantations were closely linked to and technically supported by large-scale plantations, for example, in schemes where transmigrant farmers were allocated two-hectare oil palm plots planted by plantation companies (the so-called plasma schemes; Gatto et al., Reference Gatto, Wollni and Qaim2015). More recently, the number of independent smallholders has risen rapidly (Euler et al., Reference Euler, Schwarze, Siregar and Qaim2016a; Molenaar et al., Reference Molenaar, Persch-Ort, Lord, Taylor and Harms2013). The production capacity of oil palm smallholders depends on both land ownership and land productivity. In a situation of land scarcity, improving productivity per area of land is a necessary strategy to increase harvested yields and income (Budidarsono et al., Reference Budidarsono, Rahmanulloh and Sofiyuddin2012). Average yields produced by Indonesian smallholders are much less than the achievable yields, indicating the existence of agronomic constraints (Euler et al., Reference Euler, Hoffmann, Fathoni and Schwarze2016b; Molenaar et al., Reference Molenaar, Persch-Ort, Lord, Taylor and Harms2013; Woittiez et al., Reference Woittiez, van Wijk, Slingerland, van Noordwijk and Giller2017). Poor yields can have strong negative effects on farmer income, and interfere with Indonesia's commitment to increase palm oil outputs without further area expansion. In order to improve yields, the underlying causes of poor productivity need to be identified.
Several studies on the constraints to productivity of smallholder oil palm plantations in Indonesia have been carried out. In Jambi, Sumatra, Euler et al. (Reference Euler, Hoffmann, Fathoni and Schwarze2016b) estimated the yield in smallholder plantations to be around 40% of the potential yield. Based on data collected through farmer surveys and modelling, fertiliser limitations, harvesting interval, and plant mortality were identified as key causes of the yield gap. Earlier, Lee et al. (Reference Lee, Ghazoul, Obidzinski and Koh2013) surveyed 313 households in 15 villages from three provinces in Sumatra. In this study, harvesting interval was found to be the main determinant of productivity, with irregular harvesting (once per month) correlating with poor yields (15 tonne fresh fruit bunches ha−1 year−1) and very regular harvesting (three times per month) correlating with good yields (24 t fresh fruit bunches ha−1 year−1). Results from a large-scale survey amongst 1069 households in six locations in Sumatra and Kalimantan (Molenaar et al., Reference Molenaar, Persch-Ort, Lord, Taylor and Harms2013) identified a number of key constraints, including insufficient fertiliser application, incorrect harvesting practices, non-hybrid varieties, poor (re)planting practices, and the overarching issue of lack of access to knowledge and finance. In all of the previous investigations, inadequate (insufficient) or inappropriate (unbalanced) use of fertilisers appeared as a key constraint.
Current oil palm planting materials, under conditions of the sufficient water and nutrients, can yield well over 35 t ha−1 year−1 of fruit bunches, or 8 t ha−1 year−1 of oil (Mohd et al., Reference Mohd Din, Rajanaidu, Kushairi, Tarmizi, Noh, Marhalil, Zulkifli, Norziha, Meilina and Ravigadevi2014). In order to achieve such large yields, the application of N, P, K, Mg and B is required on most soils (Ng, Reference Ng, Earp and Newall1977). A deficiency in any of these nutrients may lead to very large yield reductions (Woittiez et al., Reference Woittiez, van Wijk, Slingerland, van Noordwijk and Giller2017), but the nutrient requirements and yield penalties depend strongly on soil type (Goh, Reference Goh, Soon and Pau2005) and planting material (Ollivier et al., Reference Ollivier, Flori, Cochard, Amblard, Turnbull, Syahputra, Suryana, Lubis, Surya, Sihombing and Gasselin2017), among others. Company plantations routinely carry out randomised fertiliser trials to determine the nutrient applications required for optimal yields (for an overview of trial results from Sumatra, see Tohiruddin et al., Reference Tohiruddin, Prabowo and Foster2006). In order to assess the palm nutrient status and provide fertiliser recommendations based on tissue sampling, a range of nutrient deficiency thresholds have been established (Foster, Reference Foster, Fairhurst and Härdter2003). In Cameroon, soil and leaf sample analysis in smallholder oil palm plantations showed that deficiencies in especially N and K were common, causing large reductions in yield (Rafflegeau et al., Reference Rafflegeau, Michel-Dounias, Tailliez, Ndigui and Papy2010), but we could find no published reports on similar studies in Indonesia. Our study aimed to fill this gap. The objective was to increase our understanding of fertiliser use and nutrient deficiencies in independent smallholder plantations in Indonesia, and to assess the potential effects of nutrient limitations on palm growth and yield.
MATERIALS AND METHODS
Research setup
The research was carried out in two regions in Indonesia: Sintang regency, West-Kalimantan province on the island of Borneo, and Muaro Jambi regency, Jambi province on Sumatra. Both areas are expansion areas with large numbers of smallholders, and they were selected by a development NGO supporting independent smallholders based on their potential for combining nature conservation with sustainable agricultural development. In Sintang, two research areas were selected: Binjai Hilir village (fields located between S00.04152, E111.25298 and S00.09211, E111.30073), and Sungai Tebelian subdistrict (fields located between N00.14476, E111.23421 and N 00.11357, E111.29272). In Jambi, Ramin village (fields located between S01.48779, E103.78348 and S01.53911, E103.82259) was the only research site. Both sites were sampled in different years and seasons, and by different teams, and there were some differences in methods between sites. These differences are highlighted below, and the results from the sites are mostly reported separately in the results section.
Research area description
Sintang
Sintang is located in West Kalimantan, along the River Kapuas. The topography is flat to gently rolling. The soils are clay or sandy clay loam Ultisols, with some shallow peat pockets in the Sungai Tebelian area. The climate is humid tropical, with an average annual temperature of 26.9°C, an average maximum temperature of 32.5°C and minimum temperature of 22.9°C. The yearly precipitation is around 3,000 mm, with a rainy season from October to January and the driest month in August (~100 mm month−1). In Binjai Hilir, an oil palm cooperative was active, which consisted of 2,410 households, divided over 7 villages. The total area under oil palm (including scheme and independent plantations) was 4,805 ha. Average yields in 2013 were 17‒18 t fruit bunches ha−1 year−1, with a peak season in November and December and a low season from February to June. Bondo Sepolo (Tebelian) cooperative consisted of a few thousand households, divided over 16 villages, with a total oil palm area of 5,579 ha planted around 2007. The average yield was 18 t ha−1 year−1, with the peak season from October to January.
Jambi
Ramin village is located in sub-district Kumpeh Ulu of Muaro Jambi regency in Jambi province, about 40 km north-east of Jambi city. The topography is flat low-lying coastal plain. Soils in the village area are alluvial clay Entisols (34%) and deep fibric Histosols (66%), with most sample plantations located on the clay Entisols. The climate is humid tropical, with an average annual temperature of 27°C, an average maximum temperature of 31°C and minimum temperature of 22.5°C. The yearly precipitation is around 2,300 mm, with a rainy season from October to February and the driest months in June, July and August (~100 mm rainfall per month). In 2014, Ramin village covered 3,325 ha of agricultural land, of which 2,213 ha (67%) were used for oil palm cultivation. The village consisted of 397 households, of which 321 were involved in farming (2014 data obtained from the village office). Most oil palms were planted between 1999 and 2002. All oil palm farmers in Ramin were independent.
Farmer selection
In Sintang, 24 independent farmers from two areas (Binjai and Tebelian) with plantations planted in or before 2009 (mostly after 2003) were randomly selected from a list of independent oil palm farmers in Sintang, provided by the government-related organisation Fasda. If the selected farmer was not available at the time of the field visit, a next farmer was randomly drawn where possible or found by asking locally. The average plantation size of the sample in Sintang was 10.9 ha (s = 10.8). In Jambi, six farmers had been pre-selected to participate in a research project through discussion with a local informant. Soil and leaf sampling were regularly carried out in the fields of these six farmers. An additional 19 farmers were randomly selected for interviews and for soil and leaf sample collection. Plantations on deep peat were excluded from the sample, but shallow peat pockets were sometimes present in parts of the fields. The average plantation size in the sample from Jambi was 6.1 ha (s = 10.3) and average farmer age was 48.4 years (s = 12.2).
Research activities
The research activities were carried out in November/December 2013 in Sintang, and in August 2015 in Jambi. The research consisted of two parts: an interview and a plantation visit. During the interview general farm characteristics (farmer origin; plantation size; division between scheme and independent fields; planting year), yields (harvest interval; best and poorest yields during the previous year; and duration of the extremes) and fertiliser use (type and quantity applied during the previous year) were discussed. The questions were based on recall, unless the respondent kept records. After the interview, a plantation was selected for assessment and sampling. In Sintang, the oldest plantation closest to the house was selected. In Jambi, the closest plantation was selected. The selected plantations were mapped using a GPS device. In Sintang, three palms in the plantation were selected randomly for soil and leaf sampling. If the selected palm was sick or deemed unrepresentative, then a new palm was randomly selected. In Jambi, four palms were selected in the four corners of the field, three palms away from the edge. Leaf 17 was identified and excised (Chapman and Gray, Reference Chapman and Gray1949), and the length, petiole width and thickness, and number of leaflets of leaf 17 were measured or counted, as well as the length and breadth of the eight largest pinnae (four from the left and four from the right side). The trunk girth and the height of the trunk (at the base of leaf 41) were measured. For a sample of 5–20 loose fruits or harvested bunches (depending on availability), the number of dura fruits or bunches was scored.
Sample collection
The total sample size was 49 (24 from Sintang and 25 from Jambi) for both soil (circle and stack) and tissue (leaf and rachis). For the leaf samples, the middle ~20 cm piece of the eight largest leaflets of leaf 17 (four on the left and four on the right side of the rachis) were collected. In addition, a piece of rachis of approximately 20 cm in length was collected as rachis sample from the same point on the leaf. Soil samples were collected at a depth of 5–10 and 25–30 cm using a 100 cm3 steel sampling ring in Sintang, or with an Edelman combination auger at 0–40 cm deep in Jambi. Two samples were collected around each sample palm: one at 50 cm from the trunk in the palm circle (representing around 20% of the plantation area) and one at 3 m from the trunk in the inter-row under the frond stack (representing around 12% of the plantation area; Fairhurst, Reference Fairhurst1996).
Sample processing and analysis
Soil samples were air dried in plastic trays or open plastic bags and ground. In Jambi, samples were sieved to <2 mm after grinding to remove debris and aggregates and improve homogeneity. Pinnae and rachis samples were first air-dried and then oven-dried at ~50°C (Sintang) or 65°C (Jambi) for 48 h. After drying the samples were sent to a laboratory for analysis. Soil samples were analysed as follows: (i) water-extracted pH; (ii) total organic matter using a spectrophotometer at 600 nm; (iii) extractable P using the Bray II protocol; (iv) Al + H through KCl extraction and titration; (v) soil organic N through two-step Kjeldahl; (vi) soil extractable K using 1 M ammonium acetate extraction and flame photometry; (vii) soil extractable Mg and Ca using 1 M ammonium acetate extraction and atomic absorption spectrometer (AAS) analysis; (viii) and soil texture by the Bouyoucos hydrometer method. For the tissue samples, the following analyses were carried out (i) leaf nitrogen through sulphuric acid digestion and semi-micro Kjeldahl distillation; (ii) leaf and rachis P through ashing followed by spectrophotometric analysis (vanadomolybdate method); (iii) leaf and rachis K using a flame photometer after ashing; (iv) leaf Ca and Mg (and Cu and Zn if required) by AAS after ashing; (v) leaf B using a colorimetric method after dry-ashing with CaO. Samples from Sintang were analysed at London Sumatra BLRS Analytical Laboratory in Medan, Sumatra. Samples from Jambi were analysed at Central Group CPS Laboratory in Pekanbaru, Sumatra.
Data analysis
Critical nutrient concentrations
The results from the tissue analysis were further analysed. First, the balance between the different nutrient concentrations was calculated for (i) leaf N and P, and (ii) leaf K, Mg and Ca. Leaf P concentrations are closely related with leaf N concentrations, and the critical deficiency threshold for P depends on the concentration of N (Ollagnier and Ochs, Reference Ollagnier and Ochs1981). The critical P threshold was calculated using the following equation:
 $$\begin{equation}
P = 0.0487*N + 0.039
\end{equation}$$
$$\begin{equation}
P = 0.0487*N + 0.039
\end{equation}$$
with P and N in %DM (Ollagnier and Ochs, Reference Ollagnier and Ochs1981). Deficiency thresholds for leaf cations (K, Mg and Ca) are also closely related. The total leaf cation (TLC) concentration was calculated using the following equation:
 $$\begin{equation}
{\rm{TLC}} = \left( {\frac{{{\rm{leaf}}\ {\rm{K}}}}{{39.1\ \div 1}} + \ \frac{{{\rm{leaf}}\ {\rm{Mg}}}}{{24.3\ \div 2}} + \ \frac{{{\rm{leaf}}\ {\rm{Ca}}}}{{40.1\ \div 2}}} \right)\ \times 1000
\end{equation}$$
$$\begin{equation}
{\rm{TLC}} = \left( {\frac{{{\rm{leaf}}\ {\rm{K}}}}{{39.1\ \div 1}} + \ \frac{{{\rm{leaf}}\ {\rm{Mg}}}}{{24.3\ \div 2}} + \ \frac{{{\rm{leaf}}\ {\rm{Ca}}}}{{40.1\ \div 2}}} \right)\ \times 1000
\end{equation}$$
with TLC in cmol kg dry matter−1 and leaf K, Mg and Ca in % DM (Foster, Reference Foster, Fairhurst and Härdter2003). The optimum values of leaf K and Mg were calculated relative to the TLC concentration by dividing the leaflet nutrient concentration in cmol kg−1 (for example: leaf K ÷39.1 × 1000) over the TLC concentration.
Principal component analysis
For vegetative growth parameters measured in the field (petiole cross-section, frond length, and average leaflet length and width) we ran a principal component analysis (PCA) on the correlation scale to explore and resolve the expected high multi-collinearity. Components above the inflection point in the scree plot, with an eigenvalue of >1.0 were retained for further analysis, provided that the Kaiser-Meyer-Olkin (KMO) Measure of Sampling Adequacy scores were >0.5 for all individual variables (Kaiser, Reference Kaiser1974). A single vegetative growth component was extracted, and its values were calculated based on the factor scores and used for further analysis (from here on referred to as ‘vegetative growth’).
Regression model
The relationships between the nutrient concentrations and vegetative growth were explored using linear regression analysis. We fitted a single three-way interaction model
 $$\begin{equation}
Y_i = \alpha + \beta A + \gamma L + \tau N + \varepsilon_i
\end{equation}$$
$$\begin{equation}
Y_i = \alpha + \beta A + \gamma L + \tau N + \varepsilon_i
\end{equation}$$
where Yi is the vegetative growth component, as derived from the PCA. Vector A contains the palm age (in years after planting) and the palm age squared; vector L contains the dummy variable for the two different research locations with contrasting soils; and vector N contains the tissue nutrient concentrations in the leaf (N, P, K, Mg and Ca) and rachis (P and K) with two two-way interactions (leaf N × leaf P, Ollagnier and Ochs (Reference Ollagnier and Ochs1981); and leaf N × leaf K, Foster and Prabowo (Reference Foster and Prabowo2002)) and one three-way interaction (leaf K × leaf Mg × leaf Ca, Foster (Reference Foster, Fairhurst and Härdter2003)). All variables were centred before analysis, and coefficients were estimated using Ordinary Least Squares.
Potential and actual leaf area
To calculate the gap between observed palm growth and potential palm growth, we used leaf area as indicator for growth. We calculated the area of leaf 17 using the following equation:
 $$\begin{equation}
l = 0.35 + 0.30*{\rm{PCS}}
\end{equation}$$
$$\begin{equation}
l = 0.35 + 0.30*{\rm{PCS}}
\end{equation}$$
with l = area of leaf 17 and PCS = measured petiole cross-section in cm2 (Gerritsma and Soebagyo, Reference Gerritsma and Soebagyo1999). Potential leaf area was calculated based on the results from a cultivar times density experiment by Gerritsma and Soebagyo (Reference Gerritsma and Soebagyo1999). The least vigorous cultivar, at a standard density of 143 palms ha−1 was selected as a benchmark, and the leaf area development was calculated using the following equation:
 $$\begin{equation}
l = 10.80{e^{ - 2.55{e^{ - 0.40t}}}}
\end{equation}$$
$$\begin{equation}
l = 10.80{e^{ - 2.55{e^{ - 0.40t}}}}
\end{equation}$$
where l = single leaf area and t = years after planting (YAP).
All statistical analyses were run in SPSS. Significant results are shown with * for P < 0.05, ** for P < 0.01 and *** for P < 0.001.
RESULTS
Fertiliser application practices
Overall, 100% of the farmers in Sintang and 92% of the farmers in Jambi applied mineral fertilisers in their plantation over the most recent year. The average total application across fertiliser types was 8.1 kg palm−1 in Sintang, and 5.4 kg palm−1 in Jambi (Table 1). Based on the reported fertiliser types and quantities used in the plantations, the yearly nutrient applications per palm and per hectare were calculated. On average, farmers in Sintang applied 178, 55, 102 and 7 kg ha−1 year−1 of N, P, K and Mg, respectively, and farmers in Jambi applied 86, 29, 88 and 18 kg ha−1 year−1. There were large variations amongst farmers in terms of nutrient amounts applied. One farmer in Jambi applied no chemical fertiliser whatsoever, and one farmer applied only some organic fertilisers.
Fertiliser use per year in Sintang (in 2013) and Jambi (in 2013/14). For each site, the left column shows the percentage of farmers using a particular fertiliser or nutrient, and the right column shows the use in kg palm−1 year−1. The use was calculated as the total use per site divided by the number of users, and therefore excludes farmers who do not use the fertiliser or nutrient. The fertiliser composition is shown as N–P2O5–K2O–MgO unless otherwise indicated. The mineral content of P2O5, K2O, and MgO is 44% P, 83% K, and 60% Mg, respectively. The total fertiliser application (top row) excludes organic fertilisers.
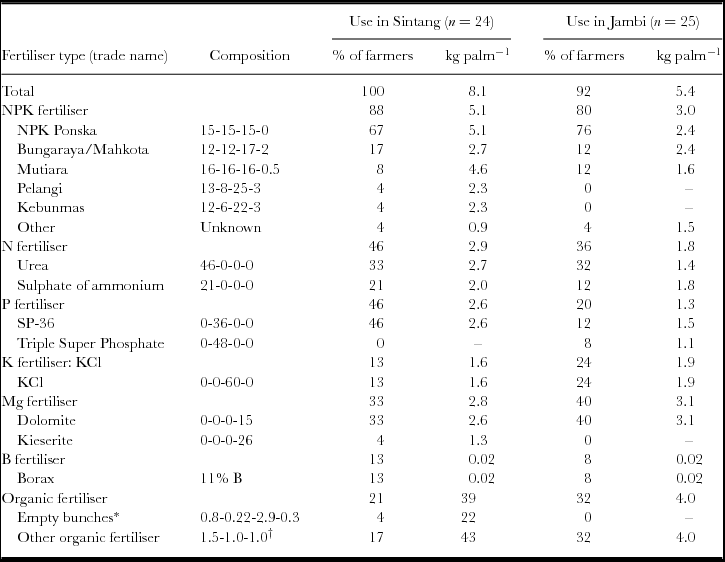
*Composition of EFB returned from the mill in %DM (Gurmit et al., Reference Gurmit, Kow, Lee, Lim, Loong, Singh, Lim, Leng and Kow2007).
†Approximate average composition of Petroganik fertiliser and fresh animal manure.
Soil nutrient status
Soil pH and nutrient concentrations in Sintang and Jambi are shown in Figure 1. The alluvial clays in Jambi were rich in minerals, especially Mg and Ca, and poor in organic matter, while the Ultisols in Sintang were highly weathered and nutrient-poor. In Sintang, and to a lesser extent in Jambi, P availability was higher in the circle, where the fertilisers were mostly applied. Both in Sintang and in Jambi soils were poor in K, but in Sintang these deficiencies were particularly severe (Figure 1). Soils in Sintang were also poor in Mg.
Soil nutrient concentrations in Sintang (n = 24), and Jambi (n = 25) in the circle and under the frond stack.

Soil nutrients in both areas were strongly correlated. In Jambi, the strongest significant correlations were found between Ca and Mg (r = 0.796**); SOC and N (r = 0.685**); and pH and Mg (r = 0.652**) in the circle, and between SOC and N (r = 0.724**); pH and Mg (r = 0.693**); and Mg and Ca (r = 0.662**) under the stack. In Sintang, there were strongly significant correlations between SOC and K (r = 0.854**), N and K (r = 0.808**); and SOC and N (r = 0.785**) in the circle, and between SOC and N (r = 0.723**) under the stack. Application of Mg was significantly correlated with circle Ca in Jambi (r = 0.413*), and in Sintang Mg application was positively correlated with circle N (r = 0.626**) and K (r = 0.492*), and with N under the stack (r = 0.409*). No significant correlations were found between individual nutrient application rates and their corresponding soil concentrations.
Tissue nutrient status
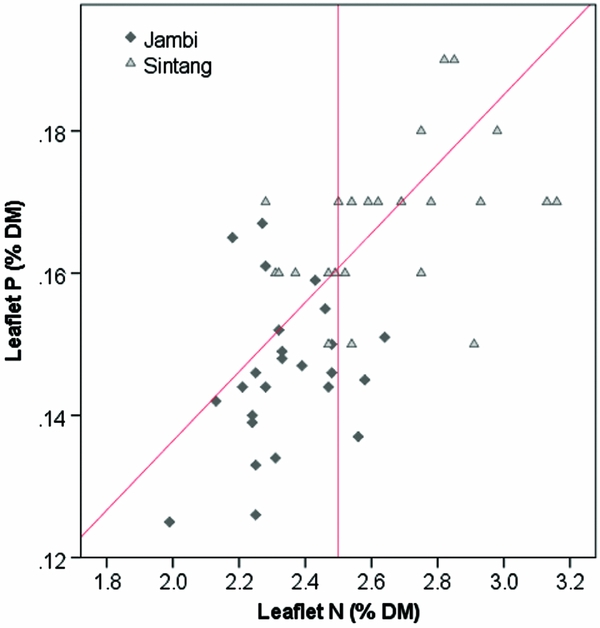
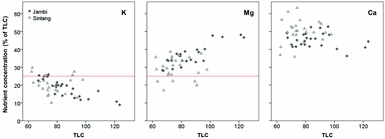
The critical leaflet N concentration depends on palm age and ranges from 2.65 %DM in palms < 9 YAP to 2.35 %DM in palms > 20 YAP (Ollagnier and Ochs, Reference Ollagnier and Ochs1981). Average leaflet N concentrations were 2.33 %DM in Jambi and 2.66 %DM in Sintang (Figure 2). Average leaflet and rachis P concentrations were 0.146 and 0.064 %DM in Jambi, and 0.17 and 0.062 %DM in Sintang, respectively (Figure 2). For the whole sample, 16% of plantations were considered adequate in both N and P; 20 and 24% were specifically deficient in N and P, respectively; and the remaining 39% were deficient in both (Figure 2). Average K concentrations in the pinnae and the rachis were 0.59 and 0.46 %DM in Jambi, and 0.60 and 0.50 %DM in Sintang (Figure 3). Pinnae Mg was high in both areas (0.39 %DM in Jambi; 0.28 in Sintang; Figure 3). The average TLC concentration was 86.2 (s = 15.1) in Jambi and 76.7 (s = 10.1) in Sintang. Leaf K and Mg relative to TLC are shown in Figure 4. While Mg relative to TLC was sufficient in all plantations in Jambi and 80% of the plantations in Sintang, for K less than 25% of the plantations in Jambi and 80% in Sintang was sufficient. For the complete sample, 18% of the plantations were adequate for both K and Mg; 71 and 2% were specifically deficient in K and Mg, respectively; and 8% were deficient in both. Soil Mg concentrations under the frond stack were significantly correlated with Mg concentrations in the leaf (r = 0.545**) and rachis (r = 0.527**) in Sintang.
Leaflet N and P concentrations in Sintang and Jambi. The diagonal line shows the critical P concentration at various N concentrations; the vertical line shows the average critical N concentration (Ollagnier and Ochs, Reference Ollagnier and Ochs1981).
Rachis (x-axis) and leaflet (y-axis) concentrations of P, K and Mg in Sintang and Jambi. Lines show the fixed critical levels below which a yield response to nutrient application would be expected (Foster and Prabowo, Reference Foster and Prabowo2006).

Concentrations of leaflet K, Mg and Ca as percentage of total leaf cation (TLC) concentration in Sintang and Jambi. The horizontal lines show the critical percentage for K and Mg below which a yield response to nutrient application would be expected (Foster, Reference Foster, Fairhurst and Härdter2003).

Relationship between tissue nutrients and vegetative growth
Using PCA, we extracted a single vegetative growth component, after which we ran a regression analysis with the vegetative growth component as the dependent variable, and palm age, location, and tissue nutrient concentrations as the independent variables (Equation 3). The results from the regression analysis are shown in Supplementary Table S1 (available online at https://doi.org/10.1017/S0014479718000182). The full model explained 64% of the variation in vegetative growth, while 56% of the variation was explained by a reduced model, including location and palm age (squared), only (data not shown). There was a highly significant positive effect of plantation age on yield, but plantation age squared had a significant negative effect. With regards to the tissue nutrients, we found a significant positive effect of rachis P and a significant negative effect of the leaf K–Mg–Ca interaction component, but not the individual leaf K, Mg and Ca components, on vegetative growth. None of other tissue nutrient effects was significant.
Leaf area development
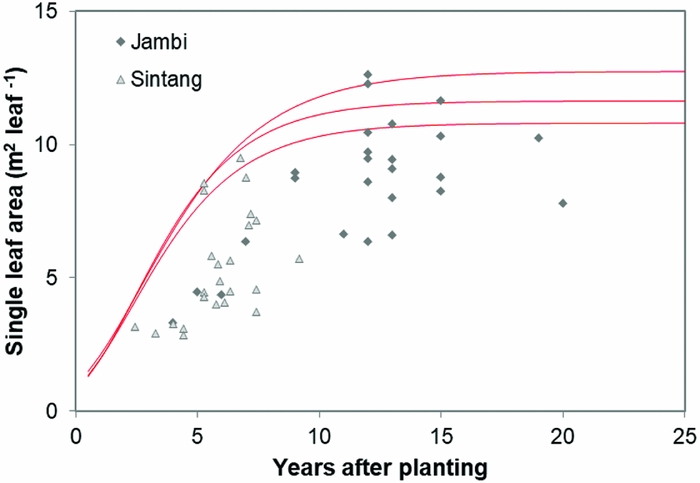
Leaf area, as a function of palm age, is shown in Figure 5. The dashed line shows the modelled results following Gerritsma and Soebagyo (Reference Gerritsma and Soebagyo1999). In 42 out of the 49 plantations in our sample, the measured leaf area was less than the smallest modelled leaf area (Figure 5), with the remaining seven plantations showing a larger leaf area.
Leaf area in relation to years after planting in Sintang and Jambi. The red curves show potential leaf area development of three cultivars reported by Gerritsma and Soebagyo (Reference Gerritsma and Soebagyo1999).
Yield
Estimated yearly yields in Sintang (n = 19) were 5–30 t fruit bunches ha−1, with an average yield of 14 t fruit bunches ha−1 year−1. Estimated yearly yields in Jambi were 21, 15, and 13 t fruit bunches ha−1 year−1 on mineral soils (n = 15), mixed soils (n = 5), and peat soils (n = 12), respectively. Vegetative growth and yield were significantly positively correlated in Sintang (r = 0.728***) and in Jambi (r = 0.460*). There was no correlation between yield and palm age.
DISCUSSION
Nutrient deficiencies in the smallholder plantations in our research areas were severe, especially in Jambi. The farmers strongly relied on NPK Ponska for the nutrition of their plantations, but did not supplement with the necessary straight (single nutrient) fertilisers (especially K). The average N application in Sintang was within the recommended range (140–210 kg ha−1 year−1; Rankine and Fairhurst, Reference Rankine and Fairhurst1999) and larger than the average N application used in a sample of 21 plantation companies in Indonesia (141 kg ha−1 year−1; Van Noordwijk et al., Reference van Noordwijk, Khasanah and Dewi2017). In Jambi, the farmers applied less N than required; applications were about half those in Sintang. Average P applications were double the recommended rate (10–12 kg ha−1 year−1; Rankine and Fairhurst, Reference Rankine and Fairhurst1999) in Jambi, and four times the recommended rate in Sintang. Average K applications were only 50–60% of what is recommended (140–175 kg ha−1 year−1; Rankine and Fairhurst, Reference Rankine and Fairhurst1999). The nutrient applications in our research areas were similar to those reported by Euler et al. (Reference Euler, Hoffmann, Fathoni and Schwarze2016b), who conducted a survey among 236 smallholder farmers in Jambi, and concluded that only 15, 1 and 3% of farmers used straight K, Mg and B fertilisers. A study from Comte et al. (Reference Comte, Colin, Grunberger, Whalen, Widodo and Caliman2015) in a 19.6 km2 plasma area in Riau reports that farmers applied 40–75 kg ha−1 yr−1 N, 17–27 kg P and 20–40 kg K, on average, which is somewhat less than what farmers used in our research areas.
In oil palm plantations, nutrients and organic matter accumulate in the top soil and decline with soil depth, and active roots are mostly found in the top 40 cm of the soil (Fairhurst, Reference Fairhurst1996). Throughout the plantation, different soil zones can be discerned; apart from the palm circle and the frond stack, there is usually a harvesting path (around 8% of the surface) and a ‘remaining’ area (around 60%) that can be either bare or covered with weeds (Fairhurst, Reference Fairhurst1996). In mature plantations the areas outside the circle are colonised by the palm roots (Foster and Dolmat, Reference Foster and Dolmat1986) but do not receive large nutrient inputs from fertilisers or organic material. We collected samples only in the circle and under the frond stack, which probably means we overestimated the total soil nutrient pool when extrapolating to the other soil zones (Fairhurst, Reference Fairhurst1996; Foster and Dolmat, Reference Foster and Dolmat1986). In Sintang, samples were collected at 5‒10 and 25‒30 cm depth, but not from the complete rooting zone. At these depths soils were poor in nutrients, especially under the frond stack. In the circle, N and P fertilisers were regularly applied, leading to increased soil acidification and increased nutrient concentrations. We observed strong correlations between SOC and soil nutrient concentrations, probably because the soils were inherently poor and a relatively large part of the nutrients was supplied by the soil organic matter. Due to the young age of most plantations in Sintang and the lack of pruning, there was no difference in the SOC content between the circle and the frond stack (Haron et al., Reference Haron, Brookes, Anderson and Zakaria1998).
In Jambi, the complete rooting zone was sampled, showing that the soils were particularly rich in exchangeable Ca and Mg, which were strongly correlated. The correlations between soil pH, Mg and Ca can partly be explained by the regular application of Mg as dolomite (CaMg(CO3)2). The concentrations of P and K were much larger in the circle than under the frond stack, and the soil under the stack was poor in K.
A significant positive correlation between soil and tissue nutrient concentrations was found only for P (Sintang) and Mg (both areas), not for the other nutrients. This is in contrast with the strong correlations between soil and tissue K observed by Foster and Prabowo (Reference Foster and Prabowo2006). It is likely that rainfall conditions and the time elapsed since prior nutrient applications had a strong effect on soil nutrient concentrations, and contributed to the large variability and poor correlations between soil and tissue nutrients observed in both areas.
The leaflet N concentration in Jambi was often deficient (Figure 2), which probably suppressed the mobilisation of P from the reserve tissue into the leaflets (Foster and Prabowo, Reference Foster and Prabowo2006). The equation for calculating critical leaflet P concentrations (Equation 1) is valid in environments where N is non-limiting (Ollagnier and Ochs, Reference Ollagnier and Ochs1981). Alternatively, Rankine and Fairhurst (Reference Rankine and Fairhurst1999) proposed fixed critical values to determine if tissues are deficient, and Foster and Prabowo (Reference Foster and Prabowo2006) argued that the rachis P concentration is a much more reliable measure than leaflet P. When looking at rachis P, only four plantations in our sample were above the critical concentration of 1.0 %DM proposed by Foster and Prabowo (Reference Foster and Prabowo2006; Figure 3). The poor tissue P status is remarkable considering the over-application of P fertilisers relative to standard recommendations. In Jambi, where soils were rich in P but clayey (leading to high P sorption) and with low pH, the results of the Bray 2 test used routinely for soil testing in laboratories in Indonesia may not have provided a useful estimate of the amount of P available to the palms (Foster and Prabowo, Reference Foster and Prabowo2006). In Sintang, we found a significant correlation between soil and rachis P concentration, but rachis P deficiencies were still common despite large applications of P. Successful infection of oil palm roots with mycorrhiza can greatly enhance the uptake of P (Blal et al., Reference Blal, Morel, Gianinazzi-Pearson, Fardeau and Gianinazzi1990) but we do not have data on the mycorrhizal infection in our research sites.
Tissue nutrient concentrations are more indicative of nutrient deficiencies than soil nutrient concentrations, and often there is little relationship between the two (Goh, Reference Goh, Soon and Pau2005). In Jambi, leaf and rachis K concentrations were well below optimal in most of the plantations, and rachis K concentrations showed more severe deficiencies than leaflet concentrations (Foster and Prabowo, Reference Foster and Prabowo2006; Figure 3). We found significant negative correlations between circle and tissue K (both rachis and leaflets), which was unexpected (Foster and Prabowo, Reference Foster and Prabowo2006). We did not find significant correlations between tissue K and vegetative growth, although the positive effects of K on growth and yield have been shown in numerous randomised fertiliser trials (e.g. Ollagnier and Ochs, Reference Ollagnier and Ochs1981; Tohiruddin et al., Reference Tohiruddin, Prabowo, Tandiono and Foster2010). We speculate that the tissue K concentrations may have been so poor that any potential positive effects on growth were obscured by the variability between and within plantations. The effects of leaf Mg and leaf Ca on vegetative growth were negative, on average, but these effects were not significant (with p = 0.60 for leaf Ca). The negative effects may be related to the antagonism between K on the one hand and Ca and Mg on the other (Foster, Reference Foster, Fairhurst and Härdter2003; Ollagnier and Ochs, Reference Ollagnier and Ochs1981). Due to this antagonism, the inclusion of the three-way interaction term in the model was important, but the lack of significant main effects implies that the significant negative effect of the K*Mg*Ca interaction term on vegetative growth needs to be interpreted with caution. The results may confirm the interdependence between the cations (Foster, Reference Foster, Fairhurst and Härdter2003) as well as their important role in palm nutrition (Foster and Prabowo, Reference Foster and Prabowo2006), but no definitive conclusions can be drawn. For all nutrients, the variability between plantations was large, and the sample size was relatively small. In addition, it was unclear when fertiliser had most recently been applied (as farmers did not keep records), which may have contributed to the large variability. In Sintang, particularly, the number of sampled palms per field was quite small, which decreased the reliability of the sampling results. Because of these issues, it is not possible to draw definitive conclusions about the relationship between nutrient deficiencies and vegetative growth based on the existing dataset. We can only conclude that nutrient deficiencies in the palm tissue were pervasive, and that vegetative growth was less than optimal in most plantations.
In order to estimate the yield performance of the smallholders in our sample, water-limited potential yields (Yw; Woittiez et al., Reference Woittiez, van Wijk, Slingerland, van Noordwijk and Giller2017) were estimated based on yields from best-performing fields in similar soil and climatic conditions: 30–35 t fruit bunches ha−1 year−1 on mineral soils in Sumatra (Tohiruddin et al., Reference Tohiruddin, Prabowo and Foster2006), and 23–25 t fruit bunches ha−1 year−1 on deep peat soils, provided that the water table is properly managed (Othman et al., Reference Othman, Mohammed, Darus, Harun and Zambri2011). We conservatively estimated Yw at maturity to be 30 t fruit bunches ha−1 year−1 on mineral soils, 22 t fruit bunches ha−1 year−1 on deep peat soils, and 25 t fruit bunches ha−1 year−1 on mixed soils, for palms of 7–18 YAP in Jambi (Euler et al., Reference Euler, Hoffmann, Fathoni and Schwarze2016b). In Sintang, Yw was estimated to increase linearly from 8 t fruit bunches ha−1 year−1 at 3 YAP to 30 t fruit bunches ha−1 year−1 at 7 YAP. Yields achieved by the respondents were mostly well below Yw, with only seven out of 51 farmers reporting yields at or above Yw. Average yields in Sintang and Jambi were 50–60% of Yw and 60–70% of Yw, respectively, taking into account the different soil types (data not shown). These numbers must be viewed with caution, as farmers did not keep yield records, and estimates may not have been accurate and were based on a single year.
Other issues apart from plant nutrition probably contributed to the poor yields in our research areas. In both areas, regular flooding of part of the plantations occurred during the rainy season (data not shown). Poor planting material was also a major problem, as we found dura (thick-shelled) palms in almost 50% of the plantations in Sintang, and in >80% of the plantations in Jambi. While dura palms are equal to tenera (thin-shelled) in terms of fruit bunch yield (Corley and Lee, Reference Corley and Lee1992), the concentration of N, P and K in tenera bunches is higher and therefore the removal of nutrients with dura bunches is significantly decreased compared with tenera (Prabowo and Foster, Reference Prabowo and Foster2006). It is unclear to what extent this difference has affected the nutrient concentrations in our sample plantations.
CONCLUSIONS
Fertiliser application practices in the sampled plantations were often poorly aligned with crop needs, and the palms were particularly deficient in K, and, to a lesser extent, in P and N. The nutrient deficiencies, in turn, probably led to reduced vegetative growth, which was below optimal in 41 out of 49 plantations. Clear direct relationships between tissue nutrient status and vegetative growth could be identified only for rachis P, and a larger sample size is required. Yields were estimated to be 50–70% of the potential, indicating a large scope for intensification. The key challenge for the smallholders in our sample appears to be the application of nutrients in the right balance, which is important for both productivity and environment. If Indonesia is to achieve its goal of increasing the sustainability of the oil palm sector, then the widespread nutrient deficiencies that we observed need to be corrected. Farmers’ knowledge and preferences, as well as fertiliser costs and availability, play a role in the farmers’ management decisions. Improved nutrient management, in terms of fertiliser type, quantity and placement, could probably lead to large increases in yield, yet the prevalence of other constraints such as poor planting material may limit the profitability of investments in fertilisers. On-farm experiments in a wide range of conditions, and with regular sampling and accurate yield recording, are urgently required to come up with relevant and effective intervention strategies, and to provide oil palm smallholders with targeted recommendations for proper nutrient management.
Acknowledgements
This research was funded by Wageningen University, The Dutch Development Organization (SNV World) and K+S Kali GmbH (Germany). SNV and K+S Kali played no role in the collection, analysis and interpretation of data, in the writing, nor in the decision to publish. Laurie van Reemst contributed to the data collection in desa Ramin, and Joost van Heerwaarden and Evert-Jan Bakker assisted with the statistical analysis. We would like to thank all farmers, NGO staff, extension workers, Ristekdikti, and other people involved for their enthusiastic contributions.
SUPPLEMENTARY MATERIAL
To view supplementary material for this article, please visit https://doi.org/10.1017/S0014479718000182


 Open access