


Introduction
Agriculture and food production contribute prominently to global warming, accounting for one-third of human-caused greenhouse gas (GHG) emissions worldwide (Gilbert Reference Gilbert2012). This portion is slightly lower in the United States (10–30 percent of the total emissions) (Center for Sustainable Systems 2020; US EPA Reference US EPA2020). Given the challenges of implementing a nationwide carbon tax policy or a cap-and-trade program in the United States, private for-profit and nonprofit organizations have explored other avenues for decreasing carbon emissions,Footnote 1 for example, by targeting agricultural carbon emissions. Recently, a newly launched program called Restore CaliforniaFootnote 2 offers restaurants the opportunity to participate in lowering agriculture and food carbon emissions. Restaurants can opt into this program and add an optional one-percent charge to every customer bill. The money gathered goes to farmers who practice sustainable farming that removes carbon from the atmosphere. In general, such programs provide farmers the necessary financial support to reduce the environmental impact of the agricultural sector and adapt their food production system to cope with environmental constraints and climate change.
Evidence of individuals’ willingness-to-pay (WTP) for a carbon emission reduction program similar to the one implemented by the Restore California program is important, given that approximately 15 percent of food-related carbon emissions pass through restaurants (Kling and Hough Reference Kling and Hough2010). It also demonstrates the feasibility of leveraging consumer contribution to provide non-negligible funds in support of sustainable farming and agricultural carbon reduction. Assuming that all restaurants had collected a 1 percent donation to offset food-related carbon emissions in 2019, and assuming that a carbon offset price of US$100 per metric tonnes of carbon—equivalent to the high-end price that the High-Level Commission on Carbon Prices (World Bank Reference World Bank2021) reports is necessary by 2030 to achieve the temperature goal of the Paris Agreement—2019 restaurant sales in the US ($851 billion) could have generated about 85 million metric tonnes of CO2 equivalent offsets (USDA-ERS Reference USDA-ERS2020) or about 12.5 percent of annual emissions from agriculture in the United States (EPA 2020). This total would approximately double if a similar donation were also collected for food consumed at home (USDA-ERS Reference USDA-ERS2020). Our study aims to fill the existing literature gap in this area by assessing the public's WTP to fund programs to reduce agricultural carbon emissions. Specifically, we measure people's WTP to reduce carbon emissions through an optional surcharge on their restaurant check. The results provide important insight where governmental agencies and nongovernmental organizations seek agricultural carbon emission mitigation by way of voluntary contribution.
Previous studies in behavioral economics have shown the importance of contextual and social factors, also known as nudges, to individual decision-making (e.g., Kahneman Reference Kahneman2003; Leiser, Azar, and Hadar Reference Leiser, Azar and Hadar2008; Kesternich, Reif, and Rübbelke Reference Kesternich, Reif and Rübbelke2017). The connection and interaction between behavioral economics and environmental economics have been extensively investigated (Croson and Treich Reference Croson and Treich2014), with many studies exploring how nudges alter individual behaviors contextually rather than cognitively (Gowdy Reference Gowdy2008; Shogren, Parkhurst, and Banerjee Reference Shogren, Parkhurst and Banerjee2010; Carlsson and Johansson-Stenman Reference Carlsson and Johansson-Stenman2012; Croson and Treich Reference Croson and Treich2014). Although there is robust evidence on the significant effect of default settingsFootnote 3 in the applied economics literature (e.g., Thaler and Sunstein Reference Thaler and Sunstein2009), only a few studies have investigated the impact of default bias on individual environmentally related behavior like carbon offsetting program participation (Löfgren et al. Reference Löfgren, Martinsson, Hennlock and Sterner2012; Araña and León Reference Araña and León2013), green utility choice (Pichert and Katsikopoulos Reference Pichert and Katsikopoulos2008), and food waste reduction (Kallbekken and Sælen Reference Kallbekken and Sælen2013).
We contribute to the literature by testing how “defaults” influence individuals’ participation in a voluntary restaurant surcharge program to reduce agricultural carbon emissions. Specifically, a group of respondents is randomly selected and asked if they would be willing to add the surcharge to the final bill amount. For the rest of the respondents, the surcharge is automatically added, but they can choose to remove it. Given the diversity in public opinion regarding the impact of carbon emissions and climate change, we test whether providing information on carbon emissions and climate change during the survey affects respondents’ WTP.
Environmental issues are strongly correlated with individuals’ moral feelings, consequently affecting their consumption behaviors. Given the tight connection between environment, psychology, and behavior, a growing number of studies demonstrate that consumers’ profiles, including their environmental attitude (e.g., Kotchen and Reiling Reference Kotchen and Reiling2000; Meyerhoff Reference Meyerhoff2006), time preferences (e.g., De Marchi et al. Reference De Marchi, Caputo, Nayga and Banterle2016), and personalities (e.g., Grebitus, Lusk, and Nayga Reference Grebitus, Lusk and Nayga2013; Boyce, Czajkowski, and Hanley Reference Boyce, Czajkowski and Hanley2019), significantly affect their environmental behaviors. Specifically, pro-environmental attitudes affect sustainable food consumption (FAO 2016). We contribute to this strand of literature by analyzing heterogeneity in individuals’ WTP across different personal characteristics. In particular, we measure respondents’ environmental preferences by the revised New Environmental Paradigm (NEP) (Dunlap and Van Liere Reference Dunlap and Van Liere2008), time preferences by the Consideration of Future Consequences (CFC) scale (Strathman et al. Reference Strathman, Gleicher, Boninger and Scott Edwards1994), and personality traits by the Midlife Development Inventory (MIDI) scale (Lachman and Weaver Reference Lachman and Weaver1997).
The concept of climate change and the potential benefits and costs of GHG emission reduction policies have been central to political debate in the past decade. Political party affiliation has been found to significantly affect individuals’ WTP for climate change policies (Kotchen, Boyle, and Leiserowitz Reference Kotchen, Boyle and Leiserowitz2013). We examine the influence of political ideology on WTP.
This article contributes to several strands of the literature. First, to the best of our knowledge, this is the first study assessing consumers’ WTP to support agricultural carbon reduction through an optional restaurant surcharge. Unlike previous studies that mostly focused on how individual dietary changes can lower carbon emissions (Weber and Scott Matthews Reference Weber and Scott Matthews2008; Heller and Keoleian Reference Heller and Keoleian2015; Aleksandrowicz et al. Reference Aleksandrowicz, Green, Joy, Smith and Haines2016; Heller et al. Reference Heller, Willits-Smith, Meyer, Keoleian and Rose2018), our study focuses on surcharges to restaurant transactions, through which approximately 15 percent of food-related carbon emissions are channeled (Kling and Hough Reference Kling and Hough2010) and which could be leveraged to more easily pass on the costs of agricultural carbon reduction to consumers. By measuring consumers’ WTP and analyzing their heterogeneous responses, our study provides a general understanding of the extent to which the public supports voluntary carbon emission reduction programs and, in turn, offers essential information for policymakers to maximize the impact of these foodprint reduction programs.
Overall, our findings suggest that such a program could transfer a meaningful amount of the food-carbon reduction burden to consumers that farmers currently shoulder. Our results indicate that about a third of the sample is willing to pay the highest restaurant surcharge asked of them, while just under half are not willing to pay any surcharge. When considering all respondents who are willing to pay at least some surcharge amount, those willing to support offsetting food-related carbon emissions constitute a majority. Given the noted correlations between environmental attitudes and behaviors, it is likely that individuals with a high WTP for a restaurant surcharge would also share a high willingness to support other political actions toward the same goal.
Second, we contribute to the literature by examining the potential interaction of behavioral and environmental factors (Shogren, Parkhurst, and Banerjee Reference Shogren, Parkhurst and Banerjee2010; Kesternich, Reif, and Rübbelke Reference Kesternich, Reif and Rübbelke2017). When top-down policies are not effective given the environmental good's public-good nature, voluntary actions at the individual level are crucial to achieving environmental protection goals (Kesternich, Reif, and Rübbelke Reference Kesternich, Reif and Rübbelke2017). Consequently, learning how to effectively and efficiently incentivize individual voluntary actions is important. We demonstrate how contextual factors affect consumer valuations of environmental goods like carbon reduction programs. Specifically, our results indicate that individuals have a higher WTP when the surcharge is automatically added to restaurant checks. In other words, the default option, that is, when individuals have to opt out of a payment that is already included, has a larger impact on valuation than the opt-in situation when respondents are asked if they will apply the additional surcharge. This adds to the mounting evidence that carefully structured default options can cost-effectively influence behavior. We also find that a short climate change script significantly increases WTP, indicating how important it is to provide relevant information to promote environmental policy. Our results provide insight into what appropriate low-cost incentives governments can leverage to form a robust basis for environmental policymaking.
Third, we demonstrate how certain individual characteristics affect consumers’ WTP. Our results show that individuals’ age, ethnicity, average check per person of their last month's restaurant visits, economic views, environmental attitudes, and time preferences are important for understanding the differences in WTP. Specifically, older individuals have a lower WTP. The less economically conservative and more environmentally aware consumers are, the more likely they are to be willing to pay for carbon emission reduction programs. Future-oriented individuals tend to have a high WTP, while present-oriented ones have a low WTP. Individuals who have visited high-end restaurants and paid large average check per person in the past month have a high WTP. We further investigate the heterogeneity in the treatment effects across subsamples. We find that the impact of default and information nudges is heterogeneous across subsamples stratified by consumers’ age, environmental awareness, economic view, and average check per person of restaurant visits in past months.
One limitation of our study is that an optional surcharge payment is fundamentally voluntary. Voluntary donations may be perceived as a lack of coerciveness and consequentiality due to free-riding and may be prone to upward bias (Carson and Groves Reference Carson and Groves2007). Thus, our marginal WTP numbers may be higher than true Hicksian compensating WTP and need to be interpreted with caution.
The present article is structured as follows. Section “Survey design and methods” describes the survey design and the methodological approach. Section “Empirical model” presents the methdology and empirical model. Section “Results and discussion” discusses the results. In the end, Section "Conclusion" offers principal conclusions.
Survey design and methods
Survey design
We conduct a stated-preference contingent valuation (CV) survey using double-bounded dichotomous choice (DBDC) questions to obtain U.S. consumers’ WTP. Compared with single-bounded dichotomous choice (SBDC) questions, DBDC questions reduce WTP variance and improve estimation statistical efficiency (Hanemann, Loomis, and Kanninen Reference Hanemann, Loomis and Kanninen1991).Footnote 4
Our survey, administered electronically through Qualtrics in September 2019, took on average approximately 25 minutes to finish. A set of prescreening questions—whether respondents are above 18 years old and whether respondents paid for food at a restaurant within the last 6 months—are asked so that only adults who have had dining experiences recently are surveyed. In the end, there were 1,177 complete and usable responses collected out of a total of 2,924 people who accessed the survey.Footnote 5 We registered our study with the AEA registry.Footnote 6
Table 1 presents the respondents’ demographics along with the demographics of the adult population in the United States. The z-scores obtained from one-sample proportion tests indicate that our survey sample has similar income distribution and racial composition as the U.S. population, while the age, marital status, and education distributions of our sample differ from the U.S. population. Specifically, our survey sample is younger and contains people who are more likely to be married and have a high school degree. It is well known that lower-income individuals who are less educated and older (age 65 and older) are generally underrepresented among web surveys because of their lack of access to the Internet (Pew Research Center, n.d.). Depending on the direction of the relationship between WTP for restaurant surcharge and age, marital status, and education, our WTP estimates may have an upward or downward bias.
Demographic distributions of survey participants (n = 1,117) and the 2018 U.S. population
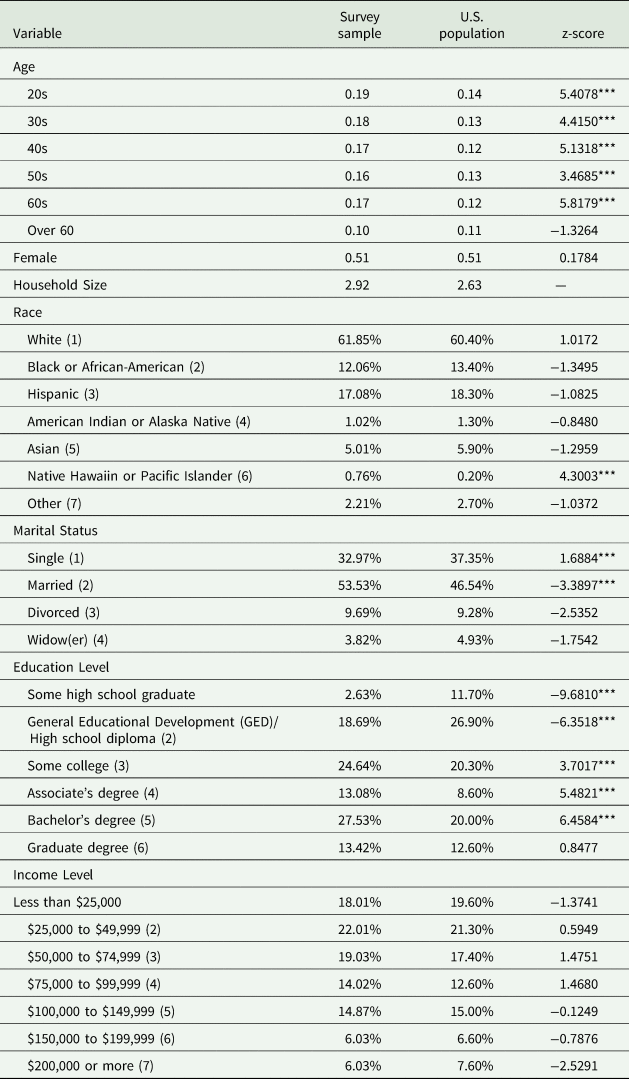
Note: This table presents the demographic distributions for the survey sample and the U.S. population. The U.S. population data source: U.S. Census American Community Survey—one year estimate of 2018. The z-scores are obtained from one sample proportional test. *** p<0.01, ** p<0.05, * p<0.1.
It is important to clearly present the mechanism of changes and changes to be valued to enhance the validity of the stated preference estimates (Johnston et al. Reference Johnston, Boyle, Adamowicz, Bennett, Brouwer, Cameron and Michael Hanemann2017). We have respondents read detailed background information on how the surcharge can help reduce agriculture and food carbon emissions at the beginning of the survey.Footnote 7
To ensure the validity and reliability of the value estimates in a hypothetical environment, WTP questions need to be incentive compatible, denoting the mechanism in which survey participants have the incentive to reveal true private information, and it is a dominant strategy to do so (Hanemann, Loomis, and Kanninen Reference Hanemann, Loomis and Kanninen1991; Carson and Groves Reference Carson and Groves2007; Vossler, Doyon, and Rondeau Reference Vossler, Doyon and Rondeau2012). In particular, participants must perceive that their responses will affect policy implementation (policy consequentiality) and their payment will be collected upon the policy implementation (payment consequentiality). We incorporate a policy consequentiality script in the questionnaire introduction to reduce hypothetical bias and elicit truthful answers to survey questions. To further mitigate hypothetical bias, we include a cheap-talk script. Previous literature has shown that including a cheap-talk script in a CV survey can be an effective way to mitigate the hypothetical biasFootnote 8 (Lusk Reference Lusk2003; Silva et al. Reference Silva, Nayga, Campbell and Park2011). It is worth noting that a cheap-talk script operates by reminding subjects of the nonconsequentiality (hypothetical nature) of the survey instrument, which can offset the effect of a consequentiality script. The best practice is to use either a cheap-talk script or a consequentiality script.
The CV question used to elicit consumers’ WTP for restaurant surcharge read:
-
Consider that you are dining out at a restaurant and you have the option to add a surcharge to your check to help reduce the carbon and groundwater foodprint.
-
Are you willing to add/keep a surcharge of x% when you dine out at a restaurant in order to help reduce the carbon and groundwater foodprint?
Depending on the respondents’ answers in this first question (i.e., yes or no), the surcharge in the second choice goes up or down by 1 percent. For example, if the respondent was asked if she/he is willing to add a surcharge of 2 percent in the first question and selected “yes” (no), she/he will then be asked if she/he is willing to add a surcharge of 3 percent (1 percent) in the follow-up question. We enforce monotonicity with the surcharge. For example, if a respondent selected “yes” for a 3 percent surcharge, we assume that they agree to a 2 percent surcharge. To avoid a starting-point bias, we use 2 percent, 4 percent, 6 percent, 8 percent, and 10 percentFootnote 9 as starting values and randomly assigned them to respondents. The complete survey is provided in the Supplementary Appendix.
MINDSPACE framework treatments
Recent behavioral economics studies indicate that people's stated preferences toward environmental policies differ in response to variations in choice architecture and frame (Gowdy Reference Gowdy2008; Carlsson Reference Carlsson2010; Shogren, Parkhurst, and Banerjee Reference Shogren, Parkhurst and Banerjee2010; Shogren Reference Shogren2012). Altering the presentation of public policies and relevant information is a cost-effective strategy to change individual behavior and improve social welfare. It is, therefore, important to consider how choice and information presentation can influence individual decisions when there is an option to reduce carbon emissions through restaurant surcharges.
Dolan et al. (Reference Dolan, Hallsworth, Halpern, King, Metcalfe and Vlaev2012) categorize the nine most robust effects on behavior and derive the MINDSPACE framework. Many studies in environmental and resource economics have analyzed the effectiveness of adopting these instruments as policy tools (Palm-Forster et al. Reference Palm-Forster, Ferraro, Janusch, Vossler and Messer2019), but only a few have tested the “defaults” nudge (e.g., Pichert and Katsikopoulos Reference Pichert and Katsikopoulos2008; Araña and León Reference Araña and León2013; Brown et al. Reference Brown, Johnstone, Haščič, Vong and Barascud2013). We examine how “defaults” affect individual choices when there is an option for carbon emission reduction through restaurant surcharges. In our survey, respondents are asked to decide to pay or not pay for a restaurant surcharge to contribute to foodprint reduction. Questions are framed in two different ways and randomly assigned to respondents. In one of them, we ask respondents if they would be willing to add the surcharge to the final bill amount (i.e., opt in). In the other, the surcharge is automatically added to the bill, but the respondent is given the option to remove it (i.e., opt out).
Information treatment
Understanding how information affects individuals’ responses is important in the use of stated preference techniques to estimate the demand for environmental goods with nonuse values, given that respondents do not have clear prior references. A large amount of literature has confirmed that changes in the level and types of information provided to respondents increase the variation in choices (Bergstrom, Stoll, and Randall Reference Bergstrom, Stoll and Randall1990; DeShazo and Fermo Reference DeShazo and Fermo2002; Hoehn and Randall Reference Hoehn and Randall2002). While there is a consensus that pre-existing information a subject holds prior to a survey is correlated with their stated valuation (Cameron and Englin Reference Cameron and Englin1997; Loomis and Ekstrand Reference Loomis and Ekstrand1998; Tkac Reference Tkac1998; Needham et al. Reference Needham, Czajkowski, Hanley and LaRiviere2018), the information provided during a survey has been found to both affect and not affect WTP (Needham et al. Reference Needham, Czajkowski, Hanley and LaRiviere2018). We test whether providing extra information regarding climate change during our survey has an impact on respondents’ valuations for carbon reduction programs. To do so, an information treatment is randomly assigned to a group of respondents. The information given to these respondents is as follows:
“According to the U.S. Environmental Protection Agency, human activities contributed to almost all of the increase in greenhouse gases in the atmosphere over the last 150 years. Greenhouse gases trap heat in the earth's atmosphere and make the planet warmer. Higher temperatures lead to more frequent and more severe extreme weather events such as floods and droughts, other natural disasters such as hurricanes, and disturbed ecosystems.”
Environmental preferences
To measure respondents’ environmental awareness and preference, we use the revised NEP developed by Dunlap et al. (Reference Dunlap, Van Liere, Mertig and Jones2000), containing a total of 15 7-point Likert scale items. The new NEP tests five aspects of environmental beliefs: the existence of limits to growth (1, 6, and 11), the vulnerability of nature's balance (3, 8, and 13), antianthropocentrism (2, 7, and 12), rejection of human's exemption from nature's constraints (4, 9, and 14), and the possibility of ecological crisis or catastrophe (5, 10, and 15) (see Supplementary Appendix Table A1).
We code the responses using numerical values ranging from 1 to 7, where stronger pro-environmental attitudes are given higher values. In doing so, negative statements (even-numbered) are coded as: “strongly agree”=1; “agree”=2; “somewhat agree”=3; “neither agree nor disagree”=4; “somewhat disagree”=5; “disagree”=6; “strongly disagree”=7. The order is reversed for positive (odd-numbered) statements. As a result, values for the NEP variable vary between 15 and 105. The average NEP score in our sample is 64.94 with a standard deviation of 12.78. The minimum NEP value of our sample is 25, while the maximum value is 98. Supplementary Appendix Table A1 shows the average percent distributions for each NEP item's responses.
Personality measurement
A growing body of literature in economics has demonstrated that personality can be considered as a standard socioeconomic variable and explains potential variations in individual economic decisions including valuations of environmental goods (Borghans et al. Reference Borghans, Duckworth, Heckman and ter Weel2008; Boyce, Czajkowski, and Hanley Reference Boyce, Czajkowski and Hanley2019). There is a consensus that, as one of the most widely accepted paradigms in personality research, the Five-Factor Model of personality traits (the “Big Five”) is an effective tool to measure individual personality traits, including Openness, Conscientiousness, Extraversion, Agreeableness, and Neuroticism (abbreviated as OCEAN). We also include Agency as a sixth personality trait, measuring an individual's self-confidence, assertiveness, and dominance (Lachman and Weaver Reference Lachman and Weaver1997; Grebitus, Lusk, and Nayga Reference Grebitus, Lusk and Nayga2013).
We use the MIDI scale to measure subjects’ personality traits (Lachman and Weaver Reference Lachman and Weaver1997). The MIDI scale includes a total of 30 adjectives to evaluate six personality traits. Each adjective is evaluated using a scale from 1 (not at all) to 4 (a lot) (see Supplementary Appendix Table A2 for the full list of adjectives). Aside from being one of the most commonly used personality measurement tools in social science studies, the MIDI scale is chosen because it is one of the briefest measurements of personality with the shortest list of items, offering simplicity and conciseness that saves survey-taking-time (Lachman and Weaver Reference Lachman and Weaver1997; Grebitus, Lusk, and Nayga Reference Grebitus, Lusk and Nayga2013). To compute the value of the six personality traits, we calculate the average of the adjective-groups measuring the respective personality trait. Supplementary Appendix Table A2 shows the mean value and standard deviation of each adjective and the mean values of the six personality traits.
Time preference measurement
Many economic studies have identified the importance of time preferences, defined as how individuals value future outcomes in the present decision (Frederick, Loewenstein, and O'Donoghue Reference Frederick, Loewenstein and O'Donoghue2002). High-time preference individuals are present-oriented, while their low-time preference counterparts are future-oriented. Many studies show that future-oriented individuals are more pro-environmental and have a greater environmental concern (McCollough Reference McCollough2010; Franzen and Vogl Reference Franzen and Vogl2013; Carmi and Arnon Reference Carmi and Arnon2014), are more likely to engage in environmentally friendly activities such as recycling (Ebreo and Vining Reference Ebreo and Vining2001), and opt for public transit instead of driving (Joireman, Van Lange, and Van Vugt Reference Joireman, Van Lange and Van Vugt2004). We hypothesize that future-oriented respondents, that is, those with lower discount rates, are more likely to participate in and value agricultural carbon emission reduction programs.
To assess time preferences, we use the Consideration of Future Consequences 14-item scale (CFC) developed by Strathman et al. (Reference Strathman, Gleicher, Boninger and Scott Edwards1994).Footnote 10 Survey respondents indicate how well each statement matches with their own characteristics on a scale from 1 (extremely uncharacteristic) to 7 (extremely characteristic) (see Supplementary Appendix Table A3 for the 14-item scale). Among the 14 items, seven are CFC-Future (CFC-F) subscale and representative of future-oriented thinking, while the rest are reverse-coded statements representing present-oriented thinking. To calculate each respondent's time preference score, we take an average of the future-oriented items to measure the CFC-F subscale and reverse-code the present-oriented items for the CFC-Immediate (CFC-I) subscale. The higher a person's time preference score is, the more he/she values the future against the present. Supplementary Appendix Table A4 shows the descriptive statistics of the CFC-I and CFC-F subscale scores.
Empirical model
Given the proven efficiency of a DBDC method compared with the SBDC method (Hanemann, Loomis, and Kanninen Reference Hanemann, Loomis and Kanninen1991), we employ the DBDC method to elicit individuals’ WTP, in which respondents are asked a sequence of questions that narrow down their WTP. Specifically, individuals’ WTP is modeled as the following linear function:

where X i is a vector of individual characteristics affecting their WTP, including demographics such as age, gender, race, income, education background, marital status, and household size and other individual factors including average check per person of restaurant visits in the past month, personality traits, time preferences, environmental awareness, and political and socioeconomic views. The treatment dummy variables indicating whether a respondent received information or default nudges are also included. μi is the error term for household i.
From our DBDC format questionnaire, we know that respondents’ answers belong to one of the four cases: (yes, yes), (yes, no), (no, yes), and (no, no). Based on these responses, if we assume that μi ~ N(0, σ2), the probability of respondents’ WTP in the given case is
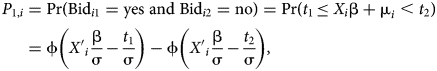

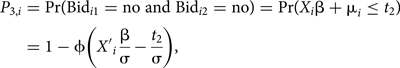

Following these probabilities, the likelihood function for all individuals in the sample is

where I j,i = 1 if the individual's response falls in the jth case, 0 otherwise. We then obtain parameter estimates of the likelihood function using maximum-likelihood estimation. The results from (6) identify factors significantly affecting WTP for the restaurant surcharge. Moreover, the average WTP can be computed based on (6) as
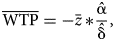
where $\bar{z}$ is the average values for the explanatory variables. $\hat{{\rm \alpha }}$
 is the value of the coefficients corresponding to the constants and $\hat{{\rm \delta }}$
 is the coefficient on the bid amount $\hat{{\rm \delta }}$
 .
.
Results and discussion
Baseline model results
Table 2 reports the summary statistics across the default and information treatments. Individual characteristics are similar for demographics, average check amount of the last month restaurant visits, personality traits, environmental awareness, time preferences, and political ideology and are well balanced across the treatment groups, suggesting the success of the randomization of respondents to the treatments. We also present the z-score (one sample proportional test for categorical variables) and t-statistics (t-test for continuous variables) in the table. As shown by the calculated statistics, there was almost no difference between default and nondefault treatment groups. The education levels and economic views differ slightly between information and no-information subsamples, but given that the treatment is randomly assigned, the differences are not systematic. As a result, such differences are unlikely to have an impact on our results.
Sample summary statistics [n (%) or mean ± St. Dev.] and z-score or t-statistics, overall and by treatment status
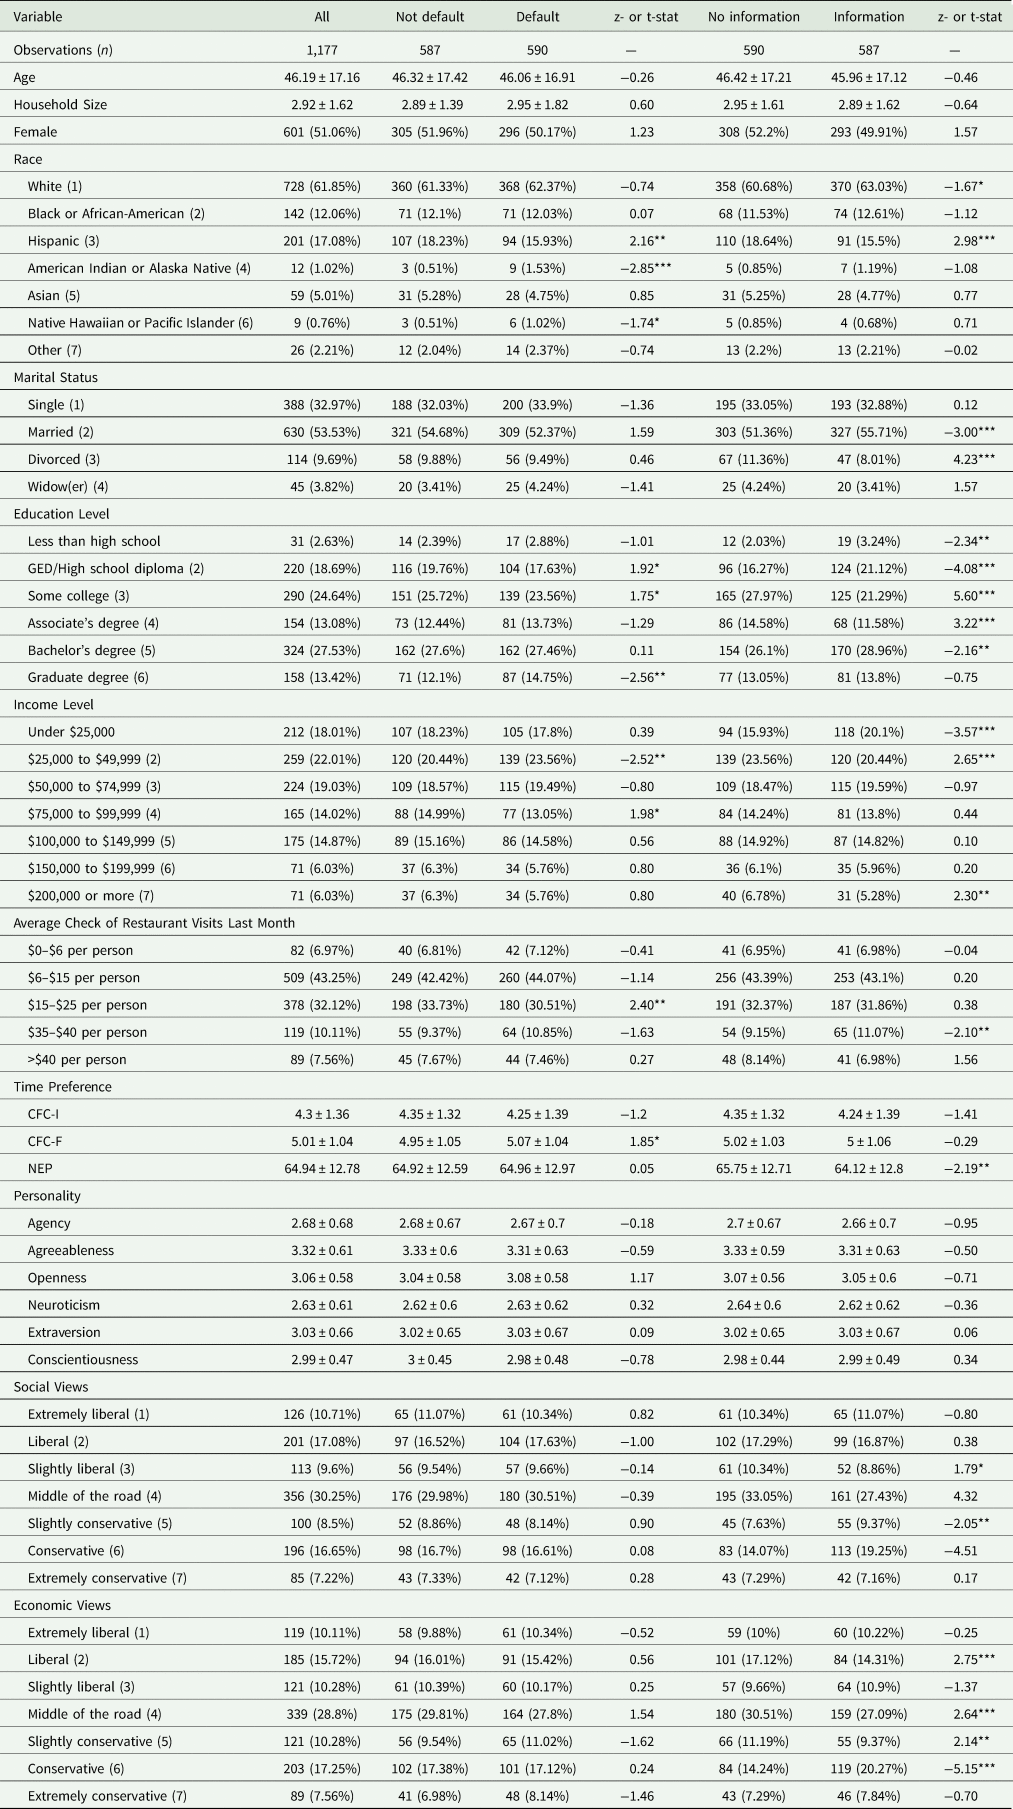
Note: This table presents the summary statistics [n (%) or mean ± St. Dev.] for the overall sample and by treatment status. We also compare the sample characteristics by treatments. For categorical variables such as race and education level, we conduct one-sample proportional tests and calculate the z-scores. For continuous variables such as age, we conduct t-tests to compare the sample mean across the treatment groups.
CFC-F, Consideration of Future Consequences-Future; CFC-I, Consideration of Future Consequences-Immediate; NEP, New Environmental Paradigm.
*** p < 0.01, **p < 0.05, *p < 0.1.
One concern is that respondents’ environmental preferences, time preferences, and personality may be correlated. Therefore, we calculate the correlations among these measurements. As shown in Table 3, most correlations are weak, while several personality measurements are correlated with each other. The highest correlation is between openness and extraversion personality measurements and is about 0.65.
Correlation matrix of the environmental preferences, time preferences, and personality traits
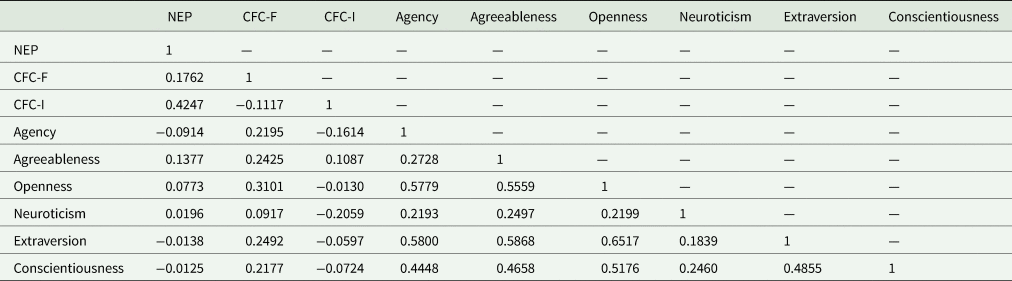
CFC-F, Consideration of Future Consequences-Future; CFC-I, Consideration of Future Consequences-Immediate; NEP, New Environmental Paradigm.
Table 4 presents the estimation results. Column (1) shows the results for the DBDC model with all the full set of control variables. Model estimates follow our expectations and largely agree with findings in the earlier literature. The coefficient on climate change information is positive and highly significant, indicating that receiving an information nudge with additional information on GHG emissions’ impact on climate during the survey increases WTP, which corroborates with findings in the earlier literature (Needham et al. Reference Needham, Czajkowski, Hanley and LaRiviere2018). Additionally, the opt-in condition of the default nudge significantly improves WTP.
Estimation results for the DBDC and SBDC WTP models with and without additional control variables (n = 1,117)
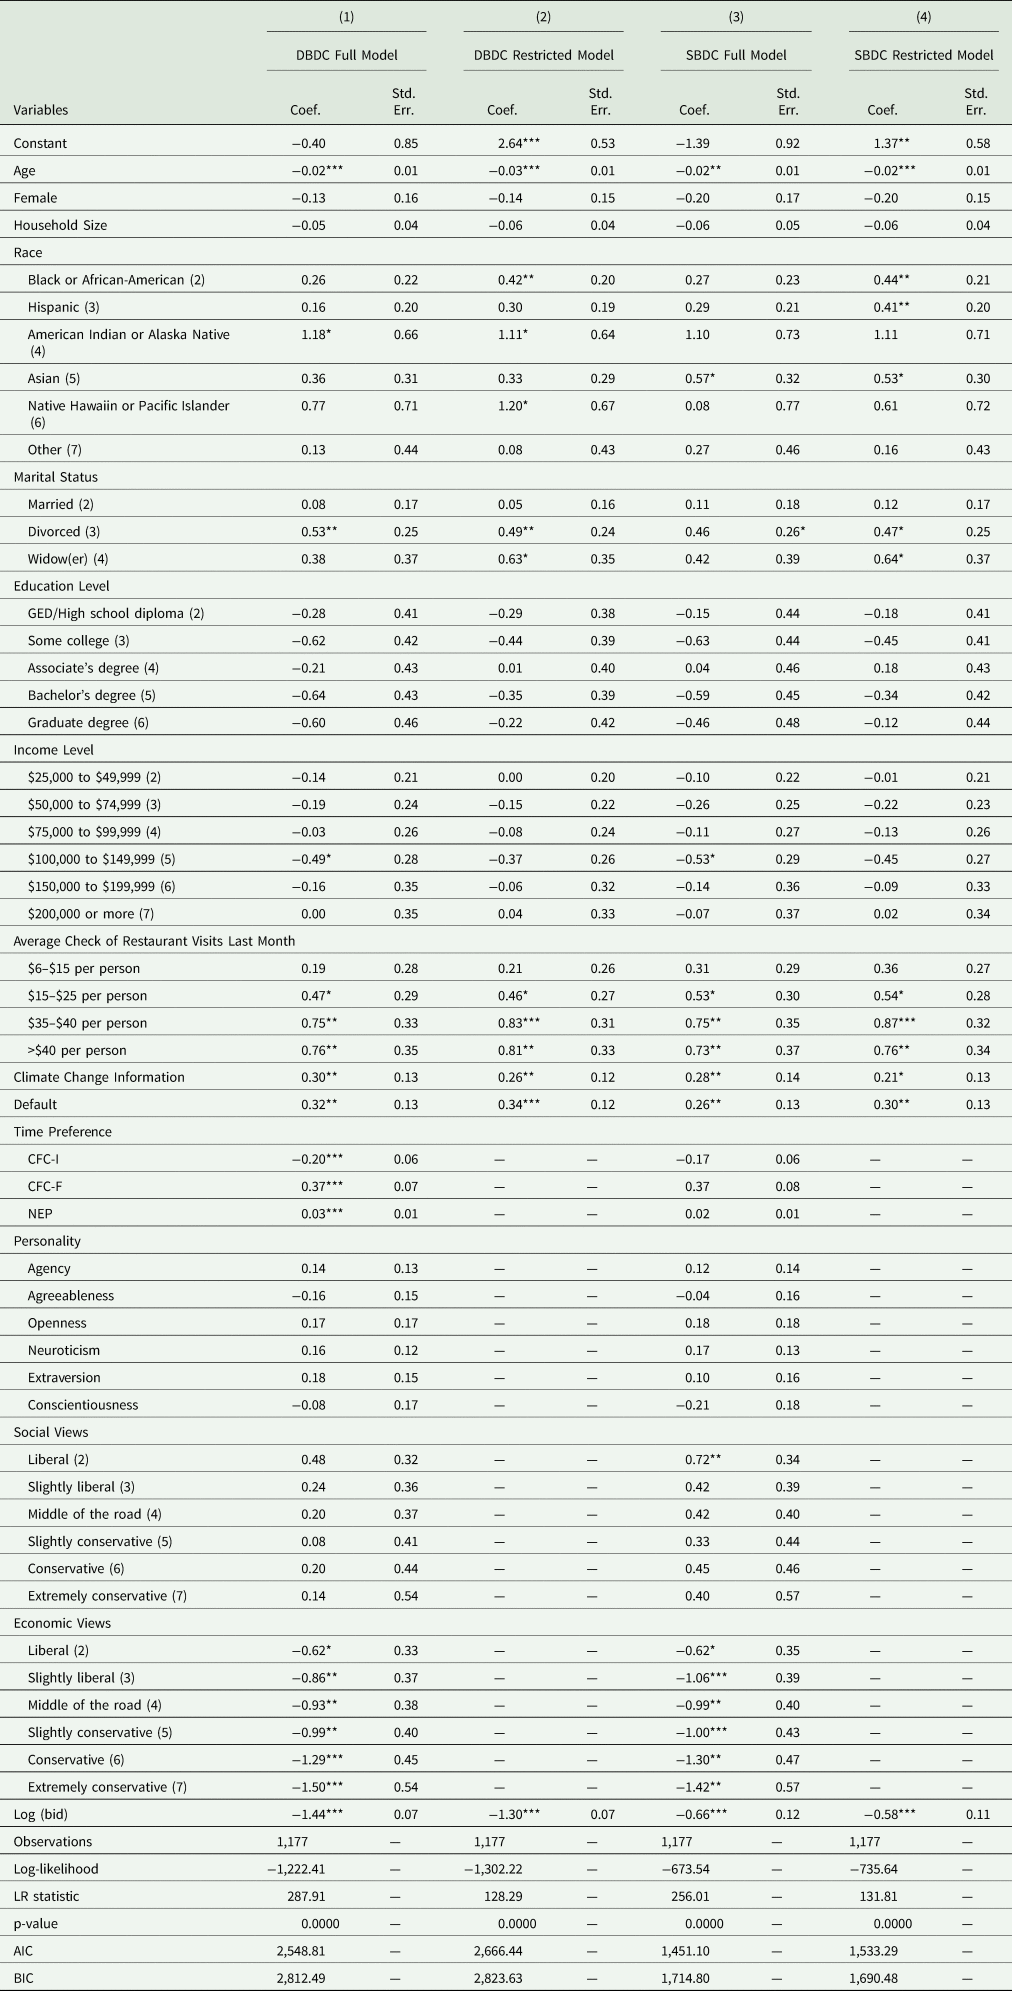
Note: This table presents the parameter estimates and standard deviations for the DBDC and SBDC WTP models with and without environmental preferences, time preference, personalities, social views, and economic views variables (n = 1,117). Specifically, Columns (1) and (2) present the DBDC full and restricted model results. Columns (3) and (4) present the SBDC full and restricted model results.
DBDC, double-bounded dichotomous choice; SBDC, single-bounded dichotomous choice; WTP, willingness to pay; CFC-F, Consideration of Future Consequences-Future; CFC-I, Consideration of Future Consequences-Immediate; NEP, New Environmental Paradigm. LR, Likelihood Ratio. AIC, Akaike information criterion. BIC, Bayesian information criterion.
*** p < 0.01, **p < 0.05, *p < 0.1.
We also find that several individual-specific characteristics significantly affect consumers’ WTP for restaurant surcharges. On average, young consumers are more willing to pay a restaurant surcharge in support of carbon emission reduction. It could be that younger respondents are willing to pay more because they are more likely to experience the negative consequences of carbon emissions and climate change than older respondents. Divorced individuals are more willing to pay for surcharge than single individuals. Given that our survey sample is younger and contains people who are more likely to be married on average than the general population, our WTP estimates may have an upward bias. WTP decreases as individuals become more conservative in terms of economic-political orientation, though social conservatism does not have a significant effect.
Similar to findings in earlier studies (e.g., Kotchen and Reiling Reference Kotchen and Reiling2000), consumers with high environmental awareness are more likely to take action to protect the environment and be willing to pay for foodprint reduction. Furthermore, time preferences significantly affect individuals’ WTP, similar to earlier findings (e.g., De Marchi et al. Reference De Marchi, Caputo, Nayga and Banterle2016). Specifically, present-oriented individuals with high CFC-I scores have a considerably lower WTP, while future-oriented individuals have a higher WTP.
Environmental preferences, time preferences, personality, social views, and economic views variables can be potentially endogenous. As a robustness check, we estimate the DBDC model when these variables are excluded. The default and information treatments remain highly significant with similar magnitude as in the full control model, indicating that our results are robust.
As another robustness check, we also estimate respondents’ WTP using a SBDC model using the response data from only the first WTP question. Columns (3) and (4) present results of the SBDC model with and without additional controls. Coefficients for the information and default treatments are highly significant and, therefore, robust. Parameter estimates of age, marital status (i.e., divorced), and the average check of restaurant visits last month stay significant across all the model specifications as well.
Based on the estimation results of the DBDC and SBDC models, we calculate respondents’ WTP (see Table 5). The WTP estimates from the SBDC model are slightly higher than those from the DBDC model, consistent with conclusions drawn in the existing literature (e.g., Bateman et al. Reference Bateman, Langford, Jones and Kerr2001; Whitehead Reference Whitehead2002), though not significantly different.
Estimated mean and median WTP with 95 percent confidence interval (in parenthesis) for the full sample and the four treatment groups
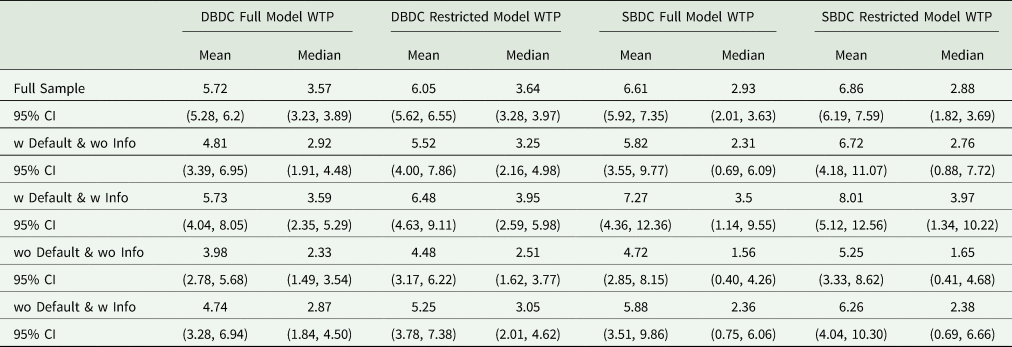
Note: This table presents the estimated mean and median WTP (percentage) with 95 percent confidence intervals (in parenthesis) for the full sample and the four treatment groups. The 95 percent confidence intervals are calculated using the Krinsky and Robb simulation (Krinsky and Robb Reference Krinsky and Robb1986, Reference Krinsky and Robb1990). To calculate the mean and median WTP, all the continuous and ordered categorical independent variables are held at the median, and all the nonordered categorical independent variables are held at the mode.
DBDC, double-bounded dichotomous choice; SBDC, single-bounded dichotomous choice; CI, confidence interval; WTP, willingness to pay.
Here, we focus our discussion on the results of the restricted DBDC model. The adjusted truncated mean estimated WTP is a 6.05 percent restaurant surcharge in support of carbon reduction programs.Footnote 11 The Krinsky and Robb simulation (Krinsky and Robb Reference Krinsky and Robb1986, Reference Krinsky and Robb1990) yields a 95 percent confidence interval of (5.62 percent, 6.55 percent). The median WTP is 3.64 percent with a 95 percent confidence interval of (3.28 percent, 3.97 percent). To further explore how default and information nudges influence WTP, we change the respondents’ default and information nudges exposure status, while holding all continuous variables and ordered categorical variables at the median and nonordered categorical variables at the mode. Table 5 shows the mean and median estimated WTP with 95 percent confidence intervals for the treatment groups: (1) with default nudge, without information nudge; (2) with default nudge, with information nudge; (3) without default nudge, without information nudge; and (4) without default nudge, with information nudge. As expected, the estimated WTP among respondents who received both default and information nudges is higher than that of the other treatment groups, with a mean estimated WTP of 6.48 percent (95 percent CI 4.63 percent, 9.11 percent) and median estimated WTP of 3.95 percent (95 percent CI 2.59 percent, 5.98 percent). However, the differences between groups are not significant, given the overlaps in the 95 percent confidence intervals.
Subsample model results
Given the significance of certain individual characteristics in determining WTP, as shown in the baseline model results in Table 4, we further investigate whether there is heterogeneity in the treatment effects across these individual characteristics. Specifically, we re-estimate the baseline DBDC model (1) on subsamples stratified by subjects’ age, the average per person check of last month's restaurant visits, environmental awareness, time preferences, and economic views. It is important to examine what the treatment effects are in the subsamples because nudges might affect different groups differently. For example, younger individuals who are already aware of and concerned about the impact of climate change might not respond to climate change information in the survey.
Age and NEP subsample groups are stratified by the 25th and 75th percentiles. That is, subjects with age (NEP value) below the 25th percentile, that is, 31 years old (an NEP value of 56), are in the young (high environmental awareness) subsample, and subjects with age (NEP value) above the 75th percentile, that is, 60 years old (an NEP value of 74), are categorized in the old (low environmental awareness) subsample. Time preferences are measured by the CFC-I (intermediate) subscale and the CFC-F (future) subscale. Respondents with a CFC-I score above the 75th percentile, that is, 5.29, are in the present-oriented subsample, while respondents with a CFC-F score above the 75th percentile, that is, 5.71, are in the future-oriented subsample. Economic view is a categorical variable with seven categories ranging from extremely liberal to extremely conservative. Consumers who identify themselves as extremely economically liberal, liberal, slightly liberal, that is, categories 1, 2, and 3, are in the economically liberal subsample. Respondents who self-identified as extremely economically conservative, conservative, and slightly conservative, that is, categories 5, 6, and 7, are in the economically conservative subsample.
The subsample results, presented in Table 6, reveal the existence of heterogeneity in treatment effects across different subsamples based on individual characteristics. First, the results of age subgroups show that younger consumers do not respond to either treatment, but the older subgroup reacts to the default nudge. Second, neither nudge changes the behavior of individuals with low environmental awareness. However, for people who are already environmentally conscious, being exposed to information on climate change increases their WTP. Third, regardless of respondents’ time preferences, both nudges significantly increase WTP. Fourth, the information nudge lifts WTP for economically liberal individuals, while the default nudge has no impact on their likelihood of sponsoring agricultural carbon emission reduction. On the other hand, it is the opposite of economically conservative respondents. Receiving the default nudge significantly increases their WTP, but the information nudge does not have any impact. Finally, both nudges significantly raise the WTP of consumers who go to lower-end restaurants but have no impact on consumers visiting high-end restaurants.
Default and climate change information treatment effect across subsamples
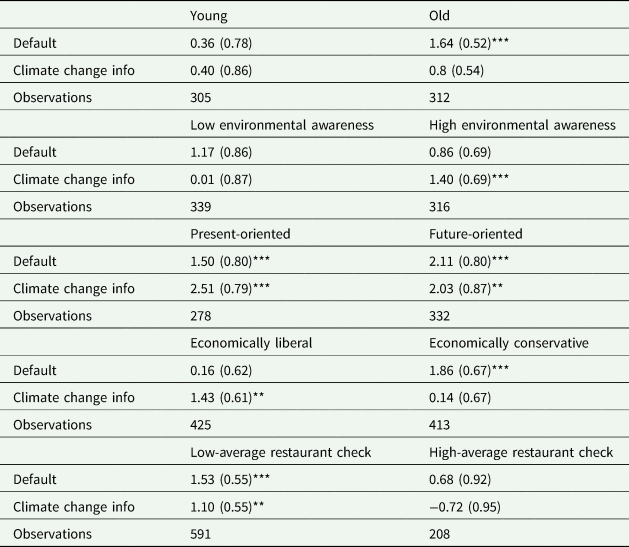
Note: This table presents the parameter estimates and standard deviations (in parenthesis) for the default and the information nudges on 10 subsamples based on consumers’ age, environmental awareness, time preferences, and economic views.
*** p < 0.01, **p < 0.05, *p < 0.1.
Conclusions
This article offers the first willingness-to-pay estimates of restaurant surcharges supporting agricultural carbon emission reduction programs. We provide empirical evidence of the extent to which individuals are willing to pay to reduce their carbon emissions by way of an optional surcharge on their restaurant checks. We find that respondents on average will pay 6.05 percent. Furthermore, though not significant according to the Krinsky and Robb bootstrapping procedure, WTP differences by treatment groups were as predicted. Individuals exposed to both default and information nudges have the highest WTP on average.
Factors influencing WTP are especially important. First, nudges appear to effectively alter individual WTP. Our results show that respondents who receive information regarding climate change during the survey are more willing to pay for a carbon reduction program than those not receiving it. Framing the surcharge as a default option significantly raises WTP, suggesting that appropriate nudges are cost-effective behavior determinants.
Individual demographics such as age and marital status play an important role in WTP. Older individuals have a significantly lower WTP than the young. Divorced respondents are more likely to pay to reduce their carbon emissions than married ones are. While political views have no significant impact, economic views do. Economically conservative customers are less likely to pay a surcharge than economically liberal ones.
Second, environmental attitudes and time preferences determine WTP. Unsurprisingly, those with high environmental awareness are willing to pay considerably more to lower carbon emissions. Moreover, future-oriented individuals tend to pay more for agricultural carbon emission reduction programs than present-oriented individuals.
Our results show the treatment effect is heterogeneous based on several individual characters. Depending on certain individual characteristics including age, environmental awareness, average check per person during last month's restaurant visits, and economic views, consumers in the subsamples respond to default and information nudges differently. First, a default nudge has a significant impact on older consumers’ WTP, while neither treatment affects the young's WTP. Second, information on climate change increases WTP for individuals with high environmental awareness. Third, regardless of consumers’ time preference, both default and information nudges are effective in lifting their WTP. Fourth, information treatment significantly increases economically conservative consumers’ WTP. Finally, high-end restaurant goers are not affected by default and information nudges, but low-end restaurant consumers are.
One limitation of our analysis is that hypothetical bias is difficult to avoid using a stated preference survey. Our use of both “cheap-talk” and “consequentiality” scripts is not an ideal choice, since cheap talk reminds respondents of the hypothetical nature of their choices, while the consequentiality script emphasizes the real consequences in the responses. The two might negate each other's effects.
Policymakers will benefit from considering these conclusions in the design of carbon reduction policy and the evaluation of climate-change regulatory proposals. An understanding of the significant role that socioeconomic characteristics and social context play in WTP formation is particularly important for policy design. We have illustrated ways in which policy instruments such as default options and other information nudges can significantly influence program participation behavior.
Restaurants that would choose to implement such a program, and particularly those that would employ a default surcharge, are likely to perceive a competitive benefit in doing so. Adopting such a program, advertising it, and sharing the amount of carbon offset that the restaurant has achieved through the program could be an effective marketing campaign to attract people seeking environmentally responsible ways to eat. Our results show that a majority of the population draws utility from contributing to offsetting food-related emissions. It makes many people feel good to assuage the eco-guilt connected to the food they eat by paying the surcharge, even if it is high. Restaurants could deem this valuable to their business. And even if diners do not pay the surcharge, the option to pay the surcharge may attract people to the restaurant because they believe the restaurant itself is environmentally friendly, or because they think they might pay the surcharge, or because their companions might want to contribute to the cause.
Collectively, our results reinforce the credibility and feasibility of restaurant surcharge programs for reducing domestic food-related carbon emissions. With average WTP estimated at roughly one-third the size of customary restaurant server tips in the United States, our findings suggest that such a program could transfer a meaningful amount of the food-carbon reduction burden to consumers that farmers currently shoulder. For future research, it will be useful to extend our analysis to further measure cross-restaurant variations in demographic type, influencing, in turn, the carbon reduction funding to be expected from these voluntary surcharge programs in a given restaurant type. In addition, since the collected funds are eventually transferred to farmers, individuals who work in agricultural sectors may be more willing to pay for the surcharge. It is also beneficial to investigate if individuals’ backgrounds affect their WTP.
Supplementary material
The supplementary material for this article can be found at https://doi.org/10.1017/age.2021.7.
Data availability statement
Replication materials are available in the GitHub WTP-Carbon-Reduction repository at https://github.com/dedelong/WTP-Carbon-Reduction.
Acknowledgments
We would like to thank three anonymous reviewers for their helpful comments.
Funding statement
This research received no specific grant from any funding agency, commercial, or not-for-profit sectors.
Competing interest
None.


 Open access