


Introduction
Greenhouse gas (GHG) mitigation from agricultural soil is one of the key focal areas of current agricultural research. The major three GHG are – CO2, CH4 and N2O depending on the role in global warming. Methane is the second most important GHG with a current ambient concentration of 1.8 ppm (Pittock, Reference Pittock2017). Atmospheric CH4 concentration has increased over the years dramatically due to intensive agriculture and less measures to curb this GHG. For example, during early 2000s, atmospheric CH4 concentration was rising from terrestrial ecosystem at 0.5 ppb (parts per billion) per year. But in the past few years, CH4 concentration in air is rising at 9–12 ppb per year (Peng et al., Reference Peng, Lin, Thompson, Xi, Liu, Hauglustaine, Lan, Poulter, Ramonet, Saunois and Yin2022). CH4 affects the earth's atmospheric chemistry like ozone depletion due to its multifarious role in the earth's troposphere and stratosphere. Thus, in the current scenario mitigation of CH4 from various sources mainly from agriculture is the most important task to curb GHG mediated global warming. Various agricultural practices influence soil biochemical properties which influence CH4 cycling in soil ecosystem. The most commonly suggested strategy to improve soil quality is amendment of crop residues, including conservation agriculture (CA).
CA practices have been widely popularized across the globe to minimize GHG emission from agricultural soil (Lal, Reference Lal2019; Pu et al., Reference Pu, Chen, Wang, Virk, Zhao and Zhang2022; Zhang et al., Reference Zhang, Hobbie, Feng and Hu2022; Francaviglia et al., Reference Francaviglia, Almagro and Vicente-Vicente2023). There are several benefits of CA practices and many countries are adopting this approach in agriculture. For example, CA enhances water infiltration, reduce soil erosion, reduce compaction, increase surface soil organic matter and carbon content (Bilibio et al., Reference Bilibio, Uteau, Horvat, Rosskopf, Junge, Finckh and Peth2023) and improve soil aggregate formation (Nyambo et al., Reference Nyambo, Chiduza and Araya2022). At the global scale, CA is being practiced on 180 M ha (Francaviglia et al., Reference Francaviglia, Almagro and Vicente-Vicente2023; Reimer et al., Reference Reimer, Doll, Boring and Zimnicki2023). Among all countries, CA is practiced most intensively in northern USA (26.5 M ha) followed by Argentina (25.5 M ha), Canada (13.5 M ha) and Australia (17.0 M ha) (Chinseu et al., Reference Chinseu, Dougill and Stringer2019). CA is being practiced on more than 17.5 M ha in Asia (Kassam et al., Reference Kassam, Friedrich and Derpsch2022) and 3.9 M ha in India (Thakur et al., Reference Thakur, Nigam, Mann, Gupta, Hussain, Shukla, Shah, Casini, Elansary and Khan2023) with a presumption of larger area in recent years. CA recommends retention of crop residues (at least 30%) in fields so that the residues get added into soil (Francaviglia et al., Reference Francaviglia, Almagro and Vicente-Vicente2023). Under such circumstances, left over crop residues undergoes decomposition which leads to production of various organic compounds including organic acids, sugars. These organic compounds act as precursor molecule for CH4 cycling.
CH4 cycling is comprised of two processes, CH4 production and CH4 oxidation (consumption). Depending on the available C and N content, CH4 cycling is influenced differently by the type of crop residue. In a vegetable–rice rotation, straw retention increased CH4 emissions in the rice cultivation season (Qi et al., Reference Qi, Pokharel, Huang, Chang, Gong, Sun, Wu, Wang and Gao2023). Methane oxidation potential of paddy soil under three long-term (32 years) fertilization treatments evaluated with treatments of unfertilized control, inorganic fertilizers and wheat straw incorporation with inorganic fertilizers. The results showed that the methane oxidation potential in the straw with inorganic fertilizer treatment was significantly higher than those without residue treatments (Yang et al., Reference Yang, Shen, Zhao, Shan, Wang, Zhou, Liu, Liu, Tian, Yang and Jin2022). Incorporation of crop residue originating from both legumes and cereals can substantially enhance both CH4 production and consumption (Zhou et al., Reference Zhou, Gao, Xu, Dou, Shimizu and Cao2020). Literature on both CH4 production and consumption in response to crop residue incorporation is limited. This information is essential to develop strategies to enhance GHG mitigation through CA. A previous study on CH4 consumption in soybean–wheat, maize–wheat and maize–gram cropping systems under different tillage practice (Kollah et al., Reference Kollah, Bakoriya, Dubey, Parmar, Somasundaram, Shirale, Gupta, Patra and Mohanty2020) indicated that no-tillage stimulated CH4 consumption than conventional tillage irrespective of cropping system. CH4 consumption potential was also highest in maize–wheat and lowest in maize gram. In order to better understand these mechanisms, the current experiment was undertaken to define how the residues of cereal (wheat, maize) are different than legumes (soybean, chickpea) in respect to influencing CH4 cycling in soil ecosystem. We hypothesize that crop residues influence CH4 cycling which depends on (1) C:N values of biomass, (2) mineralization and release of organic C and N compounds and (3) differential influence on methanogens and methanotrophs. Experiments were carried out with objectives to estimate CH4 production and consumption in soil amended with residues of legumes and cereals, define the role of carbon and nitrogen content of crop residue in influencing methane cycling, and evaluate the microbial population in relation to CH4 cycling in soil ecosystem.
Materials and methods
Experimental site
The study was carried out using soils collected from an experimental site located at the Indian Institute of Soil Science, Bhopal, India (23°18′N/77°24′E, 485 m above sea level). The location has a climate of humid sub-tropicalnature, with a hot summer and a rainy monsoon season. The location experiences south-western monsoon rain in July–September. During course of study the location had a mean annual temperature of 25.2°C with the highest of 43.9°C during mid-May and the lowest 4.4°C in January. The average precipitation was 1213.10 mm, and the humidity was 56.9%.
Experimental design, crop management and fertilizer application
The field experiment was laid in randomized block design with three replicates and four treatments. Treatments consisted of (1) un-amended control, (2) inorganic (chemical source) fertilizer, (3) organic fertilizer and (4) integrated (both inorganic and organic) fertilizer management. Inorganic source of N, P, and K were urea (NH2)2CO, single super phosphate Ca (H2OP4)2.H2O and muriate of potash KCl, respectively. Organic fertilizers were amended to the fields on the basis of N equivalent, consisting of an equal amount (33.33%) of farm yard manure, vermi-compost and poultry manure. The three organic sources contained nitrogen at 0.84, 0.97 and 1.97%, respectively, of dry weight biomass. Fertilizers were amended as single application at the day of sowing. Soybean (Glycine max L., var JS 335.) was cultivated during rainy (July – October) while wheat (Triticum durum L., var Sujatha C- 306) was cultivated in winter (Oct–March) season (rabi). Soybean was sown on 5 July 2019 at a spacing of 20 cm × 15 cm, while wheat was at 22 × 10 cm. Seed rates of wheat and soybean were at 100 and 80 kg/ha, respectively. Fertilizers were applied at the rate of 30:60:30 and 140:60:40 kg N:P2O5:K2O per ha in soybean and wheat, respectively, using urea, single super phosphate, muriate of potash as fertilizer sources. Soil samples were collected from the inorganic fields of soybean during the rainy season (kharif) 2019.
Soil sampling and processing
Soil samples were collected after 45 days of sowing (vegetative stage) from 0–10 cm depth using an auger (5 cm internal diameter). Soils cores of 0–10 cm were sampled from 4 corners and centre of fields. At each sampling point, upper soil layer (~3 cm) was removed to get rid of debris like plant biomass material (dead roots, leaves, and insects) and coarse gravels (stones and gravels). Soil cores were homogenized and mixed to form a composite soil sample. Collected soil samples were air dried under shade inside a room, then passed through 2 mm sieve and stored in plastic containers. Soils were used within 2 days of sampling to avoid issues related to change in soil properties due to storing.
Soil physico-chemical properties
The soil was characterized as a heavy clayey Vertisol (Typic Haplustert). The electrical conductivity (EC) was 0.38 dS/m and the pH was 7.78 (1:2.5 of soil and water in w:v) (Smith and Doran, Reference Smith and Doran1996). The textural composition of soil was determined following standard method with values as sand 15.2%, silt 30.3%, clay 54.5%. Soil organic carbon was determined by wet digestion method (Bahadori and Tofighi, Reference Bahadori and Tofighi2016). Available N was determined by standard alkaline KMnO4 method (Sahrawat and Burford, Reference Sahrawat and Burford1982). Available P content of soil was determined by extracting P with 0.5 N NaHCO3 buffer at pH 8.5 (Recena et al., Reference Recena, Torrent, del Campillo and Delgado2015) and P in the extract was determined by ascorbic acid method (Porto et al., Reference Porto, Neto, dos Santos, Gomes and Ferreira2019). Available K content was determined by extracting soil by shaking with neutral normal ammonium acetate for 5 min and then K in the extract was determined by flame photometer (Culman et al., Reference Culman, Mann, Sharma, Saeed, Fulford, Lindsey, Brooker, Dayton, Eugene, Warden and Steinke2019). Soil organic carbon content of soil was 0.82%, available N was 263 kg/ha, available P was 21 kg/ha and available K was 320 kg/ha.
Experimental set up
Experiment was carried out using 40 vials representing 2 CH4 cycling (CH4 production and CH4 consumption) × 5 crop residues (control, maize, wheat, soybean and chickpea) × 4 replicates. Vials were laid out in completely randomized design to evaluate the differential role of crop residues on CH4 cycling (Fig. 1).
Experimental set up and layout for evaluating the effect of crop residues on methane production and consumption. Microcosms were prepared using serum vials containing mixture of soil and crop residues. The dried straw biomass of wheat, maize, soybean and chickpea were used in the study. For CH4 production, the vials were flooded with sterile distilled water and closed using butyl rubber septa and sealed using aluminium crimp seal. For CH4 consumption, soils were added with water to maintain 60% moisture holding capacity. All vials were incubated at 30 ± 2°C. Experiment was conducted in four replicates.

Crop residue preparation
The crops selected for the experiment were maize (Zea mays L.), wheat (Triticum durum L., var Sujatha C- 306), soybean (Glycine max L., var JS 335) and chickpea (Cicer arietinum L). Crop residues were collected from farm after cultivation of crops. Residues were sun dried and chopped to 5–8 cm size manually and milled in a cutting mill (SM100, Retsch, Germany). The miller was fitted with a 6-disc stainless rotor and bottom sieves with trapezoid holes to get final plant material of 1 mm size.
CH4 production
To evaluate CH4 production, soil samples were incubated under flooded condition as described elsewhere (Luo et al., Reference Luo, Li, Yao and Chapman2022). Briefly, portions of air dried 20 g of soil samples were weighed into 130 ml serum vials (Fig. 1). Crop residues were added at 1% (w/w) an equivalent of 20 t/ha level to soil to examine the influence of crop biomass incorporation on CH4 production potential. The dose was selected considering the CA practice where significant amount of crop biomass is incorporated into soil. The soil in vials was flooded with sterile distilled water of 50 ml. After flooding, the vials were closed with butyl rubber septa and sealed using aluminium crimp seal. Vials were kept in a biological oxygen demand (BOD) incubator (30 ± 2°C) in the dark condition. To estimate CH4 production in the soils, vials were shaken for 10 min on a horizontal shaker at 150 rpm for 30 min to release soil-trapped CH4, if any and 0.1 ml of the headspace gas was analysed for CH4. CH4 concentration was analysed using a gas chromatograph (CIC, India) equipped with an flame ionization detector (FID) and a Porapak Q packed column (2-m length, diameter 2/8″, 80/100 mesh, stainless steel column) as described elsewhere (Mohanty et al., Reference Mohanty, Bandeppa, Dubey, Ahirwar, Patra and Bharati2017).
CH4 consumption potential
Incubation experiment was carried out following methods as described elsewhere (Mohanty et al., Reference Mohanty, Kollah, Chaudhary, Singh and Singh2015; Kollah et al., Reference Kollah, Bakoriya, Dubey, Parmar, Somasundaram, Shirale, Gupta, Patra and Mohanty2020). Briefly, a portion of 20 g soil placed into 130 ml sterilized serum vials (Fig. 1). Crop residues were added at 1% (w/w) level to soil. Soils were moistened with 5 ml sterile distilled water to attain about 40% moisture holding capacity. The contents of the vials were mixed thoroughly, capped with rubber septa and sealed using aluminium crimp seal. Pure CH4 was injected into the headspace of the vials for a final concentration of 1000 ppm. Vials were incubated at 28 ± 2°C in a biological oxygen demand (BOD) incubator (Metrex scientific instruments pvt ltd, N Delhi, India). At regular intervals (~1 day), 0.1 ml of headspace gas was analysed for CH4. After each sampling, the headspace was replaced with an equivalent amount of high purity helium (He) to maintain atmospheric pressure. The gas He was used because of its inert chemical nature. Vials were incubated till headspace CH4 was completely consumed. The rate constant of CH4 consumption (k) was determined from the slope of log-transformed values of CH4 v. time during the rapid decline phase.
CH4 estimation
The injector, column and detector were maintained at 120, 60 and 300°C, respectively. Under these parameters of GC, the retention time of CH4 was 1.3 min. The GC was calibrated for accurate measurement, before and after each set of measurements using different mixtures of CH4 in N2 (Sigma Gases, New Delhi, India) as primary standards (CH4 100 ppm).
Organic carbon and available NO3 estimation
To estimate NO31− content, samples were extracted with CaSO4 (0.1 M) and then by reacting with phenol disulphonic acid following standard method (Sahrawat and Burford, Reference Sahrawat and Burford1982). Organic carbon was estimated by digesting soil with potassium dichromate (K2Cr2O7) and 20 ml of concentrated sulphuric acid (H2SO4). The excess dichromate that was not reduced in the reaction was determined by volumetric titration using ferrous ammonium sulphate [Fe(NH4)2(SO4)26H2O)] as described elsewhere (Bahadori and Tofighi, Reference Bahadori and Tofighi2016).
DNA extraction
After experiment, about 0.5 g soil samples were taken out from vials to extract DNA using the ultraclean DNA extraction kit (MoBio, USA) following the manufacturer's instructions. The DNA concentrations were determined in a biophotometer (Eppendorf, Germany) by measuring absorbance at 260 nm (A260), assuming that 1 A260 unit represents 50 ng of DNA per μl. DNA extraction was further confirmed by electrophoresis on a 1% agarose gel. The extracted DNA was dissolved in 50 μl TE buffer and stored at −20°C until further analysis.
Real time PCR quantification of methanogens mcr and methanotrophs pmoA genes
Real time PCR was performed on a Step one plus real time PCR (ABI, USA) to quantify the genes of representative microbial species. Reaction mixture prepared by adding 2 μl of DNA template, 10 μl of 2X SYBR green master mix (Affymetrix, USA), 200 nM of primer (GCC Biotech, N Delhi). Final volume of PCR reaction mixture was adjusted to 20 μl with PCR grade water (MP Bio, USA). Primers targeting pmoA gene (particulate methane monooxygenase) of methanotrophs were used to quantify abundance of methane oxidizing bacteria. The primers for pmoA were A189F (5- GGN GAC TGG GAC TTCT GG-3) and mb661R (5- CCG GMG CAA CGT CYT TAC C-3) (Mohanty et al., Reference Mohanty, Bandeppa, Dubey, Ahirwar, Patra and Bharati2017). This primer set targeted methanotrophs belonging to both type I and II groups including Methylobacter or Methylosarcina, Methylococcus, Methylosinus group, Methylocapsa, Nitrosococcus (Kolb, Reference Kolb2009). Primer set used for quantifying methanogens were mcr1f (5-AAA GAC GCG GTA CAA GCA AC-3) and mcr1r (5-GCT GAA CAT ACA CGG CAC AG-3) (Li et al., Reference Li, Shi, Yin, Wang, Shen, Ding and Wang2017). The amplicon length was about 213 base pairs. Thermal cycling was carried out by an initial denaturizing step at 94°C for 4 min, 40 cycles of 94°C for 1 min, 52°C (pmoA) or 60°C (mcr) for 30 s, 72°C for 45 s; final extension carried out at 72°C for 5 min. Fluorescence was measured during elongation step. Data analysis was carried out with Step one plus software (ABI, USA) as described in user's manual. The cycle at which the fluorescence of target molecule number exceeded the background fluorescence (threshold cycle [CT]) was determined from dilution series of target DNA with defined target molecule amounts. CT was proportional to the logarithm of the target molecule number. The quality of PCR amplification products were determined by melting curve analysis with temperature increase of 0.3°C per cycle. Standard for the genes was made from series of 10 fold dilutions of purified amplified products and data presented as number of cells/g of soil.
Statistical analyses
All statistical analyses were carried out using the Microsoft excel and ‘agricolae’ package of the statistical software R (2.15.1) (Ihaka and Gentleman, Reference Ihaka and Gentleman1996). Results for the experiments were presented as arithmetic means and standard deviation of replicated observations. Arithmetic mean and standard deviation were calculated by Microsoft Excel. Tukeys honestly significant difference (HSD) test was performed to define the significant difference among treatments at α = 0.05. Linear correlation models among factors were evaluated by Excel.
Results
Ch4 production from soil under the influence of crop residue
Production of CH4through methanogenesis varied temporally with amendment of crop residues. Methanogenesis occurred after 5 days of incubation and headspace CH4 concentration increased steadily over the incubation period of 35 days (Fig. 2). In the control treatment, methanogenesis was very low compared to other treatments. Methane production rate varied with the residue of crops and it followed with a trend of wheat > maize > soybean > chickpea > none (no amendments). CH4 production rate (ng CH4 produced g/soil/day) was highest 0.107 in wheat followed by 0.092 in maize, 0.085 in soybean and lowest of 0.068 in chickpea.
CH4 production from soil under the influence of biomass of different crops. The crops were wheat, maize, chickpea and soybean. Water of 50 ml was added to soil and incubated as mentioned in the text. Headspace CH4 was measured at regular intervals. Panel a–e : Y axis represents CH4 production from soil where Y axis represents ngCH4 produced g−1 soil and X axis represents incubation period in days. Panel f :CH4 production rate of soils under the influence of different crop biomass, where, Y axis represents ngCH4 produced g/soil/day and X axis represents biomass of crops. Each data point is arithmetic mean ± standard deviation of four replicated observations.

CH4 consumption in soil under the influence of crop residue
CH4 consumption was estimated as the decline in the headspace CH4 concentration over incubation period. Variation in CH4 consumption was due to different crop residue is shown in Fig. 3. CH4 consumption initiated mostly after 2 days of incubation and continued over the incubation period of 13 days. Headspace CH4 declined to ambient air values in soil amended with crop residue. CH4 consumption rate estimated as ng of CH4 consumed g/soil/day. The trend of CH4 consumption followed as wheat > maize > soybean > chickpea > control. CH4 consumption rates were as follows: 0.79 ng CH4 consumed g/soil/day in wheat, 0.77 ng CH4 consumed g/soil/day in maize, 0.60 ng CH4 consumed g/soil/day in soybean, 0.53 ng CH4 consumed g/soil/day in chickpea and 0.31 ng CH4 consumed g/soil/day in control.
CH4 consumption in soil under the influence of biomass of different crops. The crops were wheat, maize, gram and soybean. Headspace CH4concentration was measured at regular intervals. Panel a–e : Y axis represents change in CH4concentration in the headspace of vials and X axis represents incubation period in days. Panel f : CH4 consumption rate where, Y axis represents ngCH4 consumed g/soil/day and X axis represents biomass of crops. Each data point is arithmetic mean ± standard deviation of four replicated observations.

Organic carbon and available nitrate
Organic carbon and available nitrate in soil samples were estimated after the end of incubation for CH4 production and CH4 consumption (Fig. 4). Organic carbon increased after incubation for the CH4 cycling processes. After CH4 production, organic C content was 1.43% in wheat, 1.02% in maize, 0.84% in soybean and 0.73% in chickpea. Similarly, after CH4 consumption, organic carbon content was as follows: 0.93% in wheat, 0.84% in maize, 0.76% in soybean and 0.70% in chickpea. Organic carbon in control soil varied from 0.54–0.58%. Available nitrate content varied with crop residue and increased after incubation. The trend of available nitrate was opposite of organic carbon. Nitrate content of soil was higher during CH4 consumption than CH4 production. Nitrate content varied from 0.65 mM in chickpea to 0.39 mM in wheat after CH4 production. Available nitrate content varied from 1.45 mM in chickpea to 0.85 mM in wheat. In control soils available NO3 was 0.32 mM after incubation for CH4 production and 0.68 mM after incubation for CH4 consumption.
Organic carbon content (%) and available NO3 concentration (mM) in soil after CH4 production and CH4 consumption under the influence of amendment of different crop biomass. Panel a and b represents organic carbon content in soil. Panel c and d represents available nitrate content. Soils after incubation were used for analysis. Each data point is arithmetic mean with standard deviation (error bar) of four replicated observations. Y axis represents organic carbon (%) or available NO3 (mM). X axis represents biomass of crops.

Microbial abundance
Abundances of different microbial groups comprising methanogens and methanotrophs increased with crop residue amendment (Table 1). Abundance of methanogens was in the range of 84 × 103 mcr gene copies /g soil to 11 × 103 mcr gene copies/g soil. Lowest was in un-amended control and highest in the soil amended with wheat residue. Methanogens abundance increased 7.6 fold in wheat and 2.45 fold in chickpea than control. Methanotrophs abundance was also stimulated in soil due to crop residue. Methanotrophs were stimulated highest in wheat and lowest in chickpea. Methanotrophs were 15 × 104 pmoA gene copies /g soil in un-amended control. Their abundance increased 3.26 times by wheat and lowest 1.2 times by chickpea residue amendment.
Abundances of methanogens and methanotrophs in soil amended with different crop biomass after methanogenic and methanotrophic metabolism

Each data is arithmetic mean ± standard deviation of four replicated observation. Values followed by same letter were not significantly different (P 0.05)
Linear regression analysis
Linear regression models of CH4 production and CH4 consumption in respect to soil parameters indicated that change in soil parameters were in accordance to CH4 cycling processes (Fig. 5). CH4 production was linearly modelled as follows:


Linear regression models predicting CH4 production and CH4 consumption rates from soil parameters. Left panels (a, b and c) represents linear regression models for CH4 production and right panels (d, e and f) represents regression models for CH4 consumption rates. The parameters were organic C, available NO3, and abundance of methanogenic archaeal mcr gene copies and methane oxidizing methanotrophs pmoA gene copies.

Methanotrophs gene abundance was linearly modelled as follows:


Discussion
To define the role of different crop residues on the CH4 cycling processes, soils were amended with crop residue at 1% w/w, equivalent to level of crop residue amendment practiced under agricultural practice (Diacono and Montemurro, Reference Diacono and Montemurro2015). Moreover, in CA 30% of crop residue is left in the field to improve soil carbon. Total carbon and nitrogen content of the crop residue was as follows: maize 39% C and 0.5% N (Xu et al., Reference Xu, Shi, Lv, Yu and Li2013), wheat 44.8% C and 0.57% N, chickpea 37.1% C and 1.20% N and soybean 36.6% C and 1.09% N (Reddy et al., Reference Reddy, Mohanty, Rao, Singh, Dalal, Rao, Pandey and Menzies2008). To evaluate CH4 production, soils were maintained under flooded conditions as saturated moisture facilitates anaerobiosis. There was no CH4 production in control soil, but addition of crop residue stimulated CH4 production. Headspace CH4 concentration constantly increased due to accumulation of CH4 produced during methanogenesis. Variation in CH4 production was due to crop type. Wheat stimulated at highest level followed by maize, soybean and least by chickpea. This was due to the C: N content of crop residue. C:N of maize 66.3 (Feng et al., Reference Feng, Zhao, Guo, Yang, Xi and Ren2012), wheat is about 78.6, soybean 33.6 and chickpea 31 (Reddy et al., Reference Reddy, Mohanty, Rao, Singh, Dalal, Rao, Pandey and Menzies2008). Crop residue driven CH4 cycling was outlined to define different mechanisms (Fig. 6). A high carbon content of wheat stimulated CH4 production at highest level, while low C:N in chickpea resulted lowest CH4 production. Organic carbon was measured after the end of incubation to evaluate the mineralization of residue. Crop residue enhanced organic carbon content of soil and it followed the trend of wheat > maize > soybean > chickpea. Organic carbon acts as substrates for methanogens. Crop residues having higher carbon content stimulated methanogenesis than the lower carbon containing crop residues. Rate of CH4 production significantly correlated with organic carbon content of soil (P = 0.05, r 2 = 0.562). Available nitrate content of soil was increased by amendment of crop residues. However, the nitrate content (mM) was highest in chickpea and least in wheat. CH4 production correlated significantly with methanogens mcr gene copy numbers (r 2 = 0.766). However, the relation between CH4 production and available NO3− was negative. Probably, CH4 production was a way to lower the C:N value for stabilization under anaerobiosis (Arianti et al., Reference Arianti, Pertiwi, Triastono, Purwaningsih, Minarsih, Kristamtini, Hindarwati, Jauhari, Sahara and Nurwahyuni2022). In a study on stimulating higher methanogenesis, substrates like straw of rice or wheat with higher C:N were bio-augmented (Luo et al., Reference Luo, Liu, Lei, Shen, Zhang, Wang, Ruan and Cui2023). Methanogens were higher in soil amended with wheat residue and lowest in chickpea residue amended soil. Higher abundance of methanogens and CH4 production was due to higher available carbon content of crop residue.
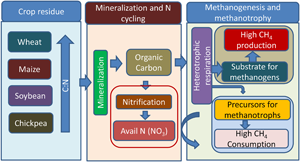
Hypothetical illustration of the mechanism of crop residues driven methanogenesis and methanotrophy. The crop residues were wheat, maize, soybean and chickpea. Residues of cereals (wheat, maize) had higher C:N values than legumes (soybean, chickpea). Residues of cereals stimulated both methanogenesis (CH4 production) and methanotrophy (CH4 consumption or oxidation) than the legumes. Crop residues undergo mineralization leading to the production of readily available carbon like organic carbon and available nitrogen (NO3). Mineralization leads to the production of organic carbon and metabolism of heterotrophs produces CO2 which may act as substrates for methanogenesis. Products of mineralization and CO2 stimulated methanotrophy (CH4 consumption). Probably metabolites of heterotrophs and CO2 stimulated CH4 consumption. Methanotrophs also carry out nitrification due to which NO3 production was correlated with CH4 consumption.

CH4 consumption rate was highest in soil amended with wheat and lowest with chickpea. High C:N of crop residue stimulated most to CH4 consumption. CH4 consumption rate correlated positively and significantly with soil organic carbon. In a study on global meta-analysis, and process-based modelling, it was observed that soil organic carbon constituted an important variable that governed the CH4 uptake potential of soil (Lee et al., Reference Lee, Oh, Lee, Seo, Yun, Yang, Kim, Zhuang and Kang2023). CH4 consuming microbial groups including methanotrophs use CH4 as carbon source. However, this study indicated that soil organic carbon stimulated CH4 consumption. Based on this finding it was proposed that CH4 consumption potential of soil depends on the heterotrophic metabolism of other soil microbial groups. In a study on linkage between soil erosion and CH4 consumption rates, it was observed that loss of heterotrophic microbial diversity affected CH4 uptake potential (Schnyder et al., Reference Schnyder, Bodelier, Hartmann, Henneberger and Niklaus2023). However, it is unclear from the present study that how heterotrophs regulate CH4 consumption activity in soil. Probably, higher heterotrophic activities released CO2 which in turn stimulated CH4 consumption. In a recent study, it was highlighted that CO2 favoured CH4 consumption (Noyce et al., Reference Noyce, Smith, Kirwan, Rich and Megonigal2023). Available nitrate content measured after CH4 consumption was at a higher level than CH4 production. Most methanotrophs exhibit nitrification activities (Kollah et al., Reference Kollah, Verma, Parmar, Devi, Atoliya, Bajpai, Shinoji, Singh, Patra, Jain and Dubey2023). Probably, this property of methanotrophs stimulated nitrification and enhanced available nitrate content in soil. Available nitrate content correlated significantly with CH4 consumption. Methanotrophs abundance positively and significantly correlated with CH4 consumption potential, as these groups of organisms consume CH4. Study highlighted that crop residue having higher C:N stimulated CH4 cycling processes including CH4 production and CH4 consumption. Carbon content was the most important property than nitrogen content to regulate CH4 cycling.
Conclusions
The current study evaluated CH4 cycling (both production and consumption of CH4) in a tropical vertisol amended with residues of legumes (soybean, chickpea) and cereals (wheat, maize). Carbon content of crop residue was the most important factors to shape both CH4 production and CH4 consumption. Organic carbon acts as substrate for CH4 production, but how organic carbon stimulated CH4 consumption, seeks further research to elucidate the mechanism.
Acknowledgement
We would like to acknowledge director ICAR Indian Institute of Soil Science, Bhopal for undertaking this research.
Authors' contributions
MS carried out chemical analysis. BK contributed in statistical analysis and drafted manuscript. RP and MHD collected soil samples from experimental fields and processed for incubation studies. AB, NA and AS performed soil and microbial analysis. GD carried out molecular analysis. SRM conceptualized the experiment and prepared final draft.
Funding statement
Experiment was funded by DST SERB to SRM.
Competing interest
None.
Ethical standards
Not applicable.


