

Although there is a long history of economic activity between Japan and the United States, and despite being the fourth largest U.S. trading partner, no agreement governs trade between the two countries outside of the World Trade Organization (WTO). However, Japan and the United States participated in the Trans-Pacific Partnership (TPP)Footnote 1 negotiations where signatory countries agreed to lower or eliminate trade barriers including tariffs on agricultural imports. Although the text of the agreement was finalized in October 2015, an executive action was issued in January 2017 officially withdrawing the United States from the TPP (Caporal Reference Caporal2017).
The TPP was promoted as setting a U.S.-led trade agenda in the Asia-Pacific Region, rivaling other agreements such the Regional Comprehensive Economic Partnership (RCEP), which includes many TPP countries (excluding the United States) as well as China and India (Panda Reference Panda2014, Wilson Reference Wilson2015). While the geopolitical consequences are uncertain, withdrawal from TPP could be costly for U.S. agricultural exports given existing and pending trade agreements such as RCEP or a “TPP” without the United States (American Farm Bureau Federation 2016). Of particular concern are U.S. beef exports to Japan. Since beef is one of Japan's most sensitive sectors, its commitment to reduce tariffs on beef imports was considered a notable achievement when the TPP was finalized (Cooper and Manyin Reference Cooper and Manyin2013, Fergusson, McMinimy, and Williams Reference Fergusson, McMinimy and Williams2015, McMinimy Reference McMinimy2016).
Japan is one of the largest beef importing countries in the world and the most important foreign market for U.S. beef, and despite its tariffs on beef products, it ranked second among all importing countries with imports exceeding $3.4 billion in 2015.Footnote 2 Japan's beef imports are largely split between the United States and Australia. Unlike the United States however, Australia has an existing trade agreement with Japan. Under the Japan-Australia Economic Partnership Agreement (JAEPA), which entered into force in January 2015, Australian beef exporters benefit from tariffs that are significantly lower than the most favored nation (MFN) rates faced by other exporters, and which are scheduled to fall further during the implementation period (Farrell Reference Farrell2014). The implementation of JAEPA raises questions about the future of U.S. beef exports to Japan. What are the potential gains and losses for Australian and U.S. beef, respectively, and how important is similar market access for U.S. beef to offset the effects of JAEPA?
The overall goal of this study is to examine how tariff reductions in the Japanese beef market could impact the competitiveness of Australia, the United States, and other exporters. The potential gains from tariff reform depend on how Japanese importers view U.S. beef vis-à-vis imports from Australia and other countries, and could also depend on the type of product (e.g., chilled or frozen beef). However, many studies treat beef as a single good, ignoring significant differences in demand patterns within the beef product group. If import preferences differ across beef products, gains for one product could be offset by losses for the other, even when imported from the same country. Therefore, we examine import demand in Japan using a framework that accounts for differentiation by exporting source and product.
Following the theoretical framework of Theil (Reference Theil1980) and Laitinen (Reference Laitinen1980) and recent empirical applications (e.g., Muhammad, McPhail, and Kiawu Reference Muhammad, McPhail and Kiawu2012), the differential production approach is used to derive a structural system of import demand equations that allow for determining total import demand and import demand by product and source. Using the model estimates, we conduct Monte Carlo simulations to derive the mean and confidence intervals of import demand changes resulting from tariff reductions. Our analysis confirms the importance of accounting for source heterogeneity found elsewhere in the literature. However, we make an important contribution by revealing that the competition across exporting countries is not uniform across beef products. Overall, our results suggest that the JAEPA will deliver considerable increases for Australian beef in Japan, largely at the expense of U.S. beef. However, similar tariff reductions for the United States could eliminate these negative effects and even result in a net increase for both countries.
This paper builds on the literature examining beef import demand. Several studies have examined how various factors affect meat demand in Japan and other Pacific Rim countries (e.g., Alston, Carter, and Jarvis Reference Alston, Carter and Jarvis1990, Capps et al. Reference Capps, Tsai, Kirby and Williams1994, Yang and Koo Reference Yang and Koo1994, Weatherspoon and Seale Reference Weatherspoon and Seale1995, Miljkovic, Marsh, and Brester Reference Miljkovic, Marsh and Brester2002, Jin and Koo Reference Jin and Koo2003, Miljkovic and Jin Reference Miljkovic and Jin2006). Another rich body of work investigates the effects of Japan's ban on U.S. imports from 2003 to 2006 due to bovine spongiform encephalopathy (BSE) concerns (e.g., McCluskey et al. Reference McCluskey, Grimsrud, Ouchi and Wahl2005, Peterson and Chen Reference Peterson and Chen2005, Ishida, Ishikawa, and Fukushige Reference Ishida, Ishikawa and Fukushige2010, Kawashima and Sari Reference Kawashima and Sari2010). Much of this research accounts for differentiation by source country. Source heterogeneity is warranted because Japanese consumers distinguish between grain-fed beef, mostly imported from the United States, and grass-fed beef, mainly imported from Australia (Obara, McConnell, and Dyck Reference Obara, McConnell and Dyck2010).
In the next section, we briefly describe patterns in Japan's beef imports and the key trade barriers shaping these flows. We then present the import demand model used for our analysis and discuss the policy simulation method. In the following sections we report the estimation results and policy simulations. The final section concludes the paper.
Japanese Beef Trade and Policy
Trade barriers in Japan have long inhibited beef imports. Prior to 1989, a restrictive import quota system was in place, but was phased out by 1991 and replaced with a 70 percent tariff that was subsequently lowered to 50 percent (OECD 2009). Since 2000, a 38.5 percent MFN tariff has been applied on almost all imports of chilled and frozen beef. However, a global safeguard on beef imports secured under the WTO Agreement on Agriculture allows Japan to increase MFN tariff rates to as high as 50 percent if beef imports exceed 117 percent of imports the previous fiscal year (OECD 2009, Obara, McConnell, and Dyck Reference Obara, McConnell and Dyck2010, USTR 2013). The safeguard was last applied to chilled beef imports in 2003–2004 (OECD 2009).
In recent years, Japan has offered limited preferential access for beef products as part of bilateral trade agreements with Mexico (2005) and Chile (2007). Under these agreements, Japan's beef imports were modestly expanded under a tariff rate quota (TRQ) regime and a provision to not apply the global safeguard on imports from these countries.Footnote 3 TRQs were set to expand over a five-year implementation period, with a commitment to renegotiate the size of the quota in the future. Notably, these agreements were concluded while North American beef imports were highly restricted due to disease concerns (Obara, McConnell, and Dyck Reference Obara, McConnell and Dyck2010). Chile's share of Japan's chilled and frozen beef imports has been negligible, averaging less than 0.1 percent during 2007–2015. Imports from Chile have been less than the quota every year since the agreement entered into effect. Mexico's shares of Japan's chilled and frozen beef imports were somewhat higher (1.0 and 4.4 percent, respectively) during this period, but were still relatively low when compared to Australia and the United States.Footnote 4 Imports from Mexico have exceeded the quota limit in almost every year since 2005 (2010 is the only exception).
The JAEPA entered into force in 2015 and offers unprecedented market access for Australian beef exporters. It is Japan's first bilateral agreement with a major beef exporting country and the first to cut tariffs on chilled and frozen beef without an accompanying TRQ regime. Over the 17-year implementation period, tariffs on chilled and frozen beef fall from 38.5 percent to 23.5 and 19.5 percent, respectively. Importantly, a large share of the tariff cuts will take place in the first two years of implementation; by the third year, tariffs on chilled and frozen beef fall to 30.5 and 27.5 percent, respectively, giving Australian exporters an immediate and significant price advantage over the United States. Similar to the agreements with Chile and Mexico, Japan agreed to not impose its global safeguard on chilled and frozen beef imports from Australia. However, the agreement does include a special JAEPA safeguard with a more generous quantity trigger than the global safeguard and a tariff rate snap back to a 38.5 percent ceiling, as opposed to the 50 percent ceiling that will continue to apply to U.S. beef (Farrell Reference Farrell2014). In 2015, Japan's beef imports from Australia were below the quantity trigger for both chilled and frozen beef.
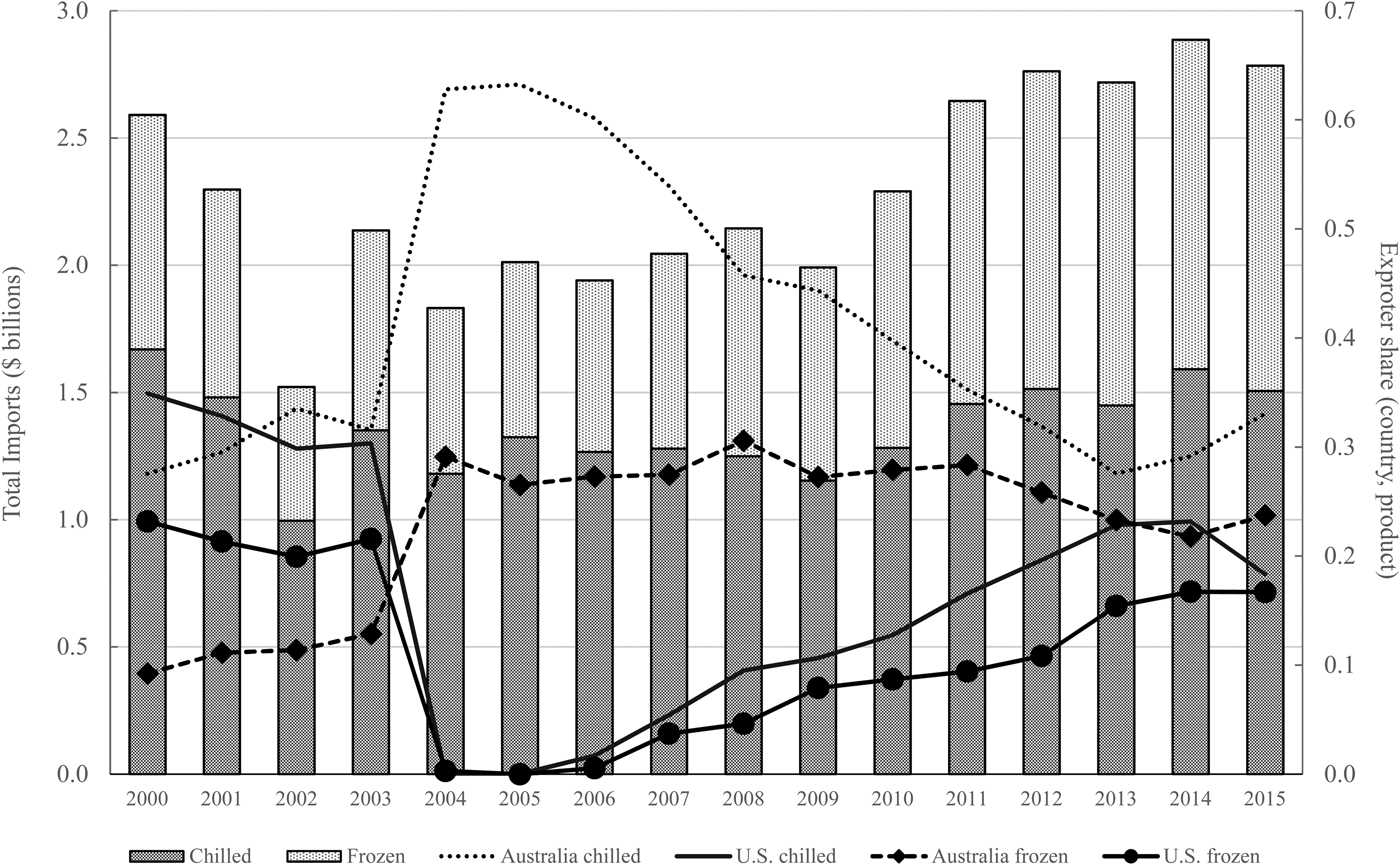
Figure 1 shows Japan's beef imports and shares by source and product in 2000–2015. In 2000, chilled and frozen beef imports were $2.6 billion, but sanitary concerns in the early 2000s caused imports to fall, bottoming out in 2002 ($1.5 billion). Since 2002, imports of frozen beef have increased steadily while chilled beef imports have remained relatively flat. In 2003, Japan temporarily banned all imports of U.S. and Canadian beef after the discovery of BSE. Exports were allowed to resume after 2005 with strict requirements on the age of cattle at slaughter, moderated to correspond to the World Organization for Animal Health (OIE) guidelines in 2013.Footnote 5 Although total beef imports exceeded pre-BSE ban levels for the first time in 2011, the composition of exporters was significantly altered. In 2000, the United States was the largest exporter of beef to Japan, accounting for 58 percent of the import market, followed by Australia, which held 37 percent of the market. The loss in U.S. market share during the ban was largely offset by gains for Australia. During the ban, Australia increased its share of the Japanese import market from 44 percent in 2003 to 92 percent in 2004. The United States steadily regained its share once Japan began to loosen import restrictions in 2006, increasing to 35 percent by 2015, while Australia's market share decreased to 56 percent.
Chilled and Frozen Beef Imports in Japan and Exporter Share: 2000–2015.
Import Demand Model and Forecasting
Following Clements and Theil (Reference Clements and Theil1978), Washington and Kilmer (Reference Washington and Kilmer2002), Muhammad, Amponsah, and Dennis (Reference Muhammad, Amponsah and Dennis2010), and Muhammad, McPhail, and Kiawu (Reference Muhammad, McPhail and Kiawu2012), we use the production version of the Rotterdam demand system to model beef demand in Japan beef by product and exporting source. We focus on imports, and do not include domestically produced beef products given data limitations and strong consumer differentiation between domestic and imported beef in Japan (Obara, McConnell, and Dyck Reference Obara, McConnell and Dyck2010).Footnote 6
Assume a Japanese firm imports m beef products from n countries in a two-step procedure. First, the firm decides how to allocate aggregate expenditure on beef imports across products and source countries given import prices. Second, the aggregate expenditure on beef imports is determined based on domestic and import prices. Let q and p denote quantity and price; let subscripts g and h denote product category; and i and j denote the exporting country. The demand for product g from exporting country i at time t can be expressed by the following allocation model:
 $$\bar w_{g_i t} Dq_{g_i t} = {\rm \theta} _{g_i} {DQ}_t + \mathop \sum \limits_{h = 1}^m \mathop \sum \limits_{\,j = 1}^n {\rm \pi} _{g_i h_j} Dp_{h_j t} + {\rm \mu} _{g_i t}. \eqno(1)$$
D is the log-difference operator, where for any variable x, Dx t = log x t − log x t−1.  $w_{g_i}$ is the expenditure share of product g from country i in total beef imports and is derived as: $w_{g_i} = {\rm }\left( {p_{g_i}q_{g_i}/\sum\nolimits_g {\sum\nolimits_i {p_{g_i}} } q_{g_i}} \right)$. $\bar w_{g_i} \;$ is the two-period average of $w_{g_i}$: $1/2\lpar w_{g_i t} + w_{g_i t - 1} \rpar$. DQ is the finite version of the Divisia volume index, which is a measure of aggregate expenditure (in real terms) on beef imports and is derived as: ${DQ}_t = \sum\nolimits_g {\sum\nolimits_i {\bar w_{g_i t} Dq_{g_i t}}}$.
The parameter  ${\rm \theta} _{g_i}$ is the marginal import share, which measures the share of an additional dollar of total expenditures allocated to product g from country i, and the parameter ${\rm \pi} _{g_i h_j}$ is the conditional price effect which measures how the price of product h in country j affects imports of product g from country i. ${\rm \mu} _{g_i}$ is a random error term.
Demand theory suggests the following restrictions on the parameters: 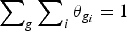 $\sum\nolimits_g {\sum\nolimits_i {{\rm \theta} _{g_i} = 1}}$ and $\sum\nolimits_g {\sum\nolimits_i {{\rm \pi} _{g_i h_j} = 0}}$ (adding up);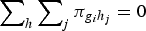 $\sum\nolimits_h {\sum\nolimits_j {{\rm \pi} _{g_i h_j} = 0}}$ (homogeneity); and ${\rm \pi} _{g_i g_j} = {\rm \pi} _{g_j g_i} \forall g$, ${\rm \pi} _{g_i h_i} = {\rm \pi} _{h_i g_i} \forall i$, and ${\rm \pi} _{g_i h_j} = {\rm \pi} _{h_j g_i} \;$(symmetry). Additionally, the matrix of conditional price effects ${\bf \Pi} = \left[{{\rm \pi} _{g_i h_j}} \right]$ should be negative semidefinite (negativity), which implies that ${\rm \pi} _{g_i g_i} \le 0\forall g_i \;$ (Laitinen Reference Laitinen1980). The import demand system defined by equation 1 satisfies adding-up by construction. The homogeneity and symmetry constraints must be imposed on the parameters. Negativity is verified by inspection.
From equation 1 we can derive the conditional expenditure elasticity, which is the percentage change in imports of product g from country i with respect to a percentage change in the aggregate expenditure on total imports:  ${\rm \varepsilon} _{g_i} ^{\ast} = \lpar Dq_{g_i} /{DQ}\rpar = \lpar {\rm \theta} _{g_i} /\bar w_{g_i} \rpar$. Similarly, we can derive the conditional own and cross-price elasticity, which is the percentage change in imports of product g from country i with respect to a percentage change in the price of product h from country j: ${\rm \eta} _{{g_i} {h_j}} ^{\ast} = \lpar Dq_{g_i} /Dp_{h _j} \rpar = \lpar {\rm \pi} _{{g_i} {h_j}} /\bar w_{g_{i}} \rpar$.
Following Theil (Reference Theil1980), the aggregate expenditure (total import demand) is expressed by the following Divisia index equation:
 $${DQ}_t = \displaystyle{{{\rm \gamma \psi}} \over {{\rm \gamma} - {\rm \psi}}} \lsqb{Dp_t^{\ast} - { DP}_t {\rm ^{\prime}}} \rsqb.$$
The variable p* denotes the domestic price and DP′ is the Frisch import price index defined as follows:
 $${DP}_t {\rm ^{\prime}} = \mathop \sum \limits_h \mathop \sum \limits_j {\rm \theta} _{h_j} Dp_{h_j t}. $$
The term γψ(γ − ψ) is the Frisch price effect and is assumed constant for estimation. ψ can be interpreted as a measure of cost-function curvature and is derived as (1/ψ) = 1 + (1/γ2)(∂2log C/∂(log Y)2). Y is firm output, C is total import cost, and γ is the elasticity of cost with respect to output. The Frisch price effect should be positive since an increase in the domestic price increases the resale value of imports, ceteris paribus. Note that a positive Frisch price effect also indicates an inverse relationship between the import price level and aggregate expenditure.
If we substitute equation 3 for the Frisch import price index in equation 2, and then substitute this into equation 1, we get the demand for an individual import with respect to the output price p*and import prices  $p_{h_j}$:
 $$\bar w_{g_i} Dq_{g_i} = {\rm \Theta \theta} _{g_i} \lsqb{Dp^{\ast} - \mathop \sum \limits_{h = 1}^m \mathop \sum \limits_{\,j = 1}^n {\rm \theta} _{h_j} Dp_{h_j}} \rsqb+ \mathop \sum \limits_{h = 1}^m \mathop \sum \limits_{\,j = 1}^n \pi _{g_i h_j} Dp_{h_j}. $$
 The error and t subscripts are omitted for convenience and Θ = γψ(γ−ψ) is the Frisch price effect. From equation 4 we can derive the domestic price elasticity, which is the percentage change in imports of product g from country i with respect to a percentage change in the domestic price:  ${\rm \eta} _{g_i p} = \lpar Dq_{g_i} /Dp^{\ast} \rpar = \lpar {\rm \Theta \theta} _{g_i} /\bar w_{g_i} \rpar$. We can also derive the unconditional own and cross-price elasticity, which is the percentage change in imports of product g from country i with respect to a percentage change in the price of product h from country j: ${\rm \eta} _{g_i h_j} = \lpar Dq_{g_i} /Dp_{h_j} \rpar = \lpar - {\rm \Theta \theta} _{g_i} {\rm \theta} _{h_j} /\bar w_{g_i} \rpar + \lpar {\rm \pi} _{g_i h_j} /\bar w_{g_i} \rpar$. The first term is the indirect effect $- {\rm \Theta \theta} _{g_i} {\rm \theta} _{h_j} /\bar w_{g_i}$, which is the effect of prices on imports through changes in the aggregate expenditure. The second term is the relative-price effect as measured by the conditional price elasticity ${\rm \pi} _{g_i h_j} /\bar w_{g_i}$, which accounts for the substitution effect of a price change and reflects the competiveness of an exporting country or product. These two effects are analogous to the income and substitution effects in consumer theory, but in the context of international trade, they respectively represent trade creation and diversion.
Import Demand Forecasting
Using the domestic price elasticity and unconditional own and cross-price elasticity, we project the impact of tariff reductions using an elasticity-based forecasting equation (Kastens and Brester Reference Kastens and Brester1996).
 $$q_{g_i(1)} = \left({{\rm \eta }_{g_ip}\left[ {\displaystyle{{\,p_{(1)}^{\ast} - p_{(0)}^{\ast} } \over {\,p_{(0)}^{\ast} }}} \right]} + {\mathop \sum \limits_h \mathop \sum \limits_j {\rm \eta }_{g_ih_j}\left[ {\displaystyle{{\,p_{h_j(1)} - p_{h_j(0)}} \over {\,p_{h_j(0)}}}} \right]}\right) q_{g_i(0)} + q_{g_i(0)}.$$
Equation 5 states that imports of product g from country i in the projection period 1 is a function of the quantity imported in the base period 0, and the percentage changes in the domestic price and product and source-specific import prices from period 0 to period 1.
Estimation and Results
We use monthly import and price data from the World Trade Atlas ® Database to estimate imported-beef demand in Japan by product and exporting source. To estimate total import demand (aggregate expenditure), we use the beef Consumer Price Index (CPI) provided by the Statistics Bureau of Japan as the domestic price.Footnote 7 Import values are in U.S. dollars, quantities in kilograms (kg), and prices in U.S. dollars per kg. To avoid issues from zero observations and unstable parameters due to the BSE-ban and recovery, we limit the data period to January 2007−December 2015. We disaggregate beef into two distinct product groups using the Harmonized System (HS) of commodity classification: chilled beef (HS 0201) and frozen beef (HS 0202). Since Australia and the United States account for most of Japan's beef imports, we focus on these two countries and aggregate the remaining exporting countries into a rest of world (ROW) category.
Summary statistics are reported in Table 1. During the period January 2007–December 2015, Australia was the largest beef exporter to Japan, averaging 15.48 million kg of frozen beef and 12.11 million kg of chilled beef per month. In terms of market share, chilled and frozen beef from Australia accounted for the larger share of Japan's beef imports on average (38 percent and 26 percent, respectively), followed by U.S. chilled and frozen beef (15 percent and 10 percent, respectively). Overall, U.S. beef is relatively more expensive than Australian beef, where both chilled and frozen beef are almost $1.00 more per kg, on average. Additionally, chilled beef tends to be more expensive than frozen beef from all sources.
Summary Statistics: January 2007–December 2015
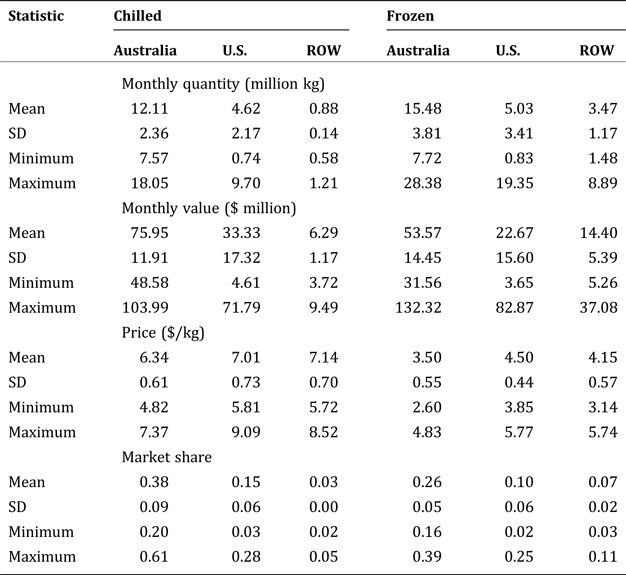
SD is the standard deviation. ROW is rest of world.
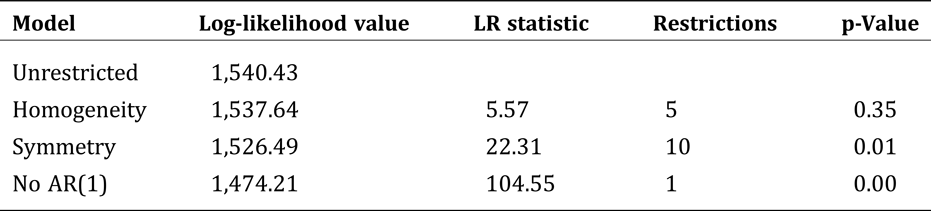
We estimate the import demand system represented by equation 1 using the generalized Gauss-Newton method in TSP (version 5.0), which is a maximum likelihood procedure for equation systems (Hall and Cummins Reference Hall and Cummins2005).Footnote 8 Due to the adding-up condition, the demand system is singular and requires mn − 1 equations for estimation. Estimates from the excluded equation can be recovered using the adding-up condition. The estimates for the entire system are the same regardless of which equation is excluded (Barten Reference Barten1969). We test and correct for autoregressive disturbances using a procedure for singular equation systems by Beach and MacKinnon (Reference Beach and MacKinnon1979). The homogeneity and symmetry restrictions are imposed on the model because theory-constrained estimates provide more accurate projections (Kastens and Brester Reference Kastens and Brester1996).Footnote 9
The conditional import demand estimates are reported in Table 2. Estimates of the marginal import shares (first column) are all positive and significant at the 0.01 level, reflecting the direct relationship between total expenditures and individual imports. The significant difference in estimates across products for each country supports the notion that import preferences differ by product as well as source. Take Australia for instance, the marginal share estimate for frozen beef (0.468) is more than three times the estimate for chilled beef (0.145). The own-price estimates are presented along the diagonal in Table 2, all of which are negative, which is consistent with theory. Four own-price estimates are significant: chilled beef from all sources and U.S. frozen beef. The cross-price estimates (off-diagonal elements) suggest that Australian and U.S. beef are substitutes by product; however, there is no evidence of substitution between chilled and frozen beef.
Conditional Import Demand Estimates
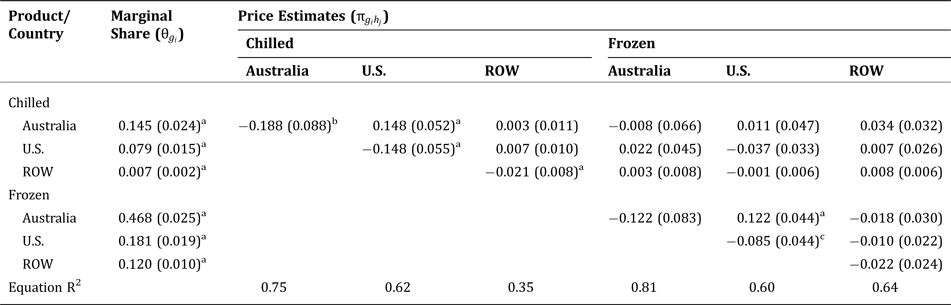
Homogeneity and symmetry are imposed on the model. Asymptotic standard errors are in parentheses. Superscripts a, b, and c denote the 0.01, 0.05, and 0.10 significance level, respectively. System R2 = 0.94. ROW is rest of world.
To estimate equation 2, we assume a separate domestic price and import price effect, as opposed to a single relative domestic/import price effect (Washington and Kilmer Reference Washington and Kilmer2002). Using Japan's beef CPI and the import price index, derived using the marginal share estimates according to equation 3, we estimate the following:
 $${DQ}_t = {\rm \Theta} _0 + {\rm \Theta} _1 Dp_t^{\ast} + {\rm \Theta} _2 DP_t {\rm ^{\prime}} + {\rm \mu} _t. $$
 The estimated output price ( ${\hat \Theta} _1 = 0.71$) and import price ( ${\hat \Theta} _2 = - 0.64$) effects have the correct signs and are both significant at the 0.10 level.Footnote 10
The expenditure ( ${\rm \varepsilon} _{g_i} ^{\ast}$), domestic price ( ${\rm \eta} _{g_i p}$), and conditional ( $\eta _{g_i h_j} ^{\ast}$) and unconditional own-price elasticities ( ${\rm \eta} _{g_i h_i}$) are reported in Table 3. Four of six conditional own-price elasticities are significant at the 0.10 level or lower with the following values: Australian chilled (−0.49), U.S. chilled (−0.96), ROW chilled (−0.68), and U.S. frozen (−0.82) beef. The unconditional own-price elasticities are relatively larger in magnitude for Australian (−0.99) and U.S. (−1.02) frozen beef, but are otherwise similar to the corresponding conditional elasticities. The expenditure elasticities for frozen beef (~1.8) are significantly larger than the estimates for chilled beef (~0.4) and reflect the relative growth in frozen beef imports during the period covered by our data. Since the domestic price elasticity is proportional to the expenditure elasticity, a rise in domestic prices should have a greater effect on frozen imports.
Conditional and Unconditional Elasticities
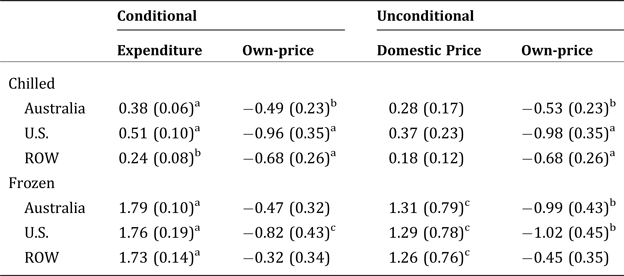
Asymptotic standard errors are in parentheses. Superscripts a, b, and c denote the 0.01, 0.05, and 0.10 significance level, respectively. ROW is rest of world.
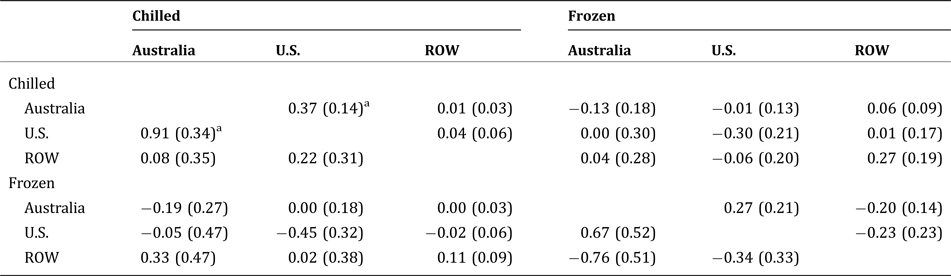
The unconditional cross-price elasticities (reported in the appendix) are mostly insignificant. The only exceptions are the Australia/U.S. (0.37) and U.S./Australia (0.91) chilled beef cross-price elasticities indicating that substitution occurs, even when accounting for the effect of prices on aggregate expenditure.
Import Demand Projections and Tariff Reform
In this section, we report the impact of tariff reductions on import demand. We use the three-year average (2012–2015) as the baseline and model tariff changes based on differences in the MFN and JAEPA tariff rates. First, we simulate the impacts of the JAEPA by adjusting tariffs on Australian beef. Given the JAEPA results, we then apply these same tariff reductions to U.S. beef. We conduct Monte Carlo simulations to obtain the mean and confidence intervals of import demand changes under these two scenarios. All results are reported in Table 4.
Import Projections Given Tariff Reductions on Australian and U.S. Beef
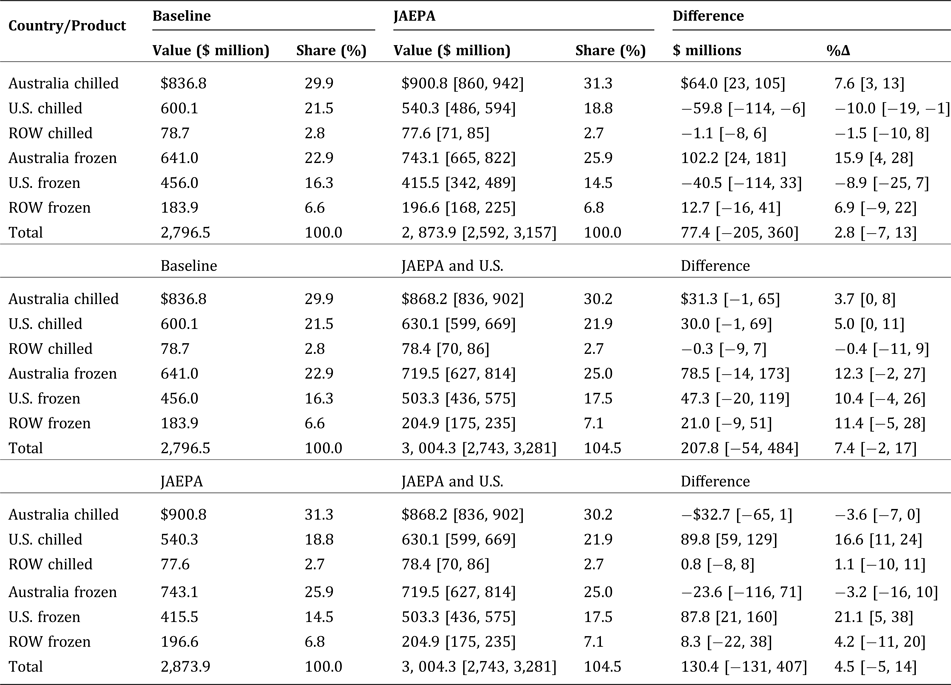
Baseline values are three-year annual averages: 2013–2015. All values are at baseline prices. 95 percent confidence intervals are in [brackets] and based on Monte Carlo simulations. ROW is rest of world.
The prevailing outcome of the JAEPA simulation is substitution toward Australian chilled and frozen beef and away from U.S. chilled and frozen beef. Imports of Australian chilled and frozen beef increases by $64 and $102 million, respectively, while imports of U.S. chilled and frozen beef fall. The biggest loss for the United States is nearly $60 million in chilled beef, with 95 percent confidence that this loss lies in the range of −$6 million to −$114 million. The expected loss for U.S. frozen beef in Japan is −$40.5 million but is not significant (between $33 and −$114 million with 95 percent confidence). There is a projected 2.8 percent increase in total beef imports, valued at $77.4 million. These results confirm that Japanese consumers will substitute toward Australian beef when the relative price of U.S. beef rises.
Next, we evaluate the opportunity provided by equivalent market access for the United States. Since the JAEPA has already entered into force, the relevant comparison is not to the baseline, but to the JAEPA scenario. This reveals the lost opportunity for U.S. beef exports from TPP withdrawal. When tariff reductions are applied to both Australia and the United States, not only are there increases in total beef imports in Japan, but the composition of imports is altered as well. Under this scenario, imports of U.S. chilled beef increase by 16.6 percent, corresponding to a value of $89.8 million, with 95 percent confidence that the increase will be between $59 and $129 million. Imports of U.S. frozen beef increase by an expected 21.1 percent ($87.8 million). The increase in beef imports from the U.S. makes up for declines in imports of Australian chilled (−3.6 percent), and Australian frozen beef (−3.2 percent). The total increase in Japanese beef imports under equal market access is higher than the case for JAEPA alone. Given the trade creation effect of tariff reductions, this is not surprising. However, in both scenarios, the confidence intervals suggest that the increase in total imports is not statistically different from zero.
Discussion and Conclusion
Our primary goal was to address the following question: given the implementation of the JAEPA, how much more important is market access for U.S. beef in Japan? Our estimates indicate that the competition between Australian and U.S. beef in Japan is such that relative price changes lead to significant tradeoffs when one country becomes relatively less competitive than the other. Thus, we conclude that the JAEPA will lead to significant gains for Australian beef at the expense of U.S. beef, other factors held constant. This signifies that U.S. withdrawal from TPP is now more important than before for the U.S. beef sector. Without expanded access to the Japanese beef market equivalent to that provided under JAEPA, our estimates show that the lost opportunity for the United States ranges from $59 to $129 million for chilled beef and $21 to $160 million for frozen beef.
The results of this study address key questions about the importance of market access and do not necessarily reflect the complete impact of JAEPA and TPP. For instance, we do not account for adjustments in other sectors such as pork and poultry, as well as the net effects of decreased exports to other destination markets. Also, given our modeling framework, we cannot account for the effects of tariffs on domestic prices. In addition, we do not account for any regulatory issues that create non-tariff barriers. However, these policies have remained mostly constant during the data period. The relaxation of the age limit on U.S. beef in 2013 from 21 to 30 months is an exception. That said, we do show that given the expected gains for Australia and losses for the United States, respectively, from implementation of the JAEPA, similar tariff concessions for the United States could at least mitigate the lost opportunity from TPP withdrawal. Overall, our research supports the view that market access for U.S. agricultural exports may be needed to counterbalance the effects of existing and pending agreements with competing countries.
Appendix
Likelihood ratio test results are reported in Table A1, the unconditional cross-price elasticities are reported in Table A2, and the seasonality estimates are reported in Table A3.
Likelihood Ratio Test Results
Unconditional Cross-Price Elasticity Estimates
Seasonality Estimates
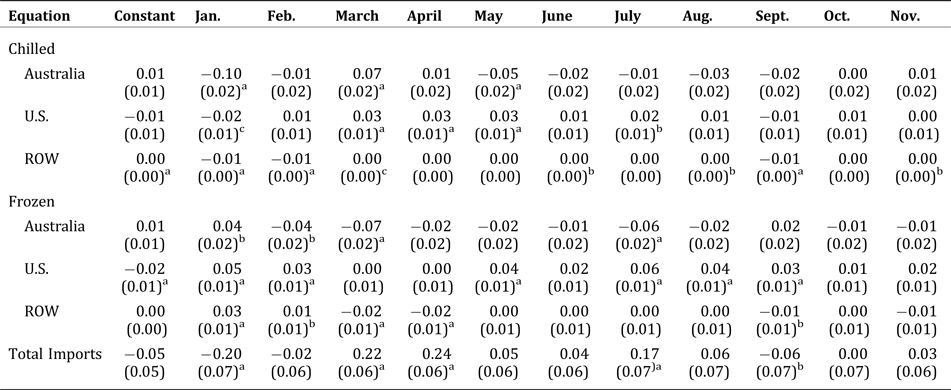
Here we discuss the seasonality estimates. All other results are discussed in the text. Note that the estimates in Table A3 reflect the differences in total and individual imports relative to the base month (December). These differences are unexplained by total expenditures or prices. It is interesting to note that the seasonality in total beef imports do not necessarily result in a similar pattern for individual beef products and that seasonality is more important for some imports than for others. For instance only three months (January, March, and May) are significant for frozen beef from Australia, whereas six months and the constant are significant for U.S. chilled beef.


 Open access

