

INTRODUCTION
As with any diagnostic test, antimicrobial susceptibility testing of bacterial isolates is subject to both random and systematic errors which lead to misclassification of isolates when categorizing them as ‘resistant’ or ‘non-resistant’ to different antimicrobial drugs. Procedural failures (e.g. sub-standard laboratory or sampling procedures), unpredictable responses due to biological variability in bacterial isolates, or other unrecognized (non-systematic or chance) sources of variability may all lead to diagnostic test errors [Reference Greenwood1, Reference Greenwood2]. Optimally, we would always choose to employ a highly accurate test that minimizes such errors, but other characteristics such as cost and availability can also influence the choice of testing method. For example, a test method with a lower, yet acceptable level of accuracy might be chosen for surveillance monitoring if the cost of testing per isolate is substantially lower allowing more comprehensive surveillance testing. Similarly, a test that is easy to perform and requires lesser investment in infrastructure may be chosen over testing methods that require the use of expensive automated laboratory equipment, even if there were measurable differences in test accuracy. This consideration may be of particular importance when conducting surveillance in regions of the world where economics and the lack of laboratory infrastructure can be impediments to developing comprehensive surveillance systems for antimicrobial resistance. However, it is always critical to objectively understand the differences in accuracy so that observed results can be properly interpreted to predict the unobserved true state of nature (e.g. true resistance status of individual isolates or resistance prevalence in populations).
Disk diffusion (DD) and broth microdilution (BM) are antimicrobial susceptibility testing techniques that both provide estimates of phenotypic susceptibility to antimicrobial drugs based on bacterial growth in the presence of varying concentrations of the antimicrobial. Standardized methods for conducting these tests have been established by several international bodies, including the Clinical and Laboratory Standards Institute (CLSI) [3]. When standardized methods are rigorously adhered to, both of these testing methods are considered to yield generally equivalent results regarding clinical breakpoints. Breakpoints used for clinical susceptibility classification [based upon minimum inhibitory concentration (MIC) for BM and zone diameter for DD] are also used in epidemiological surveillance. However, it has also been suggested that lower breakpoints using these same highly standardized methods may be better suited for the detection of emerging resistance in different ecological settings [Reference Kahlmeter4, Reference Simjee5].
The potential for errors in antimicrobial susceptibility testing is widely recognized. In fact, when considering testing by BM and DD, suspicious results obtained from DD are often considered to be confirmed, or refuted, by comparison to BM. While agar dilution is sometimes considered a ‘gold standard’ in antimicrobial susceptibility testing, BM is often used as an acceptable surrogate [Reference Metzler and DeHaan6–Reference Klement8]. In fact, BM is typically used as the reference when establishing breakpoint values for DD results by evaluating correlation of results and adjusting cut-offs using error rate bounding [Reference Kuper9, Reference Turnidge and Paterson10]. While national and international surveillance programmes have frequently used automated BM methods, material costs for these methods are greater than for DD testing, and automated systems that are used to evaluate large numbers of isolates in large surveillance programmes can be cost-prohibitive for other applications [11, 12].
The inherent assumption when a test is considered to be a ‘gold standard’ is that the test is perfectly accurate and that true classification status (e.g. resistance and non-resistance in susceptibility testing) is always correctly identified by the test. However, all diagnostic tests, including agar dilution and BM, are vulnerable to classification errors [Reference Enoe, Georgiadis and Johnson13]. Reference-based evaluations established on imperfect standards will always yield results that are biased to the extent that the reference test does not correctly identify the true classification status of isolates. The estimates of test accuracy of the new test can never exceed the misclassification probabilities inherent in the reference test that it is benchmarked against.
Obtaining accurate antimicrobial susceptibility information for bacterial isolates is critical in both clinical settings as well as in surveillance programmes [Reference Aarestrup14–Reference McEwen and Fedorka-Cray16]. Identifying trends of reduced susceptibility of bacterial populations to antimicrobial drugs is necessary to facilitate an appropriate understanding of the complexities of managing and reacting to antimicrobial resistance [Reference Greenwood2, Reference Vieira17, Reference Phillips18]. While it is possible to reduce the potential for errors through test selection and rigorous standardization of protocols, it is impossible to eliminate all errors. In order to more appropriately interpret results generated for either clinical or surveillance purposes, the potential for errors in detecting resistant and susceptible isolates must be understood and considered when evaluating test results [Reference Caprioli19, Reference Varaldo20]. Traditional measures of accuracy and predictive ability for diagnostic tests (epidemiological estimates of sensitivity, specificity and predictive values) are not typically estimated for antimicrobial susceptibility testing. Nevertheless, the parameters that help us understand other diagnostic tests can help in objective evaluation of test accuracy for susceptibility testing methods.
In contrast to evaluating diagnostic test accuracy using reference-based comparisons, newer methods of evaluation have been developed which allow estimation of the true, unbiased parameters related to test accuracy (i.e. sensitivity and specificity) in addition to unbiased estimates of prevalence without presuming to know the true classification of individual isolates. Because these methods attempt to model classification probabilities that are hidden from direct observation (i.e. true classification status as opposed to positive and negative test results), these are sometimes called ‘latent class’ analysis. The objective of this study was to estimate and compare the accuracy and predictive interpretation of results obtained using DD and BM methods when applied for surveillance of antimicrobial resistance in Escherichia coli and Mannheimia haemolytica in feedlot cattle.
METHODS
Study population
Bacterial isolates evaluated in this study were collected as part of a pilot project intended to develop and evaluate methods for surveillance of antimicrobial resistance in feedlots of beef cattle [21]. Details regarding the complete study population, sampling procedures, laboratory procedures, and interpretive criteria for antimicrobial susceptibility have been described elsewhere [21]. The isolates used in this study were purposefully selected from the entire dataset for the purpose of evaluating test sensitivity and specificity for detecting antimicrobial resistance. As such, this study was not intended to provide estimates of resistance prevalence for the cattle enrolled in the study or for other populations of cattle.
Cattle were enrolled from 17 September 2007 to 16 January 2010, and isolates included in this dataset were a non-probability sample of the isolates that had been evaluated for antimicrobial susceptibility using both DD and BM methods between 23 July 2008 and 8 July 2009. To meet an important assumption of the analysis method, isolates were stratified into two sample sets that were likely to have different resistance prevalences. Specifically, one population of isolates were recovered from samples collected at the time that cattle arrived at feedlots, and the second population included isolates recovered from animals later in the feeding period when cattle were handled as part of standard production practices. The resistance prevalences of these two sample sets were expected to be different since the latter had been recovered from cattle that had been at the feedlot for an average of 95·5 days (range 33–202 days, median 80 days) and were therefore more likely to have been exposed to antimicrobial drugs than had cattle that had only recently arrived at the feedlot [21]. It is assumed that test accuracy (sensitivity and specificity) was constant across different populations and was not biased by the sampling scheme.
The sampling and microbiological methods have been described elsewhere [21]. Briefly, individual cattle were restrained in chutes for routine management procedures when samples were collected for this project. Samples of faeces were recovered per rectum, and swab samples were collected from deep in the nasopharynx using 22-cm guarded swabs (no. J273, Jorgensen Laboratories Inc., USA). Swabs were cultured to recover M. haemolytica [Reference Alexander22], and faecal samples collected from cattle that were culture-positive for M. haemolytica were then cultured to recover isolates of non-type-specific E. coli (NTSEC) [Reference Alexander23]. Three to five isolates of M. haemolytica and 1–3 isolates of NTSEC were selected from each animal and tested for antimicrobial susceptibility by BM and DD methods using protocols that adhered to standards stipulated by CLSI [21]. The population and sampling structure was not accounted for in analyses since the study was not designed to produce generalizable estimates of resistance prevalence. The primary goal of the study was to evaluate test accuracy and factors affecting the correct classification of resistance are not systematically related to our sampling scheme. There were six drugs used to test both bacterial species using BM and DD [ampicillin, ceftiofur, streptomycin, sulfisoxazole, tetracycline, trimethoprim-sulfamethoxazole (TMP-SMX)], and two drugs were included on both drug panels used to test M. haemolytica (ampicillin and tetracycline) [21]. Breakpoints used to categorize susceptibility of isolates were obtained from interpretive criteria published by CLSI and have been described in detail elsewhere [21]. When possible, interpretive criteria that were specific for cattle and the test method/drug/bacteria combination were used (e.g. breakpoints for BM evaluating ceftiofur susceptibility in M. haemolytica). When these were not available, breakpoints for cattle regarding the drug and other bacterial species were used. If these were not available, then interpretive criteria published for humans regarding bacteria–drug combinations were used.
Data analysis
Data were evaluated graphically and by calculating descriptive statistics. For analysis purposes, isolate susceptibility was dichotomized as resistant or non-resistant (which included both intermediate and susceptible classifications). Resistance classification obtained from both testing methods was used to cross-classify isolates (i.e. resistant by both methods, non-resistant by both methods, and both discordant classifications). Stochastic latent class analysis (Markov chain Monte Carlo simulation using a Gibbs sampler; WinBUGS 1·4, 1996–2003, Imperial College and Medical Research Council, UK; freely available at http://www.mrc-bsu.cam.ac.uk/bugs/) was used to estimate the proportion of isolates correctly classified as being resistant to drugs (sensitivity) and the proportion of isolates correctly classified for non-resistance (specificity) by each testing method, as previously described [Reference Lunn24, Reference Branscum, Gardner and Johnson25]. Data were stratified into two sample sets based on time of sample collection as described. These models assumed that resistance classification using the two testing methods was conditionally dependent, which was accounted for in the models using code that was adapted from previously published information (http://www.epi.ucdavis.edu/diagnostictests/2dept2p.html; code available upon request). Convergence of each model was assessed by running six simultaneous chains with widely different starting values while monitoring history (time-series) plots, autocorrelation plots, and Brooks–Gelman–Rubin plots [Reference Branscum, Gardner and Johnson25]. Additionally, sensitivity analysis was performed by running models with both informative and non-informative prior probability distributions to evaluate posterior probability dependency. In all models, the initial 5000 iterations were discarded and the next 50 000 iterations were used to generate posterior probability distributions [Reference Enoe, Georgiadis and Johnson13, Reference Johnson and Gastwirth26]. The median estimates and the 95% probability intervals were reported from these posterior distributions. To evaluate whether the sensitivities or specificities were greater for one testing method vs. the other, a step function was used to generate one-sided probabilities. These probabilities were generated based upon the difference between iterates sampled from the joint posterior distributions. Additionally, an approximate method based on comparison of point estimates and probability intervals was used to help evaluate these comparisons of interest [Reference Schenker and Gentleman27]. Specifically, probability intervals which overlapped with the point estimate (median) of the other susceptibility test were used as an indication that the antimicrobial susceptibility tests were not different from one another in their ability to correctly classify true resistance or true non-resistance. Conversely, probability intervals which did not encompass the point estimate (median) of the other test were considered indicative of a statistically detectable difference between the tests (assumed probability of Type I error <0·05). The median estimates and their 95% probability intervals were also determined from posterior distributions regarding the positive and negative predictive values across a range of true prevalence values and then plotted to allow further assessment of information [Reference Altman and Bland28]. The predictive values of resistance (predictive value of a positive test) and the predictive values of non-resistance (predictive value of a negative test) were determined using code adapted for Monte Carlo simulated predictive values (http://www.epi.ucdavis.edu/diagnostictests/mcpvlr.html; code available upon request). In general, the estimates of sensitivity and specificity determined in the stochastic modelling were used with highly informative prior probability distributions for 14 prevalence values between 0% and 100% to generate posterior probability distributions for the predictive values.
Prior probability estimates
Beta distributions of probabilities were created with freely available software to represent the possible values for the prior antimicrobial resistance prevalences of sample sets 1 and 2 (BetaBuster; Table 1). For the DD susceptibility test, prior probability beta distributions (priors) for sensitivity and specificity were also established. Due to the assumed dependence between the susceptibility tests, the priors for sensitivity and specificity of the DD test were conditional on the BM priors. All priors, except for those regarding prevalences used to generate predictive values, were weakly informative with effective sample sizes (a + b; Table 1) under n = 10. Priors for resistance prevalences of NTSEC isolates in sample sets 1 and 2 were taken from a previous study [Reference Rao29]. For M. haemolytica isolates, relevant priors were only available for the sample set with higher prevalence of resistance (sample set 2). Therefore, the priors for resistance prevalences in sample set 2 were taken from a previous study and the estimates for sample set 1 were extrapolated as 5% lower than these estimates [Reference Watts30]. Since estimates of the sensitivity and specificity of DD or BM susceptibility tests have not been published, the authors arrived at a consensus opinion for reasonable estimates and a lower limit with 95% confidence. The DD sensitivity and specificity priors were assumed to be equivalent, and the conditional sensitivity and specificity priors of the BM test were assumed to be only slightly higher, but also equivalent. These prior estimates were the same for all antimicrobials assessed in the analysis.
Prior probability distributions for prevalence of antimicrobial resistance and for sensitivities and specificities of susceptibility tests

PI, Probability interval; TMP-SMX, trimethoprim-sulfamethoxazole.
* Parameters for the beta distributions were truncated to one significant digit for presentation in this table.
Sensitivity analysis
The influence of the priors used in Bayesian analyses was assessed by running the model with highly informative priors based on the same mode as the weakly informative priors that were used [31]. Additionally, widely varying distributions were created to assess the limits of model convergence. Without varying the original priors, starting values for the models were assessed by widely varying prevalence as well as sensitivities/specificities separately. The outcomes of the DD and the BM antimicrobial susceptibility tests were assumed to be dependent. Correlation between tests was monitored based on the calculated correlation value for each model. Additionally, a sensitivity analysis of the dependent models was run by assuming complete independence between tests in separate models [31].
RESULTS
Isolates
A total of 2316 NTSEC isolates from individual animal rectal samples and 783 M. haemolytica nasopharyngeal isolates were evaluated for susceptibility by both tests. Apparent prevalences for resistance were greater in NTSEC than M. haemolytica, and were greatest for tetracycline, sulfisoxazole and streptomycin (Table 2). Isolates in sample set 1 had widely different apparent prevalences of resistance to tetracycline, sulfisoxazole, and streptomycin than in sample set 2. However, the apparent prevalences for resistance were quite low for ceftiofur and TMP-SMX and not as disparate between the two sample sets for ampicillin, ceftiofur, and TMP-SMX.
Observed results for susceptibility testing of non-type-specific E. coli and M. haemolytica in two sample sets using broth microdilution and disk diffusion

TMP-SMX, Trimethoprim-sulfamethoxazole.
Test accuracy
Models for all combinations of organisms and antimicrobial drugs indicated that both antimicrobial susceptibility testing methods had high specificity and thus correctly classified a high proportion of non-resistant isolates (Table 3). However, probabilities for classification of true resistance (sensitivity) varied. Estimates regarding the ability to detect ceftiofur resistance were not well predicted in these analyses, as indicated by extremely wide probability intervals for classification of true resistance (sensitivity).
Probability of detecting true resistance and true non-resistance in bacterial isolates using broth microdilution and disk diffusion susceptibility testing
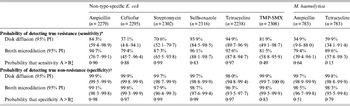
TMP-SMX, Trimethoprim-sulfamethoxazole; PI, probability interval.
* The probability of classifying isolates as resistant among isolates that are truly resistant.
† The probability of classifying isolates as non-resistant (susceptible or intermediate) among isolates that are truly non-resistant.
‡ One-sided probability comparing values for disk diffusion and broth microdilution: A = value that is numerically greater; B = value that is numerically lower.
For NTSEC isolates, DD generally had higher estimates than BM for correctly classifying non-resistance, but the tests had extremely high probabilities (>96%) for correct classification in all six drugs tested (i.e. both had high specificity; Table 3). Even though the differences between estimates for the two test methods were statistically detectable, the differences were small and may not have much biological relevance in many circumstances. The ability to correctly classify resistant isolates (i.e. estimates of sensitivity) was generally greater for BM and the magnitude of the differences between estimates may be practically meaningful in some applications (Table 3). However, one-sided probabilities regarding the likelihood that sensitivity estimates for the two susceptibility testing methods were truly different were generally lower than the corresponding specificity estimates for the same drugs. Further, the probability intervals for many of the drugs were quite wide suggesting sensitivity estimates for the two susceptibility tests cannot be detected statistically.
The same trends were found regarding correct classification of true resistance and true non-resistance to the two antimicrobials tested in isolates of M. haemolytica, although differences between estimates for the two tests were statistically detectable.
Predictive values for test results to correctly predict resistance and non-resistance
Depending on the antimicrobial drug being evaluated and the true prevalence of resistance, these results suggest that there would be some substantial differences in the confidence that users could have regarding how well these susceptibility tests were correctly classifying the true state of resistance and non-resistance in isolates (Fig. 1; Supplementary Figs S1–2, available online). For ampicillin, streptomycin, and sulfisoxazole resistance, the results indicated that the DD assay was better able to predict true resistance in isolates than BM when the prevalence of resistance in E. coli isolates was low. Conversely, when isolates were classified by susceptibility testing as non-resistant for these same three drugs, there was greater confidence that test results of BM correctly predicted true non-resistance when compared to DD if the true prevalence of resistance was high. For example, these estimates suggest that in a population of E. coli isolates where the true prevalence of resistance to streptomycin was 5%, the DD test would accurately predict true resistance status 93·1% of the time whereas the BM test would only correctly predict true resistance 68·6% of the time (Fig. 1). However, if the true prevalence of resistance to streptomycin was 70%, the DD test would correctly predict true non-resistance status 59·2% of the time, while the BM test would accurately predict non-resistance 76·8% of the time (Fig. 1).
[colour online]. Predictive values and 95% probability intervals for resistance (positive predictive value) and non-resistance (negative predictive value) to streptomycin by disk diffusion (diamond with solid lines) and broth microdilution (circle with dashed lines) in E. coli isolated from individual samples (n = 2302). Vertical lines denote the true prevalence of streptomycin resistance at low (5%) and high (70%) levels to illustrate large differences in predictive values between the two antimicrobial susceptibility tests. Lines without markers indicate the 95% probability intervals. (Colour online: blue solid lines for disk diffusion and red dashed lines for broth microdilution.)

In contrast, the susceptibility tests for ceftiofur, tetracycline, and TMP-SMX in E. coli isolates and for ampicillin and tetracycline in M. haemolytica had comparable predictive abilities across a wide range of true prevalence values (Fig. 2; Supplementary Figs S3–6). Although the predictive abilities of the two tests were not identical, differences were not large for these drugs. For example, the difference between the predictive abilities of DD (71·6%) and BM (69·0%) when the true prevalence of resistance to tetracycline was 5% was much smaller than this difference for streptomycin (Figs 1 and 2). Similarly, there was only a small difference in the predictive ability for non-resistant test results when the true prevalence of resistance to tetracycline was 70% (89·2% for DD vs. 84·8% for BM; Fig. 2).
[colour online]. Predictive values and 95% probability intervals for resistance (positive predictive value) and non-resistance (negative predictive value) to tetracycline by disk diffusion (diamond with solid lines) and broth microdilution (circle with dashed lines) in E. coli isolated from individual samples (n = 2238). Vertical lines denote the true prevalence of streptomycin resistance at low (5%) and high (70%) levels to illustrate large differences in predictive values between the two antimicrobial susceptibility tests. Lines without markers indicate the 95% probability intervals. (Colour online: blue solid lines for disk diffusion and red dashed lines for broth microdilution.)

Model convergence and sensitivity analysis
For each model, evidence for convergence was provided by the overlapping history (time-series) plots for six simultaneous chains, a relatively immediate drop to zero in autocorrelation plots, and overlapping lines with values of approximately 1 in Brooks–Gelman–Rubin plots [Reference Gelman and Rubin32]. Widely varied prior probability distributions and starting values had little influence on results obtained from all of the models. Correlation values obtained from the latent class models for the two tests were low (<0·3) for all models suggesting that there was a low or small amount of conditional dependence between the sensitivities and specificities of the tests. Additionally, this conclusion was supported by the fact that parameter estimates obtained from models which assumed conditional independence for the classification of true resistance and true non-resistance between the two susceptibility tests were generally similar to the estimates obtained from models which included parameters for conditional dependence (results not shown).
DISCUSSION
Results of this study indicate that DD and BM susceptibility tests generally had similar ability to correctly classify susceptibility status of the bacterial isolates evaluated in this study, although test sensitivities (ability to classify isolates as resistant when they were truly resistant) varied between tests more than the test specificities. Therefore, non-resistance (susceptible and intermediate classifications) results obtained by either method probably represents true non-resistance status of isolates, but isolates classified as resistant using these susceptibility tests have a greater likelihood of being incorrectly classified. Additionally, this ability to correctly classify resistance varied among the different antimicrobial drugs and between the two target bacteria. These findings add to the complexity of decisions that must be made when designing new surveillance programmes for antimicrobial resistance, and even when altering the panels of drugs that are used in these efforts. However, given that neither susceptibility testing method was generally superior to the other in providing accurate test results for all drugs and neither was superior in predicting true susceptibility status across all prevalences of resistance that might be encountered, other factors such as cost and availability may be valid reasons for choosing one test over the other, particularly in resource-constrained circumstances.
It is important to note that results of this study were heavily dependent upon the breakpoints that were used for classification of resistance and non-resistance. Established clinical breakpoints established by the CSLI for cattle were used whenever possible. However, there are not established breakpoints for all of the drugs included in the panel for this host species, and thus it was necessary to use breakpoints established for humans. This limitation is encountered whenever susceptibility is evaluated for drugs that are not commonly used in a particular host species, and would seem to be inevitable when performing surveillance in animals regarding drugs that are important in humans. The BM panel used in this study is widely used for surveillance purposes in North America, and this limitation is therefore not unique to this study.
Latent class methods are increasingly acknowledged as being superior to traditional reference-based evaluation of diagnostic tests, and are accepted as a valid approach by the OIE for estimation of sensitivity and specificity tests that are used in restricting international trade and movement of animals [33]. These models are particularly valuable because they do not require use of a reference test (i.e. a ‘gold standard’), but prior knowledge about the test accuracy can be readily incorporated into Bayesian analysis through the use of informative priors and Monte Carlo simulation to estimate joint posterior probabilities [Reference Enoe, Georgiadis and Johnson13]. These methods allow for estimation of theoretically unbiased estimates of test sensitivity, specificity, prevalences, and predictive values.
Typically, error rate bounding is used when comparing results of DD and BM especially when evaluating breakpoints for the DD assay, although there is not universal consensus about which specific method should be used [Reference Kuper9, Reference Turnidge and Paterson10]. Error rate bounding is a reference-based approach that is analogous to traditional methods of diagnostic test evaluation, and is susceptible to the same biases encountered whenever one test is considered a perfect standard. This study shows that new methods that are reliant upon reference-based comparison could provide an alternative approach for refining breakpoints that does not rely on assuming that one test is a perfect standard, albeit with the limitation that results would be classified dichotomously as in this study.
Our ability to understand the true susceptibility status of bacterial isolates is completely dependent on the ability of susceptibility testing methods to correctly identify resistance or non-resistance. Clinically, an accurate understanding of true resistance and true non-resistance is important for appropriately selecting antimicrobial drugs to control or prevent disease, while also adhering to principles of prudent use. Both BM and DD susceptibility tests have limitations in their methodology for adequately representing in vivo factors which contribute to therapeutic failures, such as stage of infection or physiological barriers. Information obtained from BM is often considered more clinically relevant than that obtained from DD because the MIC information can aid therapeutic decisions on drug selection, dose, and route of administration. However, this study has shown that misclassification of resistance (and non-resistance) in many of the antimicrobial drugs was equally likely with either BM or DD. A limited number of antimicrobial drugs were analysed in this study, but similar results in untested antimicrobial drugs may also be found.
On a larger scale, surveillance for antimicrobial resistance on a regional, national or even international level sometimes requires large numbers of isolates to be evaluated to meet surveillance objectives and ensure representative results. Depending on the scale of surveillance and the resources available to the relevant authority, the cost per test can become a key concern. High accuracy in surveillance is also necessary to confidently and efficiently respond to potential population-level antimicrobial resistance health threats [Reference Hui and Walter34]. Although economic analysis was beyond the scope of the current study, our results suggest that DD may represent an acceptable alternative to BM for surveillance programmes, especially considering costs differences and limited dilution ranges that are typically evaluated when using BM for surveillance efforts. Costs are generally much lower for DD testing than for BM, and there is more flexibility in switching antimicrobials in the test panel with DD. Additionally, the range of dilutions that can be evaluated with BM is often restricted by the number of wells on plates especially when attempting to perform surveillance using a large number of drugs. The epidemiological thresholds that are useful in describing emerging resistances are often much lower than the clinical breakpoints between resistance and non-resistance [Reference Kahlmeter4, Reference Simjee5, Reference Livermore, McGowan and Wale35]. In cases where lower prevalences of resistance need to be detected and large numbers of isolates tested for surveillance purposes, cost per test can be a limiting factor particularly in under-resourced countries.
The predictive values estimated in this study illustrate the importance of considering the expected prevalence of resistance when designing surveillance programmes. There were also some notable differences between the predictive values obtained using these testing methods, and this could be an important factor to consider when selecting a testing method for surveillance. In general, at very low prevalences, the predictive value for resistance (positive predictive value) will always be low while the predictive value for non-resistance (negative predictive value) is high [Reference Greiner and Gardner36]. Conversely, at very high prevalences, the predictive value for resistance will always be high while the predictive value for non-resistance is low. This principle applies generally to all diagnostic tests and has been previously noted relative to the interpretation of DD susceptibility tests [Reference Thrusfield37].
One of the assumptions of latent class analysis for two tests in two populations is that the two populations have different prevalences [Reference Branscum, Gardner and Johnson25]. This was a limitation in our study for results regarding ampicillin, ceftiofur, and TMP-SMX resistance since the prevalences of these antimicrobial drugs in sample set 1 were similar to their counterparts in sample set 2. Therefore, the parameter estimates for these antimicrobial drugs should not be considered as reliable as the other antimicrobial drugs with smaller probability intervals [Reference Toft, Jorgensen and Hojsgaard38]. Similar to reference-based evaluations of diagnostic tests, other general assumptions of latent class evaluations are the independence of observations and the conditional independence of the diagnostic tests [Reference Branscum, Gardner and Johnson25, 31]. We believe it was unreasonable to assume that these antimicrobial susceptibility testing methods were independent processes, and therefore modelled an additional parameter to account for the correlation in test results as previously described [Reference Branscum, Gardner and Johnson25, Reference Livermore, McGowan and Wale35]. However, relative to the independence of observations, more than one isolate was recovered per animal and included in these analyses but it was presumed that this did not violate this assumption as the ability to correctly classify resistance status was not systematically related to the sampling scheme; i.e. the probability of correctly classifying isolates was considered to be unrelated to the source of isolates. It is true that the resistance status of isolates obtained from the same animal may have been correlated and this would have affected prevalence estimates, but the likelihood that the susceptibility tests correctly classified the resistance status of an isolate was independent of source and therefore the estimates of sensitivity and specificity were unaffected; i.e., the propensity of a test to correctly classify an isolate's susceptibility was not affected by whether another isolate was tested from the same animal.
SUPPLEMENTARY MATERIAL
For supplementary material accompanying this paper visit http://dx.doi.org/10.1017/S0950268813003300.
ACKNOWLEDGEMENTS
We gratefully acknowledge Dr Trevor W. Alexander, Shaun R. Cook, and Lorna J. Selinger for their technical assistance regarding bacterial culture, isolation, and susceptibility testing at the Lethbridge Research Center, and Dr Danielle Daignault for technical assistance regarding susceptibility testing at the Public Health Agency of Canada. We also gratefully acknowledge Chelsea Flaig at Feedlot Health Management Services Ltd for coordinating sampling. This research was financially supported by the Advancing Canadian Agriculture and Agri-Food Program (grant no. AB0224); the Canadian Cattlemen's Association Beef Cattle Research Council (grant no. BCRC6.41); the Alberta Beef Producers (grant no. ABP 0007-038); and the Public Health Agency of Canada.
DECLARATION OF INTEREST
None.


