


Impact Statement
Veterinary fertility assessments are critical particularly for male animals used for breeding and artificial insemination since one male is typically used to inseminate thousands of females. Current methods for initial assessment of sperm quality through manual laboratory inspection can be laborious, time consuming, subjective and prone to error, whereas automated sperm analysers and computer-assisted sperm analysis (CASA), which depend on complex imaging techniques and algorithms, are costly. Given that sperm, being swimming organisms that generate propulsion by beating their flagella tails, influence the viscosity of the environment they are suspended in due to their motility, we show that the time it takes for an elongated filament of a semen sample to thin and snap under surface tension and viscoelastic forces correlates strongly with the concentration of motile sperms in the sample. As such, we have found that this single measure, which is rapidly evaluated with a novel chipscale acoustofluidic device, can be used as a substitute for individual CASA measurements of sperm viability, motility and concentration for potentially assessing the fertility of veterinary semen samples.
1. Introduction
Infertility can affect the breeding outcomes of large herds of animals. The significance of male infertility – which accounts for 40 %–50 % of cases (Reference Kumaresan, Gupta, Datta and MorrellKumaresan, Gupta, Datta, & Morrell, 2020), a considerable proportion of which can be attributed to low semen quantity or quality (Reference DeJarnette, Marshall, Lenz, Monke, Ayars and SattlerDeJarnette et al., 2004) – is particularly amplified as the semen from a male is used to artificially inseminate thousands of females, leading to significant losses for farmers (Reference Kumaresan, Gupta, Datta and MorrellKumaresan et al., 2020). As such, veterinary fertility assessments are critical, especially for male animals used for breeding and artificial insemination in the livestock industry (Reference Chenoweth and McPhersonChenoweth & McPherson, 2016; Reference Veeramachaneni, Ott, Heath, McEntee, Bolt and HixonVeeramachaneni et al., 1986). In particular, the evaluation of semen health is not just vital in successfully establishing pregnancy, but also in facilitating genetic improvement (Reference DiskinDiskin, 2018), attaining breeding and milk, and in meeting production objectives (Reference Braundmeier and MillerBraundmeier & Miller, 2001; Reference HarrisHarris, 1970; Reference Selvaraju, Parthipan, Somashekar, Binsila, Kolte, Arangasamy and KrawetzSelvaraju et al., 2018).
Owing to the need for manual microscopic inspection and the lack of standardised procedures, conventional methods for semen analysis are, nevertheless, labour intensive and hence costly, in addition to being predisposed to operator subjectivity, variability and error (Reference Jørgensen, Auger, Givercman, Irvine, Jensen, Jouannet and SkakkebœkJørgensen et al., 1997; Reference Nosrati, Graham, Zhang, Riordon, Lagunov, Hannam and SintonNosrati et al., 2017; Reference Yu, Rubin, Geevarughese, Pino, Rodriguez and AsgharYu et al., 2018). Automated sperm analysers and computer-assisted sperm analysis (CASA) systems have therefore been developed in an attempt to make assessments more objective and rigorous, although these typically involve large, expensive and high-maintenance equipment (Reference Nosrati, Graham, Zhang, Riordon, Lagunov, Hannam and SintonNosrati et al., 2017; Reference Yu, Rubin, Geevarughese, Pino, Rodriguez and AsgharYu et al., 2018). In addition, CASA involves multistep procedures and requires low number concentration sperm samples to be analysed in batches due to limitations associated with the small field-of-view (Reference Zhang, Khimji, Gurkan, Safaee, Catalano, Keles and DemirciZhang et al., 2011). Image-based microscopy analysis is further fraught with difficulties as many effects (e.g. Brownian motion, aggregation, collective hydrodynamic motion, presence of non-sperm objects such as debris, track fragmentation due to collision, specimen ‘drift’, contiguous digitisation) can confound motility tracking. This is compounded by considerable laboratory variation (more than 90 % of laboratories were found to have failed conformity in a recent survey, and only approximately 10 % have met the  $\pm 10\,\%$ in uncertainty of measurement requirements in two recent global audits (Reference Mortimer, van der Horst and MortimerMortimer, van der Horst, & Mortimer, 2015)), owing to the lack of standardisation in testing parameters and procedures, in addition to poor procedural compliance (Reference Brazil, Swan, Drobnis, Liu, Wang, Redmon and OverstreetBrazil et al., 2004). As a consequence of this well-known problem (Reference Bailey, Fenning, Chamberlain, Devlin, Hopkisson and TomlinsonBailey et al., 2007; Reference Keel, Quinn, Schmidt, Serafy, Serafy and SchalueKeel et al., 2000) that ‘the results of conventional semen analysis do not always correlate with field fertility outcomes’ (Reference Kumaresan, Gupta, Datta and MorrellKumaresan et al., 2020), there is generally ‘low level of confidence in current diagnostic semen analysis’ (Reference TomlinsonTomlinson, 2016) and the goal of a ‘one-test evaluation’ has proven elusive (Reference Tanga, Qamar, Raza, Bang, Fang, Yoon and ChoTanga et al., 2021).
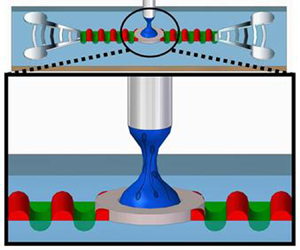
In this work, we report a novel method for sperm quality assessment based on an acoustically driven microfluidic extensional rheometry (ADMiER) platform (Reference Bhattacharjee, McDonnell, Prabhakar, Yeo and FriendBhattacharjee, McDonnell, Prabhakar, Yeo, & Friend, 2011) that can potentially circumvent these limitations. Modern extensional rheometers exploit capillary thinning of jets (Reference Keshavarz, Sharma, Houze, Koemer, Moore, Cotts and McKinleyKeshavarz et al., 2015), slender filaments (Reference McKinley and SridharMcKinley & Sridhar, 2002) and liquid bridges (Reference Anna and McKinleyAnna & McKinley, 2001; Reference Campo-Deaño and ClasenCampo-Deaño & Clasen, 2010; Reference Dinic, Zhang, Jiminez and SharmaDinic, Zhang, Jiminez, & Sharma, 2015; Reference Tuladhar and MackleyTuladhar & Mackley, 2008) to extract the extensional viscosity of complex fluids. The ADMiER platform utilises focussed pulses of nanometre-order amplitude high-frequency electromechanical waves in the form of Rayleigh surface acoustic waves (SAWs) (Reference Friend and YeoFriend & Yeo, 2011) propagating on a chipscale piezoelectric substrate (see inset of figure 1b) – which have been demonstrated to date as a powerful tool for microfluidic actuation and manipulation (Reference Destgeer and SungDestgeer & Sung, 2015; Reference Ding, Li, Lin, Stratton, Nama, Guo and HuangDing et al., 2013; Reference Go, Atashbar, Ramshani and ChangGo, Atashbar, Ramshani, & Chang, 2017; Reference Yeo and FriendYeo & Friend, 2014) – to rapidly jet (Reference Biroun, Rahmati, Jangi, Chen and FuBiroun, Rahmati, Jangi, Chen, & Fu, 2021; Reference Connacher, Orosco and FriendConnacher, Orosco, & Friend, 2020; Reference Darmawan and ByunDarmawan & Byun, 2015; Reference Jangi, Luo, Tao, Reboud, Wilson, Cooper and FuJangi et al., 2019; Reference Lei and HuLei & Hu, 2020; Reference Li, Gong, Wu, Chen, Xia, Liu and GuoLi et al., 2020; Reference Tan, Friend and YeoTan, Friend, & Yeo, 2009) a sessile liquid microlitre droplet towards a top opposing surface (in this case, the head of a pin, as shown in figure 1a,b) in order to form a liquid bridge filament, which subsequently thins until it eventually pinches and breaks up. Like its macroscopic counterpart, the capillary breakup extensional rheometer (CaBER) (Reference Anna and McKinleyAnna & McKinley, 2001), ADMiER's filament thinning dynamics is governed by a balance of capillary, inertial and viscous stresses, from which it is possible to extract the extensional viscosity of the liquid (Reference Bhattacharjee, McDonnell, Prabhakar, Yeo and FriendBhattacharjee et al., 2011), therefore demonstrating its utility for rheological characterisation of a broad range of Newtonian and viscoelastic fluids. This includes dilute to highly concentrated polymeric suspensions (Reference McDonnell, Jason, Yeo, Friend, Cheng and PrabhakarMcDonnell et al., 2015b), which can be challenging with conventional extensional rheometers, such as CaBER, due to their difficulty in consistently generating liquid bridges for low viscosity fluids (Reference Rodd, Scott, Cooper-White and McKinleyRodd, Scott, Cooper-White, & McKinley, 2005; although we note the possibility of utilising a slow retraction method to circumvent this difficulty (Reference Campo-Deaño and ClasenCampo-Deaño & Clasen, 2010)), or the Rayleigh–Ohnesorge jetting extensional rheometer (ROJER) (Reference Keshavarz, Sharma, Houze, Koemer, Moore, Cotts and McKinleyKeshavarz et al., 2015), given its requirement for large sample volumes.
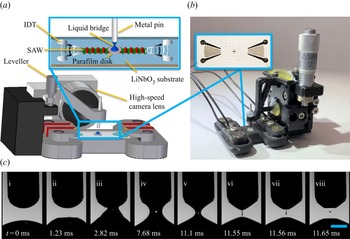
(a) Schematic illustration (not to scale) and (b) image of the ADMiER platform that comprises the SAW jetting device (shown in the inset) on which a microlitre drop of the semen sample was placed at the focal point in between a pair of focussed interdigital transducers (IDTs), constrained by a hydrophobic barrier imposed by a thin Parafilm disk. Excitation of the SAW by applying an AC electrical signal at the resonant frequency to the IDTs jets the liquid to the metal pin, whose height is controlled by a leveller, resulting in the formation of a liquid bridge filament that spans the SAW device and pin. The filament thinning dynamics is captured using a high-speed video camera. (c) Sequence of images showing (i–iii) the generation of a jet from a sessile drop under the focussed SAW pulse at time  $t=0$, which upon contact with the top surface (pin), (iv,v) forms a liquid bridge filament that (vi) subsequently thins, and, (vii, viii) eventually pinches and breaks up. The scale bar represents a length of approximately 0.5 mm.

Motivated by ADMiER's diagnostic capability for aetiologic stratification of tear film dysfunction (Reference McDonnell, Lee, Makrai, Yeo and DownieMcDonnell, Lee, Makrai, Yeo, & Downie, 2019), as well as preliminary observations showing its ability to characterise the rheological behaviour of motile microorganisms (Reference McDonnell, Gopesh, Lo, O'Bryan, Yeo, Friend and PrabhakarMcDonnell et al., 2015a), we examine its use as a tool to rapidly analyse veterinary semen quality so as to conceptually demonstrate its potential utility to be developed as a low-cost and compact field-use surrogate to existing laboratory sperm analysers, including CASA. More specifically, we show that ADMiER's filament thinning dynamics, in particular, the filament breakup time, of bull semen samples closely correlates with the motile sperm concentration of the semen sample, and hence can be used as a proxy for the measurement of this parameter using CASA or a haemocytometer, without the need to separately resolve for individual dependencies on each of the sperm parameters once calibration standards are established. By quantifying a critical value for the filament breakup time against the minimum value for the concentration of motile cells that constitutes a fertile semen sample commonly accepted by the cattle breeding industry, we then subsequently verify the platform's diagnostic capability potential for initial fertility assessment by analysing a battery of blind random samples with respect to OpenCASA (Reference Alquézar-Baeta, Gimeno-Martos, Miguel-Jiménez, Santolaria, Yániz, Palacín and Pérez-PéAlquézar-Baeta et al., 2019) measurements.
2. Methods
2.1 Sperm sample preparation
Straws containing bull semen (ABS Global, Bundoora, Victoria, Australia) were stored in liquid nitrogen until used. Prior to each experiment, the contents of three straws (approximately, 600  $\mathrm {\mu }$L of semen in total) were thawed at 37
  $^{\circ }$C and transferred to a single Eppendorf tube (Eppendorf South Pacific Pty. Ltd., Macquarie Park, New South Wales, Australia) where they were held at the same temperature for 30 min, and subsequently centrifuged at 1500 r.p.m. for 10 min. Following centrifugation, the sample comprises a biphasic solution in which the top layer consists of seminal liquid mostly devoid of sperm (
 ${<} 10^6$ cells mL
 $^{-1}$), whereas the bottom layer consists of a sludge-like mix of sperm and other germ cells and debris found in semen. A volume of 60
  $\mathrm {\mu }$L (approximately 10 % of the original volume and around 10 times the concentration of the contents of the straw) of the bottom layer was then extracted to prepare sperm samples with different concentrations.
The extract was first mixed with seminal plasma in various ratios to mimic natural samples with different sperm concentrations. The samples were further diluted to a ratio of one part sperm/seminal liquid to two parts buffer and mixed again to ensure a homogeneous suspension; a more detailed protocol of the buffer preparation steps has been reported elsewhere (Reference Gai, Nosrati and NeildGai, Nosrati, & Neild, 2020). To assess the viability of the sperms in the samples, 7.5  $\mathrm {\mu }$L of propidium iodide and 7.5
  $\mathrm {\mu }$L of 50-fold diluted SYBR14 dye in dimethylsulphoxide (DMSO), both from a LIVE/DEAD
 $^{\rm TM}$ Sperm Viability Kit (Thermofisher Scientific Pty. Ltd., Scoresby, Victoria, Australia), were added to 1.5 mL of the buffer, which was later used to dilute the sperm samples. The suspension was then placed in a digital dry bath incubator (230 V #1660563EDU; Bio-Rad Laboratories, Hercules, California, USA) at 37
  $^{\circ }$C to complete the cell staining procedure. The final proportion of sperm cells in each suspension after all of the dilution steps led to concentrations in the range
  $2.4 \times 10^6$ to
  $235.0 \times 10^6$ cells mL
 $^{-1}$ (cf., the original concentration range of
  $0.8 \times 10^6$ to
  $77.6 \times 10^6$ cells mL
 $^{-1}$ prior to the centrifugation and dilution steps).
2.2 Sperm concentration, viability and motility analysis
Each sample was placed between a microscope glass slide (7101-BP; Livingstone, Mascot, NSW, Australia) and coverslip (Menzel Deckgläser Stärke I; ThermoFisher Scientific, Waltham, Massachusetts, USA) for optical analysis. Then  $30 \pm 2$ s of video footage was acquired at imaging speeds ranging from 15 to 1000 f.p.s. under confocal fluorescence microscopy (N-STORM Super-Resolution Microscope; Nikon Corp., Tokyo, Japan) at
  $20\times$ magnification (488 and 561 nm emission wavelengths).
The first image frame of each video was analysed for the total cell count and cell viability using the viability module in the OpenCASA plugin on ImageJ (National Institutes of Health, Bethesda, Maryland, USA). Each image captured both live (green) and dead (red) sperm cells in the sample simultaneously and was acquired at three different locations per sample to constitute triplicate measures, from which mean values of the total cell count (sum of both live and dead cells) and the cell viability were obtained. For the parametric study where we examine the evolution of filament diameter with time for different sperm viabilities at a fixed concentration, we placed a copper wire into the sample and left it immersed for varying durations up to an hour to inactivate the sperm before conducting the experiment.
The motile sperm concentration, on the other hand, was computed indirectly from the volume of the sample deposited between the microscope slides within the lens field-of-view (1.3 nL), and analysing the entire video footage using the motility module in OpenCASA, from which the average path velocity  $V_{AP}$ for each sperm trajectory is determined. The number of motile sperms in the sample can then be determined by taking the area under the
  $V_{AP}$ histogram.
The sperm count and concentration was also independently measured using a haemocytometer. The sperm cells were first placed in a  $-$80
$-$80  $^{\circ }$C freezer for 15 min to ensure cessation of all cell motion, before restoring them back to room temperature in a digital dry bath. The samples were then loaded into a haemocytometer (Bright-Line; Hausser Scientific, Horsham, Pennsylvania, USA) to estimate the total cell concentration in the sample using the Neubauer chamber method (Reference Louis and SiegelLouis & Siegel, 2011) with the aid of a brightfield microscope (Eclipse Ci; Nikon Corp., Tokyo, Japan).
2.3 ADMiER
The chipscale SAW device shown in figure 1(a) consisted of a  $23\ {\rm mm} \times 10\ {\rm mm} \times 0.5\ {\rm mm}\ 128^{\circ }\ Y$–
 $X$ cut LiNbO
 $_3$ piezoelectric substrate patterned with an opposing pair of elliptical (20 fingers of 0.45 eccentricity and 2.5 mm focal length) metal (400-nm-thick Al with 10-nm-thick Cr as the adhesion layer) IDTs via standard photolithography processes detailed elsewhere (Reference Qi, Yeo and FriendQi, Yeo, & Friend, 2008; Reference Shilton, Tan, Yeo and FriendShilton, Tan, Yeo, & Friend, 2008). The wavelength (
 $\lambda \approx 130\ \mathrm {\mu }$m) and hence resonant frequency of the device (
 $f = 30.4$ MHz) is controlled by the gap and spacing of the IDTs, which correspond to
  $\lambda /4$.
To facilitate precise placement and containment of the sample drop to be jetted, a 0.26-mm-thick hydrophobic, doughnut-like circular barrier with inner and outer diameters of approximately 2 and 4 mm, respectively, made by manually punching a hole into two stacked Parafilm sheets (PM-996; Sigma-Aldrich Pty. Ltd., Castle Hill, New South Wales, Australia), was pressed onto the geometric centre of the SAW chip, which also corresponded with the focal point of the opposing focussed SAWs. To hold the SAW device in place, we three-dimensionally printed the platform shown in figures 1(a) and 1(b) which integrated a metal pin whose flat head constituted the opposing surface to which the sample is jetted; the height of the pin and hence that of the opposing surface is preadjusted with a leveller to ensure the liquid bridge filament breaks up in a repeatable manner (typically between 1–2 mm); prior testing has indicated that the jetting is relatively insensitive to operational variables and environmental conditions such as temperature (15  $^{\circ }$C–35
  $^{\circ }$C) and humidity. The platform also includes a port to accommodate the lens (K2 Objective CF-4, Edmund Optics Inc., Barrington, New Jersey, USA) that was mounted onto a high-speed video camera (SA5; Photron Ltd., Tokyo, Japan) used to image the filament thinning dynamics. Illumination was facilitated by mounting a light source (SugarCUBE
 $^{\rm TM}$ 38000-M03-005; Nathaniel Group Inc., Vergennes, Vermont, USA) on the other side of the liquid bridge opposite the lens.
A 1.5  $\mathrm {\mu }$L droplet of the semen sample, stored in a 37
  $^{\circ }$C digital dry bath until required upon which it is shaken to ensure homogeneity and redistribution of any evaporated content, is pipetted onto the SAW chip at the location specified by the Parafilm disk. To jet the droplet, we subsequently subject it to a focussed standing SAW burst by imposing onto the IDTs a 1.5 ms resonant sinusoidal electrical pulse (voltage range between 13.6 and 18.9
  $V_{rms}$), produced through a signal generator (N9310A; Keysight Technologies Pty. Ltd., Mulgrave, Victoria, Australia) and amplifier (ZHL-5W-1+; Mini-Circuits, Brooklyn, New York, USA). The SAW bursts were repeated 10 times at 100 ms intervals to generate 10 singular filament formation and collapse events to constitute 10 replicates, whose data we average for every sample analysed. The pulses were synchronised with the high-speed video camera operating at a frame rate of 62 kf.p.s., which allowed us to temporally track the diametric decay of the filament at its neck by analysing the pixels in each image frame. We discard initial transients until the neck of the filament (i.e. the thinnest point along the filament) thinned to a diameter of 36 pixels (approximately 0.18 mm), which constituted the initial time
  $t=0$ for each run.
2.4 Statistical analysis
To estimate the minimum number of blind random samples required to adequately benchmark ADMiER's diagnostic capability for predicting the sperm quality against OpenCASA with respect to commonly accepted minimum values for fertility used by the cattle breeding industry, we used the means for the two populations of pilot samples (fertile and infertile) and the common standard deviation of the populations combined. For a power of 90 % and  $\alpha = 0.05$ for a two-sided test, the minimum size required for each sample was
  $n = 16$.
3. Results and Discussion
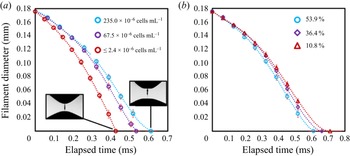
Figure 2(a) plots the evolution of the ADMiER filament neck diameter with time for three semen samples with different sperm concentrations. It can be seen that the thinning of the filament under capillary action is typically delayed for more concentrated samples due to an increase in the viscosity of the sample. As such, we observe the breakup time, i.e. the time at which the filament pinches and ruptures (essentially the elapsed time when the diameter in figure 2a reaches zero), to increase correspondingly with the concentration of the sample. In addition, the motility of the sperms in the sample is also known to influence the filament thinning dynamics (Reference McDonnell, Gopesh, Lo, O'Bryan, Yeo, Friend and PrabhakarMcDonnell et al., 2015a). This is because sperms propel themselves forward with their flagella tails, therefore collectively acting as a suspension of active self-propelled particle entities that exert a net propulsive thrust along their principal axis to generate a positive hydrodynamic dipole flow field (Reference Lauga and PowersLauga & Powers, 2009). Consequently, viable sperms that are motile act to decrease the effective viscosity of the suspension, thereby accelerating the capillary thinning of the filament (Reference McDonnell, Gopesh, Lo, O'Bryan, Yeo, Friend and PrabhakarMcDonnell et al., 2015a), as can be seen in figure 2(b). It is thus the influence of these two characteristics, i.e. sperm concentration and motility, on the filament thinning dynamics that motivates the potential for exploring the ADMiER breakup time as a proxy for motile sperm concentration measurements with the haemocytometer – which is arguably the most common and reliable technique for laboratory cell number concentration measurements, or CASA. In doing so, we also aim to demonstrate the utility of the ADMiER platform for assessing sperm quality. Parenthetically, we note that while we have employed the breakup time as the proxy measure, given ADMiER's filament thinning dynamics for sperm suspensions follow the behaviour of a generalised Newtonian fluid with strain-rate dependent viscosity (Reference McDonnell, Gopesh, Lo, O'Bryan, Yeo, Friend and PrabhakarMcDonnell et al., 2015a), we note that it could very well be possible that the sperm's orientation under the extensional flow could result in an active viscoelastic response. The possibility of utilising the semen's relaxation time for characterising sperm motility and hence as an alternative proxy measure, however, is a subject worthy of a separate study.
Evolution of the filament diameter with time for bull semen samples with (a) varying sperm concentrations and (b) varying sperm viabilities for a fixed concentration ( $235\times 10^6$ cells mL
 $^{-1}$). The insets in (a) show representative images of the filament at the point of breakup. Each ADMiER datapoint comprised an average of 10 individual measurements.

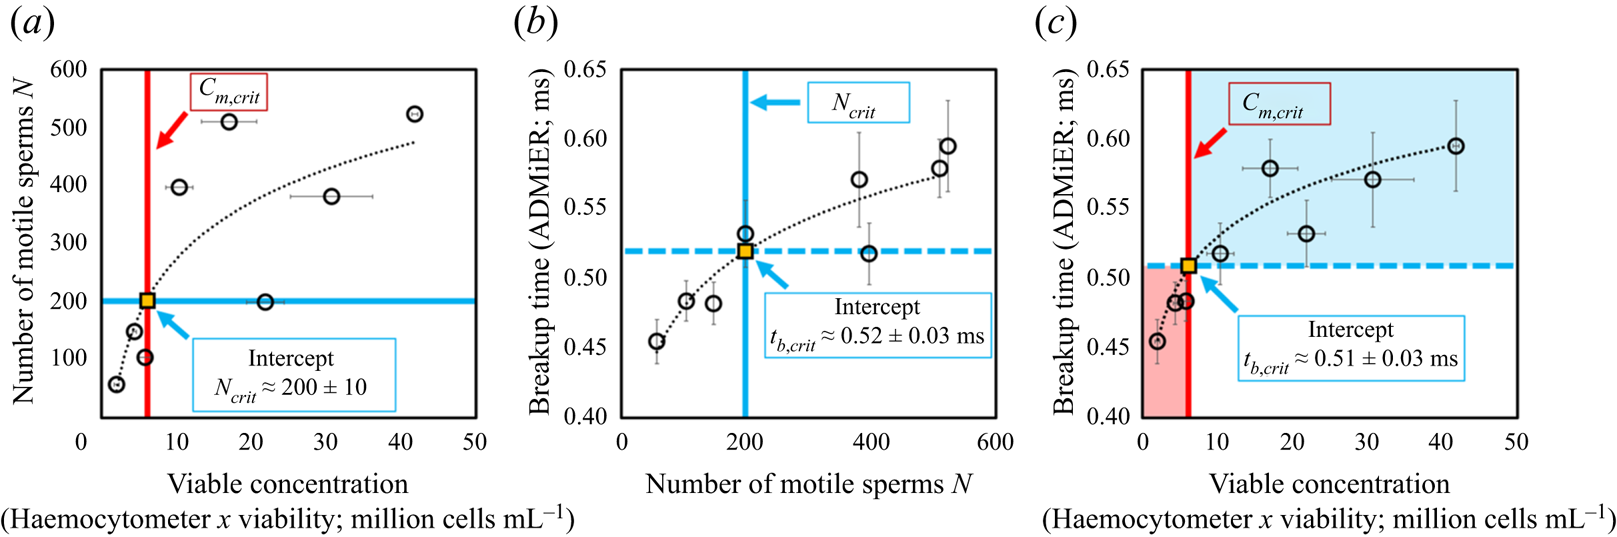
To establish that the breakup time constitutes a reasonable substitute for motile sperm concentration measurements, and, in doing so, demonstrating ADMiER's diagnostic capability for evaluating sperm quality, a criterion of what constitutes a ‘normal’ or fertile sample needs to be incorporated. Given the absence of an absolute cut-off value that constitutes a definitive threshold for male fertility (Reference Murray, James, McGeady, Reed, Kuang and NangiaMurray et al., 2012), we employ commonly adopted guidance used by the cattle breeding industry of  $15 \times 10^6$ cells mL
 $^{-1}$ as the minimum sperm concentration for fertile samples, of which at least 40 % are to be motile (S. de Graaf, personal communication 2022). It should be mentioned that there are no published minimum fertility reference values to assess the quality of frozen–thawed bull semen straws used for artificial insemination. While the Society for Theriogenology manual (Reference Koziol and ArmstrongKoziol & Armstrong, 2018) specifies a progressive motility of 30 %, these are minimum values with reference to the conduct of breeding soundness evaluations. We have opted in this study to adopt indicative values commonly used in the cattle breeding industry that were recommended by an expert (S. de Graaf, personal communication 2022). We note that this does not preclude the use of other values (which would also vary with different animal species) that would simply alter the critical breakup time. Regardless of the actual values used, it will be seen that the results obtained remain qualitatively valid in demonstrating broad proof-of-concept of the technique. In the present case, these values, when taken together, then define a minimum motile sperm concentration
  $C_{m,{crit}}$ of
  $6 \times 10^6$ cells mL
 $^{-1}$, below which a semen sample is considered infertile. Applying this reference value to the correlation between the number of motile sperm in the sample – obtained by taking the area under the OpenCASA
  $V_{AP}$ histogram reported by the OpenCASA motility module – with the viable cell concentration – obtained by multiplying the sperm concentration evaluated using the haemocytometer (after correcting for the dilution factor) multiplied by the viability of the same samples, which was independently determined from a LIVE/DEAD
 $^{\rm TM}$ sperm viability assay – in figure 3(a) then sets the minimum number of motile sperms required in the sample for it to be deemed fertile,
 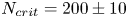 $N_{{crit}} = 200 \pm 10$. Utilising this equivalent threshold value in the mapping between the ADMiER breakup time and the OpenCASA motile sperm count (area under the OpenCASA
  $V_{AP}$ histogram) in figure 3(b) subsequently establishes a critical breakup time
  $t_{b,{crit}}$ of
  $0.52 \pm 0.03$ ms that is the equivalent to the minimum reference criterion for the motile sperm concentration that defines fertile samples. Breakup times below this value therefore indicate low sperm counts and hence low fertility levels associated with the sample (while shorter breakup times for infertile samples appear to be counterintuitive given that motile sperm act to accelerate filament thinning, infertile samples are also associated with lower sperm concentrations, which decrease the breakup time).
(a) Mapping of the number of motile trajectories  $N$ tracked in OpenCASA (obtained by taking the area under the OpenCASA
  $V_{AP}$ histogram) – which is expected to be proportional to the number of motile cells in the sample – onto the concentration of viable cells (obtained by multiplying the sample concentration, measured using the haemocytometer, with the fraction of living cells, as determined from a LIVE/DEAD
 $^{TM}$ sperm viability assay). Imposing commonly adopted values for the minimum concentration of motile sperms that defines a fertile sample (
 $C_{m,{crit}} = 40\,\% \times 15\times 10^6\ {\it cells}\ {\it mL}^{-1} = 6\times 10^6~{\it cells}\ {\it mL}^{-1}$) used by the cattle breeding industry (S. de Graaf, personal communication 2022) then allows an equivalent cut-off value
  $N_{{crit}}$ of
  $200 \pm 10$ sperm cells for fertile samples to be determined. (b) Correlation between the ADMiER breakup time with OpenCASA motile sperm count. The intercept of the curve with
  $N_{{crit}}$ defines the critical breakup time
  $t_{b,{crit}}$ of
  $0.52 \pm 0.03$ ms that constitutes the proxy for the aforementioned minimum motile sperm concentration reference value. (c) Correlation between the ADMiER breakup time and the viable sperm concentration measured using the haemocytometer. As with (b), the intercept of the curve with
  $C_{m,{crit}}$ defines the critical breakup time
  $t_{b,{crit}}$ of
  $0.51 \pm 0.03$ ms. Each ADMiER datapoint comprised an average of 10 individual measurements.
Parenthetically, we should note that the critical breakup time for fertile samples could have also been reasonably obtained by applying the minimum motile sperm concentration criterion  $C_{m,{crit}}$ directly to the correlation between the ADMiER breakup time with the haemocytometer viable sperm concentration measurements (figure 3c); the cut-off value
  $t_{b,{crit}}$ of
  $0.51 \pm 0.03$ ms, in this case, differing only slightly from that obtained from figure 3(b) due to the scatter in both measurement techniques. That the critical ADMiER breakup time can be established through either the motile or viable sperm concentrations suggests its ability to function as a proxy to both the haemocytometer and CASA measurements.
The critical breakup time  $t_{b,{crit}}$ of
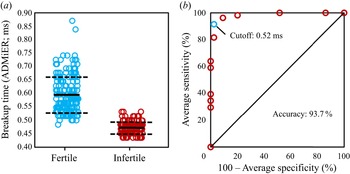
  $0.52$ ms is then used to benchmark ADMiER's diagnostic capability against OpenCASA with respect to the commonly adopted values used in the cattle breeding industry in predicting the sperm quality of 35 random samples (sample size calculated to achieve a statistical power of 90 % at a confidence level of 95 %). To remove information and incorporation bias, samples were randomised and blinded, and OpenCASA and haemocytometer measurements conducted independently and separately to the ADMiER operator. Results of this diagnostic accuracy test can be seen in figure 4(a), in which we observe the average ADMiER breakup time for samples falling within the fertile group (
 $0.56 \pm 0.04$ ms) to be distinctively higher than those for samples falling within the infertile group (
 $0.47 \pm 0.02$) ms. Utilising a receiver operating characteristic (ROC) curve to analyse the data (figure 4c), we are then able to conclude that the ADMiER platform is capable of diagnosing sperm quality and hence fertility based on a single equivalent indicator for motile sperm concentration with (
 $91.4\pm 4.2$) % sensitivity (95 % CI (
 $70.7\pm 4.6$) %–(
 $98.8\pm 1.4$) %) and (
 $97.5\pm 3.1$) % specificity (95 % CI (
 $73.7\pm 3.4$) %–(
 $99.9 \pm 0.1$) %) to (
 $93.7\pm 2.1$) % accuracy (95 % CI (
 $80.1\pm 3.0$) %–(
 $99.0\pm 0.7$) %). Had the ADMiER critical breakup time
  $t_{b,{crit}}$ of 0.51 ms from the haemocytometer viable sperm concentration measurements (figure 3c) been used as the cut-off instead, the ROC analysis would have returned a sensitivity, selectivity and accuracy of 96.3 %, 90.8 % and 93.7 %, respectively. In any case, these promising results therefore allude to the potential of the platform to be developed as a diagnostic tool for evaluating male fertility, at least for assessing the quality of frozen and subsequently thawed bull semen samples used for artificial insemination by the cattle breeding industry.
(a) Stratification of the ADMiER filament breakup time data ( $n=35$; 350 data points) into fertile (
 $n=19$) and infertile (
 $n=16$) groups according to veterinary industry standard recommendations for the definition of semen fertility; mean breakup time values are represented by the solid lines and the standard deviations are represented by the dashed lines. (b) The ROC curve showing the diagnostic performance of the ADMiER platform, relative to OpenCASA and haemocytometer measurements, with respect to the minimum veterinary reference values, which when translated into a critical breakup time of 0.52 ms, report 91.4 % sensitivity, 97.5 % specificity and 93.7 % accuracy in the diagnostic capability of the ADMiER platform for assessing sperm quality.

4. Conclusion
By cross-correlating the extensional rheological characteristics of semen samples using a novel acoustomicrofluidic platform with key sperm biological parameters such as their concentration, motility and viability, we show that a single measurement from these samples, i.e. the final breakup time associated with the dynamic thinning of capillary liquid bridge filaments, constitutes an appropriate proxy for the motile sperm concentration that is typically measured using a haemocytometer or CASA systems, and is hence a reliable predictor of semen quality, without the need to separately resolve for individual dependencies on each sperm parameter. Utilising this proxy, we therefore demonstrate the possibility of adopting the platform as a rapid one-step approach for diagnosing the fertility of bulls, therefore circumventing the long, multistep tracking, counting and staining processes typically required in current andrology laboratory assessment. Benchmarked against OpenCASA measurements, we verify that the ADMiER platform possesses such diagnostic potential, with respect to veterinary industry standard reference values defining fertile sperm samples, to an accuracy of 93.7 %, with a sensitivity of 91.4 % and a specificity of 97.5 %. Given the close correlation of the filament thinning dynamics with sperm concentration, motility and viability such that independent critical breakup times can be translated to specific minimum reference values for fertility for different species, these proof-of-concept results also allude to the potential of the platform to be used more broadly for veterinary male fertility diagnosis in general with further validation. As such, the ability to rapidly interrogate microlitre semen samples, together with the miniaturisability and low costs of the chipscale device (approximately US$1 per chip by exploiting the economies-of-scale associated with mass nanofabrication), underscores the conceptual possibility of the ADMiER platform as a potentially attractive rapid, affordable and compact field-use alternative to more expensive and complicated automated sperm analysers and CASA systems currently used for sperm quality assessments in animal breeding laboratories.
Declaration of interests
The authors declare no conflict of interest.
Funding statement
L.Y.Y., R.N. and R.P. gratefully acknowledge funding for this work from the Australian Research Council (ARC) through Discovery Project grants DP210101720 (L.Y.Y.) and DP190100343 (R.N., R.P.).
Author contributions
A.R.R., R.P., R.N. and L.Y.Y. created the research plan and designed the experiments. M.S.A.H. prepared the sperm samples. J.O.C. performed the experiments. L.A.A. assisted with statistical analysis. J.O.C. and L.Y.Y. wrote the initial draft and all authors edited the manuscript.
Data availability statement
Data is available from the corresponding author upon request (L.Y.Y.).
Ethical standards
The research meets all ethical guidelines, including adherence to the legal requirements of the study country.


 Open access