


INTRODUCTION
The chemical form of radiocarbon (14C) released from low-level waste (e.g., irradiated control rods, channel boxes and burnable poisons of spent fuel, which are composed of stainless steel) is a key parameter in the safety assessment of the sub-surface disposal system in Japan (Yamato Reference Yamato2006; Nuclear Safety Commission of Japan 2007). Most of the radionuclides released from the waste will sufficiently decay in the disposal facility owing to the multibarrier system. However, whether or not 14C, which has a long radioactive half-life (5730 yr), will sufficiently decay in the disposal facility depends on its chemical form. This indicates that it is necessary for the safety assessment to determine the chemical form of 14C released from the waste under the disposal conditions (highly alkaline and low-oxygen conditions). To determine the release behavior of 14C from irradiated stainless steels, immersion experiments were previously carried out using non-irradiated type 304L and 316L stainless-steel powders in 0.005 M NaOH solutions (of approximately pH 12) under low-oxygen conditions (Nakabayashi and Fujita Reference Nakabayashi and Fujita2017). Given the low corrosion rate of stainless steel in alkaline solutions under low-oxygen conditions (Blackwood et al. Reference Blackwood, Gould, Naish, Porter, Rance, Sharland, Smart, Thomas and Yates2002; Mihara et al. Reference Mihara, Nishimura, Wada and Honda2002) and the low carbon content (<0.03 wt%) in type 304L and 316L stainless steels, the amount of carbon released from the stainless-steel samples with a low reactive surface area, such as steel chips, to the liquid and gas phases during the short-term immersion periods was expected to be very low. Therefore, powdered stainless steels with a large reactive surface area were used in the previous study to detect the contents of released carbon in the liquid and gas phases.
The results showed that the main chemical form is colloidal carbon (Nakabayashi and Fujita Reference Nakabayashi and Fujita2017). The carbon species that could not penetrate the ultrafiltration membranes (10,000 molecular weight cutoff [MWCO]) are referred to as colloidal carbon. If the chemical form of 14C released from low-level waste under the disposal conditions is colloidal carbon, most of the 14C will be retained for a sufficient time and decay in the disposal facility owing to the effect of the filtration property of the engineered barrier (i.e., bentonite). In the safety assessment, this can lead to a reduced dose derived from 14C. In the previous study, it was shown by thermodynamic calculation that metallic compounds (e.g., iron hydroxide) can be formed in the solution. In addition, Nakabayashi and Fujita (Reference Nakabayashi and Fujita2017) observed the aggregation of colloid-like particles using a scanning electron microscope (SEM), and a point analysis of the aggregate by energy-dispersive X-ray spectroscopy (EDS) showed that carbon was present with iron and chromium in the aggregate. On the basis of these results, it was pointed out in the previous study that the colloidal carbon may be formed by the sorption of carbon on metallic compounds. However, it is considered that the experimental evidence is not sufficient to validate this assumption.
For example, information on the stainless-steel powders used in the previous study was lacking. The analysis of liquid samples showed that the silicon and total organic carbon (TOC) concentrations in the unfiltered liquid samples were very high (∼4000 μmol/L and ∼200 μmol-C/L, respectively), as shown in Figures 2 and 3 of Nakabayashi and Fujita (Reference Nakabayashi and Fujita2017). The concentrations of silicon and TOC were higher than that of iron in the liquid samples. However, the silicon and carbon contents in the bulk steels were less than the iron content from mill test reports (Table 1 of Nakabayashi and Fujita Reference Nakabayashi and Fujita2017). To understand the release behavior of these elements (particularly carbon) from the steels, the stainless-steel powders used in the study should be characterized. To clarify the formation mechanism of colloidal carbon, an immersion experiment under acidic conditions will also be necessary. Assuming that colloidal carbon is formed by the sorption of carbon on a metallic hydroxide under an alkaline condition, colloidal carbon will not form in an acidic solution owing to the low stability of the metallic hydroxide. The ionic form of metallic elements such as iron and chromium is more thermodynamically stable than the metallic hydroxides (Stumm and Morgan Reference Stumm and Morgan1996).
Nominal compositions of type 304L and 316L stainless-steel powders used in this study (wt%).

Therefore, in this study, we carried out immersion experiments using type 304L and 316L stainless-steel powders, which were used in the previous study (Nakabayashi and Fujita Reference Nakabayashi and Fujita2017), in NaOH solutions (of approximately pH 12) and HCl solutions (of approximately pH 2) under low-oxygen conditions with the aim of obtaining further data to discuss the chemical form of the carbon released from the stainless-steel powders. To compare the results for the alkaline and acidic systems, it is essential to obtain results from experiments performed under the same conditions as much as possible. This is because there are many potential contaminant sources of stable carbon, such as Milli-Q water, the laboratory wares and the analytical instruments used in the experiment. It is considered that the contamination level could potentially change depending on the time and situation.
MATERIALS AND METHODS
To exclude the potential effect of microorganisms on the chemical form of stable carbon released from the stainless-steel powders, the laboratory wares, such as glass ampoules, pipette tips and Teflon bottles, and deionized Milli-Q water were sterilized in an autoclave (LSX-700, Tomy Seico Co. Ltd., Japan) for 30 min at 121ºC (200 kPa) prior to use. To prevent the contamination of oxygen and carbon dioxide from air, two gloveboxes (100% Ar atmosphere, <0.1 ppm of O2) were used in this experiment. One of the gloveboxes was used only to wash the stainless-steel powders with HCl solution. The other was used for other experimental work, such as to prepare solutions, to add the stainless-steel powders and solutions to ampoules and to collect liquid and gas phases in the ampoules. This was to avoid the contamination of hydrocarbons, which may be produced by the stainless steel/solution interaction, in the atmosphere of the glovebox. Here, we defined the former and latter gloveboxes as “glovebox 1” and “glovebox 2,” respectively. Note that the transfer of the solutions and stainless steels between glovebox 1 and glovebox 2 was carried out as quickly as possible.
Stainless Steels
The types 304L (particle size under 150 μm, Lot No. 28N1001, The Nilaco Corp., Japan) and 316L (particle size under 45 μm, Lot No. 23365400, Strem Chemicals, Inc., USA) stainless-steel powders used in the previous study (Nakabayashi and Fujita Reference Nakabayashi and Fujita2017) were also used in this experiment. Note that these powders are commercially available as type 304 and 316 stainless-steel powders, respectively. The nominal bulk compositions of these powders are compiled in Table 1, which were taken from mill test reports provided by the suppliers. The carbon contents of these stainless-steel powders are less than 0.03 wt%, indicating that they should essentially be defined as type 304L and 316L stainless-steel powders. The powders were washed with Ar-purged 0.01 M HCl solution for 30 min then rinsed 15 times with Ar-purged Milli-Q water. This pretreatment was conducted in an ultrasonic bath under Ar atmosphere using glovebox 1. Then the powders were dried in a desiccator under vacuum. The desiccator with the powders was moved to glovebox 2 and kept in glovebox 2 prior to use.
Chemicals
Deionized Milli-Q water (18 MΩ·cm resistivity, Merck Ltd., Japan) was purged by Ar gas (99.999%) in Ar-filled glovebox 2 for 1 hr, which was used throughout this experiment. A 0.005 M NaOH (approximately pH 11.8 at 25ºC) solution was prepared with NaOH pellets (99.99% trace metal basis, under 1% Na2CO3 impurity, 306576, Sigma-Aldrich Japan Corp., Japan). 0.005 M HCl (approximately pH 2 at 25ºC) solution was prepared with 35–37% HCl solution (guaranteed reagent, 080-01066, Fujifilm Wako Pure Chemical Corp., Japan). HCl was also used to wash the powders. After their preparation, these solutions were purged by Ar gas again in Ar-filled glovebox 2.
Experimental System
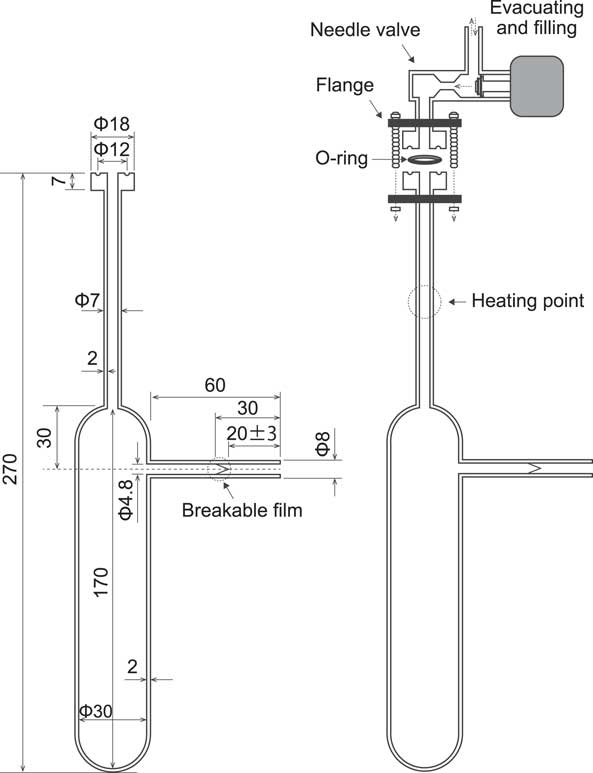
Glass ampoules with a breakable glass film were used in this experiment. The dimensions of the ampoule are shown in Figure 1. In glovebox 2, each of the powders (70 g) after washing was added to the glass ampoules. Then the ampoules were filled with 70 mL of 0.005 M NaOH solution or 0.005 M HCl solution. Three ampoules containing the powder and solution were prepared for each system. Two ampoules containing no stainless steel were filled with 0.005 M NaOH or HCl solution as blank samples. The ampoules were attached with a needle valve and flange (Model No. KV-255-UP for BELSORP-18 Plus, MicrotracBEL Corp., Japan) and an O-ring (14.6 mm o.d., 9.8 mm i.d.), and the Ar gas in the ampoules was then replaced with He gas (99.999%) by evacuating the ampoule and filling it with the He gas three times. This was to reduce the Ar peak, which overlaps the methane peak, in the subsequently obtained gas chromatogram. After the replacement, the pressure in the ampoules was reduced to 19.5 inHg (i.e., 66035 Pa) and the needle was closed. The ampoules were removed from glovebox 2 and sealed by heating the top part in air. The volume of the gas phase in the sealed ampoule was approximately 30 mL. The sealed ampoules were placed in a desiccator containing water and the desiccator was evacuated, during which it was visually observed whether air bubbles escaped from the ampoules. The ampoules without a hole were placed in a thermostatic oven with a temperature of 25ºC for approximately 20 to 30 days. During the experiment, the ampoules were stirred by hand for 1 min a day.
Glass ampoule with breakable glass film used in the experiment.
After the immersion period, the ampoules were moved into glovebox 2. The spout of the ampoules with the breakable film was capped with silicone cepta, and the gas phase was collected by breaking the film using a 1 mL Hamilton SampleLock syringe (P/N 81356, GL Sciences Inc., Japan). The syringe was then locked to prevent contamination with air. The syringe was moved outside glovebox 2 and the gas sample was analyzed by gas chromatography. Note that the syringe was washed with He gas (>99.999%) until the gas in the syringe was under the limit of detection of the target species. During the analysis of the gas, the ampoules were kept in glovebox 2. After analyzing the gas phase, the top part of the ampoule was cut with a glass cutter, and approximately 50 mL of the liquid phase was collected in a 200 mL Teflon bottle by decantation as carefully as possible to avoid the contamination of the stainless-steel powder. After that, the liquid samples collected from the same experimental system were mixed together in a single Teflon bottle. In addition, the approximately 150 mL of collected liquid samples was divided into unfiltered and filtered samples with the same volume. The filtered sample was filtered using an ultrafiltration membrane (10,000 MWCO, Biomax polyethersulfone, 63.5 mm diameter, Merck Ltd.) in glovebox 2 prior to liquid analysis. Immediately before the sample was filtered, the membrane filter was rinsed with 1 L of 0.005 M NaOH or 0.005 M HCl solution, depending on the immersion solution in the ampoule. This was to exclude carbon originating from the filter. The oxidation-reduction potential (ORP), dissolved oxygen (DO) and pH of the unfiltered and filtered samples were measured in glovebox 2. For the other analyses of the liquid samples, it was necessary to remove the samples from glovebox 2 and analyze them in air. Therefore, the analyses were conducted as soon as possible to reduce the contamination with air.
Analytical Methods
Chemical Depth Profile Analysis
The chemical depth profiles of the stainless-steel powders were obtained by scanning Auger electron spectroscopy/microscopy (SAM670, ULVAC-PHI, Inc., Japan). The washed samples were probed using a 10 kV electron beam operating with an emission current of 20 nA at an angle of 30º from the sample normal. Etching of the sample surfaces was performed by a 2 kV argon ion beam at an etching rate of 5.3 nm/min on the basis of calibration with SiO2.
Gas Chromatography Analysis for Hydrocarbons, Carbon Monoxide and Hydrogen
Hydrocarbons (methane, ethyne, ethene, ethane, propene, propane, methylpropane, butane), carbon monoxide and hydrogen were measured using a gas chromatograph (GC-2010, Shimadzu Scientific Instruments Inc., Japan) equipped with a barrier discharge ionization detector. Separation was carried out in a MICROPACKED ST column (2 m length, 1.0 mm i.d., Shinwa Chemical Industries Ltd., Japan) with He gas (99.999%) used as the carrier gas (7 mL/min). The detector and injection temperatures were 310 and 100ºC, respectively, and 0.2 mL of the sample was injected into the gas chromatograph with the split ratio set at 1:4. The gas chromatograph oven temperature was programmed to be 35ºC for 2.5 min, then increased at a rate of 20ºC/min to 270ºC from 2.5 to 14.25 min, then increased at a rate of 15ºC/min to 275ºC from 14.25 to 14.58 min, fixed at 275ºC from 14.58 to 17.58 min, increased at a rate of 15ºC/min to 305ºC from 17.58 to 19.58 min, and fixed at 305ºC from 19.58 to 30.58 min.
The calibration standards for these measurements were prepared with the following reference gases: methane (grade 99.9%, 1020-11001, GL Sciences Inc.), ethyne (grade 0.1%, 1020-11004, GL Sciences Inc.), ethene (grade 99.5%, 1020-11003, GL Sciences Inc.), ethane (grade 99.5%, 1020-11002, GL Sciences Inc.), propene (grade 99.5%, 1020-11006, GL Sciences Inc.), propane (grade 99.5%, 1020-11005, GL Sciences Inc.), methylpropane (grade 6.0%, 1020-11008, GL Sciences Inc.), butane (grade 9.0%, 1020-11007, GL Sciences Inc.), carbon monoxide (grade 99.9%, 1020-11220, GL Sciences Inc.), carbon dioxide (grade 99.9%, 1020-11221, GL Sciences Inc.) and hydrogen (grade 99.99%, 1020-11201, GL Sciences Inc.). Note that carbon dioxide was not measured in the gaseous samples, although the calibration standard gas contained carbon dioxide. This is due to the difficulty of avoiding the contamination with carbon dioxide from air.
200 mL vacuum sampling bottles (φ45 × 280 mm, 3008-58102, GL Sciences Inc.) and 1000 mL vacuum sampling bottles (φ80 × 360 mm, 3008-58110, GL Sciences Inc.) were evacuated for 5 min and refilled with He gas (99.999%) up to atmospheric pressure. To avoid the contamination with impurity gases, this process was conducted three times.
7 mL of He gas was withdrawn from the 200 mL vacuum sampling bottle filled with He gas using a 10 mL Hamilton SampleLock syringe (P/N 81656, GL Sciences Inc.). Then, 1 mL each of the ethene, ethane and propane reference gases and 4 mL of the propene reference gas were added to the vacuum sampling bottle using a 1 mL Hamilton SampleLock syringe (P/N 81356, GL Sciences Inc.). 7.6 and 15.2 mL of He gas were withdrawn from the 1000 mL vacuum sampling bottles filled with He gas using the 1 and 10 mL syringes, respectively. After that, the methane (0.05 mL), ethyne (5 mL), methylpropane (0.5 mL), butane (0.5 mL), carbon monoxide (0.05 mL), and carbon dioxide (0.1 mL) reference gases and 1 mL of a mixture gas containing ethene, ethane, propane, and propene in the 200 mL vacuum sampling bottle were added to the 1000 mL vacuum sampling bottles with 992.4 mL of He gas. The concentrations of the compounds in these bottles, that is, methane, ethyne, ethene, ethane, propene, propane, methylpropane, butane, carbon monoxide and carbon dioxide, were 50, 5, 5, 5, 20, 5, 30, 45, 50, and 100 ppm, respectively. This mixture gas was one of the calibration standard gases. Similarly, the methane (0.1 mL), ethyne (10 mL), methylpropane (1 mL), butane (1 mL), carbon monoxide (0.1 mL) and carbon dioxide (0.2 mL) reference gases and 2 mL of the mixture gas containing ethene, ethane, propane and propene in the 200 mL vacuum sampling bottle were added to the 1000 mL vacuum sampling bottles with 984.8 mL of He gas. The concentrations of the methane, ethyne, ethene, ethane, propene, propane, methylpropane, butane, carbon monoxide and carbon dioxide in these bottles were 100, 10, 10, 10, 40, 10, 60, 90, 100, and 200 ppm, respectively. This mixture gas was also one of the calibration standard gases.
Concerning the calibration standard gas for hydrogen measurements, 2 and 4 mL of He gas were withdrawn from the 200 mL vacuum sampling bottle filled with He gas using a 10 mL syringe. Then, 2 and 4 mL of the hydrogen reference gases were added to the 200 mL vacuum sampling bottles with 198 and 196 mL of He gas using a 10 mL syringe, respectively. The concentrations of hydrogen in the bottles were 10,000 and 20,000 ppm.
Gas Chromatography Analysis for Methanol and Ethanol
Methanol and ethanol were measured using a gas chromatograph (GC-2014, Shimadzu Scientific Instruments Inc.) equipped with a flame ionization detector. Separation was carried out on an Rt-Q-bond column (30 m length, 0.32 mm i.d., 10 μm df, Restek Corp., USA) with He gas (99.999%) as the carrier gas (2.15 mL/min). The detector and injection temperatures were both 250ºC, and 2 μL of the sample was injected into the gas chromatograph with the split ratio set at 1:3. The gas chromatograph oven temperature was programmed to be 90ºC for 3 min, then increased at a rate of 6ºC/min to 160ºC and held at this temperature for 14.5 min.
The calibration standards for these measurements were prepared with methanol (grade for high-performance liquid chromatography 99.7%, 138-06473, Fujifilm Wako Pure Chemical Corp.) and ethanol (super special grade 99.5%, 050-00446, Fujifilm Wako Pure Chemical Corp.). 50 mL of multicomponent stock solution containing methanol and ethanol, both with concentrations of 100 mg/L, was prepared in Milli-Q water. Further, 50 mL of stock solution containing 2-propanol (guaranteed reagent 99.7%, 166-04836, Fujifilm Wako Pure Chemical Corp.) with a concentration of 50 mg/L was prepared in Milli-Q water as an internal standard. The multicomponent stock solution containing methanol and ethanol was diluted with Milli-Q water to make standard solutions with concentrations of 0, 0.5, 0.76, 1.0 and 2.0 mg/L, which contained 5 mL of 2-propanol with a concentration of 50 mg/L. 5 mL of 2-propanol with a concentration of 50 mg/L was also added to liquid samples prior to measurement.
High-Performance Liquid Chromatography Analysis for Formaldehyde and Acetaldehyde
Formaldehyde and acetaldehyde were measured using a high-performance liquid chromatograph (LC-VP system, Shimadzu Scientific Instruments Inc.) equipped with a Shim-pack VP-ODS column (150 mm length, 4.6 mm i.d., Shimadzu Scientific Instruments Inc.) and a photodiode array detector (SPD-M10A, Shimadzu Scientific Instruments Inc.). Separation was performed on the column by isocratic elution with acetonitrile and Milli-Q water (60:40, v/v) as a mobile phase at a flow rate of 0.4 mL/min. The temperature was 40ºC, the volume of injection was 10 μL and the UV detection wavelength was set at 360 nm. The formaldehyde and acetaldehyde in liquid samples were derivatized with 2,4- dinitrophenylhydrazine (DNPH) prior to analysis.
The calibration standards for these measurements were prepared with a formaldehyde 2,4-DNPH standard solution (40 μg HCHO/mL acetonitrile solution, 062-03481, Fujifilm Wako Pure Chemical Corp.), acetaldehyde 2,4-DNPH standard solution (0.1 μg CH3CHO/μL ethyl acetate solution, 012-08861, Fujifilm Wako Pure Chemical Corp.) and acetonitrile (grade for high-performance liquid chromatography 99.8%, 015-08633, Fujifilm Wako Pure Chemical Corp.). 10 mL of multicomponent stock solution containing formaldehyde and acetaldehyde with concentrations of 4 and 5 mg/L, respectively, was prepared in acetonitrile. The multicomponent stock solution containing formaldehyde and acetaldehyde was diluted with acetonitrile to make standard solutions. The concentrations in the standard solutions were 0.02, 0.04, and 0.08 mg/L for formaldehyde and 0.025, 0.05 and 0.1 mg/L for acetaldehyde.
0.04 g of 2,4-DNPH (guaranteed reagent 50%, 049-03612, Fujifilm Wako Pure Chemical Corp.) was mixed with 15 mL of a solution containing 25 mL of Milli-Q water, 2 mL of HCl and 13 mL of acetonitrile. Similarly, 0.04 g of 2,4-DNPH was mixed with 15 mL acetonitrile. The 2,4-DNPH was completely dissolved in these solutions using an ultrasonic bath. 0.02 mL of the former 2,4-DNPH solution was mixed with 1 mL of each of the liquid samples of the 0.005 M NaOH solution systems. Similarly, 0.02 mL of the latter 2,4-DNPH solution was mixed with 1 mL of each of the liquid samples of the 0.005 M HCl solution systems. After the reaction for 1 hr, the derivatization of these samples was completed and the samples were measured.
Ion Chromatography Analysis for Formic, Acetic and Oxalic Acids
Formic, acetic and oxalic acids were measured using an ion chromatograph (Dionex ICS-2100, Thermo Fisher Scientific K. K., Japan) equipped with an autosampler (Dionex AS-AP, Thermo Fisher Scientific K. K.). For analytical separation, an IonPac AS19 (250 mm length, 4 mm i.d., Thermo Fisher Scientific K. K.) analytical column and an IonPac AG19 (50 mm length, 4 mm i.d., Thermo Fisher Scientific K. K.) guard column were used. The columns were operated at 35ºC. To reduce background noise and increase the analytical signal output, an ASRS suppressor (working in mode) was used. An eluent generator was used to generate KOH gradient concentrations. For all analyses in this report, the gradient profile was as follows: 0–2 mmol/L from 0 to 35 min, 2–8 mmol/L from 35 to 36 min, 8 mmol/L from 36 to 130 min, 8–35 mmol/L from 130 to 131 min, 35 mmol/L from 131 to 160 min, 35–2 mmol/L from 160 to 161 min, and 2 mmol/L from 161 to 180 min. The eluent flow rate was set at 1 mL/min with an injection volume of 25 μL.
The calibration standards for these measurements were prepared with sodium formate (guaranteed reagent 98.0%, 190-01995, Fujifilm Wako Pure Chemical Corp.), sodium acetate trihydrate (guaranteed reagent 99.0%, 198-01055, Fujifilm Wako Pure Chemical Corp.) and sodium oxalate (guaranteed reagent 99.5%, 198-02655, Fujifilm Wako Pure Chemical Corp). 50 mL of multicomponent stock solution containing sodium formate, sodium acetate and sodium oxalate, each with a concentration of 20 mg/L, was prepared in Milli-Q water. The multicomponent stock solution containing sodium formate, sodium acetate and sodium oxalate was diluted with Milli-Q water to make standard solutions. The concentrations of the standard solutions were 0, 0.4, 0.8 and 2.0 mg/L, which contained 2.5 mL of NaOH with a concentration of 0.1 mol/L to adjust the pH of the standard solutions to approximate the pH of the liquid samples. The liquid samples used for measurements were diluted using Milli-Q water if necessary.
Total Organic Carbon Analysis
Total carbon (TC) and inorganic carbon (IC) concentrations were measured at 680ºC by the combustion catalytic oxidation/nondispersive infrared method using a total organic carbon analyzer (TOC-VCSH, Shimadzu Scientific Instruments Inc.). The TOC concentration was obtained by subtracting the IC concentration from the TC concentration. 22 mL of a liquid sample was added to a 24 mL glass vial in glovebox 2 to prevent contamination with carbon dioxide from air. The vials were capped with a silicone septum and screw cap. In addition, the entire vial excluding the top was covered with aluminum foil to prevent radical reactions induced by photon. Then, the vials were removed from glovebox 2 and the IC concentration was first measured. After that, the vials were returned to glovebox 2 and 11 mL of the liquid sample for which IC analysis had been completed was collected and added to a different 24 mL glass vial. 11 mL of 0.1 mol/L HNO3 (guaranteed reagent, 60–61%, 141-01366, Fujifilm Wako Pure Chemical Corp.) was also added to each vial. The vials were also capped with a silicone septum and screw cap and covered with aluminum foil. Then, the vials were removed from glovebox 2 and the TC concentration was measured. At that time, the TC concentration in the used 0.1 mol/L HNO3 was also measured.
The calibration standards for these measurements were prepared with potassium hydrogen phthalate (guaranteed reagent 99.8–100.2%, 163-03822, Fujifilm Wako Pure Chemical Corp.) and sodium carbonate (guaranteed reagent 99.8%, 195-01582, Fujifilm Wako Pure Chemical Corp.). 100 mL of stock solution with a TC concentration of 1000 mg/L was prepared in Milli-Q water using potassium hydrogen phthalate. The stock solution for the TC measurement was diluted with Milli-Q water to make standard solutions with concentrations of 0, 2.5, 5, 10, 20 and 40 mg/L. 100 mL of stock solution with an IC concentration of 1000 mg/L was prepared in Milli-Q water using sodium carbonate. The sodium carbonate was heated in an electric furnace at about 290ºC for 1 hr and thoroughly cooled in a silica gel desiccator prior to use. The stock solution for the IC measurement was diluted with Milli-Q water to make standard solutions with concentrations of 0, 2.5 and 5 mg/L.
Element Analysis for Fe, Cr, Ni, Mo, Mn and Si
Fe, Cr, Ni, Mo, Mn and Si, which are constituents of the steels, were measured by inductively coupled plasma atomic emission spectroscopy (IRIS Intrepid II XSP DUO, Thermo Fisher Scientific K. K.). Standard solutions with concentrations of 0, 0.05, 0.1, 0.2, 0.5 and 1.0 mg/L were prepared. Basically, 5 mL of the liquid sample used to measure for Fe, Cr, Ni, Mo and Mn and 2.5 mL of 0.1 mol/L HNO3 (guaranteed reagent, 60–61%, 141-01366, Fujifilm Wako Pure Chemical Corp.) were mixed and diluted with Milli-Q water to a total volume of 25 mL. Note that the amount of HNO3 added should be one-tenth of the total volume. In the case of a diluted sample with a concentration exceeding the upper limit of the calibration range, the sample was further diluted with Milli-Q water and 0.1 mol/L HNO3. In the case of the liquid sample used to measure for Si, the sample were diluted with Milli-Q water to a concentration within the range of the standard solution.
pH, ORP and DO Measurements
The ORP, DO and pH were measured using a handheld ORP meter (RM-30P, DKK-TOA Corp., Japan), a handheld DO meter (DO-14P, DKK-TOA Corp.) and a multi water quality meter (MM-60R, DKK-TOA Corp.), respectively. The measured ORP was with reference to the Ag/AgCl reference electrode. The ORP was converted to Eh by adding the ORP value (207 V) of the Ag/AgCl electrode referenced to the standard hydrogen electrode (SHE). The measurement range of DO was between 0 and 19.99 mg/L and the resolution was 0.01 mg/L.
Particle Size Distribution Analysis
Dynamic light scattering (DLS) particle size distributions in liquid samples were obtained using a Malvern Zetasizer ZS instrument (Malvern Instruments Ltd., UK), whose size measurement range is from 0.3 nm to 10 μm. The liquid samples were filtered using a 0.45 μm membrane filter. 1 mL of each liquid sample was added to a folded capillary cell (DTS1070, Malvern Instruments Ltd.) and measured. The particle size distributions were obtained from three repeat measurements.
TEM-EDS Analysis
Transmission electron microscopy and energy dispersive spectroscopy (TEM-EDS) analysis was conducted to observe the colloidal carbon in the liquid samples and to validate the elemental composition of colloidal carbon. Approximately 3.5 μL of liquid samples of 0.005 M NaOH or HCl solution systems were deposited on a 3-mm-diameter molybdenum grid coated with an ultrathin germanium layer (approximately 8 to 13 nm) (G10-M05 STEM Mo50P grid, Okenshoji Co., Ltd., Japan). The samples were dried in a desiccator under vacuum. The samples were observed using a 300 kV field-emission transmission electron microscope (HF-3000, Hitachi High-Technologies Corp., Japan). Compositional information was obtained using an EDS system (SIGMA2, Kevex Corp., USA).
Limit of Quantification and Limit of Detection
The limit of quantification (LOQ) and limit of detection (LOD) were based on 10 × standard deviation (SD) and 3 × SD (n = 10) at the lowest calibration level, respectively, of the chemical species and elements.
RESULTS
Chemical Depth Profile of Stainless-Steel Powders Prior to Use
The morphologies of the stainless-steel powders after washing with 0.01 M HCl solution are shown in Figure 2. Some surface nanoparticles were observed but the numbers of the nanoparticles appear to be very small. The chemical depth profiles of the stainless-steel powders after washing are shown in Figure 3. The regions that were analyzed are shown in Figures 2(c) and 2(d). The chemical depth profiles of the type 304L and 316L stainless-steel powders are similar. Silicon and oxygen are dominant at the surface of the particles. Carbon is also present on the surface, although the concentration is lower than those of silicon and oxygen. The concentrations of these elements gradually decrease with increasing depth, while the concentrations of iron, chromium and nickel increase. The oxide thickness was estimated to be approximately 4 nm for both powders from half the decay of the oxygen content. The oxide layers are mainly composed of Si, which implies that these powders are water-atomized stainless-steel powders (Klar and Samal Reference Klar and Samal2007; Hedberg et al. Reference Hedberg, Norell, Linhardt, Bergqvist and Wallinder2012, Reference Hedberg, Norell, Hedberg, Szakálos, Linhardt and Wallinder2013), meaning that the stainless-steel powders used in this study were produced by a water atomization process. The process essentially consists of the atomization of a stream of liquid metal by high-pressure water jets (Dunkley Reference Dunkley1978). A characteristic of a water-atomized powder is that there is a silicon oxide film on the surface of the particles. Owing to the high mobility and oxygen affinity of silicon, silicon diffuses to the surface of the steel droplets and reacts with water vapor to form a protective oxide layer (Tunberg and Nyborg Reference Tunberg and Nyborg1995).
SEM images, at different magnifications, of type 304L stainless-steel powder [(a) and (c)] and type 316L stainless-steel powder [(b) and (d)]. The areas in white rectangles are the AES analysis areas.

Chemical depth profiles of type 304L and 316L stainless-steel powders.

Gas Analysis
The measurement results of the gas phases in the type 304L and 316L stainless-steel systems with the NaOH and HCl solutions are shown in supplemental Table 1S. No hydrocarbons or carbon monoxide was detected in the type 304L systems with the NaOH solution. In the type 316L systems with the NaOH solution, only very small amounts of ethene and ethane were detected (the concentration was under the LOQ) and no other hydrocarbons or carbon monoxide was detected. On the other hand, large amounts of hydrogen were detected in both the systems with NaOH solution. The average hydrogen concentrations in the type 304L and 316L stainless-steel systems with NaOH solution were 64 and 339 μmol/L, respectively.
In the type 304L systems with HCl solution, ethene, ethane and propane were detected but the concentrations were close to or under the LOQ. In the type 316L systems with HCl solution, ethene and ethane were detected but the concentrations were also close to or under the LOQ. Large amounts of hydrogen were also detected in the systems with the HCl solution. The average hydrogen concentrations in the type 304L and 316L stainless-steel systems with HCl solution were 1939 and 308 μmol/L, respectively.
The production of hydrogen in this experiment indicates that the reactions in all systems containing the steels occurred in an anaerobic solution. In general, the corrosion of a metal, M, in an anaerobic solution is governed by the following simplest reactions (Stansbury and Buchanan Reference Stansbury and Buchanan2000). ${\rm M}{\plus}{\rm mH}^{{\plus}} \to{\rm M}^{{{\rm m}{\plus}}} {\plus}{{\rm m} \over 2}{\rm H}_{2} \ {\rm at}\ {\rm pH}\,\lt\,7$ ${\rm M}{\plus}{\rm mH}_{2} {\rm O}\to{\rm M}^{{{\rm m}{\plus}}} {\plus}{\rm mOH}^{{\minus}} {\plus}{{\rm m} \over 2}{\rm H}_{2}\ {\rm at}\ {\rm pH}\,{\geq}\, 7$
Liquid Analysis
Measurement results for the pH, Eh and DO and the concentrations of the main elements of the liquid phases in the type 304L and 316L stainless-steel systems with the NaOH and HCl solutions are shown in supplemental Table 2S. The pH in the NaOH solution and HCl solution systems decreased and increased after the reaction between the solutions and steels, respectively. The decrease in the pH may have been caused by the buffer capacity of the dissolved silica (e.g., H4SiO4(aq) + OH– → H3SiO4– + H2O) and/or the formation of metallic hydroxides (e.g., Fe2+ + 2OH– → Fe(OH)2). The increase in the pH may have been caused by the corrosion of the steels, which consume the H+, expressed by Equation (1). The Eh and DO values respectively ranged between approximately 150 and 300 mV/SHE and between 0.00 and 0.05 mg/L in the unfiltered samples except for the blank samples. The relatively low DO value is consistent with the production of hydrogen.
Figure 4 shows the concentrations of the main elements above the LOQ in all liquid samples except for the blank samples. In the NaOH solution systems, the Fe, Cr, Ni and Mn concentrations were decreased by filtration. This indicates that some of these species could not penetrate the ultrafiltration membranes with 10,000 MWCO and a pore size of approximately 10 nm. The Si and Mo concentrations were hardly changed by filtration. Note that Mo was present as MoO42- in the NaOH solution, which was detected by ion chromatography. On the other hand, in the HCl solution systems, only the Cr concentration was decreased by filtration.
Concentrations of elements for the type 304L (a) and 316L (b) systems in the NaOH solutions and for the type 304L (c) and 316L (d) systems in the HCl solutions.

The organic carbon compounds and the TC, IC and TOC concentrations in the liquid phases of the type 304 and 316 stainless-steel systems are shown in supplemental Table 3S. Formic and acetic acids were quantified in all liquid samples except for the blank samples. Oxalic acid was only quantified in the liquid sample of the NaOH solution system. It appears that there is no difference in the carboxylic acid (formic, acetic and oxalic acids) concentrations before and after ultrafiltration. Other organic carbon compounds (methanol, ethanol, formaldehyde and acetaldehyde) were detected for some samples, although these values were below the LOQ. IC was not detected in all liquid samples. The TOC concentrations in the liquid samples of the unfiltered system were higher than those of the filtered system. This indicates that some of the carbon species could not penetrate the ultrafiltration membrane. These carbon species are referred to as colloidal carbon in this study. The colloidal carbon concentrations of the type 304L and 316L systems are approximately 179 and 190 μmol-C/L in the NaOH solution systems and approximately 32 and 25 μmol-C/L in the HCl solution systems, respectively. Note that the TOC in the unfiltered blank sample of the NaOH solution system probably originated from contamination such as the carbon impurity of the NaOH reagent. The TOC concentrations in the blank samples were one order of magnitude lower than those in the type 304L and 316L systems in NaOH solution. Therefore, the effect of the organic carbon originating from contamination is negligible.
Figure 5 shows the concentrations of organic carbon species above the LOQ and the TOC concentration in all liquid samples except for the blank samples. Compared with the NaOH solution systems, the concentrations of carboxylic acids in the HCl solution systems were higher and the colloidal carbon concentrations were lower. The sum of the concentrations of the carboxylic acids (formic, acetic and oxalic acids) in the filtered NaOH solution system was one order of magnitude lower than the TOC concentration, indicating that unidentified carbon compounds were still present in the NaOH solutions. The unidentified species accounted for about 20 to 23% of the released carbon, whereas the colloidal carbon accounted for about 75 to 77% and the carboxylic acids accounted for about 2 to 3%, in the NaOH solution systems. In the HCl solution systems, the unidentified species accounted for about 7 to 10% of the released carbon, whereas the colloidal carbon accounted for about 41 to 48% and the carboxylic acids accounted for about 44 to 48%.
Concentrations of carbon species in the NaOH solutions (a) and HCl solutions (b).

Characterization of Colloidal Particles
The DLS measurement showed that there were particles with a size of 10–100 nm order in the liquid samples filtered using membrane filters with 0.45 μm pore size in all the systems (Figure 6). Figure 7 shows TEM images of the colloidal particles in the alkaline systems and the results of point analysis. The nanoparticles appear to have aggregated. The results of point analysis showed that carbon was accompanied by Fe, Cr, Si and O in the particles. In particular, the peak intensities of Cr and carbon appeared to be higher than the other peak intensities, suggesting that the colloidal carbon may have formed by interactions between carbon and Cr. Although we attempted to observe the colloidal particles in the HCl solution system, this has not yet been achieved. This is probably due to the low concentration of the colloidal carbon in HCl solution.
Size distribution of colloidal particles for the type 304L (a) and 316L (b) systems in the NaOH solutions and for the type 304L (c) and 316L (d) systems in the HCl solutions. These samples were filtered using a 0.45 μm membrane filter prior to measurement.

TEM images and EDS spectra of the colloidal particles in the type 304L (a) and 316L (b) systems in the NaOH solutions. The Mo and Ge peaks originate from the grids used.

DISCUSSION
Formation of Colloidal Carbon
The results in this study showed that colloidal carbon mainly formed in the NaOH solution systems and that colloidal carbon and carboxylic acids formed in the HCl solution systems. Here, we discuss the source and the formation mechanism of the colloidal carbon.
First, the following four processes were hypothesized to occur in the formation of the colloidal carbon:
1) Sorption of carbon released from steels on metallic hydroxides,
2) Release of carbon in the base metal in a colloidal form,
3) Release of carbon in the silicon oxide layer in a colloidal form,
4) Release of nanoparticles attached to the steel surface in a colloid form.
Concerning hypothesis 1), Nakabayashi and Fujita (Reference Nakabayashi and Fujita2017) pointed out the possibility that colloidal carbon may be formed by the sorption of carbon, which is released from steels, on metallic compounds (e.g., iron, chromium and nickel hydroxides). If this is the case, it can be expected that colloidal carbon will not be formed under acidic conditions and that metallic hydroxides will hardly form. Therefore, an immersion experiment with HCl solution was performed in this study. The results of the liquid analysis and DLS measurement indicated the possibility that colloidal carbon was present in the HCl solution systems. Regarding the metallic elements, the concentrations of many elements (i.e., Mn, Fe, Ni and Mo) in the HCl solutions were not changed after the filtration. In contrast, the concentrations of these elements in the NaOH solutions were decreased by the filtration, indicating that these elements precipitated as hydroxide compounds, as expected. However, only the chromium concentration was decreased by filtration in the HCl solutions. To discuss which chromium species is the most thermodynamically stable in the HCl solutions, the pH-Eh diagrams for Cr-H2O systems were calculated (Figure 8). Geochemist’s Workbench software with the thermo.com.V8.R6.full thermodynamic database (Bethke Reference Bethke2008) was used. The chromium concentration used for the calculation were the average value of the type 304L and 316 L systems. At the measured values of Eh and pH in the alkaline systems, Cr(OH)3 is the most thermodynamically stable species in the solution. In contrast, at the measured values of Eh and pH in the acidic systems, CrOH2+ is the most thermodynamically stable. The calculation indicated that chromium hydroxide is unlikely to form thermodynamically under the acidic conditions in our present study, which is inconsistent with the suggestion by Nakabayashi and Fujita (Reference Nakabayashi and Fujita2017) that colloidal carbon can be formed by the sorption of carbon on metallic hydroxides. On the basis of the above discussion, it is considered that hypothesis 1) is not reasonable.
Eh-pH diagrams for Cr-H2O system. The chromium concentration used for the calculation were 43.47 μmol/L (a) for the NaOH solution system and 1.605 μmol/L (b) for the HCl solution systems. The open circle and cross mark indicate Eh and pH in the unfiltered samples of type 304L and 316L systems, respectively. The formation of CrO2(s) and eskolaite was ignored in the calculation.

Concerning hypothesis 2), we discuss the possibility that the carbon in the base metal is released into the liquid phase in a colloidal form. First, the concentrations of carbon released from the base metal of the stainless-steel powders was calculated from the measured concentration of hydrogen using the following equations. ${\rm Fe}{\plus}2{\rm H}^{{\plus}} \to{\rm Fe}^{{2{\plus}}} {\plus}{\rm H}_{2} $ ${\rm Fe}{\plus}2{\rm H}_{2} {\rm O}\to{\rm Fe}^{{2{\plus}}} {\plus}2{\rm OH}^{{\minus}} {\plus}{\rm H}_{2} $
The calculation is based on the assumption that the hydrogen gas is generated in accordance with Equations (3) and (4) in HCl solution and NaOH solution, respectively, and that carbon and iron are stoichiometrically released into the solution. The stoichiometric factors of carbon for type 304L and 316L stainless steels are 1.08 × 10⁻³ and 8.79 × 10⁻⁴, respectively. These factors are expressed as the carbon/iron (mol/mol) ratios of the stainless-steel powders, which can be obtained from the molecular weights of the elements and the chemical compositions shown in Table 1. The average hydrogen concentrations given earlier were used in the calculation. The calculated concentrations of carbon for the type 304L and 316L systems in the NaOH solutions were 0.02 and 0.09 μmol-C/L, whereas for the type 304L and 316L systems in the HCl solutions they were 0.60 and 0.08 μmol-C/L, respectively. These concentrations were significantly lower than the measured concentrations of colloidal carbon of approximately 180 μmol-C/L in the NaOH solution systems and approximately 30 μmol-C/L in the HCl solution systems, which were given earlier. This indicates that the carbon in the base metal is very unlikely to be released in a colloidal form into the solution.
Concerning hypothesis 3), the results of the AES analysis (Figure 3) showed that a relatively large amount of carbon was present in the silicon oxide layer. Ferriss (Reference Ferris1983) conducted a surface analysis of water-atomized powder of type 316L stainless steel by x-ray photoelectron spectroscopy (XPS). It was presumed that the surface carbon was present in the form of hydrocarbons, because the binding energy analyzed by XPS was less than that of carbon in carbides or polymers. In addition, the study pointed out the possibility of hydrocarbons in a silicon oxide layer originating from processing, handling under industrial conditions and deposition by the backdiffusion of vapor in the XPS instrument. The extremely high carbon concentration in the outermost surface in Figure 3 may have been due to contamination during AES analysis for similar reasons to those for the above XPS analysis. Here, the relationship between the silicon and colloidal carbon concentrations in the solutions should be noted. The silicon/colloidal carbon concentration ratios ((μmol/L)/(μmol-C/L)) for the type 304L and 316L systems in the NaOH solution were 28.6 and 26.5, whereas those for the type 304L and 316L systems in the HCl solution were 27.7 and 41.2, respectively. Note that the silicon concentrations in the unfiltered solutions were used in this calculation. It appears that silicon and colloidal carbon were stoichiometrically released into the solutions. This indicates the possibility that the source of the carbon in the colloidal carbon was the carbon in the silicon oxide layer.
Concerning hypothesis 4), although it was confirmed that nanoparticles were present on the surface of the stainless steels by SEM observation (Figure 2), the number of nanoparticles appeared to be very small. Thus, the assumption that the nanoparticles on the surface of the stainless steels were colloidal carbon is not reasonable.
Given the above discussion, hypothesis 3) that the carbon in the silicon oxide layer was released as a colloidal form into the solution is considered to be the most reasonable from the currently available data. However, additional analysis and experiments are necessary to validate the hypothesis. For example, conducting immersion experiments using water-atomized stainless-steel powders without silicon oxide and/or clarifying the chemical bonding state of the carbon in the colloidal carbon will be helpful for determining the source of the colloidal carbon. In addition, considering long-term safety assessment, it is important to determine whether the colloidal carbon is continuously released into the solution during the corrosion process. Therefore, information on the temporal evolution of the colloidal carbon concentration should be obtained.
Formation of Carboxylic Acids and Hydrocarbons
Unlike the colloidal carbon, the concentrations of carboxylic acids (i.e., formic, acetic and oxalic acids) in the HCl solution systems are one order of magnitude higher than those in the NaOH solutions. In addition, it appears that the amounts of hydrocarbons generated in the HCl solution systems are relatively larger than those in the NaOH solution systems. This indicates that both more oxidized hydrocarbons and more reduced hydrocarbons were generated in the HCl solution systems than in the NaOH systems.
Cvetković et al. (Reference Cvetković, Rothardt, Büttler, Kunz, Schlotterbeck and Wieland2018) performed immersion experiments on unirradiated iron and artificial cement pore water solutions (pH 11.0 to 13.3) under anoxic conditions, and the temporal evolution of the concentration of carbon species in the gas and liquid phases was measured. They proposed that oxidized carbon species (i.e., carboxylic acids, aldehydes, alcohols) could be produced during the exposure of iron particles to oxic conditions, such as during the production or pretreatment of materials prior to use in the experiments, and captured in the oxide layer. These compounds are instantaneously released to the solution upon the immersion of steel, which gives rise to an instantaneous increase in the concentrations of oxidized hydrocarbons. They also proposed that the reduction of hydrocarbons is related to the corrosion of the iron powder.
In our study, the sums of the measured carboxylic acid concentrations, which are those in the unfiltered solution, for the type 304L and 316L systems in the NaOH solution were 5.16 and 6.21 μmol-C/L, compared with 49.5 and 20.1 μmol-C/L in the HCl system, respectively. These concentrations were two to four orders of magnitude higher than the calculated concentrations of carbon released from the steels given in a previous section. This implies that the carboxylic acids may also have originated from the carbon impurities in the silicon oxide layer. However, it has not been clarified why hardly any of the carboxylic acids formed and colloidal carbon mainly formed in the NaOH solution, while less colloidal carbon and more carboxylic acids were produced in the HCl solution. Concerning the hydrocarbons, the estimated carbon concentrations in the solutions were converted to those in the gas phase for comparison with the measured concentration of hydrocarbons. This calculation was based on the assumption that the liquid volume and gas volume in the ampoule were 0.07 and 0.03 L, respectively. The estimated concentrations of carbon for the type 304L and 316L systems in the NaOH solutions were 0.05 and 0.21 μmol/L, whereas for the type 304L and 316L systems in the HCl solutions they were 1.40 and 0.19 μmol/L, respectively. These estimated concentrations in the gas phase were close to or under the LOQ and/or LOD of hydrocarbons, indicating the possibility that a significant amount of hydrocarbons was not generated because the immersion duration was very short in our study. The amounts generated were very low, preventing us from discussing the source of the carbon. Considering long-term safety assessment, it is important to determine whether the carboxylic acids and hydrocarbons were continuously released during the corrosion process. To discuss the source of the carbon and the importance of carboxylic acids and hydrocarbons for safety assessment, it is necessary to obtain information on the temporal evolution of the concentrations of the carboxylic acids and hydrocarbons, as conducted by Cvetković et al. (Reference Cvetković, Rothardt, Büttler, Kunz, Schlotterbeck and Wieland2018).
Applicability of Data Obtained from Water-Atomized Stainless-Steel Powders
It was revealed that the stainless-steel powders used in this study were produced by the water atomization process. A characteristic of a water-atomized powder is that there is a silicon oxide film on the surface of the particles. In contrast, irradiated stainless steel generated by the operation of nuclear power plants has an iron, chromium and nickel oxide layer (Bradbury et al. Reference Bradbury, Segal, Sellers, Swan and Wood1982). It is not yet known whether a difference in the composition of the oxide layer affects the chemical form of carbon released from the stainless steel. In the safety assessment of radioactive waste disposal, it is important not only to determine the chemical form of carbon released from activated stainless steel but also to understand the mechanism of its formation from the viewpoint of the description of safety assessment. In other words, it is important to know whether or not the composition of the oxide layer affects the chemical form of the carbon. For example, the stainless-steel powders produced by the gas atomization process have an iron, chromium and nickel oxide layer (Hedberg et al. Reference Hedberg, Norell, Linhardt, Bergqvist and Wallinder2012, Reference Hedberg, Norell, Hedberg, Szakálos, Linhardt and Wallinder2013). Comparing the data on the chemical form of carbon released from water-atomized and gas-atomized powders with different oxide compositions could help clarify the effect of the oxide composition on the chemical form of carbon.
The chemical form of 14C in irradiated type 304L and 316L stainless steels (i.e., radioactive waste) is not yet clear. 14C is mainly produced by the thermal neutron activation of 14N, which is present as a solid solution, in the stainless steel. However, the dominant chemical form of carbon in irradiated stainless steel is not yet known, for example, iron carbide, chromium carbide, or the solid-solution state of carbon. In contrast, the chemical form of the stable carbon (i.e., 12C and 13C) in the type 304L and 316L stainless steels used in our study is expected to be the solid-solution state. In general, the carbon content is controlled to a maximum of 0.03% in stainless steels, which minimizes the problem of carbide precipitation (particularly chromium carbide) during the welding process (Swanton et al. Reference Swanton, Baston and Smart2015). This study and further studies using water-atomized stainless-steel powders will help to clarify the chemical form of carbon released from the carbon present as a solid solution in the stainless steel.
CONCLUSION
Immersion experiments using type 304L and 316L stainless-steel powders, which were found to be water-atomized powders, in NaOH and HCl solutions under low-oxygen conditions were conducted to determine the chemical form of the stable carbon released from the stainless steels. The results indicated that colloidal carbon mainly formed in the NaOH solution systems, whereas colloidal carbon and carboxylic acids (i.e., formic and acetic acids) formed in the HCl solution systems. The amount of colloidal carbon generated in the NaOH solution was much higher than that in the HCl solution, while the amount of the carboxylic acids generated in the HCl solution was higher than that in the NaOH solution. In both solution systems, almost no hydrocarbons were detected. The colloidal particles observed in the NaOH solution systems consisted of C, Fe, Cr, Si and O. In particular, the relationship between Cr and C may be involved in the formation of colloidal carbon because the peak intensities of Cr and C appeared to be higher than the other peak intensities in the energy spectrum obtained by TEM-EDS.
The concentrations of carbon released from the stainless-steel powders to the liquid phase and gas phase during the corrosion were estimated from the measured concentration of hydrogen in the gas phase. The estimated concentrations of the released carbon in the liquid phase were much lower than the measured concentrations of the colloidal carbon and carboxylic acids. The estimated concentrations of the released carbon in the gas phase were close to or under LOQ and/or LOD of hydrocarbons. Concerning the source of the colloidal carbon, the hypothesis that the carbon in the silicon oxide layer is released into the solution as colloidal carbon is considered to be the most reasonable from the currently available data. The hypotheses that the carbon released form steels sorbed on metallic hydroxides, that the carbon in the base metal was released in a colloidal form and that the nanoparticles attached to the steel surface were released in a colloidal form are not considered to be reasonable. Concerning the source of the carbon in the carboxylic acids, they may also have been originated from the carbon in the oxide layer on the basis of a proposal in a previous study. the very small amounts of hydrocarbons generated in our study prevented us from discussing the source of the hydrocarbons. To validate these hypotheses and obtain information on the hydrocarbons, additional analyses and experiments are necessary. In particular, considering the long-term safety assessment, it is important to determine whether the carbon (in the form of colloidal carbon, carboxylic acids and hydrocarbons) is continuously released into the liquid and gas phases during the corrosion process. Therefore, information on the temporal evolution of the carbon concentration should be obtained.
Note that the data obtained in this study were derived from water-atomized stainless-steel powders, which have a silicon oxide film on the surface of the particles. It is considered that the chemical form of stable carbon (i.e., 12C and 13C) is a solid solution in the powders. In contrast, it is considered that irradiated stainless steel generated by the operation of nuclear power plants has an iron and/or chromium oxide film. The chemical form of 14C in the irradiated stainless steel is not yet clear. Moreover, the effect of the chemical composition of the oxide layer and the effect of the chemical form of carbon in the stainless steel on the chemical form of the carbon released from the stainless steel have not yet been clarified. For the safety assessment of radioactive waste disposal, these effects should be understood.
ACKNOWLEDGMENTS
The authors would like to thank Katsuaki Kurahashi, Keiko Fukumori and Atsushi Kobayashi (Electric Power Engineering Systems Co. Ltd.) for helping to conduct the experiments and analyze the samples. We are also immensely grateful to Daisuke Sugiyama and Takeshi Ichiji (CRIEPI) for their insightful comments and suggestions.
SUPPLEMENTARY MATERIAL
To view supplementary material for this article, please visit https:/doi.org/10.1017/RDC.2018.130


 Open access