




This comment reflects on our work together to make the teaching of history at university level more inclusive. Eleanor joined SOAS’s History department in 2010 as lecturer in modern South Asian History. Sarah joined the Widening Participation team at SOAS and was Access Participation and Student Success Officer when we began our collaboration. Between 2021 and 2024 we designed and delivered a first-year module for all BA History students at SOAS, University of London that used the institution’s own history to examine how empire has shaped education in the past and continues to do so today. Taking shape over several years, the module was informed by wider discussions about history education, racism and inequality in the UK, including the Royal Historical Society’s 2018 Race Ethnicity & Equality in UK History: A Report and Resource for Change.Footnote 1 As we outline below, SOAS holds a distinctive place in these discussions. While its History cohort is more diverse than at many universities, its degree-awarding gap mirrors those at other institutions, while reported experiences of racism are consistent with those found elsewhere in the sector.
Our module grew out of reflections on how the situation at SOAS had taken shape, from a historical perspective. SOAS’s origins, as an institution founded to train imperial officials in the languages and cultures of colonised regions, informs the regional focus of its teaching, which centres on Asia, Africa and the Middle East in ways that clearly appeal to students from a wide range of backgrounds today. But how has this history also shaped the unequal dynamics of learning that are still evident in SOAS classrooms? Our module sought to use critical discussion of our own institution’s past as a platform for developing more inclusive ways of researching, learning and teaching about the world. Although grounded in a specific institution, the approaches and insights from this module speak to wider debates on inequality in history teaching and, on this basis, will be of interest to the broader scholarly community.
Eleanor designed the module in 2018, with the option running for the first in January and then again in September 2020. Shortly after this, the module became a core part of the BA History curriculum and a compulsory requirement for all first-year students studying BA History, and also Global Liberal Arts, at SOAS. Sarah saw this transition from optional to core as an important opportunity to study how inclusive teaching methods impacted student outcomes at the cohort level and our collaboration began at this point. Working together allowed us to bring together different but complementary expertise: Eleanor offered disciplinary and teaching expertise; Sarah brought experience in policy, evaluation and widening access to higher education for underrepresented students. This enabled us to design and deliver an innovative module while also collecting qualitative and quantitative data that show clearly the positive impact of these methods for addressing racial, and other, awarding gaps within the history classroom. In this comment we explain how the module took shape, the aims we sought to achieve through creating this learning space and what we see to be the key outcomes of our work.
SOAS: a distinctive history and a distinctive present
The idea of making SOAS’s institutional history a subject of student enquiry took shape through our active engagement with contemporary discussions about educational inequalities in general, and in relation to the study of History in particular. Eleanor’s teaching on the history and legacy of the 1947 partition of British India had made her aware of debates about how partition, and other aspects of British imperialism, are taught (or not) in UK schools. A series of published reports, including the Royal Historical Society’s 2018 Race Ethnicity & Equality Report and History Lessons: Teach Diversity In and Through the National Curriculum,Footnote 2 provided important and detailed overviews of how students of colour were systematically marginalised in the history classroom, beginning at the school level. Debates, events and many important new initiatives around the same period also provided further sources of inspiration.Footnote 3 The introduction of new history programmes that made race a central focus of historical scholarship, such as the MRes programme on the history of Africa and the African diaspora at the University of Chichester and the MA in Black British History at Goldsmiths, were particularly formative for the early stages of developing the module. The deeply troubling closure of these two programmes in recent years has made us all the more committed to sharing our findings and data, and to making the case for the continuing importance of this work.Footnote 4
With a student body largely educated in the UK the SOAS History department is entangled in the same structural exclusions as other departments nationwide. Yet, it also appears as an outlier in how exclusion is mapped and discussed. Much of the conversation about racial inequalities in History teaching has focused on curricula and what is being taught. One of the key recommendations of the 2018 Report was to avoid Eurocentric curricula.Footnote 5 There has also been considerable emphasis in these debates on ensuring greater diversity amongst student and staff populations.Footnote 6 By these measures, SOAS is ahead of most universities in advancing curricular and demographic diversity.
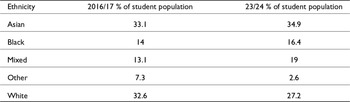
SOAS’s student body is one of the most ethnically and racially diverse in the UK. It comprises around 6,000 students, just over 50% of whom are undergraduates.Footnote 7 International students make up around 25% of its student body though this proportion varies significantly from programme to programme. London institutions have higher proportions of students who identify as Black, Asian and Minority Ethnic as compared to the UK as a whole, but at SOAS these communities make up a bigger share of the university’s student demographics than at other London institutions. Until relatively recently, national conversations about the awarding gap have tended to group these communities together under a single acronym BME – Black Minority Ethnic. SOAS has seen a steady increase in the percentage of its ‘BME’ student population in recent years (see Table 1).Footnote 8
From SOAS Equality, Diversity and Inclusion: Annual Report, 2022/23, 29

SOAS’s student body is also diverse in terms of socio-economic status. According to its Access and Participation Plan, at least 40% of SOAS’s UK-domiciled undergraduate intake over the last six years have come from the 40% most disadvantaged background, based on the Index of Multiple Deprivation 2019 dataset, with over 20% coming from the most disadvantaged postcodes (see Figure 1).Footnote 9
SOAS UG student population by IMD 2019 Quintiles. Taken from the OFS Access and Participation Data Dashboard, https://www.officeforstudents.org.uk/data-and-analysis/access-and-participation-data-dashboard/data-dashboard/.

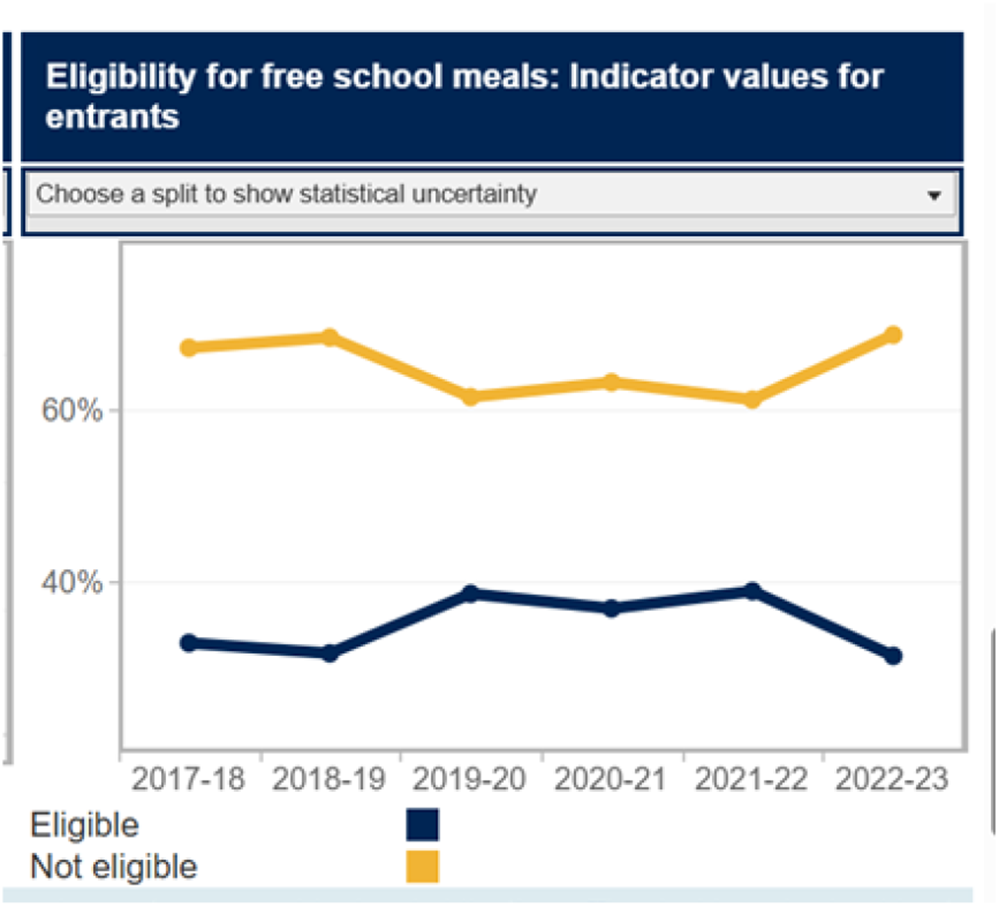
In the same period, 38.6% of the SOAS student body was eligible for Free School Meals at Key Stage 4, over double the sector average (Figure 2).Footnote 10
SOAS UG student population by eligibility for Free School Meals at Key Stage 4. Taken from the OFS Access and Participation Data Dashboard, https://www.officeforstudents.org.uk/data-and-analysis/access-and-participation-data-dashboard/.

This broad institutional context plays out in the SOAS History department in distinct ways. SOAS offers undergraduate, taught postgraduate and research degrees in history. At all levels, these degree programmes teach the discipline through a focus on the histories of Asia, Africa and the Middle East. We have modules that deal with global connections and mobilities but none of our modules focus primarily on the histories of Britain, Europe or the West. Our methodology modules proceed from the challenges and opportunities of this approach, asking how the discipline has been viewed and engaged with by scholars of and from regions of the global South.
The department’s undergraduate student body is significantly bigger than its postgraduate one. Of our undergraduate population the majority come from communities that historically have been grouped under ‘BME’ though the university now separates this into categories of Black, Asian, Mixed and Other. Table 2 gives an overview of BA History (single or joint honours) student ethnicity using this disaggregated format in 2016/17 (the year of the RHS report) and in 2023/24.
History Department – Students studying BA History (single or joint honours) by ethnicity

The number of students recruited by the department has grown since 2016. As with History programmes in other small, non-Russell Group institutions, this growth has much to do with an expansion in the number of students studying History as part of a joint degree.Footnote 11 In 2017/18, 124 of 224 undergraduate students studying History at SOAS were on a single honours degree programme. In 2023/24, there were 118 students enrolled on the single honours History programme and 150 enrolled on the joint honours degree.
In terms of student demographics, SOAS History recruitment stands in stark contrast to the data presented in the RHS’s 2018 report that showed that the proportion of white students studying History was larger than the proportion of white students in the UK student body as a whole. Given the department’s focus, these figures seem to affirm one of the core arguments made in the report that more diverse curricula attract more diverse student bodies.
It is important to acknowledge the historical factors that have created this situation. The department’s regional focus, and the appeal this holds to a more diverse student body, emerges not from a project of educational reform or liberation but from the institution’s origins within colonial power structures. SOAS was established in 1916, as a specialist college in the University of London with a twofold mission: to provide professional language training to colonial officials, businesses and missionaries, and to be a consolidated home for Oriental Studies scholarship in London.Footnote 12 Since the 1950s, its focus has become primarily academic, moving actively away from ‘Orientalist’ scholarship to expand into modern Area Studies, though retaining a strong focus on teaching and research in the languages of Asia, Africa and the Middle East.Footnote 13 Today it comprises arts, humanities and social science departments, with no STEM subjects, but has preserved its geographic focus.
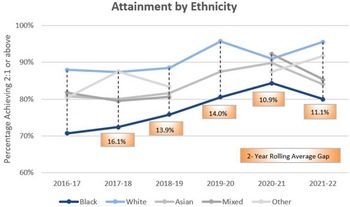
While SOAS History appears unique in terms of its focus and student demographics, it aligns with other UK universities in terms of data relating to student outcomes. Institutional-level data show that SOAS has a significant racial degree awarding gap, even if this is slightly smaller than the sector as a whole (Figure 3).Footnote 14
Percentage of UK-domiciled students at SOAS awarded a degree of 2:1 or above by Ethnicity at SOAS, from SOAS Access and Participation Plan 2025–26 to 2028–29’, 36.

In September 2016 the SOAS Student Union published a report into the ethnicity attainment gap in the university. Titled Degrees of Racism it surveyed 299 SOAS undergraduates and ran focus groups to generate extensive qualitative evidence of racial exclusion at SOAS.Footnote 15 Work by student sabbatical officers and the student-led ‘Decolonising Our Minds Society’ prompted academic colleagues to establish a staff–student Decolonising SOAS Working Group to address issues of historically embedded racism and inequality.Footnote 16
SOAS’s institutional and department-level data show clearly that while teaching about global majority regions might create more diverse classrooms, these are not necessarily inclusive. As Meleisa Ono-George reminded us in 2019, moving ‘Beyond Diversity’ requires historians to grapple with pedagogy itself.Footnote 17 These scholarly insights and local efforts guided our decision to design a module on SOAS’s own history.
Our module
Eleanor’s idea for the module that became H103 Colonial Curricula emerged in 2018, through curriculum reform discussions, SOAS teaching initiatives tied to the Higher Education Academy and TEF, and wider debates on race and inequality in History teaching. History colleagues were facing growing institutional pressure to consolidate the programme curriculum, with fewer small class options and more large, compulsory modules to support cohort social cohesion, while reducing teaching resources. Department teaching has traditionally been organised around regional expertise but this context created new incentives to think about the kinds of questions and problems that connected the different modules in our programme. The impact of imperialism on the ways in which the geographic regions studied at SOAS are seen and the forms of knowledge and social categories that have shaped this study seemed to be a point of concern in all the modules we taught.
Looking at the history of SOAS provided a means to think about how the regions on which the university focuses, Asia, Africa and the Middle East, have been viewed in scholarship over time. The primary focus of the module from the outset though was to explore the historical relationship between imperialism and education through SOAS’s past, rather than to provide an institutional history. In this Eleanor looked to antiracist pedagogical approaches which emphasise that challenging racism requires openly acknowledging how race structures society and the classroom itself.Footnote 18 As the discussion above has shown, the way that race shapes learning spaces at SOAS is deeply informed by imperialism and its legacies. Eleanor began developing a module that examined SOAS’s institutional history in ways that enabled students to understand and analyse the historical power dynamics of imperialism and to consider their legacies into the present. What these structures meant for how people of colour came to and experienced learning in the institution was of primary concern here, but the focus on imperialism in university settings also enabled a deeply intersectional approach to this discussion. The module explored how hierarchies of class, migration, gender and ableism articulated and worked alongside structures of race in imperial ideologies.
The aim was to place SOAS and its history within debates on university learning and colonial knowledge. The module focused on the disciplines taught, the logics that shaped them, and how these shifted over time, paying close attention to the ways race was embedded, explicitly or implicitly, within these frameworks. It began with an examination of ‘Oriental Studies’ at the turn of the twentieth century and how this underpinned the way languages were presented and studied at SOAS, the early focus on history (which was initially very focused on ancient periods) and arts and objects. It moved on to consider SOAS’s role in driving the turn to ‘modern’ Area Studies in the postwar years, and the arrival of new disciplines including anthropology (much later than other London institutions) and political economy or development. The fact that the natural or physical sciences were never thought to be important to SOAS’s curriculum was also explored.Footnote 19
This shaped the structure of the ten-week course which began with an introductory session that explained the main aims and approaches of the module. Week 2 provided an overview of the role that university learning played in British imperialism as a way of situating SOAS’s history. Of course, while SOAS is unique in being a university founded specifically for educating colonial officials, it was always one, relatively small, cog in a much bigger imperial training system that was established long before 1916.Footnote 20 This session, and the module as a whole, drew extensively on the institutional history by Ian Brown that had been published to mark SOAS’s centenary year in 2016, essays in David Arnold and Christopher Shackle’s earlier volume about the School, as well as published material about SOAS’s opening and documents from its archive.Footnote 21 The module moved from there to explore colonial knowledge production in relation to specific disciplines, both those taught at SOAS (language learning, history, economy and development studies) and those that are not (natural science).
Each of the discipline-focused sessions was divided into three parts. The first looked at how colonial ideas and practices informed the formation of the discipline and its approaches; the second looked at when and how the discipline came to be studied at SOAS and the final section of each week looked at how academics, and non-university scholars, were seeking to challenge the legacies of colonialism in this field, by developing research methodologies that foregrounded very different power dynamics, of liberation, care and reparation. Repeating this threefold structure each week helped students trace the impact of European imperialism on intellectual and academic practices, reflect on its implications for our own institutional context, and engage with practical examples of how others are challenging entrenched power dynamics, and how we, individually and collectively, might do the same.
Eleanor found that focusing on these overarching learning objectives prompted her to think carefully about the role of reading in the module. While it was important that students understood how imperialism had shaped the production of knowledge and the different ways in which scholars, from a range of disciplines, had tackled this issue, the core objective of the module was to support students to think independently, and collectively, about how they could challenge, rather than reproduce, oppressive and unequal power relations in their own learning and scholarship. This required curating space for collective and reflective discussion that was managed in ways that were as inclusive as possible. Setting long, theoretical reading texts, and then focusing tutorial discussions on how students understood the authors’ ideas would clearly not help to create space of this kind. Instead, Eleanor used class time, and online resources, to present a set of key works or arguments from the set readings to students in order to raise questions for group discussion. Students were given access to these works in full but it was made clear that participation in class conversations would be possible and expected even without reading these pieces in advance. Instead of presenting a closed canon, the module reading list was framed as a curated conversation, opening space for multiple voices, perspectives and disagreements. Ensuring discussion was framed around critical questions and points of enquiry was as important as centring the readings themselves.
To provide some examples of how this worked in practice, the session on language learning began with a short lecture looking at how imperial imperatives shaped perceptions of what constituted different languages and how these were to be taught through three case studies. The first looked at the East India Company’s attitude to Indian language in early colonial India,Footnote 22 the second looked at how missionary education and printing shaped ideas of ethno-linguistic identity in Southern Rhodesia,Footnote 23 and the final piece discussed was Ngũgĩ wa Thiong’o’s account of starting school and being prohibited from learning in Gĩkũyũ.Footnote 24 The regional range of these case studies highlighted how colonial models of civilisation centred on writing cultures, portraying African societies as ‘people without a script’ and therefore underdeveloped. It also drew students’ attention to how such ideas produced hierarchies of development among different colonised regions as well as between the global North and South. Students were given a brief account of the different languages taught at SOAS, including the institutional division between Asian (‘Oriental’) and African languages and the fact that the A for Africa was only added to the institution’s name in 1938.
The class discussed the tensions produced in setting up a prestigious institution in the imperial metropole for studying and teaching languages which were often viewed with disdain by administrators in the colonies. Staffing in the department was diverse from the outset, though also marked along racial lines. International scholars were hired to teach languages on a more ad hoc basis. For example, Jomo Kenyatta, who went on to become Kenya’s first Prime Minster, taught Gĩkũyũ at SOAS while studying for his doctoral thesis under Malinowski at LSE. The majority of the more permanent posts were held by white scholars, though many from less than conventionally elite backgrounds, often born outside the UK, either in British colonies (such as Beatrice Honikman who was born in South Africa), or from other European regions (such as Alice Warner, born in Austria). A striking number were also women, reflecting the significant influence that European women were able to exert on colonial policy and practice by the early twentieth century.Footnote 25 We also discussed the student body of this time, which included colonial officers, but also students from the region, and connected diasporas. American actor, artist, athlete and civil rights activist Paul Robeson studied Swahili and phonetics at SOAS in 1934, when he also met Kenyatta. This period was clearly formative for his politics and process of self-development, including how he perceived his relationship to the African Continent.Footnote 26 Students were invited to reflect on how the ways of thinking about language and power in the first discussion could be seen to play out in the dynamics and learning spaces of SOAS.
The final section of the class turned to consider how scholars were approaching questions of language learning in ways that challenged the many issues and hierarchies highlighted in discussions so far. This was initially framed around the debates between Ngũgĩ wa Thiong’o and Chinua Achebe about the use of the English language by writers and scholars in the African continent.Footnote 27 However, from the first time it ran, this part of the module quickly became focused on discussions amongst students about the dominance of English in diaspora communities and the importance, and challenges, of heritage language learning. In response to this, EN filmed an interview with SOAS masters student Adékúnmi Ọlátúnjí discussing their work on heritage language learning practices and policies within the Yorùbá diaspora to share with students.Footnote 28
The session on history used Dipesh Chakrabarty’s Provincialising Europe to draw out how Eurocentric development was ‘hard baked’ into historicist narratives, before turning to focus on the work of Roland Oliver at SOAS.Footnote 29 Oliver started the first African History seminar in the UK and argued fervently that the African continent had a rich history to be studied. Later in his career, however, his continued adherence to Hamitic theories of development and belief that civilisation was shaped by forces external to Africa drew criticism from younger scholars, many based in newly established universities across the continent.Footnote 30 The anthropology session used Adam Kuper’s work to provide a broad overview of the history of anthropology in the UK, and in London, at LSE, in particular.Footnote 31 It considered the initial absence of anthropology at SOAS – the subject only arrived at the School in 1949 when Christoph von Fürer-Haimendorf, an Austrian student of Malinowski who was undertaking field work in British India, was hired as a cultural anthropologist. The class explored the archive of von Fürer-Haimendorf’s work held at SOAS critically, through Sanjib Baruah’s 2015 discussion of his refusal to engage with the political claim-making and mobilisation of the communities he studied in North-East India.Footnote 32 We then turned to the critique of anthropology that Faye Harrison first set out in 1997 and which has informed ongoing debates about ‘Decolonising Anthropology’.Footnote 33
The focus on exploring the politics of knowledge production shaped modes of teaching delivery and pedagogy as well as course content and reading lists. Eleanor drew particularly from bell hooks’s argument that building inclusive learning spaces requires connecting the political and personal and allows students to bring lived experiences to bear on the material they are discussing in class.Footnote 34 From the introductory session onwards, Eleanor was explicit that her role was curatorial and facilitative rather than that of expert and actively invited students to recognise themselves as participants in a process of problem posing and knowledge finding, rather than passive recipients of information in a ‘banking concept’ of education.Footnote 35 Each session challenged claims of ‘universal truth’ to understand and identify how academic approaches and forms of knowledge reflected particular experiences and political structures. Participants were encouraged to shine that analytical lens back onto their own ways of thinking and assumptions about learning and to take time to think reflectively about their contributions to group discussions and those of others.
To help structure collaborative, creative and involved engagement, Eleanor organised class discussions around small group peer-to-peer conversations that were then scaled up to bigger class plenaries. Students were invited to record their group responses using whatever form they found comfortable: through words, but also through pictures, mind maps and graphics with much encouragement to co-write, co-draw or co-produce a single representation of the group conversation. Eleanor brought pens, pencils, large sheets of paper and Post-it notes to every session and then photographed student outputs, which were archived on the virtual learning environment for the class to reflect on, highlighting the value and importance of these outputs for the cohort as a whole.
Attention to creativity and communication was also centred in the assessment of the module which asked students to design an output (the format of which was open) that took one of the ideas from class discussions and communicated it to a clearly defined audience in a non-academic format. Marking the first cohort’s assessments brought home the complications of such a different, more creative format and made it impossible to ignore the power of the teacher to determine what success and validity look like in this context. The second time Eleanor ran the module she adapted the assignment to include a statement by student-creators about who their work was for, why they thought their project was important and the kind of change in thinking they wanted to create through it. This became the framework against which the success of the project was assessed, emphasising the agency and responsibility of the student as a producer of knowledge.
Colonial Curricula ran as an optional module for the first time in January 2020 with around fifty undergraduate students enrolled.Footnote 36 While the majority of these were history students around 20% of the cohort were from other disciplines, including some on study abroad programmes. Levels of participation in the discussion groups were high as students evidently enjoyed discussing their different views not only of written sources but also of their own formal and informal learning experiences. Managing discussions in the classroom was not always easy or comfortable but facilitation and the open structure of the sessions also enabled the cohort to develop trust and mutual investment in the module’s aim and to take responsibility for sharing and listening to each other.
Just as the cohort had begun to find its flow, the sessions were interrupted by the Covid pandemic. The isolation of lockdown further magnified the engagement of the Colonial Curricula classroom space. Students were given extended deadlines to cope with the disruption but as the work came in, the creativity of the group sessions shone through. Submitted projects ranged from hand-drawn zines, to posters, paintings, films and podcasts. The sense of personal ownership and often pride in this work was unmistakable.
The module ran again in September 2020, this time fully online. The more isolated nature of this working took its toll on discussions but all members of the cohort worked hard to maintain the highly conversational element of the module, using zoom break-out rooms and a variety of digital tools, including Zoom whiteboard, Jam board and Padlet, to capture conversations. Again, students produced an array of outputs but a significant number chose to develop a lesson plan or learning resources for secondary school pupils. In the context of lockdown online teaching, students seemed to have a heightened awareness of the politics of the classroom and to have strong views about how school learning was and could be managed. It seemed that students were using the creative assignments as an opportunity to go back and share with current school students what they wished they had known when they were their age. Eleanor mentioned the cohort’s interest in school teaching material to Sarah in early 2021, who was immediately interested in this as relating to the aims and interests of her team.
While the main focus of the Access Participation and Student Success (APSS) team had been on bringing students from underrepresented backgrounds into university, by the late 2010s the team was beginning to expand its activities to support these students’ success and attainment once within higher education, often through peer-to-peer learning. The APSS team employs Student Ambassadors to support them. The ambassadors all come from groups that are underrepresented in higher education. Providing students from more marginalised communities opportunities to participate in institution initiatives helped to enhance student belonging and confidence within the institution. Student ambassadors also bring much to school outreach and access work, helping potential applicants from underrepresented communities to see that the university included people from a wide range of backgrounds, including those like their own.
Sarah invited students from Eleanor’s module to design sessions for that year’s APSS summer school for year twelve pupils, using the material they had produced in class. Two students signed up, one of whom had previously attended an outreach activity similar to the summer school. They worked with us to design an interactive online workshop which they delivered to twenty-two students in August 2021. Student feedback showed that for many student attendees this workshop had been the highlight of the summer school.
During Covid, SOAS faced severe cuts that required restructuring the curriculum around fewer, larger classes. The department’s learning and teaching committee responded by making Colonial Curricula a core first-year module for all BA History and BA Global Liberal Arts students, a decision that met institutional needs while sustaining a commitment to inclusive teaching. Sarah was interested in what this move from optional to compulsory status would mean for the cohort’s journey through their BA programme. In addition to working directly with students, the APSS team were also committed to engaging with academic colleagues in work to support student success and attainment in the university. The more creative structure of the module, and its focus on engaging critically with the university as a complex and historically unequal institution, connected to the Access, Participation and Student Success agenda while also creating opportunities to develop new approaches. Sarah proposed that we work together to redesign the module in ways that could centre the school-to-university transition in practical as well as theoretical ways.
Teaching inclusive histories collaboratively
We used the Transforming Access and Student Outcomes in Higher Education (TASO) theory of change model to redesign the module (Figure 4). The SOAS APSS team use evaluative practices and tools developed by TASO, which supports evidence-informed practice to tackle inequalities in higher education.Footnote 37 The framework is clearly structured around a set of questions that helped us to articulate clearly our main aims, and to identify the processes by which we would work to secure them and the ways we would assess our impact. It also gave us a shared language to articulate pedagogy more clearly and to communicate effectively across different areas of expertise.
Core Theory of change template accessed from https://taso.org.uk/libraryitem/core-theory-of-change/.

Alongside TASO resources, we used frameworks created by the Network for Evaluating and Researching University Participation Interventions (NERUPI)Footnote 38 to set clear objectives for the module. Our aim was twofold: to raise student awareness of how race and imperialism shaped academic knowledge and knowledge making, and to show how such teaching could foster skills for success across their studies. We wanted students to reflect on their positionality, identify the skills needed for academic success and develop personalised strategies for building them.
We mapped outcomes at different levels. In the short term, we wanted students to identify key academic skills, strengthen critical thinking and engage with an accessible yet challenging curriculum relevant to the twenty-first century. In the longer term, we aimed to help them consolidate communication and study skills and apply their knowledge to different audiences beyond the degree. The ultimate goal was to reduce the awarding gap and improve continuation rates at SOAS.
Evaluation was central to this. We gathered both qualitative and quantitative data, with student attainment as one focus but always within the broader context of skills as the foundation of learning. We revised assessments to balance creativity with clarity. Students continued to produce an output on a theme of their choice but now selected from three formats: a film/podcast, a visual resource/poster or a workshop plan. We provided detailed guidance to ensure parity of workload and expectations across formats, added workshops to support preparation and made project planning a formative task.
To reinforce skills development, we collaborated with The Brilliant Club, a UK-wide university access charity that supports students from marginalised backgrounds gain entrance to and succeed in competitive universities.Footnote 39 Dr Claire Harrill (Year 1) and Dr Alex Owens (subsequent years) adapted the Scholars Programme training into a session that helped first-years understand university teaching while honing their own communication skills. This encouraged students to think strategically about their final assignments and apply the same planning processes to their wider learning.
Finally, we used this skills framework as a scaffold to review the entire module, ensuring each element was aligned with the outcomes and that students could see how different components interlinked. We expanded the original framing sessions for the module to give ourselves more time to introduce students to its aims and approaches. The first introductory session focused on welcoming the students and getting them to share on their learning and perceptions of university so far. The second session provided a clear historical overview of the role that universities played in British colonialism, to help students situate SOAS within this. The third session set out and compared different frameworks for talking about race and inequality, beginning with postmodern and postcolonial thinkers, particularly Edward Said,Footnote 40 then looking at critical pedagogy and anti-racism through the work of FreireFootnote 41 and hooksFootnote 42, as well as the decolonial methodologies of Tuhiwai Smith.Footnote 43 This provided students with a set of tools and approaches from which to draw as we moved to focus on the histories of different disciplines.
We deliberately shaped the conversational format of each session to reinforce the assessments’ emphasis on teaching and communication skills. We also knew that we needed to support engagement differently with larger cohorts. To that end, a ‘class contract’ was introduced in the first session setting out principles for participation which students were invited to talk through, change or amend, subject to group discussion. We used tools, such as Mentimeter, to capture the views of the room in new ways and adapted the questions for each class so as to encourage and support discussions. Each of the discipline-focused sessions opened with a broad question asking students how they understand the discipline in ways that could draw out some of the power dynamics we were looking at: ‘What do historians study?’, ‘Why study a non-European language?’, ‘What do anthropologists do and for whom?’ These more open ended, speculative questions at the start of the class got people talking with those next to them and, through the screen technology, across the room. The sessions then moved into the three-part format previously established, with short lectures and group discussions of critical questions relating to these. Students discussed these questions with the people sitting close to them, recording their answers in either written or visual/pictorial format. We used a variety of digital and non-digital tools to capture responses. Students made mind maps, used post it notes and engaged with questions on Mentimeter to capture their conversation in whatever way felt most comfortable. As before we collected these contributions at the end of each discussion session and shared them with the cohort, both in the session itself and online, through the virtual learning environment.
Each year we worked alongside two, and in one year, three graduate teaching assistants, all of whom were SOAS Ph.D. students, who joined us as class facilitators. Emphasising the co-produced nature of the module, we invited these teaching colleagues to contribute to class planning and lead sections of discussion. The teaching group met each week outside class to look over session plans and prepare for the next class. The thoughtful input and knowledge, including new readings and case studies, offered by colleagues strengthened the module year on year.
This collaborative approach to reading lists enabled us to draw out more clearly how ideas of race, social hierarchy and exclusion operated in the disciplines we were looking at. We used sections from Priya Satia’s Times Monster to think about how historical writing had informed understandings of self and morality, being used to justify moral positions that were premised on social distinction and distance from those affected by imperial violence.Footnote 44 We adopted Emma Wolukau-Wanambwa’s beautifully written and brilliantly insightful essay on Margaret Trowell’s work in Uganda to consider how imperialism has shaped historical and present day conceptions of art, and artistic education. Wolukau-Wanambwa demonstrates how Trowell’s colonial, racist and essentialist definition of ‘Ugandan art’ has, under the weight of westernised curricula and art-market branding, been reimagined as the authentic expression of Ugandan creativity.Footnote 45 One of our student teachers introduced the Civic Laboratory for Environmental Action Research (CLEAR), an interdisciplinary lab that works with local communities.Footnote 46 This example helped us reflect on the kinds of erasures, of non-western forms of knowledge and people, that the division between scientific and other disciplinary practices entail, as well as the logics that meant that hard sciences were never considered a subject to be included in SOAS’s original curricula.
In the interest of mutual knowledge production, and ethical concerns about informed consent, we took time to explain clearly to each student cohort, and to all the teaching staff involved, that we were analysing our work by evaluating student feedback and student outcome data to understand whether the module was achieving the aims we had set for ourselves. We made time in the opening session of the module to discuss the school-to-university transition and asked students to reflect on the expectations they had of university in terms of their own experiences as well as what learning in the institution would be like. We developed a reflective survey based on NERUPI framework objectives to ensure that the data we gathered could connect to broader evaluative processes.Footnote 47 We asked students to complete the same survey at the end of the module in order to see themselves and show us how their skills and sense of self-confidence had changed through the module. We were clear throughout about how this data would be used.
We maintained a connection between H103 Colonial Curricula and the APSS summer school throughout this period. At the end of the academic year, students were invited to use the material produced in their assignments to design a summer school session for sixth form students and, in the final year of the module, Year 10 students. We supported them to adapt their material and paid them for their time, both preparation and in the classroom. These sessions always received positive feedback from the school students as well as the university students who delivered them.
Taking learning beyond the module
In early 2023, Sarah proposed we expand this format. Up until this point we had offered the summer school teaching opportunity to one or two students. Sarah suggested we now work with a larger group to adapt the material made in the module as free learning resources that could be downloaded from the SOAS website. She identified funding in her team budget that could be used to pay students for this work. We were lucky to have three qualified teachers on the MA History programme at SOAS that year who were supportive of the initiative and acted as paid consultants in the development process. What we eventually titled the ‘Disruptive Histories’ project provided more students with a positive experience of applying the research and ideas developed in their assignment projects in real-life scenarios. We felt that these original resources, produced by students from communities whose voices were not ordinarily dominant in school learning material, would also contribute to the work that many secondary school teachers across the country are doing to diversify their own classrooms, often with little additional budget or resource.Footnote 48 The project produced nine different lesson packages, covering a broad range of themes, each of which included guidance for teachers, a scheme of work and learning resources aimed at KeyStage 3 and 4 students.Footnote 49
In conversation with our teacher consultants, we found that while the projects were produced by students studying history and reflecting on historical processes, it would be hard for school teachers to potentially fit this material into existing history-specific curricula. Presenting the resources as material for Personal and Social Education, and Citizenship lessons gave us more leeway to explore the themes and topics our students had been interested in. One of the second-year students who developed resources looking at linguistic imperialism commented that:
Creating lessons for a younger age group was interesting as it made me think about the topic in a different way … I had to think about myself in KeyStage 3 and KeyStage 4 and contemplate what parts of linguistic imperialism would’ve been relevant to my life at that time … I think this project emphasised the importance of openness and constant dialogue when it comes to addressing and discussing issues tied with colonialism and imperialism. I intend to keep this at the centre of any more research I do in this field.Footnote 50
The site recorded over 600 views and more than 300 active users in its first four months of operation. We have not been able to generate precise data about how these resources are being used but they might help to inspire students from a broader range of backgrounds to see historical thinking as something that is relevant to them and which relates to questions that matter in their lives.
Evidencing and evaluating our work
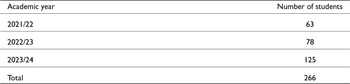
We have gathered data from the 266 students who took H103 Colonial Curricula over three years (Table 3).
H103 Colonial Curricula cohort sizes

Across the three years, 190 of the students who took the module were Access and Participation Plan target students, meaning that they came from backgrounds not traditionally represented in university settings.
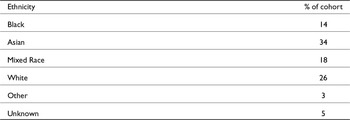
With each cohort, we collected the personal development data and tracked student performance in the creative assignments of the module. ST was able to map academic outcomes in the module against APSS data. We examined the racial awarding gap in the module, year on year and across the 266 student cohort as a whole, but we also broke down this data further, looking at socio-economic markers, alongside race. To create more meaningful statistical data and to contextualise data from groups of students that were numerically small in each year’s cohort we analysed findings from across all three years of studies (Table 4).
H103 Colonial Curricula all three years ethnicity breakdown in percentages

The results show that the critical pedagogy, creative assignment and strong focus on supporting students to generate work that speaks to their own lived experience produced more equal educational outcomes.
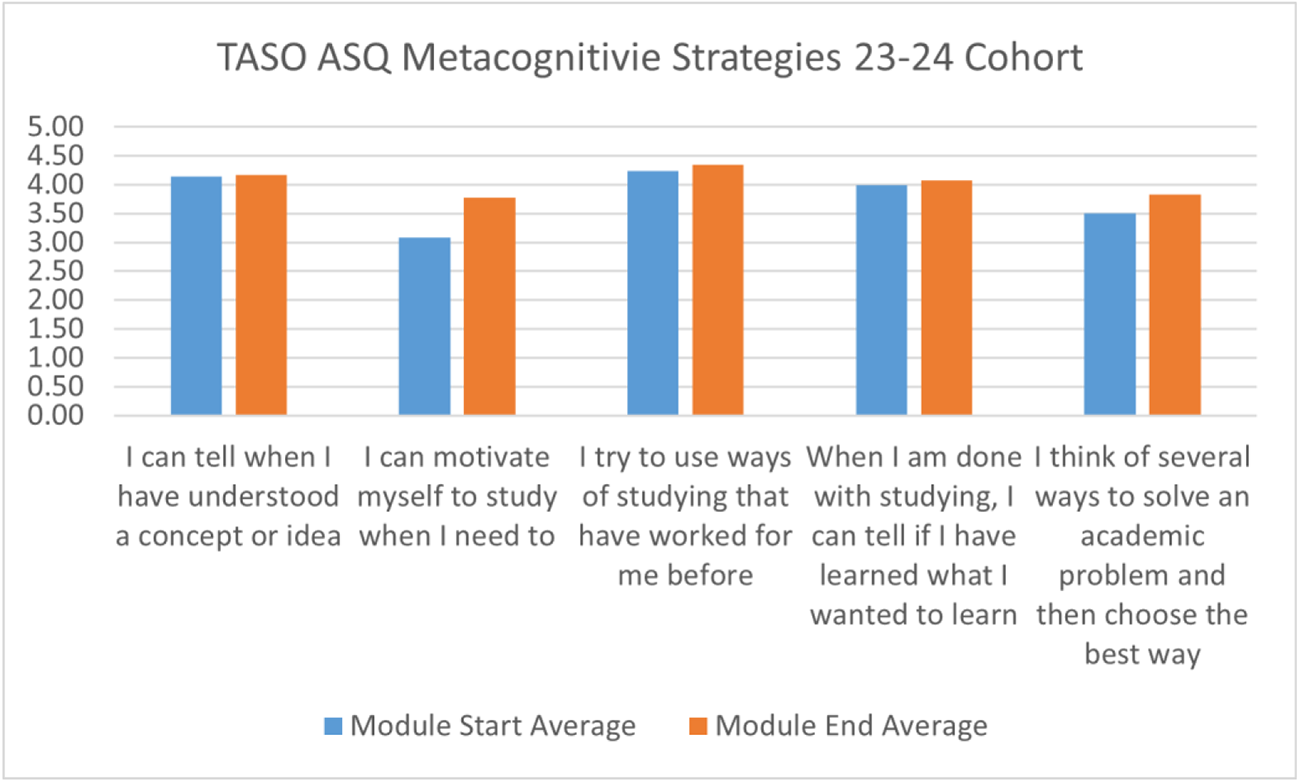
Responses to the reflective student success survey collected at the end of the module had always shown a positive change in students’ perceptions of their skills and confidence. For the 2023/24 academic year we used the Metacognitive Strategies section of TASO’s Access and Success Questionnaire.Footnote 51 Captured in Figure 5, the responses showed that, over the course of ten weeks, students felt they were better able to self-motivate themselves for study and showed more tendency to consider diverse ways of approaching a problem before deciding on an academic approach.
Metacognitive Strategies survey responses from 2023/24 H103 Colonial Curricula Cohort.

Qualitative data, collected from all three cohorts using student feedback forms and end of module reflection sessions, also showed the positive impact of the learning processes, particularly in terms of encouraging critical thinking. The anonymous nature of this feedback means we cannot see direct correlation between these comments and the demographics of the students providing them but they highlight some common recurring responses across the cohort. Many students expressed a sense of pride in the work they had produced for the module. Others commented that they felt the module had ‘given me tools to better my learning’. Student responses suggested that the module improved their understanding and supported better outcomes both in other academic modules and in wider societal contexts.
[This module helped me to] Rethink my perspective on ‘objective’ forms of knowledge. Understanding of their genealogies and their situation in the west.
This module has made me reconsider the ways in which we consume and present knowledge in learning atmospheres. I now feel that there are certain topics that would benefit from alternative modes of assessment and presentation.
Students also expressed appreciation for how the module connected to and helped them make more sense of their own lived experiences. As one student wrote:
[H103 Colonial Curricula] Makes you question all the things you learned at school, especially in history. Also all the things you miss out on learning – after 7 years of secondary school we have very limited a small view of the world which often gets taught several times. Science is always western, English is always western… the way we are taught is also western.
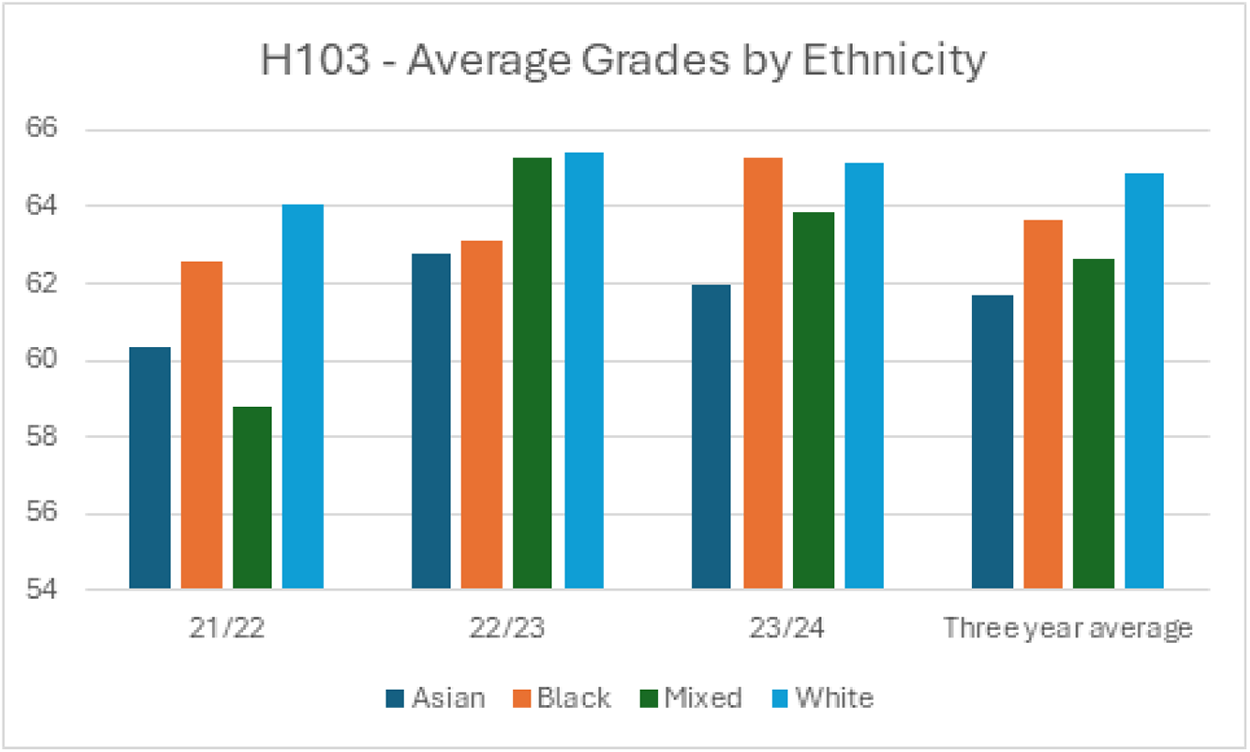
While student averages fluctuated year on year, some clear patterns still emerge (see Figure 6). Our data collection methods disaggregated different racial groups rather than using the single category of BME. In accordance with SOAS institutional practice we followed anonymous marking practices with all assignments. We have been conscious of the Covid impact on the module: the 2021/22 cohort which we taught just as SOAS was returning to fully on campus teaching, had lower grade averages than the 2023/24 cohort (Figure 6). However, across the three different cohorts, the average grades of students from all ethnic groups were largely the same, with students of Asian background receiving slightly lower average marks than other groups (Table 5). We are not able to provide a clear explanation for the lower marks amongst Asian students but we have noted that many students in this group received grading penalties for late submitted work, in our module and in other parts of their programme, which took their marks into the lower second mark range. Even with this exception the average grades on the module show a relatively even rate of grade awarding across the ethnic groups who took the module.
Average grades by ethnicity for students taking H103 Colonial Curricula.

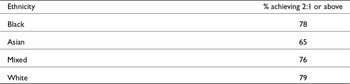
H103 Colonial Curricula 3 years combined data percentage of students achieving 2:1 or above

These results are significantly more positive than the awarding gap at the institutional level which was 10.4% difference between White and Black student awards at its lowest point in this same period. They also stand in contrast to broader UK trends (which are usually formulated around BME:White ratios rather than through separate group analysis) which show that reductions in the racial awarding gap during Covid, when forms of alternative assessment were more available, are now widening again.Footnote 52
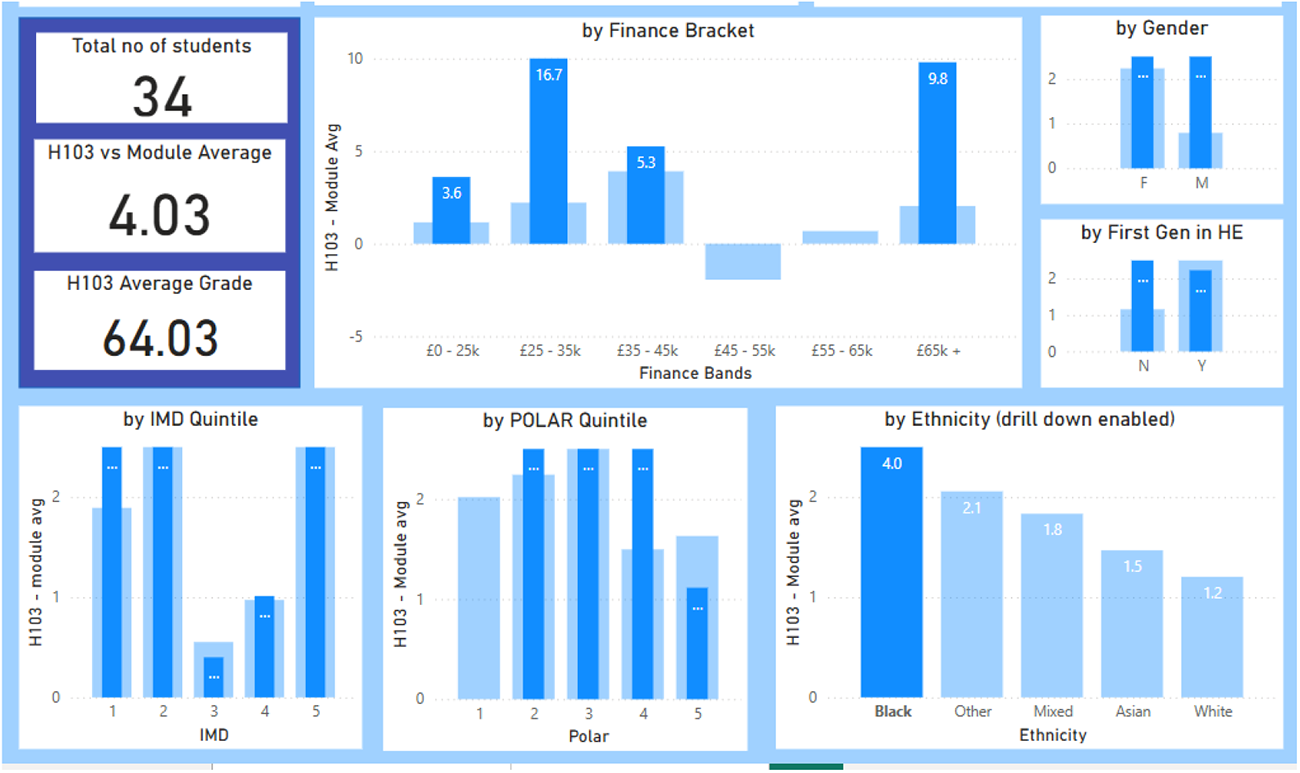
When set against their average grades, UK-domiciled Black students often did particularly well on the module with an average grade of 64 which was 4 marks higher than their module average across the year as a whole (see Figure 7). Significantly, this strong performance was present at both ends of the socio-economic spectrum. Black students from backgrounds marked as being in the first and second quintiles of the Index of Multiple Deprivation (74% of the 34 Black UK-domiciled students), that is, the most deprived communities, achieved similar marks above their module average to those achieved by Black students from communities who were part of quintile 5 of the IMD.
Analytic Dashboard of Data relating to Black UK-domiciled students who took H103 Colonial Curricula between 2021/22 and 2023/24 (the left-hand axis on the graphs denote the difference in students’ marks between their grades in H103 and in their wider module average).

For each cohort, we calculated the overall mean module mark based on all their first-year modules and then compared this with the group’s mean average mark on Colonial Curricula. The average for Colonial Curricula was higher for the 190 Access and Participation Target students, and was 2.88 marks higher for students who had completed a Foundation Year at SOAS, many of whom come from underrepresented academic backgrounds (see Figure 8).
Analytic Dashboard of Data relating to previously Foundation Year students who took H103 Colonial Curricula between 2021/22 and 2023/24 (the left-hand axis on the graphs denotes the difference in students’ marks between their grades in H103 and in their wider module average).

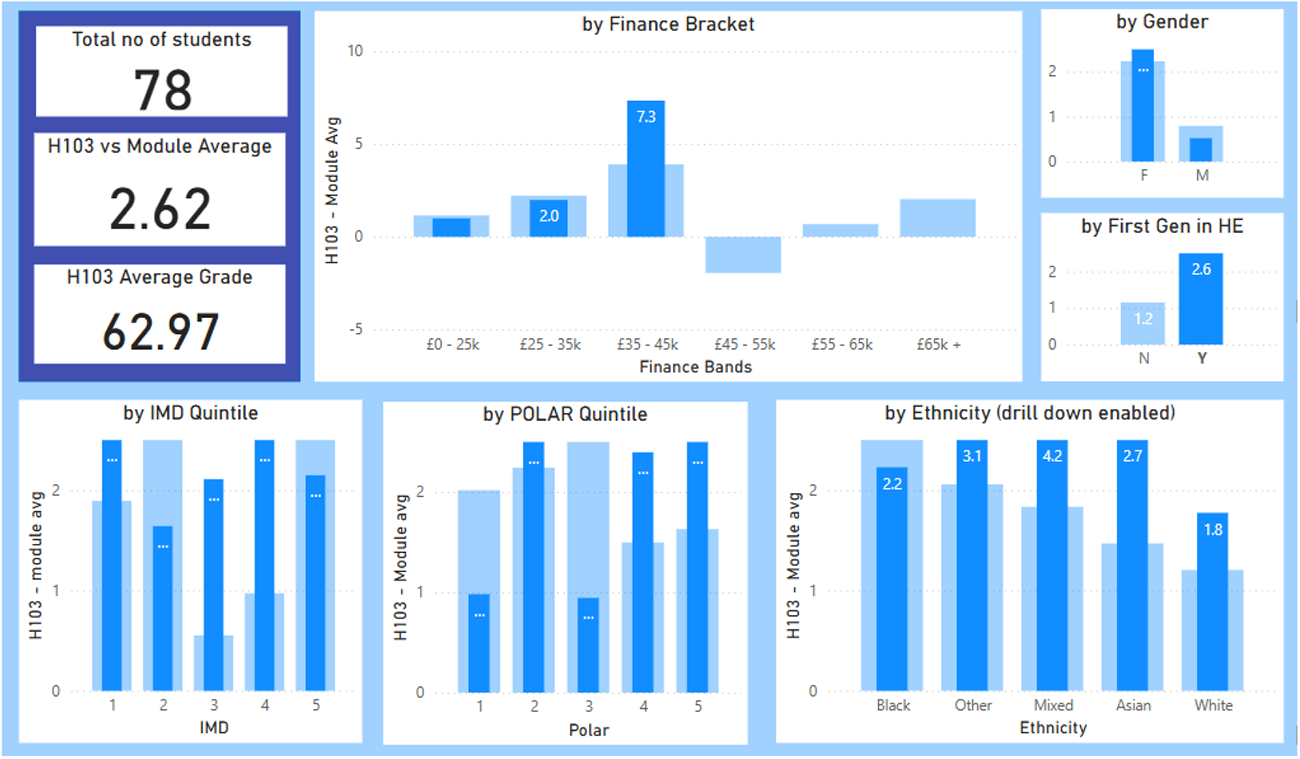
UK-domiciled First Generation students on average achieved 2.62 higher marks on Colonial Curricula against their module averages with the 27% of First Generation students from IMD quintile 1 (the most deprived backgrounds) having the most significant score above their module average at 4.29 marks (see Figure 9).
Analytic Dashboard of Data relating to UK-domiciled First Generation students who took H103 Colonial Curricula between 2021/22 and 2023/24 (the left-hand axis on the graphs denotes the difference in students’ marks between their grades in H103 and in their wider module average).

Our findings therefore show that inclusive, student-focused teaching not only helps reduce the racial awarding gap but also gives students facing overlapping barriers greater support to succeed at university. This affirms arguments that approaches that can be shown to minimise the White:Black awarding gap also contribute to more positive awarding outcomes for a broader range of students from a variety of underrepresented backgrounds.Footnote 53
At the same time, these data should not be taken to indicate that all students enjoyed or felt positive about the module. Each year we received a lot of feedback from students expressing a range of emotions including confusion with the format and approach of the module through to outright frustration and dislike. Across the three years there were always students who questioned our pedagogical approach and the way material was framed and who asked instead for more familiar teaching structures of lectures, tutorial groups and essay writing, feeling that this was more constitutive of ‘proper’ academic work. There was in each cohort a substantive group of students who felt that our creative and conversational approach reflected some kind of dumbing down or lack of seriousness about the subject material. A notable minority of students stopped, or never started, attending classes, although, in terms of percentage of cohort, our attendance numbers were above the departmental average in this part of the academic year. A number of these students were from racialised communities and, quite possibly, from first-generation and underrepresented socio-economic backgrounds. While our data show that these students may well have ended up doing better in this module than in other courses, some of the students themselves were sceptical of a different and what they saw to be an inferior way of teaching.
Even amongst those who regularly attended and enjoyed the module there could be some confusion between our student-centred inclusive approach and ideas of ‘student satisfaction’. Students were often quicker to state what they wanted from the module than to engage in (self-)reflective discussion.Footnote 54 To draw attention to the tensions this produced, we ran a mid-module survey halfway through the 2023/24 iteration of the module asking students to share with us what they liked about the module and what they were struggling with. We received several dozen anonymous responses which we collated and reflected back to the cohort, highlighting numerous areas of overlap between the positive and negative responses: some people liked the use of Mentimeter, others hated it; for some people group discussions were a highlight, for others they were an ordeal. We then used this as a basis to talk together about what building a group-focused learning space looked like and why doing so was important, recognising the challenges of this work, as well as the opportunities. The session did not provide a resolution to student grumbles, which continued through the term, but it did help to set out more clearly what was at stake in the approach we were taking, and how very different it was from usual teaching practices.
Final reflections and recommendations for further work
Our collaboration and findings highlight the importance of centring questions of inclusive learning, as well as cohort diversity and curriculum, in discussions about structural racism and educational inequalities in history, and all classrooms. The situation at SOAS shows clearly that cultivating a more diverse student body does not automatically lead to equality in educational opportunities and awarding outcomes. Thus, while the figures in the RHS’s 2024 Update that show a rise in the proportion of History students from global majority communities are to be welcomed, what this means in terms of degree outcomes, as well as further information about how race intersects with wider socio-economic characteristics, should be the major focus of scrutiny.
Examining questions of inclusive education alongside data on racial and ethnic demographics and curricula highlights other important forces shaping the teaching of History at university level. The financial crisis in UK Higher Education has widened the gap in History student recruitment between Russell Group and elite institutions and other universities,Footnote 55 contributing to decisions to downscale History departments and even close programmes, including those at Goldsmiths and Chichester mentioned above. Even as Russell Group institutions put energy into widening participation and access schemes, this situation means that a greater majority of history graduates are likely to be drawn from more educationally well-resourced backgrounds than has been the case in past decades. The 2024 Update notes that most gains in staff racial diversity have occurred in elite institutions, rather than in universities that historically have recruited more socially and educationally diverse student bodies.Footnote 56 While more evidence is needed to understand these shifts, focusing solely on race and ethnicity can create the impression of educational progress while continuing to ignore the marginalisation of other underrepresented groups in UK higher education, within which racialised communities are often well represented. Centring inclusivity and exploring how a range of socio-economic factors animate racial and other social hierarchies can contribute to building both more diverse and more inclusive learning environments.
With this in mind we end our reflections with a series of recommendations about what colleagues can do, both as teachers and lecturers and as members of the Royal Historical Society, within their institutions and in their own practice, to promote the kind of shifts we see to be important.
As members of professional History bodies:
1. We encourage colleagues to engage with calls on pedagogy and inclusive learning in relation to race and inequality in history classrooms, sharing their own work, reflections and crucially impact data. Encouraging more diverse student cohorts to study history is important but this alone does not build inclusion. There needs to be more discussion about how diversity work relates to, and can support, but also detract from, inclusive teaching. We would like to see professional bodies and their members gather and curate more evidence about the impact of different forms of inclusive learning in History teaching.
2. As part of the conversation about building more inclusive history teaching, colleagues need to think carefully about the structures of the history discipline itself. Given the imperial contexts in which many subjects, including History, took shape does an emphasis on disciplinary training itself undermine more inclusive learning methods? Should we focus on bringing inclusive techniques into existing History curricula or should we engage with inclusive pedagogy as a chance to reconsider how we think and teach about the past? In our class, the positive impact of our inclusive approach was facilitated by the coming together of our different kinds of expertise. In what ways can interdisciplinary collaborations, linking academics with professional services staff who engage students at different stages of the student cycle, help make history teaching more inclusive? We would like to see some of this discussed at subject level, in QA benchmark documents and professional bodies.
As members of university institutions:
3. Clear, accessible data are essential for addressing entrenched educational inequalities at both institutional and classroom levels. Lobby your institution to share transparent data on student characteristics and outcomes at programme and module level. Use this evidence to identify where inequalities emerge and to build awareness of how they operate in your specific context, as opposed to thinking in national, or even regional, trends. Encourage teachers to collect and reflect on data from their own practice, feeding it into wider discussions so that inclusive learning becomes a shared, institution-wide responsibility.
4. Our work shows that critical and inclusive pedagogies can be aligned with institutional policy and QA frameworks. While QA and TEF policies are tied to the marketisation of higher education, they also provide tools that, used carefully, can leverage inclusive change. We encourage colleagues to frame their practice in terms that resonate with institutional strategies – for example, highlighting ‘value added’ education – which makes such innovations harder to resist. Cross-institutional collaboration with Access and Participation teams, as well as educational development units, can also strengthen strategic approaches to embedding inclusive practice in QA and policy language
5. Our work focused on a single module but inclusive learning approaches are most successful when implemented across an entire programme. While many colleagues supported our efforts and the module was designated as a core requirement for all students, other modules in the History programme, including those taught by Eleanor, do not follow this approach. This inconsistency can create confusion and contribute to the perception among some students that the module is unconventional or ‘not proper enough’. Achieving department-wide buy-in for inclusive learning strategies is a significant challenge, but it is likely to become more feasible when combined with the other steps outlined here.
As individual practitioners:
6. Reconsider how you assess your modules. Traditional assessments can undermine efforts to break down classroom power dynamics. Ensure that your classroom approach aligns with how students work independently to demonstrate their learning. Creative and independent assignments allow students to connect learning to issues relevant to their lives, but they require clear rubrics and marking criteria to reduce bias. Be explicit with yourself and your students about assessment goals and involve them in discussing and refining these criteria.
7. Seek further training and Continuing Professional Development opportunities that will help you address the needs and characteristics of your student cohort. Understanding the distinct demographics and dynamics of your classroom student cohort can help you to consider what kinds of teaching approaches and exercises will be most effective for your students. Read a wide range of critical pedagogy literature but always think carefully about how this will play out in the context in which you are working, being aware in particular of the different histories of racialisation and power in North American and UK/European contexts. Use your training as a historian to think about the historical factors that play out in your own institution, drawing from, but adapting, the work of others to best support the particular groups of students you are working with.
8. Build alliances with like-minded people. The energy required to think about your teaching and students, about how you manage and assess the class in ways that push against the historically embedded structures of your institution, your own training and the wider sector, is enormous. You will often feel like you are swimming upstream in a very heavy-flowing river. It can be easy to doubt how you are approaching things or if the input required is producing outputs of any value. Finding people who share your values and approaches to discuss your successes, and the things that don’t work, is vital to sustain yourself and your work. Finding colleagues in your department or with whom you work regularly can maximise your energies and labour but be prepared to look further afield, to academics in other departments and beyond those in primarily academic posts. What unites this work is not disciplinary training, but a commitment to inclusive learning.
Acknowledgements
We would like to thank the three cohorts of students who took H103 Colonial Curricula with us and without whose generous engagement our work and this article would not be possible. Huge thanks also to the colleagues who worked on and developed the Colonial Curricula module with us: Ellan Lincoln-Hyde, Sarah Gray, Eyad Hamid, Julio Moreno Cirujano, Morag Wright, Aixia Huang, as well as Alex Owens from the Brilliant Club. We are grateful to Julien Boast and Andrea Janku for all their support, particularly in the early stages of our work together, as well as to the anonymous reviewers and to Transactions co-editor Jan Machielsen for their generous engagement and feedback on earlier drafts of this article.





 Open access

