


Introduction
Patients with obsessive-compulsive disorder (OCD) fail to respond adequately to first-line antidepressant treatment, such as selective serotonin reuptake inhibitors (SSRIs) or clomipramine, in ~40–60% of cases. In case of insufficient response, clinical guidelines recommend dose escalation or switching to an alternative drug. Treatment efficacy is typically evaluated after 12 weeks of treatment, which is long compared to other psychiatric conditions, such as major depressive disorder and schizophrenia (Carolyn Rodriguez, Bloch, Sachs, & Williams, Reference Carolyn Rodriguez, Bloch, Sachs and Williams2015; Fineberg, Brown, Reghunandanan, & Pampaloni, Reference Fineberg, Brown, Reghunandanan and Pampaloni2012; Koran, Hanna, Hollander, Nestadt, & Simpson, Reference Koran, Hanna, Hollander, Nestadt and Simpson2007). American Psychiatric Association guidelines recommend continuing for at least 8–12 weeks after reaching the maximum recommended dose before considering a patient a nonresponder (Koran et al., Reference Koran, Hanna, Hollander, Nestadt and Simpson2007), although the evidence for this timeframe remains debatable (Issari, Jakubovski, Bartley, Pittenger, & Bloch, Reference Issari, Jakubovski, Bartley, Pittenger and Bloch2016; Pittenger & Bloch, Reference Pittenger and Bloch2014). Identifying nonresponse sooner in the treatment process would benefit both patients and clinicians by enabling earlier adjustments in treatment strategies. If early indicators of treatment failure can be reliably assessed, clinicians may more promptly revise the intervention – such as by switching medication or introducing psychotherapy – thereby reducing treatment delays and minimizing patients’ experiences of failure.
In OCD, some relatively small studies have investigated whether symptom change after 4 weeks can predict eventual response to pharmacotherapy. However, definitions of nonresponse differed across studies, and most studies did not use a priori definitions of nonresponse, making these exploratory in nature (Ackerman, Greenland, & Bystritsky, Reference Ackerman, Greenland and Bystritsky1996; Brar, Sidana, Chauhan, & Bajaj, Reference Brar, Sidana, Chauhan and Bajaj2022; da Conceição Costa et al., Reference da Conceição Costa, Shavitt, Castro Cesar, Joaquim, Borcato, Valério and Diniz2013; Krompinger et al., Reference Krompinger, Monaghan, Gironda, Garner, Crosby, Brennan and Elias2017). Methodological differences in trial settings, patient populations, and chosen response times have limited the clinical utility of these studies. Nevertheless, these preliminary results do suggest that early response evaluation on an individual level might inform clinical practice, even though, on a group level, pharmacotherapy in OCD might take longer to show clinically relevant differences compared to placebo.
In the current diagnostic accuracy study, we aimed to investigate whether lack of improvement after 4 weeks of treatment could predict nonresponse at the end of the trial, on an individual patient level. In a meta-analytic framework, we utilized crude data from short-term, double-blind, placebo-controlled pharmacotherapy trials for OCD in adults. We hypothesized that early non-improvement would be predictive of nonresponse and explored the predictive accuracy across different patient and study subgroups.
Methods
We prepublished a protocol outlining data extraction and substantiating our choice of outcomes and covariates (link: osf.io/whm7r, also available in Supplementary Material). Our study was done according to the Preferred Reporting Items for a Systematic Review and Meta-analysis of Diagnostic Test Accuracy guidance, while taking into account that we did not perform a systematic review (McInnes et al., Reference McInnes, Moher, Thombs, McGrath, Bossuyt, Clifford and Willis2018).
Outcomes
The primary outcome was the diagnostic accuracy of the index test (early non-improvement after 4 weeks) for predicting the reference test (nonresponse at trial end). Early non-improvement was defined as <25% reduction on the Yale–Brown Obsessive Compulsive Scale (YBOCS), reflecting the minimal clinically noticeable improvement (minimal important difference), making it a relevant cutoff (M. Cervin et al., Reference Cervin, Storch, Farrell, Andersson, Rück, Geller and Mataix-Cols2025; Cohen et al., Reference Cohen, Zantvoord, Mattila, Storosum, de Boer and Denys2024). Nonresponse at the end of the trial was defined as symptom reduction of <35%, a common threshold in OCD trials (Nakatani et al., Reference Nakatani, Nakagawa, Nakao, Yoshizato, Nabeyama, Kudo and Kawamoto2005; Ramakrishnan et al., Reference Ramakrishnan, Farhat, Vattimo, Levine, Johnson, Artukoglu and Bloch2024).
Secondary outcomes included diagnostic accuracy of (1) <25% response after 6 weeks, (2) <35% response at 8 weeks, and (3) <25% YBOCS-change or Clinical Global Impression Scale – Improvement (CGI-I) > 3 (no minimal improvement) after 4 weeks, each predicting <35% YBOCS-change or CGI >2 (no substantive improvement) at the end of the trial (Busner & Targum, Reference Busner and Targum2007). Including CGI-I provided a more stringent measure, requiring both symptom reduction on YBOCS and observed clinical improvement (Mataix-Cols et al., Reference Mataix-Cols, Andersson, Aspvall, Boberg, Crowley, de Schipper and Cervin2022).
Trial selection and data extraction
We analyzed individual patient-level data from double-blind, randomized, placebo-controlled trials submitted to the Dutch Medicines Evaluation Board (MEB) assessing the efficacy of SSRIs for adult OCD patients diagnosed using Diagnostic and Statistical Manual of Mental Disorders-III, III-R, or IV criteria. Confidentiality agreements between the trial sponsors and the MEB prevented us from specifying the compounds that were used. Only patients randomized to active treatment (SSRIs or clomipramine as active comparator) were included. Baseline and biweekly symptom scores, patient-level data (age, sex, and symptom severity), trial duration (10 vs. 12–13 weeks), and dosing schedule (fixed vs. flexible) were extracted. Age was dichotomized at 40 years, and severity was categorized as mild (YBOCS ≤ 21), moderate (22–29), or severe (≥30), per validated cutoffs (Matti Cervin, Consortium, & Mataix-Cols, Reference Cervin, Consortium and Mataix-Cols2022). Missing data were imputed using multiple imputation by chained equations per trial.
Risk of bias analysis
We evaluated the risk of bias and applicability of the results with the quality assessment tool for diagnostic accuracy studies (QUADAS) 2 tool (Whiting et al., Reference Whiting, Rutjes, Westwood, Mallett, Deeks, Reitsma and Bossuyt2011). Two assessors (S.E.C. and J.B.Z.) independently assessed the four key domains: patient selection, index test, reference standard, and flow/timing. Discrepancies were resolved by consensus and/or a third reviewer.
Data analysis
To account for clustering within trials and between-trial differences, we used a two-stage meta-analytic approach for analyzing crude patient data (Abo-Zaid et al., Reference Abo-Zaid, Guo, Deeks, Debray, Steyerberg, Moons and Riley2013; Burke, Ensor, & Riley, Reference Burke, Ensor and Riley2017). In the first stage, we created a confusion matrix subdividing patients into true negatives, false positives, false negatives, and true positives. In the second stage, we conducted a bivariate random-effect meta-analysis of sensitivity/specificity and positive predictive value (PPV)/negative predictive value (NPV), accounting for inverse correlation (Leeflang, Deeks, Rutjes, Reitsma, & Bossuyt, Reference Leeflang, Deeks, Rutjes, Reitsma and Bossuyt2012; Reitsma et al., Reference Reitsma, Glas, Rutjes, Scholten, Bossuyt and Zwinderman2005).
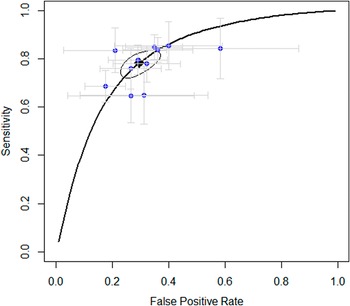
Study estimates with 95% confidence intervals (CIs) were plotted in a summary receiver operating curve (sROC), and the area under the curve (AUC) was calculated as an overall accuracy measure.
We focused on nonresponse rather than response, as identifying when to cease medication – if unlikely beneficial – is more clinically relevant than knowing when to continue, which is already standard practice shortly after treatment initiation. Early non-improvement indicated a positive index test, while early improvement indicated a negative index test. Similarly, subsequent nonresponse (at 12 weeks) implied a positive reference test, and subsequent response implied a negative reference test.
Meta-regression and sensitivity analysis
We performed exploratory meta-regressions for prespecified patient- and study-level variables, using the log odds ratio (OR, a univariate measure combining specificity and sensitivity) as outcome. In case of statistical significance, we conducted subgroup analyses for bivariate accuracy measures (sensitivity/specificity, PPV/NPV) and AUC of the sROC curve. We further conducted a meta-regression for influence of study compound on the accuracy.
We performed sensitivity analyses excluding patients who dropped out before week 10 or week 4, patients randomized to clomipramine, and outlying trials identified by visual inspection of the ROC curve.
Results
Included trials
Out of 14 double-blind, randomized, placebo-controlled trials in adult OCD that were submitted to the MEB by the sponsors, we included 11 trials. Two trials were excluded as they did not provide outcome data, and one trial had to be excluded as information on the assignment of intervention per patient was not available. After excluding the patients assigned to placebo (n = 885), we included a total of 1,753 patients (267 of whom were assigned to clomipramine and 1,486 to an SSRI). Three trials (27%) lasted 10 weeks, seven trials (64%) lasted 12 weeks, and one trial (9%) lasted 13 weeks. Of the included patients, 947 were male (54%) and 806 (46%) were female. The mean age of included patients was 38.2 years (standard deviation [SD] = 12.2) and the mean YBOCS severity at baseline was 24.5 (SD = 5.1), which is indicative of moderate OCD severity. See Table 1 for an overview of the included trials. The mean attrition after 10 weeks was 21,9%. For an overview of attrition after 10 weeks per trial, please refer to Supplementary Table 1.
Trial characteristics

Abbreviations: mg, milligram; SD, standard deviation; SSRI, selective serotonin reuptake inhibitor; YBOCS, Yale–Brown obsessive-compulsive scale.
After 4 weeks, 1,220 patients (70%) were positive for the index test of non-improvement (i.e. <25 percent YBOCS reduction compared to baseline), while 534 (30%) were negative for the index test (i.e. patients did improve more than 25% compared to baseline). A total of 1,107 patients (63%) met the criteria for the reference test (i.e. nonresponse [<35% YBOCS reduction compared to baseline] at the end of the trial [10–13 weeks]), while 647 (37%) patients responded (i.e. negative reference test). For an overview of classifications of index test and reference test per trial, please see Supplementary Table 2.
Dosing regimen
Three trials (27%) were fixed-dose studies, eight (73%) were flexible-dose studies. All trials used a dosing regimen where patients were titrated to a minimally effective dose within 1 week, after which patients were either uptitrated according to a fixed-dose regimen, or guided by adverse events or effect according to a flexible-dose regimen. Individual patient dosing information was not available for flexible-dose studies. For an overview of dose ranges in fluoxetine equivalent, see Table 1.
Quality assessment
Regarding patient selection, all studies except one were conducted on the North-American continent, causing “some concerns” in applicability according to the QUADAS tool. As the index tests and reference tests were all prespecified, blinded, and clinically relevant, namely the YBOCS, we found no concerns in Domains 2 and 3 for risk of bias and applicability. Three studies out of 11 had an attrition rate of more than 25% introducing possible bias in flow and timing of the study, as not all patients had experienced the reference test. Three studies had a 10-week duration instead of a 12-week duration as was our prespecified duration. See Figure 1 for an overview of risk of bias, and Supplementary Table 3 for risk of bias per trial.
Risk of bias and concerns regarding applicability.

Main outcome
The main outcome was with which accuracy early non-improvement (i.e. <25% improvement after 4 weeks) could predict ultimate nonresponse (i.e. <35% improvement at the end of the trial). The results showed that non-improvement after 4 weeks predicted nonresponse at the end of the trial with a PPV (correctly identifying nonresponse) of 86%, a sensitivity of 78%, a specificity of 70%, and an NPV of 60%. The AUC was 0.82. See Figure 2 for the sROC figure with specificity and sensitivity per trial, and Table 2 for an overview of primary and secondary outcomes, including 95% CIs.
Summary of the receiver operating curve.

Primary and secondary outcomes
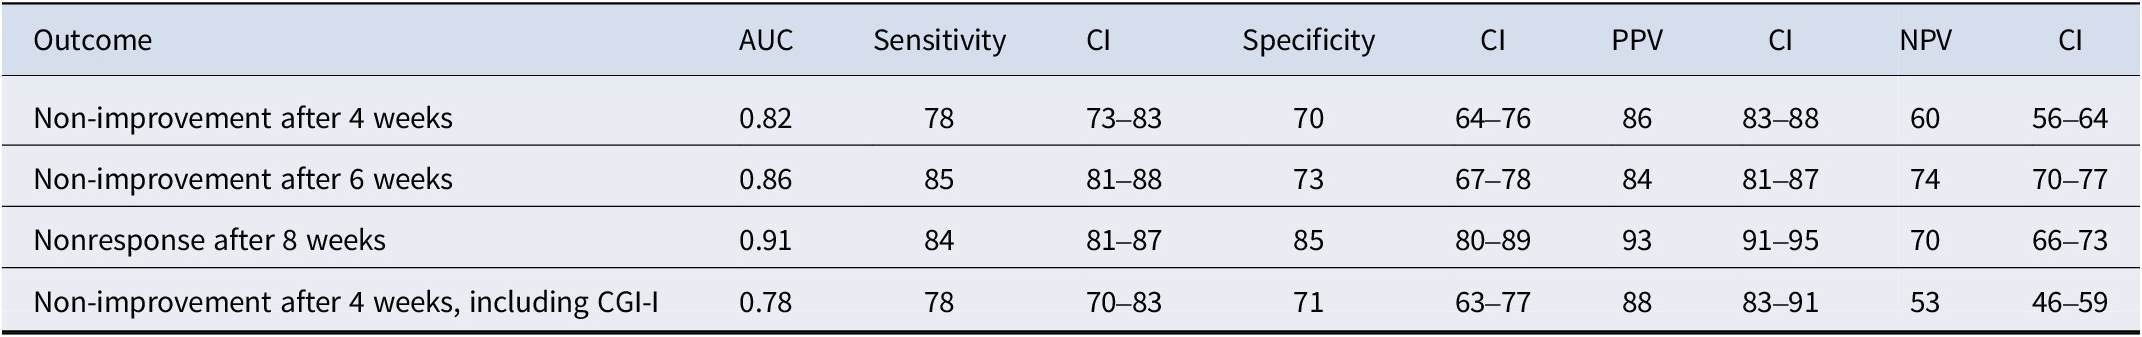
Abbreviations: AUC, area under the curve; CGI-I, Clinical Global Impression Scale – Improvement; CI, 95% confidence interval; NPV, negative predictive value; PPV, positive predictive value.
Secondary outcomes
Non-improvement (<25% improvement) after 6 weeks had the following diagnostic accuracy measures for predicting nonresponse at the end of the study: AUC of 0.86, sensitivity of 85%, specificity of 73%, PPV of 84%, and NPV of 74% (see Supplementary Figure 1 for the SROC curve). Nonresponse (<35% improvement) after 8 weeks of treatment showed the following diagnostic accuracy for predicting nonresponse at the end of the study: AUC of 0.91, sensitivity of 84%, specificity of 85%, PPV of 93%, and NPV of 70% (see Supplementary Figure 2). Early non-improvement and ultimate nonresponse according to a more stringent criterion, by combining the CGI with YBOCS, yielded an accuracy that was comparable to the primary outcome (see Supplementary Figure 3).
Meta-regression
Meta-regression on the main outcome for patient- and study-level variables showed that prediction accuracy was significantly higher in male patients compared to female patients (β-log OR = 0.64, 95% CI = 0.16–1.12, p = 0.0089; see Table 3). We then performed additional analyses for accuracy measures. For male patients, all accuracy measures were higher than for female patients (see Table 3). An exploratory meta-regression for prediction at 6 weeks did not show significant differences for gender. Age, illness severity, compounds, dosing schedule, and trial duration did not significantly impact accuracy (see Supplementary Table 4 for outcomes for all meta-regression analyses).
Subgroup analysis for sex (bracketed numbers are 95% confidence intervals)

Abbreviations: AUC, area under the curve; NPV, negative predictive value; PPV, positive predictive value.
Sensitivity analyses
Sensitivity analysis on the main outcome after excluding patients who dropped out before week 4 yielded an AUC of 0.81, with a sensitivity of 77% (71–83), a specificity of 73% (67–88), PPV of 86% (83–89), and NPV of 59% (55–62). After excluding patients who dropped out before week 10, AUC was 0.81, sensitivity was 75% (68–80), specificity was 75% (68–80), NPV was 59% (54–63), and PPV was 86% (83–89). Excluding patients who were assigned to clomipramine yielded the following accuracy: AUC of 0.79, sensitivity of 79% (74–83), specificity of 68 (62–73), PPV of 86% (82–88), and NPV of 57% (53–68).
Discussion
In this diagnostic test accuracy meta-analysis of pharmacotherapy in adults with OCD, we aimed to investigate whether early non-improvement (<25% YBOCS reduction after 4 weeks) predicts subsequent antidepressant nonresponse (<35% YBOCS reduction at trial endpoint). We found that early non-improvement predicts subsequent nonresponse with a PPV of 86% (95% CI = 83–88%), meaning that after 1 month of treatment, out of every 100 patients who do not show at least minimal symptom improvement, 86 will not respond at the end of the study. Thus, early non-improvers are likely to become eventual nonresponders to that particular drug.
A lower NPV, of 60%, illustrates that if patients do show improvement at 4 weeks, this does not guarantee response. A sensitivity of 78% indicates that, of the 100 patients who ultimately did not respond to treatment, 78 were correctly identified as non-improvers after 4 weeks. In other words, non-improvement effectively captures most of the patients who will not go on to respond. Conversely, a specificity of 70% means that out of 100 patients who did respond by the end of the trial, 70 were correctly identified as showing early improvement at 4 weeks. Thus, some responders may still be incorrectly predicted to be nonresponders.
In clinical practice, this means that a lack of symptomatic improvement after 4 weeks of antidepressant treatment could serve as an early indicator that a patient is less likely to benefit from continued treatment. In such cases, early reevaluation could be considered within a framework of shared decision-making. At the same time, overall predictive accuracy further improves at 6 weeks rather than 4 weeks, and is highest when nonresponse at 8 weeks is used as the index timepoint. These findings suggest that the timing of treatment decisions should be individualized and guided by the clinical context and patient preferences.
Accuracy was significantly higher in male compared to female patients at 4 weeks, but not at 6 weeks. This may seem surprising as a sex difference has not been found in earlier diagnostic accuracy studies in OCD, or meta-analyses in other psychiatric classifications (de Vries et al., Reference de Vries, Roest, Bos, Burgerhof, van Loo and de Jonge2019; Samara et al., Reference Samara, Leucht, Leeflang, Anghelescu, Chung, Crespo-Facorro and Leucht2015). Sex has not been identified as a modifier or predictor of treatment outcome in OCD (Cohen et al., Reference Cohen, Storosum, Zantvoord, Mattila, de Boer and Denys2025; Mathes, Morabito, & Schmidt, Reference Mathes, Morabito and Schmidt2019). Differences in pharmacokinetics between men and women, where female patients may have a relatively high exposure to an antidepressant dose, do not provide a clear explanation, as this may mean that women receive higher serum levels sooner, and so the clinical effect should be more pronounced at 4 weeks (Kokras, Dalla, & Papadopoulou-Daifoti, Reference Kokras, Dalla and Papadopoulou-Daifoti2011). These findings may suggest that the timing of treatment response differs between male and female patients. Predictive accuracy did not differ significantly between compounds, even though the pharmacokinetics of compounds do vary, especially in fluoxetine, which has a relatively long half-life (Hiemke & Härtter, Reference Hiemke and Härtter2000). Similarly, age and illness severity do not affect accuracy. It should be noted that these meta-regression findings are exploratory, since we did not use internal or external validation for linear regression.
In disorders other than OCD, secondary analyses of short-term trials and meta-analyses have found that a lack of early response can predict later treatment success (Welten et al., Reference Welten, Koeter, Wohlfarth, Storosum, van den Brink, Gispen-de Wied and Denys2016). In schizophrenia, for instance, a meta-analysis of diagnostic test accuracy studies found that nonresponse to antipsychotic medication after 2 weeks predicted unsuccessful treatment with a PPV of 90% (Samara et al., Reference Samara, Leucht, Leeflang, Anghelescu, Chung, Crespo-Facorro and Leucht2015). The diagnostic accuracy of non-improvement in OCD is thus somewhat lower than in schizophrenia, but it is comparable to the diagnostic accuracy in antimanic medication in bipolar disorder and higher than in pharmacotherapeutic treatment of MDD (de Vries et al., Reference de Vries, Roest, Bos, Burgerhof, van Loo and de Jonge2019; Samara et al., Reference Samara, Leucht, Leeflang, Anghelescu, Chung, Crespo-Facorro and Leucht2015; Welten et al., Reference Welten, Koeter, Wohlfarth, Storosum, van den Brink, Gispen-de Wied and Denys2016).
Our results contrast the commonly held assumption that response to antidepressants is delayed in OCD, and that, consequently, a minimum of 12 weeks of treatment is necessary before judging an antidepressant trial as unsuccessful (Paxos, Reference Paxos2022). Our results add to findings from an aggregate data meta-analysis, which analyzed outcomes at interim time points of OCD trials in order to examine the trajectory of medication response in OCD (Issari et al., Reference Issari, Jakubovski, Bartley, Pittenger and Bloch2016). The authors found a significant difference compared to placebo after only 2 weeks of treatment. On the group level, 75% of symptom improvement due to SSRIs compared to placebo is established within the first 6 weeks. Our study shows that this effect is not only apparent on group-level data but also that early evaluation of response can influence clinical decision-making on an individual patient level. These findings are corroborated by smaller, explorative predictive studies in OCD (Ackerman et al., Reference Ackerman, Greenland and Bystritsky1996; da Conceição Costa et al., Reference da Conceição Costa, Shavitt, Castro Cesar, Joaquim, Borcato, Valério and Diniz2013).
Clinical relevance of response prediction does not solely depend on prediction accuracy, but also on a priori chance of successful treatment, and on the presence of possible treatment alternatives. For instance, in our study sample, the a priori chance of nonresponse at the end of the trial is 63%. After a positive index test, this chance is 86%, which means a more than 60% increase in the chance of nonresponse ([37–14%]/37%). It should be added that a high a priori chance of nonresponse increases the PPV due to the dependence of predictive values on the prevalence of the reference test. As such, in a population with a lower chance of nonresponse, the PPV might decrease. In the pharmacological treatment of MDD, research has shown that the chance of response decreases with each subsequent medication step (Rush et al., Reference Rush, Fava, Wisniewski, Lavori, Trivedi, Sackeim and Niederehe2004). To our knowledge, in OCD, there is only one double-blind study exploring switching in case of nonresponse, finding a favorable effect of switching with a response rate of 50% (Denys, van Megen, van der Wee, & Westenberg, Reference Denys, van Megen, van der Wee and Westenberg2004). However, this study is relatively small and considers switching from SSRI to serotonin–norepinephrine reuptake inhibitors and vice versa in case of initial nonresponse, without a non-switching control group. In other words, we cannot definitely state that switching medications increases the chance of response, compared to continuing the current medication. The same can be stated for the addition of psychotherapy, pharmacological augmentation strategies, or further dosage escalation (Levy, Arush, Carmi, Wetzler, & Zohar, Reference Levy, Arush, Carmi, Wetzler and Zohar2024). This emphasizes the need for switch studies in OCD treatments (Wang et al., Reference Wang, Gu, Gao, Wang, Fang, Hu and Wang2022). Yet, such studies remain scarce, partly due to a lack of public funding and the dominance of industry-sponsored trials, which limits variability in design and may affect generalizability (Ioannidis et al., Reference Ioannidis, Huneke, Solly, Fusetto Veronesi, Tzagarakis, Parlatini and Chamberlain2025).
Our study has significant strengths, including the use of a unique dataset from multiple large published and unpublished clinical trials, to conduct a robust prediction meta-analysis, with a uniform analysis across trials according to a preregistered protocol. We employed a priori defined index and reference tests, thus avoiding post-hoc adjustments or data-driven modifications that can inflate predictive accuracy estimates.
However, there are several limitations. First, placebo-controlled settings may not accurately reflect real-world clinical practice because the presence of a placebo arm can alter treatment expectations, potentially causing hesitancy among patients and assessors in reporting improvements (Salanti et al., Reference Salanti, Chaimani, Furukawa, Higgins, Ogawa, Cipriani and Egger2018). This may explain our conservative response rates (37%) compared to open-label studies (Brar et al., Reference Brar, Sidana, Chauhan and Bajaj2022; Tükel, Bozkurt, Polat, Genç, & Atli, Reference TÜKEL, BOZKURT, POLAT, GENÇ and ATLI2006). Real-life settings could either heighten sensitivity to improvement, due to established patient–doctor relationships, or reduce careful symptom tracking due to clinical time constraints and broader treatment goals. Second, patients might not experience the full therapeutic dose throughout the entire 12-week study period, suggesting additional improvement beyond 12 weeks remains possible. Although early responses correlate with long-term outcomes, evidence remains mixed regarding further symptom reduction post-12 weeks. Short-term treatment response is strongly correlated with long-term outcomes, yet it remains unclear whether and to what extent patients with OCD continue to improve beyond the 12-week mark (Bloch et al., Reference Bloch, Green, Kichuk, Dombrowski, Wasylink, Billingslea and Pittenger2013; Greist et al., Reference Greist, Jefferson, Kobak, Chouinard, DuBoff and Halaris1995). Third, although all included studies reached therapeutic doses by 2 weeks, the initial dose titration implies that the effective duration at an adequate dose by week 4 may be shorter. Mitigating this, we have included a secondary outcome at 6 and 8 weeks, in order to give a more nuanced view of improvement trajectories. Fourth, our study included three finding studies with multiple fixed-dose arms. Although all patients who were included used a dose within the registered dose range according to the summary of product characteristics for each compound, differences in dose may still have impacted the results. Finally, our study focused solely on symptomatic improvement and did not encompass functional or quality-of-life scales.
Despite these limitations, this study challenges the current notion that in OCD, the success of a medication trial can only be assessed after 10–12 weeks of treatment. While initial improvement does not guarantee subsequent response, we showed that non-improvement after 4 weeks reliably predicts subsequent nonresponse. This work advances the integration of early stop criteria into shared decision-making, which could decrease the exposure and burden of treatments that are unlikely to help patients with OCD.
Supplementary material
The supplementary material for this article can be found at http://doi.org/10.1017/S0033291725101335.
Data availability statement
The data are proprietary and may not be shared outside the Medical Evaluation Board.
Funding statement
This study was not sponsored.
Competing interests
The authors declare none.


 Open access