


1 Introduction
The large amounts of fresh water released from today's retreating ice sheets contribute to the global rise in sea level and affect ocean circulations and climate patterns (Richardson and Reynolds, Reference Richardson and Reynolds2000; Teller and others, Reference Teller, Leverington and Mann2002; Lewis and others, Reference Lewis, Marchant, Kowalewski, Baldwin and Webb2006). Locally, meltwater can be stored in dammed proglacial lakes that can be suddenly released forming catastrophic floods with effects to be felt several hundreds of kilometers downstream (Carrivick and Tweed, Reference Carrivick and Tweed2013; Harrison and others, Reference Harrison2018; O'Connor and others, Reference O'Connor2020). These outbursts are so violent that they can reshape landscapes (Alho and others, Reference Alho, Russell, Carrivick and Käyhkö2005) by carving several tens of meters into the bedrock (Lewis and others, Reference Lewis, Marchant, Kowalewski, Baldwin and Webb2006; Gupta and others, Reference Gupta, Collier, Palmer-Felgate and Potter2007; Meinsen and others, Reference Meinsen2011; Høgaas and Longva, Reference Høgaas and Longva2016), and redepositing large amounts of eroded sediments in low-lying areas (Sjogren and Rains, Reference Sjogren and Rains1995; Murton and others, Reference Murton, Bateman, Dallimore, Teller and Yang2010). Such catastrophic events occurred throughout the Pleistocene deglaciations when huge fluxes of water from the wasting of continental ice sheets created floods of immense magnitude and relatively short duration (Collier and others, Reference Collier2015; O'Connor and others, Reference O'Connor2020). Prehistoric floods related to glacial lake outbursts discharged 100–500 times more water than the largest modern river (Baker, Reference Baker and Martini2002). For example, the outburst of the glacial Lake Agassiz 10 ka ago discharged 1014 m3 of water over a 6-month period (Clarke and others, Reference Clarke, Leverington, Teller and Dyke2004) and the amount of fresh water released into the North Atlantic may have changed ocean circulations leading to a rise in global temperatures (Clark and others, Reference Clark2001; Teller and others, Reference Teller, Leverington and Mann2002; Kleiven and others, Reference Kleiven2008). Today, the number of these lakes and risks of subsequent outbursts are predicted to increase due to the current global warming trend (Carrivick and Tweed, Reference Carrivick and Tweed2016; Harrison and others, Reference Harrison2018; Shugar and others, Reference Shugar2020). Therefore, the characterization of past outburst events is important to mitigate the risk of these future catastrophic floods, but evidence of their impacts in the geological record is often subtle (Baker, Reference Baker and Martini2002). Here, we use high-resolution 3-D seismic data to test the hypothesis that high-energy hydrological events can leave distinctive signatures in the sedimentary records of braided river systems. We examine if quantitative analyses of paleo-landscapes shaped by outburst flood events can inform geohazard assessments in areas at risk of outburst today.
The aims of this contribution are to determine the ranges in water volumes, slope gradient and discharge velocity necessary to form the Bjørnelva River Valley drainage system, an Early Pleistocene valley preserved on top of a major glacial unconformity in the SW Barents Sea and imaged in high-resolution 3-D seismic data. Our strategy is to characterize the shape and map the distribution of features within Bjørnelva River Valley by applying the concepts of seismic geomorphology. Subsequent classification by analysis of the geometries of these landforms can be interpreted in terms of hydrodynamic regime, typically characterized by a set of characteristic geomorphic elements. As such, we will be able to differentiate between glacial drainage systems and depositional environments, and determine if Bjørnelva River Valley is a tunnel valley or a braided river channel belt (Boyd and others, Reference Boyd, Scott and Douma1988; Piotrowski, Reference Piotrowski1994; Ó Cofaigh, Reference Ó Cofaigh1996; Huuse and Lykke-Andersen, Reference Huuse and Lykke-Andersen2000; Kelly, Reference Kelly, Sambrook Smith, Best, Bristow and Petts2006; Hammer and others, Reference Hammer2016; Castelltort, Reference Castelltort2018). In addition, we characterize the architecture and infill of Bjørnelva River Valley based on attribute analysis of high-resolution 3-D seismic data, which can also be used to distinguish between a subglacial, submarine or subaerial origin.
The recognition of Bjørnelva River Valley is important for understanding the large-scale drainage evolution controlling the transport and deposition of sediments during deglaciation in the Barents Sea. The timing of the valley formation could have had significant paleo-climate implications, in case its outbursts were associated with the delivery of a large pulse of fresh water. The morphological setting of Bjørnelva River Valley could act as a potential analogue for landscapes developing in regions of the melting Greenland and Antarctic ice sheets. Finally, the results from this study can further be used to define safe zones in modern mountainous areas to reduce the number of casualties and damage to infrastructures from such inevitable outbursts (Roberts, Reference Roberts2005; Huss and others, Reference Huss, Bauder, Werder, Funk and Hock2007; Baker, Reference Baker2008; Bajracharya and Mool, Reference Bajracharya and Mool2009; Dussaillant and others, Reference Dussaillant2010; Carrivick and Tweed, Reference Carrivick and Tweed2016; Harrison and others, Reference Harrison2018; Shugar and others, Reference Shugar2020).
2 Study area
The SW Barents Sea is an epicontinental shelf with water depths of 250–500 m (Fig. 1a) and dominated by northeast-southwest to north-south trending faults (Collanega and others, Reference Collanega, Massironi, Breda and Kjølhamar2017). Butt and others (Reference Butt, Drange, Elverhøi, Otterå and Solheim2002) inferred by numerical modelling that the Barents Sea was a subaerial platform in the earliest Late Pliocene and became a submarine platform in the middle Pleistocene, ~1 Ma ago. The Barents Sea Ice Sheet developed to a moderate size from 2.4 to 1.0 Ma, when the Barents Sea was subaerially exposed and became characterized by large-scale glaciations in a submerged environment after 1 Ma (Sejrup and others, Reference Sejrup2005; Knies and others, Reference Knies2009). The pre-glacial topography of the region has been intensively eroded during the Pleistocene (Laberg and others, Reference Laberg, Andreassen and Vorren2010), when ice streams were flowing in a northeast-southwest to east-west direction (Fig. 1a) (Patton and others, Reference Patton, Hubbard, Andreassen, Winsborrow and Stroeven2016; Piasecka and others, Reference Piasecka, Winsborrow, Andreassen and Stokes2016). Modelling shows that, depending on location, between 10 and 1000 m of pre-Quaternary sequences were eroded in the Barents Sea, with a subsequent glacio-isostatic uplift of 800 m during the last million years (Fjeldskaar and Amantov, Reference Fjeldskaar and Amantov2018). Glacio-erosive processes at the base of the former Barents Sea ice streams transported sediments from the continental shelf to the Bjørnøyrenna Trough Mouth Fan, which comprises a volume of ~670 000 km3 (Fig. 1a) (Vorren and others, Reference Vorren, Richardsen, Knutsen and Henriksen1991; Laberg and Vorren, Reference Laberg and Vorren1996). The Arctic has warmed dramatically in recent decades, with highest temperature increases observed in the northern Barents Sea (Carmarck and others, Reference Carmarck2015). Sea ice covers the Barents Sea seasonally, but most areas are sea-ice-free during the summers (Lind and others, Reference Lind, Ingvaldsen and Furevik2018).
Geological setting of the SW Barents Sea. (a) Main ice-streaming phases of the Western Barents Sea. Cretaceous highs (light green) and Hoop Fault Complex (blue polygon) are shown. The maximum extension of the Barents Sea Ice Sheet during the Last Glacial Maximum (LGM) is marked as white line (Svendsen and others, Reference Svendsen2004). Arrows indicate previously inferred major ice stream directions (Andreassen and Winsborrow, Reference Andreassen and Winsborrow2009; Bjarnadóttir and others, Reference Bjarnadóttir, Rüther, Winsborrow and Andreassen2013; Rüther and others, Reference Rüther, Andreassen and Spagnolo2013). Ice margin positions (Winsborrow and others, Reference Winsborrow, Andreassen, Corner and Laberg2010; Bjarnadóttir and others, Reference Bjarnadóttir, Rüther, Winsborrow and Andreassen2013; Rüther and others, Reference Rüther, Andreassen and Spagnolo2013) and ice divides (Ottesen and others, Reference Ottesen, Rise, Knies, Olsen and Henriksen2005) are indicated (red dashed lines). TMF: Trough mouth fan. (b) Tectonostratigraphic setting of the Hoop area. Geological elements are displayed above gray-shaded seafloor. Extent is shown in (a).

Our study area is located in the Hoop area where the Hoop Fault Complex is the most prominent structural element. The Hoop Fault Complex is surrounded by the Bjarmeland Platform to the west and north, the Mercurius High to the east and the Maud Basin to the south (Fig. 1b). The pre-Quaternary geology in the Hoop area is dominated by Cretaceous shales, which are an easily erodible material (Henriksen and others, Reference Henriksen2011; Ktenas and others, Reference Ktenas, Meisingset, Henriksen and Nielsen2019) (Fig. 1b). The Loppa High and the Fedynsky High are the most prominent Cretaceous highs in the SW Barents Sea (Fig. 1a).
The water depth of the study area varies from 430 to 470 m. Repeated glacial erosion formed the Upper Regional Unconformity (URU), which is buried under 20–65 m of glacial sediments in the study area and well-imaged in seismic data (Bellwald and others, Reference Bellwald, Planke, Piasecka, Matar and Andreassen2018a) (Fig. 2a). The formation of glacial landforms at the URU level was controlled by Pleistocene ice streams (Piasecka and others, Reference Piasecka, Winsborrow, Andreassen and Stokes2016) that scarped the bedrock to form mega-scale glacial lineations and hill-hole pairs (Fig. 2b). The URU is directly draped by a negative-amplitude reflection in some parts of the study area (Bellwald and Planke, Reference Bellwald and Planke2018), but where the URU deeply cuts into Lower Cretaceous sediments several meters of sediments are present between the URU and this reflection (Fig. 2a). The URU is an amalgamated erosional surface and the landforms identified at the URU provide Pleistocene analogues to present-day processes and climate changes (Tasianas and others, Reference Tasianas2018; Bellwald and others, Reference Bellwald, Planke, Lebedeva-Ivanova, Piasecka and Andreassen2019). These landforms include mega-scale glacial lineations indicative of grounded ice, hill-hole pairs and depressions indicative of gas-hydrate melting and pockmarks indicative of fluid escape.
Study area. (a) High-resolution seismic profile showing the stratigraphy of the shallow subsurface of the Hoop area. Deeper faults are indicated by black arrows. Profile location is shown in (b). (b) URU structure map of the study area (Hoop area) generated by interpretations of conventional 3-D seismic data (Survey A and B, figure shows the extent of the cubes only partly). Extent of channel system (black stippled line) and P-Cable 3-D seismic coverage (black box, HR14, seismic data used in this study) are indicated. MSGL: Mega-scale glacial lineation.

Shackleton and others (Reference Shackleton2018) modelled the development of subglacial lakes and subglacial drainage networks beneath the Fennoscandian and Barents Sea ice sheets over the last glaciation, with up to 3500 potential subglacial lakes. Meltwater-related landforms have previously been mapped along the present seabed of the Barents Sea using bathymetric data (Bjarnadóttir and others, Reference Bjarnadóttir, Winsborrow and Andreassen2017; Newton and Huuse, Reference Newton and Huuse2017). Here we show that fluvial landforms can be imaged along the URU horizon beneath 65 m of glacial sediments using high-resolution 3-D seismic data (Fig. 2). We suggest that this channel belt and associated incised valley was generated by a fluvial system, named here as the Bjørnelva River Valley, Norwegian for Bear River Valley.
The SW Barents Sea is a suitable place to test if high-energy hydrological events can leave distinctive signatures in the sedimentary record of braided river systems, because of (i) a flat paleo-surface with preserved landforms, (ii) its well-established Pleistocene glacial history, (iii) its subaerial exposure until 1 Ma and (iv) high-quality 3-D seismic data available over extended areas.
3 Data and methods
This study comprises two conventional and one high-resolution 3-D seismic datasets from the Hoop area in the SW Barents Sea (Figs 1–3). The conventional 3-D seismic surveys A and B cumulatively cover an area of ~13 000 km2, but only 600 km2 are used for this study. These surveys have a vertical resolution of ~12 m and bin sizes of 25 m × 12.5 m (Survey A) and 18.75 m × 12.5 m (Survey B) (Figs 2, 2b, 3a). The high-resolution P-Cable 3-D seismic survey HR14 covers ~30 km2 (Fig. 2b) with a bin size of 6.25 m × 4.75 m. The maximum frequency of the seismic signal of ~300 Hz at URU depths allows a vertical resolution of 1–2 m for HR14 (Lebedeva-Ivanova and others, Reference Lebedeva-Ivanova2018). Therefore, the P-Cable 3-D seismic data provide crisper imaging of the URU surface (Fig. 3b) than the conventional 3-D seismic data (Fig. 3a) and permit the study of the geomorphology, deposits and origin of the channel system.
Bjørnelva River Valley and channel belt. (a) URU surface generated by conventional 3-D seismic data with bin sizes of 18.75 m × 12.5 m and (b) by high-resolution P-Cable 3-D seismic data (HR14) with bin sizes of 6.25 m × 4.75 m. Panels a and b represent the extent of the P-Cable data (see Fig. 2b). (c) P-Cable 3-D seismic profile showing the seismic stratigraphy. Average dip of 3° for the northwestwards-dipping accretional channel beds (yellow stippled lines). See panel b for profile location.

Three-dimensional seismic data have given birth to the discipline of seismic geomorphology, which is described by Posamentier and others (Reference Posamentier, Davies, Cartwright and Wood2007) as ‘the application of analytical techniques pertaining to the study of landforms and to the analysis of ancient, buried geomorphological surfaces as imaged by 3D seismic data.’ Glacio-fluvial seismic geomorphology is defined here as the study of glaciofluvial systems (deposits and processes) using 3-D seismic images in map view. Applying the concept of seismic geomorphology allows to examine paleo-landscapes and to characterize geological features (Posamentier, Reference Posamentier2001; Darmadi and others, Reference Darmadi, Willis and Dorobek2007; Planke and others, Reference Planke2017; Bellwald and others, Reference Bellwald, Planke, Lebedeva-Ivanova, Piasecka and Andreassen2019). Even if geological landscapes imaged by 3-D seismic data seem to occasionally express fossilized processes, the interpreted surface of this study (URU) is an amalgamated surface and can include expressions shaped by successive processes during different time intervals.
Here we can interpret with high confidence the fluvial landforms and channel infill of Bjørnelva River Valley using meter-scale vertical and horizontal resolutions in the seismic data (Fig. 3). This geomorphological interpretation is completed by a comparison of interpreted landforms and Earth surface analogues (satellite imagery) to demonstrate the fluvial nature of the interpreted seismic landforms.
In the conventional 3-D seismic surveys, the URU interpretation relied on manually correcting the auto-tracked horizon of the most prominent reflection <100 m below the seabed. As the URU horizon is defined by a continuous reflection with high amplitudes in the conventional seismic data, auto-tracking was successful for most of the dataset. The resulting URU grid defines the extent of the channel system with a horizontal resolution of 12.5 m at best (Fig. 3a). Details in the fluvial landforms and the channel infill can only be imaged using high-resolution 3-D seismic data and mapping of these details is critical for a geomorphological analysis. Increased vertical and horizontal resolutions in the HR14 data allowed a meter-scale interpretation of the channel infill (Fig. 3c). Two surfaces have been interpreted in the HR14 data: (i) the URU defined as a continuous high-amplitude positive reflection and (ii) the Top channel defined as a discontinuous medium-amplitude negative reflection (Fig. 3c). Every eighth inline of the HR14 data (corresponding to a spacing of 50 m) has been interpreted by manual picking in the Kingdom Software and both horizons were subsequently interpolated into grids. The grids were snapped to a horizon and the maximum seismic amplitude of a vertical window of 4 ms along the snapped horizon has been used to interpret the seismic geomorphology of the channel system. The grids generated from interpreting HR14 data have a horizontal resolution of 5–6 m. The Apollo well, located ~40 km northwest of the study site, was used to constrain P-wave velocities that vary between 1800 and 2000 m s−1 in the glacial sediments (www.npd.no, 2018). Seismic velocities of 1500 m s−1 for the water column and 1900 m s−1 for glacial sediments were used for converting two-way travel time to depth in our study.
The base of the valley is interpreted using structure maps and the peak seismic amplitude of the URU pick. The thickness of the valley infill is defined by subtracting the Top channel reflection from the URU reflection (Fig. 3c). The sum of the seismic amplitudes of the valley infill has been used to conclude the type of infill deposits. The number of Z-crossings, the locations where the seismic signal of a seismic trace changes polarity, was used to image sequence variations in the valley infill succession.
We mapped and measured the geometries of 28 channel bars identified in HR14. The bar length is defined as the longest axis of a bar and the bar width is measured as the widest part of the bar perpendicularly to the bar length. The bar length and bar width of these channel bars are then compared to a global river bar database (Church and Rood, Reference Church and Rood1983) and to a dataset of bars in braided rivers identified on GoogleEarth (Castelltort, Reference Castelltort2018). This comparison provides estimates on the paleo-slope gradients and the grain sizes of the valley infill. There is no existing statistical dataset that allows us to compare the channel bars against landscapes that were eroded by catastrophic Quaternary floods.
The average flow velocity (v m) of a river is based on the hydraulic radius (R, in m) and valley slope (I, in m m−1), and is calculated using empirical equations (e.g. Duller and others, Reference Duller2012). The hydraulic radius is in wide and flat cross-sections approximately the valley depth (H), so we assume R ~ H. The average flow velocity vm can approximately be calculated using the Gauckler-Manning-Strickler equation:

where n is Mannings roughness coefficient (~0.03). The river discharge is calculated using the average flow velocity multiplied by the cross-sectional area of the portion of the valley occupied by the flow. However, we note that this paleo-hydraulic analysis is a rather simplistic estimation. Despite any evidence, we assumed the valley depth and water depth to be equal, and hence our paleo-hydraulic analysis is a simple and conservative estimation for a single flow regime.
4 Results
4.1 Seismic geomorphology
Multiple sets of mega-scale glacial lineations and hill-hole pairs, indicating different ice flow directions, are identified at the URU in conventional 3-D seismic data in the Bjørnøyrenna area (Fig. 2b). These landforms have been analyzed in previous publications (Piasecka and others, Reference Piasecka, Winsborrow, Andreassen and Stokes2016; Bellwald and others, Reference Bellwald, Planke, Lebedeva-Ivanova, Piasecka and Andreassen2019). The most striking structure imaged on the URU in the study area is a ~25 km long, southeast-northwest oriented channel belt system within an incised valley (Fig. 3a). The system displays a characteristic braided geometry and increases in width from ~1 km in the southeast to >3 km in the northwest. The incised valley which contains this channel belt has margin slopes ranging from 20° to 60°. The overall gradient of the channel system is 2.5 m km−1 (0.14°) and the longitudinal profiles along individual channels can have locally reverse gradients (Fig. 3c). The data show that the channel belt widens and contains several less deeply incised channels in the northwest of the study area (Fig. 2b).
The channel belt has a width of 800–2000 m in the HR14 area (average width of 1500 m) (Figs 3b, 4a) and consists of five 50–300 m wide channels eroding up to 13–23 m of underlying Cretaceous sedimentary bedrock (average channel depth of 18 m) (Fig. 4b). The depth-to-width ratios observed here vary from ~1:100 for the entire channel belt system to 1:20 for individual channels. The geometries of the individual channels are well defined in the seismic profiles and can vary from flat-bottomed and box-shaped to U- and V-shaped troughs (Fig. 4b). The reflections defining the base of the channels are characterized by the highest positive-amplitude reflections (Fig. 5b).
Seismic architecture of channel system and infill (HR14). (a) Structure map across Bjørnelva River Valley. (b) Seismic profile showing the depositional architecture of the channel belt eroding the URU (red line) and the Top channel reflection draping the channel system (blue line). Acoustically chaotic negative-amplitude reflections at the base of the channel belt infill and acoustically continuous reflections at the top of the channel belt infill (yellow lines) are shown. For map location, see Figure 3b.

Seismic geomorphology of the channel belt and bars (HR14). (a) Structure map. (b) Seismic peak amplitude of the URU reflection in a vertical window of 4 ms. Channels are characterized by high amplitudes, whereas bars have low amplitudes. (c) Isopach map of the sediment package in meters between the URU and the Top channel reflection. Location is shown in Figure 2b.

The channels are divided by 28, southeast-northwest-elongated bars, which are 130–1570 m long, 50–440 m wide and 2–17 m high (Figs 4a, 6a, 7). Most of the bars have a lemniscate or teardrop outline, with elongated tips pointing northwestwards. The reflections defining the top of the bars have lower amplitudes when compared to the channels (Fig. 5b) and their seismic facies is characterized by horizontal layering (Fig. 6b). Field examples show that streamlined fluvial landforms can either be built through fluvial deposition or the result of removal of the material around (Collier and others, Reference Collier2015, and references therein). We suggest the streamlined bars identified in the incised valley to represent fluvial depositional features rather than erosional bedrock remnants, as (i) they are characterized by lower seismic amplitudes at their top compared to the deepest channels and (ii) they have different seismic facies compared to the underlying Cretaceous bedrock (horizontal layering and moderate seismic reflectivity vs low seismic reflectivity). Although depositional islands are documented to be inherently unstable as the channels surrounding them tend to laterally migrate (e.g. Détriché and others, Reference Détriché2010), the sedimentary bars of this study are most likely preserved in the channel belt and represent the last stage of fluvial activity at this level.
Seismic architecture of channel belt and bars (HR14). (a) Structure map of channel bars (stippled lines). Main channel is indicated by thick white arrows and other channels are displayed by thin white arrows. Golden arrows show lateral sediment aggradation. (b) Seismic stratigraphy of a channel bar. Parallel layering characterizing the internal structure of the channel bar is indicated by yellow stippled lines. (c) Lateral aggradation of channel infill. Yellow stippled lines indicate westwards aggradation of channel infill from the deepest channel. Red stippled lines in b and c mark the URU. For map location, see Figure 3b.


4.2 Analysis of channel geomorphology
The 28 southeast-northwest-elongated bars (Fig. 7) mapped in the HR14 data have been compared to global databases on modern braided rivers (Fig. 8) (Church and Rood, Reference Church and Rood1983; van den Berg, Reference van den Berg1995; Castelltort, Reference Castelltort2018). The average dimensions of the channel bars are 350 m in length, 150 m in width and 7 m in height (8 ms) (Figs 7, 8a; Table 1). Therefore, the bars of the channel system plot within the dimensions of modern braided river bars.
Comparison of the Bjørnelva River Valley system with modern braided rivers. (a) Width vs length of Bjørnelva River Valley bars from Figure 7 (N = 28) superimposed on bar dimensions of 22 modern braided rivers (N = 2120 bars, Castelltort, Reference Castelltort2018). (b) Bar elongation vs valley slope for definition of paleo-slope gradient. A mean bar elongation of 2.54 implies a paleo-slope gradient of 0.64 m km−1 for Bjørnelva River Valley. (c) Mean Bjørnelva River Valley slope gradient compared to modern rivers of Church and Rood (Reference Church and Rood1983) and van den Berg (Reference van den Berg1995) is compatible with grain size of 0.1–1 mm or 10–100 mm. Kernel density (inset) of slope gradient for grain size of <1 mm (red) and more than 10 mm (blue) suggests that the valley infill of river slopes of between 0.1 and 1 m km−1 consists mostly of grain sizes of <1 mm (red). (d) Correlation between valley width and valley depth. Valley width is defined as the incised valley measured from the edge of the slopes that contain the channel belt within. (e) Correlation between valley width and valley slope. (f) Correlation between valley depth and valley slope. Dataset for a-b from Castelltort (Reference Castelltort2018) and c-f from Church and Rood (Reference Church and Rood1983).

Geometries of the 28 river bars. Bar ID indicates feature identified in Figure 7

The mean bar elongation can be used to determine the slope gradient based on modern braided river datasets (Castelltort, Reference Castelltort2018). Here, a mean bar elongation of 2.54 ± 0.04 for the 28 river bars implies a paleo-river gradient of 0.64 ± 0.1 m km−1 (Fig. 8b). The sediments deposited by modern braided rivers flowing along slopes dipping by 0.64 m km−1 are in a median grain size of two clusters: a first cluster from ~0.1 to 1 mm (i.e. sand) and a second cluster from 10 to 100 mm (i.e. gravel and pebbles, Fig. 8c).
Compared to the modern river database of Church and Rood (Reference Church and Rood1983), the river characteristics of this study should be consistent with a gently dipping, wide and deep channel belt (Figs 8d–f). Although the bars of this study are consistent with modern braided rivers, the plots of Church and Rood (Reference Church and Rood1983) indicate that the identified incised valley is an outlier with respect to valley depth and valley width (Figs 8d–f).
We calculated a first order estimation of the average flow velocity to be 6 m s−1, corresponding to an average discharge of 160 000 m3 s−1. The average flow velocity, calculated using the Gauckler-Manning-Strickler equation Eqn (1) and the average discharge were determined by using an inclination of 0.64 m km−1, an average water depth (valley depth) of 18 m and an average valley width of 1500 m.
4.3 Valley infill
The channels along the carved bedrock shaping the channel belt system of the incised valley are overlain by the valley infill corresponding to the succession between the Top channel and the URU reflections. The valley infill is characterized by up to 23 m of horizontal, low-angle dipping and chaotic reflections which downlap and onlap the URU reflection (Figs 3c, 6c, 9c). The infill towards the valley base is more chaotic and consists of discontinuous and scattered seismic reflections (Fig. 4b). The infill of the upper part of the channel deposits displays more continuous seismic reflections, thus indicating sediment layering (Fig. 9c).
Seismic characterization of the valley-infill succession between the Top channel reflection and the URU (HR14). (a) Structure map with valley extent and bars is indicated by black stippled lines. (b) Sum of seismic amplitudes of valley infill, showing the deposits to be dominated by negative-amplitude reflections. White polygons outline bars. (c) Seismic profile of the valley-infill succession between the Top channel (blue line) and the URU reflection (red line). The valley infill includes buried bars, horizontally deposited and inclined layers (yellow lines), as well as more chaotic sequences. Location is shown in Figure 2b.

The infill is thickest where the channels are deepest (Fig. 5c) and dominated by negative-amplitude reflections (Fig. 9b). The Z-crossing parameter on Figure 10a is the number of times a seismic trace changes polarity and can be used to determine the number of thin homogeneous sedimentary sequences within the infill succession. The signal changes polarity more than six times within the infill in the deepest channels and not more than twice above the channel bars (Fig. 10). The Top channel reflection can be traced over larger areas above the URU (Fig. 4b). The valley-infill reflections dip in a northwestwards direction with an average angle of ~3° (Fig. 3c), but reflections can also dip perpendicular to individual channels (Fig. 6c) due to lateral aggradation.
Reflection characteristics of the valley-infill succession (HR14). (a) Layering characterizing valley infill defined by number of Z-crossings within the valley. (b) Seismic profile showing the layering of valley infill. Three seismic traces show the number of crossings that have been detected in the valley infill of a selected channel. Positive polarity of the signal colored in red, negative polarity colored in blue. Location of seismic profile in (b) is shown as red stippled line in (a).

5 Discussion
The discussion focuses on the formation, the glacial and hydrological configuration, paleo-geographic reconstructions and the sedimentary imprint of the incised valley. We discuss the broader implications of the valley on drainage evolution and climate development. Finally, we compare the outburst event with Pleistocene and historic glacial lake outburst floods and show regions with potential analogies in future.
5.1 Nature and implications of the URU reflection
The reflections with the highest seismic amplitudes in the deepest channels (Fig. 5b) indicate a strong impedance contrast, probably representing a lithological contrast at URU between hard bedrock below and soft valley infill above as well as changes in fluid content and geotechnical properties. This hard- to soft-bed abrupt transition indicates that the system carved an up to 23 m-deep and several km-wide valley into Lower Cretaceous bedrock in a subglacial, submarine or subaerial environment. Following the orientation of the deepest channels and teardrop shape of the largest streamlined channel bars, the discharge occurred in a southeast- or northwest-ward direction (Fig. 2b). A widening of the channel belt system and shallowing of individual channels in the northwest of the study area (Fig. 2b) indicate less erosion due to progressively diminishing flow rates and energy in the deepest Bjørnøyrenna (Bear Island Trough). These shallower channels could also represent relicts of originally deeper channels, which underwent increased glacial erosion related to repeated ice-streaming in the deeper Bjørnøyrenna after the formation of the valley (Patton and others, Reference Patton, Hubbard, Andreassen, Winsborrow and Stroeven2016). All this evidence combined with the northwestwards-dipping of sediment infill (Fig. 3c) favor a northwestwards flow direction of the system towards the deeper Bjørnøyrenna (Fig. 1a). The sediment load related to the channel belt formation has probably been transported during subsequent glaciations into the Bjørnøyrenna Trough Mouth Fan (Fig. 1a), where most of the glacio-erosive products of the Barents Sea are redeposited (Laberg and Vorren, Reference Laberg and Vorren1996). At a local scale, bedrock geology can influence the orientation of channel belts (Booth and Hallet, Reference Booth and Hallet1993). The distribution of glacial landforms along the URU has previously been linked to different types of faults (Bellwald and others, Reference Bellwald2018b), but here the faults do not appear to influence the course of the channel belt system.
5.2 Bjørnelva River Valley: a channel belt formed by a braided river
We interpret the incised valley as a proglacial braided river system consisting of a series of broad and shallow channels, bars and dry islands (Miall, Reference Miall1977), named here as Bjørnelva River Valley. Braided streams occur in rivers with high slope gradients and/or large sediment load (Schumm and Kahn, Reference Schumm and Kahn1972) where the main channel can generally be distinguished within the overall braided pattern, although several principal channels may be present in some river sections (Rust, Reference Rust1972; Bennett and others, Reference Bennett, Huddart and Thomas2002). Individual channels are separated by small and often temporary islands called braided bars. Statistical analysis of modern braided bars identified on satellite images show that the bar dimensions are proportional to the river widths (e.g. Kelly, Reference Kelly, Sambrook Smith, Best, Bristow and Petts2006) and have average elongations (length/width ratio) of around five (e.g. Kelly, Reference Kelly, Sambrook Smith, Best, Bristow and Petts2006; Castelltort, Reference Castelltort2018). The formation of braided rivers is often linked to highly variable discharge such as flash floods, during which braided bars can develop under high-stage flow conditions and often are reworked and dissected into multiple bars that emerge as flow recedes (Russell and others, Reference Russell, van Tatenhove and van de Wal1995; Stott, Reference Stott2002; Church, Reference Church2006).
A subaerial, proglacial origin for Bjørnelva River Valley is supported by the geomorphology, modern river analogues and numerical modelling of the Barents Sea (Figs 8, 11, 12). The geomorphological analysis of the dimensions of the Bjørnelva River Valley bars shows that they compare with bars of modern braided rivers (Fig. 8). In addition, comparisons of the Bjørnelva River Valley system with satellite images of braided rivers in glaciated terrains display similar landform assemblages in both shape and dimension (Fig. 11). The Whataroa River (South New Zealand) is shown as an example in Figure 11, but the channel belt geometries of the Bjørnelva River Valley fit expressions characteristic for braided rivers all over the world (Fig. 12c) (Castelltort, Reference Castelltort2018). Uplift studies of the Western Barents Sea further show that the study area was subaerial in post-Eocene/pre-Quaternary times and evolved into a marine platform ~1 Ma ago (Fig. 12a) (Dimakis and others, Reference Dimakis, Braathen, Faleide, Elverhøi and Gudlaugsson1998; Butt and others, Reference Butt, Drange, Elverhøi, Otterå and Solheim2002). Thus, the Bjørnelva River Valley is likely to be a relict of a proglacial braided river system from Pleistocene times (Fig. 12b). The magnitude of incision (depth of 13–23 m) fits with observations of modern braided rivers in proglacial environments (Fig. 8d), but not in a subglacial domain where valleys are usually several hundred meters deep.
Comparison of modern braided river with Bjørnelva River Valley. (a) Meter-scale glaciofluvial morphologies of Bjørnelva River Valley are identified in HR14. (b) Braided river system of Whataroa River, South New Zealand. Image from GoogleEarth, produced by Landsat/Copernicus on 6 April 2011. The figures are identical in horizontal scale. Arrows indicate flow direction.

Braided rivers in proglacial environments. (a) Paleo-geographic reconstruction of the western Barents Sea for the mid-Pliocene, showing that the western Barents Sea was subaerially exposed (modified after Dimakis and others (Reference Dimakis, Braathen, Faleide, Elverhøi and Gudlaugsson1998)). Positive numbers indicate meters above sea level and negative numbers indicate meters below sea level. Study area is shown as white box. (b) Conceptual sketch for the formation of Bjørnelva River in the Early Pleistocene, showing the retreat from a moderate-size Barents Sea Ice Sheet. Figure credit: Peter Sanderson. (c) Analogue of an evolving braided river related to glacier melting in the Swiss Alps (Wildstrubelgletscher, Valais). The channel bars are more coarse-grained here. Photo by Bruno Bellwald.

The imaged channel belt cannot be a tunnel valley system formed at the base of an ice stream, nor be a submarine channel system. Tunnel valleys are typically elongated, subglacial channels over several kilometers long, forming canyon morphologies and anastomosing networks that are several hundred meters deep and more than 2 km wide (Ó Cofaigh, Reference Ó Cofaigh1996; Huuse and Lykke-Andersen, Reference Huuse and Lykke-Andersen2000; Stackebrandt, Reference Stackebrandt2009; Stewart and others, Reference Stewart, Lonergan and Hampson2013; Hammer and others, Reference Hammer2016; Reinardy and others, Reference Reinardy, Hjelstuen, Sejrup, Augedal and Jørstad2017). Subglacial meltwater channels in Antarctica are further documented to both deepen and becoming increasingly focused in the downstream segment (Anderson and Fretwell, Reference Anderson and Fretwell2008; Simkins and others, Reference Simkins2017). Subglacial landforms generated by meltwater flows have expressions different from those identified in the Bjørnelva River Valley (Munro-Stasiuk and others, Reference Munro-Stasiuk2009). Whereas submarine channels can erode several tens of meters along the slope (e.g. Smith and others, Reference Smith, Kvitek, Iampietro and Wong2007, Monterey Canyon), submarine braided channels do not have the power to erode up to 23 m into the bedrock of the shelf. Bjørnelva River Valley is thus a fluvial system with distinctive sedimentary elements preserved on a meter-scale resolution.
The age of the Bjørnelva River Valley is constrained in this study using paleo-geographic reconstructions, ice-sheet reconstructions and climate dynamics. In addition, sediments from wells intersecting the Bjørnøyrenna trough mouth fan include sands of Early Quaternary age (www.npd.no, 2018), indicating that the Barents Sea Ice Sheet may have transited the shelf forming a shelf-crossing trough in that time. Knies and others (Reference Knies2009) suggest that the Barents Sea Ice Sheet developed into a moderate size in the time period between 2.4 and 1.0 Ma. The Hoop area could then have been influenced by a proglacial braided river during one or more of glacial retreats in the Early Quaternary. Subaerially exposed until ~1 Ma (Dimakis and others, Reference Dimakis, Braathen, Faleide, Elverhøi and Gudlaugsson1998; Butt and others, Reference Butt, Drange, Elverhøi, Otterå and Solheim2002), we suggest the Bjørnelva River Valley to have formed with a retreating Barents Sea Ice Sheet during a glacial-interglacial cycle between 2.4 and 1.0 Ma.
5.3 A large glacial lake outburst flood
After having shown the fluvial origin of Bjørnelva River Valley, we here discuss the glacial and hydrological configuration prevailing for its formation. An active Barents Sea Ice Sheet at the time of the Bjørnelva River Valley formation, with a margin in the central or Southern Barents Sea, is required to feed the braided channel system with meltwater (Figs 12b, 13a). At that time, the ice sheet was retreating and leaving a proglacial river to occupy the former glaciated shelf. This stage of Bjørnelva River Valley, however, predates the valley identified in the 3-D seismic data. This ice-sheet configuration with ice in the Southern Barents Sea, however, does not represent a major ice-streaming phase (Knies and others, Reference Knies2009; Patton and others, Reference Patton, Hubbard, Andreassen, Winsborrow and Stroeven2016; Fig. 1a). Glacio-fluvial erosion controlled by episodic catastrophic flood events sourced from a retreating Barents Sea Ice Sheet (Fig. 13b) is the most likely process to truncate the URU in this area of the Barents Sea. Therefore, the deep Bjørnelva River Valley could have been created following the same high-energy processes involved in the formation of the valleys in the English Channel (Gupta and others, 2007; Collier and others, Reference Collier2015), the Münsterland Embayment (Meinsen and others, Reference Meinsen2011), or the Coronation – Spondin Scabland in the Canadian Prairies (Sjogren and Rains, Reference Sjogren and Rains1995). The Bjørnelva River Valley could have been formed by multiple separate Jøkulhlaups with wide ranges of magnitudes, as also suggested for megafloods in North America and Greenland (Baker and Bunker, Reference Baker and Bunker1985; Keisling and others, Reference Keisling, Nielsen, Hvidberg, Nuterman and DeConto2020; O'Connor and others, Reference O'Connor2020). Glacier-outburst generated floods can last minutes to years (e.g. O'Connor and Baker, Reference O'Connor and Baker1992; Roberts, Reference Roberts2005; Wingham and others, Reference Wingham, Siegert, Shepherd and Muir2006; Howat and others, Reference Howat, Porter, Noh, Smith and Jeong2015; Fricker and others, Reference Fricker, Siegfried, Carter and Scambos2016). The discrepancy between the depth and width of the incised Bjørnelva River with modern braided river datasets (Figs 8d–f) supports such a catastrophic and high-energy regime for the valley formation. Compared to the geometries of modern rivers, abrasion by bedload from a regular proglacial streamflow is a rather unlikely mechanism for eroding several tens of meters into URU. As the structure map is an amalgamated surface, the braided bars might represent landforms related to repeated fluvial intervals.
Conceptual model for the formation of the Bjørnelva River Valley during the Early Pleistocene. (a) Retreating Barents Sea Ice Sheet leaves a proglacial river to occupy the formerly glaciated shelf and forms an ice-marginal glacial lake. Mega-scale glacial lineations along URU indicate that ice had previously advanced over the region. (b) Glacial lake outburst flood. Glacial lake is dammed by the Barents Sea Ice Sheet and drains subglacially or ice-marginally during a catastrophic event. Bjørnelva River cuts several meters into Cretaceous sedimentary bedrock and forms an incised valley. (c) Braided river system with drained lake and decreased discharge compared to outburst. Braided bars form in a riverbed shaped by the glacial lake outburst.
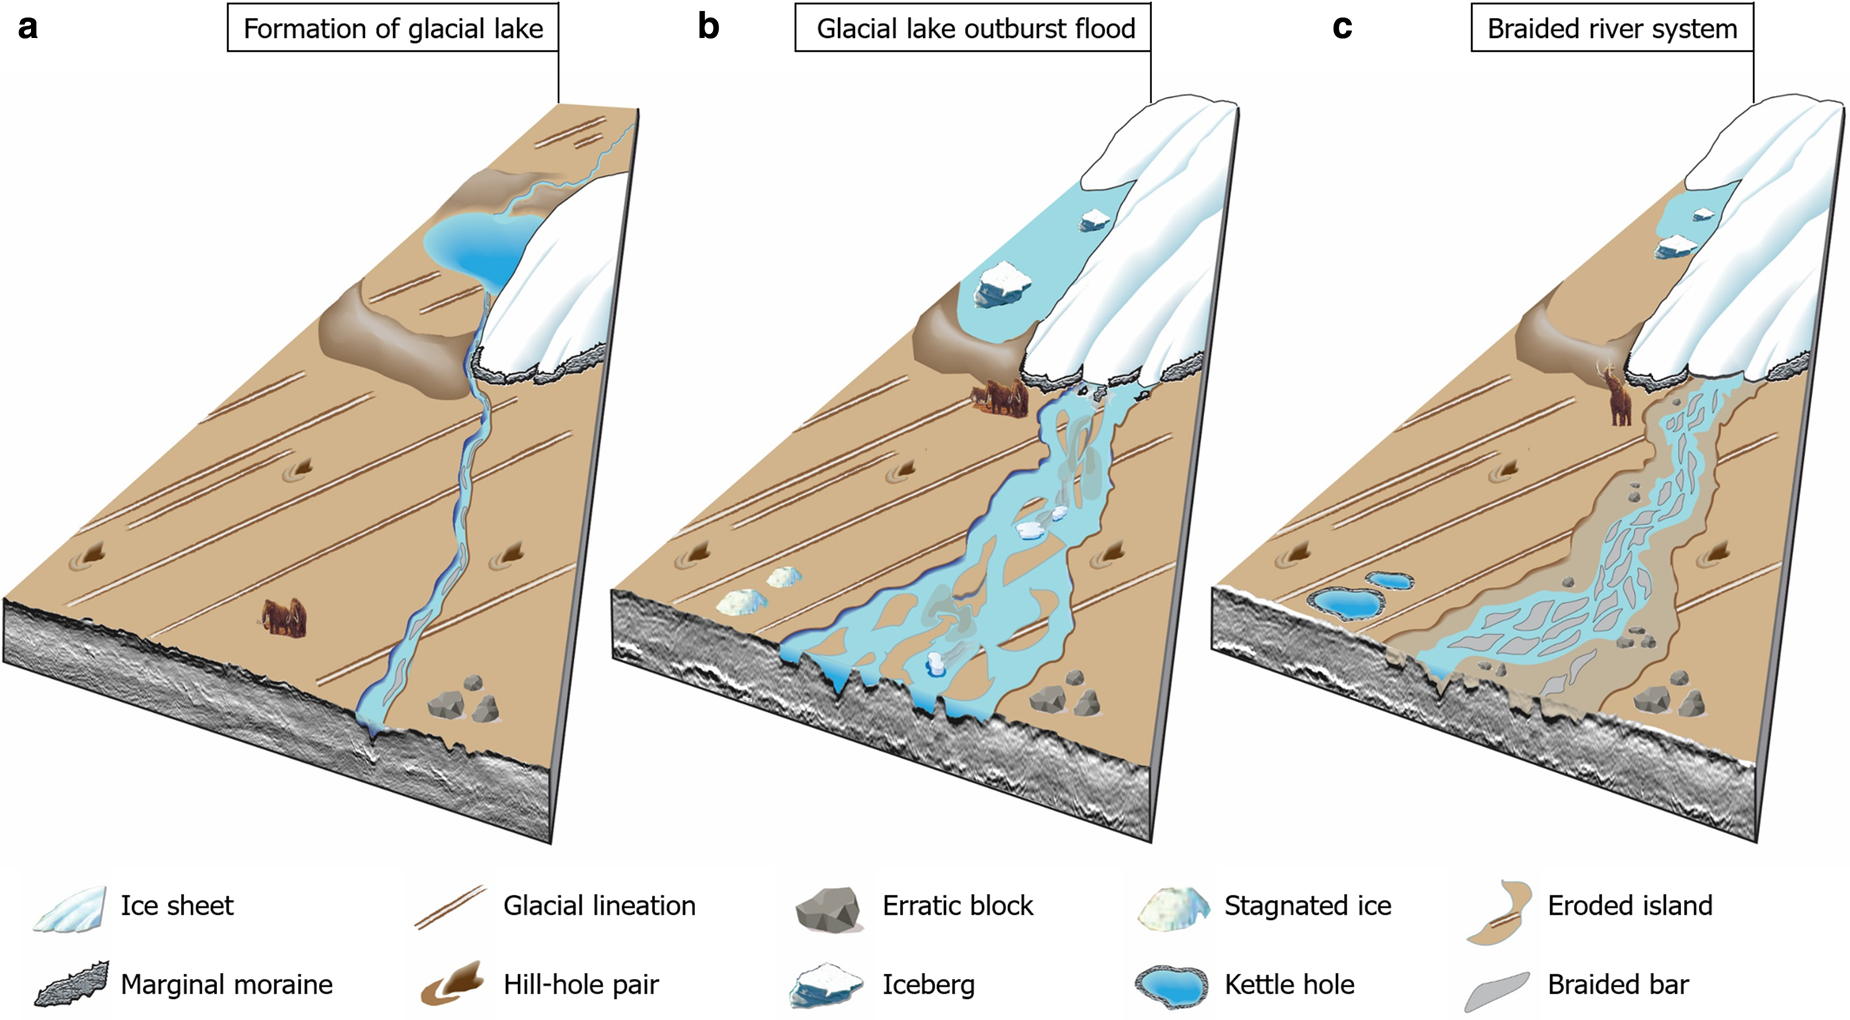
We suggest the deepest channels of Bjørnelva River Valley to be potentially formed by repeated outburst floods (Fig. 13b). These outbursts have eroded earlier phases of deposition (Fig. 13a). As the outburst stopped and the discharge dropped, the braided bars formed by a hydrodynamic regime are comparable to modern braided rivers (Figs 12, 13c). The water discharge along the valley is thus characterized by rapid and frequent variations. Catastrophic floods in subaerial braided channels can produce extreme channel and braided bars re-organization when compared to more quiet periods (Fig. 13c), similarly to the Squamish River flood in 1984 (Hickin and Sichingabula, Reference Hickin and Sichingabula1988).
The fresh water outbursts associated with the Bjørnelva River Valley formation would have a peak discharge of more than 160 000 m3 s−1, assuming that the discharge during the outburst filled the valley. The morphological configuration for this type of outburst could have prevailed during the Early Pleistocene, when the Barents Sea was a subaerial platform and the Barents Sea Ice Sheet expanded towards the Southern Barents Sea (Butt and others, Reference Butt, Drange, Elverhøi, Otterå and Solheim2002; Knies and others, Reference Knies2009). At that time, Dimakis and others (Reference Dimakis, Braathen, Faleide, Elverhøi and Gudlaugsson1998) modelled an altitude of ~100 m a.s.l. for the study area. A formation of a river after 1 Ma is rather unlikely, as the study area was submerged and affected by large glaciations. Based on the age constrains of these events, we suggest Bjørnelva River Valley to have formed in the Early Pleistocene. Isolated from terrestrial exposure, the subsequent drowning of the region could have contributed to the preservation of the paleo-landscape.
The volumes of water are comparable to outburst floods from massive subglacial or ice-marginal lakes (e.g. Lewis and others, Reference Lewis, Marchant, Kowalewski, Baldwin and Webb2006; Murton and others, Reference Murton, Bateman, Dallimore, Teller and Yang2010; Høgaas and Longva, Reference Høgaas and Longva2016; Hjelstuen and others, Reference Hjelstuen, Sejrup, Valvik and Becker2018) (Table 2). The nature of the water storage for the Bjørnelva River Valley, either by rupture of an ice dam or a drainage of a subglacial lake, is unknown at this time. Topographic highs at the URU to the southeast of the study area (Fig. 2b) could have acted as obstacles for subglacial drainage. Large volumes of water could also be dammed by ice to form a large lake at a location yet to be identified. The development of large potential subglacial lakes has been suggested for locations close to the Norwegian coast, with drainage networks towards Bjørnøyrenna (Shackleton and others, Reference Shackleton2018). Thus, we suggest that the Bjørnelva River Valley was originally carved by catastrophic outbursts of an ice-dammed lake in the proglacial domain of the Barents Sea Ice Sheet (Fig. 13b) or a subglacial lake of large volume and eroded Lower Cretaceous bedrock over a distance of >25 km. The flow velocities of characteristic glacial lake outburst floods are suggested between 5 and 15 m s−1 (Baker, Reference Baker and Martini2002) and our estimated average velocity of 6 m s−1 for Bjørnelva River fits this range. This study thus shows that two different hydrological regimes are preserved in the seismic data: an outburst regime carving the deepest channels and a less-energetic proglacial braided river regime forming the river bars. We show that these catastrophic high-energy floods can carve several tens of meters over widths of >1 km and distances of >25 km.
Select glacial lake outburst floods
5.4 Paleo-geographic reconstructions
The paleo-slope gradient of ancient river systems is a fundamental parameter required to reconstruct paleo-hydrology and paleo-climate from the fluvial sedimentary record (Castelltort, Reference Castelltort2018). Previous studies document a correlation between the slope gradient of modern braided rivers and the median grain size of the channel infill (Fig. 8c) (Schumm, Reference Schumm1985). An implied paleo-river gradient of 0.64 ± 0.1 m km−1 by the global database (Fig. 8b) is in the same order of magnitude as a measured slope angle of ~2.5 m km−1 in the structure maps (Fig. 2b). The fact that the surface gradient in the seismic data (2.5 m km−1) is higher than the reconstructed paleo-slope gradient (0.64 m km−1) could also be explained by a slightly increased erosion rate in the deeper Bjørnøyrenna in the northwest of the channel system. This increased erosion rate is supported by the observation of several ice-streaming events in that area (Piasecka and others, Reference Piasecka, Winsborrow, Andreassen and Stokes2016), which occurred after the formation of the incised valley. Even if the isostatic response due to glacial load does not significantly vary in this part of the former Barents Sea Ice Sheet (Fjeldskaar and Amantov, Reference Fjeldskaar and Amantov2018), glacio-isostatic adjustment could also explain the differences in the gradients. Further comparisons with the river database of Church and Rood (Reference Church and Rood1983) show that the Bjørnelva River Valley characteristics are consistent with a gently dipping, wide and deep channel system (Figs 8d–f).
Proglacial landscapes are dynamic environments with diurnal and seasonal fluctuations in discharge as well as glacial-interglacial fluctuations in ice position and amounts of precipitation and meltwater (Russell and others, Reference Russell, van Tatenhove and van de Wal1995; Stott, Reference Stott2002; Roberts, Reference Roberts2005; Lewis and Smith, Reference Lewis and Smith2009; Rennermalm and others, Reference Rennermalm2012). Channels and braided bars are usually highly mobile, with the layout often changing significantly during flood events (Ashmore, Reference Ashmore1991; Ferguson, Reference Ferguson, Best and Bristow1993; Knighton, Reference Knighton1998; Church, Reference Church2006). The landforms observed in the seismic data here might therefore be a snapshot of the last major reorganization of the Bjørnelva River Valley region (Fig. 13). The preservation of the river system further implies that the subsequent Quaternary glaciations did not completely erase the pre-existing geomorphology, but that ancient surfaces can still retain their original landforms. Similar to the Barents Sea, glacial erosion has preserved pre-existing fluvial landscapes in the Convoy Range to Mackay Glacier area in Antarctica (Lowe and Anderson, Reference Lowe and Anderson2003; Sugden and Denton, Reference Sugden and Denton2004; Denton and Sugden, Reference Denton and Sugden2005; Lewis and others, Reference Lewis, Marchant, Kowalewski, Baldwin and Webb2006) and the Petermann Canyon in Greenland (Bamber and others, Reference Bamber, Siegert, Griggs, Marshall and Spada2013; Cooper and others, Reference Cooper, Michaelides, Siegert and Dyke2016; Keisling and others, Reference Keisling, Nielsen, Hvidberg, Nuterman and DeConto2020). The preservation of paleo-landscapes, even though subsequently glaciated, implies that the shallow subsurface of the SW Barents Sea can be used to reconstruct geological processes of the Neogene and Quaternary time periods.
5.5 Channel infill
Here we discuss the significance of the sedimentary deposits characterizing the valley infill. Subglacial erosion, glacial reworking and glaciofluvial erosion are common processes shaping glacier forefields in modern braided rivers (Fig. 12b, c) (e.g. Willis and others, Reference Willis, Richards and Sharp1996). River bars consist of coarser-grained material, such as sand and gravel (Fig. 12b) (Buffington and Montgomery, Reference Buffington, Montgomery and Shroder2013). As the strata underlying the URU consist of Lower Cretaceous sandstone (small share), limestone and marl (www.npd.no, 2018), the bars in the study area likely represent reworked Cretaceous bedrock material. With a slope of 0.64 m km−1, the median grain size of comparable modern braided rivers falls into a first cluster from ~0.1 to 1 mm (i.e. sand) and a second cluster from 10 to 100 mm (i.e. gravel and pebbles, Fig. 8c). However, the Kernel density plot favors a sandy valley infill (Fig. 8c). As the infill of Bjørnelva River Valley is most likely dominated by the glacio-erosive products related to a large ice sheet, we suggest the deposits to consist mostly of sands rather than gravels. The horizontal to slightly dipping reflections within the individual channels of Bjørnelva River Valley could represent coarse-grained glaciofluvial sands, typically downlapping and onlapping the erosional channel surface (Figs 3c, 9c). This interpretation is supported by channel infill reported to consist of glaciofluvial gravelly sand intercalated with till in the SW Barents Sea (Sættem and others, Reference Sættem, Poole, Ellingsen and Sejrup1992).
Marine shales dominate the Lower Cretaceous sequence subcropping the URU in large parts of the SW Barents Sea (www.npd.no, 2018). Sandstones are more typical for Middle-Lower Jurassic and Upper Triassic strata, which are subcropping in large areas to the north of the study area and on the Loppa and Fedynsky highs (Fig. 1). Because of its origin to the south, we suggest that Bjørnelva River could transport sandy sediments eroded in the nearby Loppa High (Fig. 1a).
The acoustically chaotic basal part of the channel infill (Fig. 4b) most likely consists of coarser-grained gas-charged fluvial sands, thus explaining the negative-amplitude seismic reflections (Fig. 9b). On the other hand, the horizontally layered sediments in the upper part of the succession in the valley infill represent fine-grained fluvial deposits (Fig. 10). The different facies of the valley infill may represent distinct phases of the channel belt formation. Coarser-grained chaotic deposits at the base might be linked to the high-energy glacial lake outbursts (Fig. 13b), whereas overlying layered sediments could have a more turbiditic origin, reflecting fine-grained sediments deposited during low-energy braided river conditions or the waning of floods (Fig. 13c) (e.g. Meinsen and others, Reference Meinsen2011). The possibility of coarser-grained sediments deposited during more high-energic hydrological regimes is supported by grain-size analysis of proglacial rivers in Greenland (Hasholt and others, Reference Hasholt, Bech Mikkelsen, Holtegaard Nielsen and Andreas Dahl Larsen2013). These studies show that the transported sediments mainly consist of grain sizes finer than sand, except during high-flow events (Hasholt and others, Reference Hasholt, Bech Mikkelsen, Holtegaard Nielsen and Andreas Dahl Larsen2013). The high-amplitude Top channel reflection could represent sediments related to flood events spreading over larger URU regions and hence correspond to deposits similar to commonly documented flood plains. The chaotic reflections preserved in the sediment stratigraphy of the Bjørnelva River Valley infill support the existence of high-energy floods. The valley infill is furthermore valuable for identifying potential sources of the interpreted sands.
5.6 Pleistocene and historic analogues
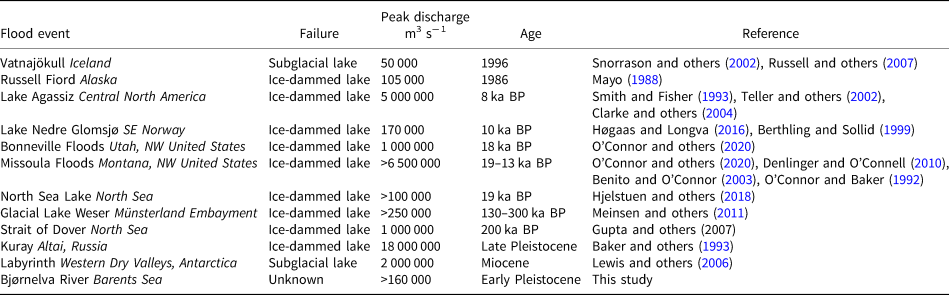
We have concluded Bjørnelva River Valley to be formed by a catastrophic glacial lake outburst along a previously glaciated shelf and here we investigate how this event compares with both historic and pre-historic glacial floods. Values for the peak discharge of well-established Pleistocene megaflood terrains range between 0.6 and 18 × 106 m3 s−1 (Collier and others, Reference Collier2015). Defined by the hydraulic radius and the valley slope, the calculated discharge of 160 000 m3 s−1 for the Bjørnelva River outburst is comparable to the discharge of the largest modern rivers (e.g. Amazon: 170 000 m3 s−1; Prestes and others, Reference Prestes, da Costa Borba, da Silva and Rollnic2020). However, such quantities of water might only have been flowing through the valley during extreme and short events, corresponding to glacial lake outburst floods triggered by dam failure (Fig. 13b) (Smith and Fisher, Reference Smith and Fisher1993; Gupta and others, 2007; Wiedmer and others, Reference Wiedmer, Montgomery, Gillespie and Greenberg2010; Denlinger and O'Connell, Reference Denlinger and O'Connell2010). The Missoula Floods in Montana and the Late Pleistocene superfloods in the Altai mountains are the largest prehistoric glacial lake outburst floods (Baker and others, Reference Baker, Benito and Rudoy1993; Benito and O'Connor, Reference Benito and O'Connor2003; Rudoy, Reference Rudoy2012), whereas the Skeidara River Flood caused by an outburst from Vatnajökull in 1996 is a more recent example (Snorrason and others, Reference Snorrason2002; Russell and others, Reference Russell, Gregory, Large, Fleisher and Harris2007) (Table 2).
An estimated discharge of 160 000 m3 s−1 is comparable to modern glacial outburst floods, such as Russell Fiord in Alaska, the Vatnajökull ice cap in Iceland or the Pleistocene ice-dammed lakes in the North Sea (Mayo, Reference Mayo1988; Russell and others, Reference Russell, Gregory, Large, Fleisher and Harris2007; Meinsen and others, Reference Meinsen2011; Hjelstuen and others, Reference Hjelstuen, Sejrup, Valvik and Becker2018) (Table 2). The floods of Lake Nedre Glomsjø in SE Norway, with a peak discharge of 170 000 m3 s−1 and a flood height of 80–90 m, eroded the huge Jutulhogget canyon and are the best studied outburst floods from the Norwegian mainland (Berthling and Sollid, Reference Berthling and Sollid1999; Høgaas and Longva, Reference Høgaas and Longva2016). The Glacial Lake Weser outburst flood (>250 000 m3 s−1) eroded up to 30 m into Cretaceous basement (limestone and marlstone) and created up to 4 km-wide channels in front of overspill channels (Meinsen and others, Reference Meinsen2011) and is suggested to be a good analogue to the erosive character related to the formation of the Bjørnelva River Valley. Erosion of weak, late Cretaceous bedrock and preexisting glaciogenic sediments in short-duration sheetfloods was also the dominating geological process shaping the Coronation – Spondin Scabland in the Canadian Prairies (Sjogren and Rains, Reference Sjogren and Rains1995).
The Petermann Canyon, an up to 800 m deep megacanyon in Greenland is suggested to have been shaped by repeated megafloods in the Pliocene-Pleistocene (Keisling and others, Reference Keisling, Nielsen, Hvidberg, Nuterman and DeConto2020). The canyon morphology could have formed by running water prior to extensive glaciation (Bamber and others, Reference Bamber, Siegert, Griggs, Marshall and Spada2013; Cooper and others, Reference Cooper, Michaelides, Siegert and Dyke2016). With a vertical erosion of 1–20 m per flood event, the suggested mechanism required 40–800 jøkulhlaup-like floods (Keisling and others, Reference Keisling, Nielsen, Hvidberg, Nuterman and DeConto2020). Both maximum erosion of 20 m per flood event and a proglacial environment prior to the extensive glaciation highlights the potential analogy between Petermann Canyon in Greenland and Bjørnelva River Valley in the Barents Sea.
Flow-erosive events have implications for modern settlements downstream glaciated catchment areas, as ice melting related to ongoing climate change and the development of ice-marginal and subglacial lakes may evolve into severe geohazards (Roberts, Reference Roberts2005; Huss and others, Reference Huss, Bauder, Werder, Funk and Hock2007; Baker, Reference Baker2008; Bajracharya and Mool, Reference Bajracharya and Mool2009; Dussaillant and others, Reference Dussaillant2010; Carrivick and Tweed, Reference Carrivick and Tweed2016; Harrison and others, Reference Harrison2018; Shugar and others, Reference Shugar2020). This study shows that the Bjørnelva River outburst floods cut more than 20 m into sedimentary bedrock over distances of several tens of kilometers. Landforms and landscapes related to catastrophic megafloods have been revealed in increasing detail from Mars (e.g. Robinson and Tanaka, Reference Robinson and Tanaka1990), where the discharges formed by lake spillways have been calculated from 5 to 20 × 106 m3 s−1 (Komar, Reference Komar1979; Irwin and others, Reference Irwin, Howard and Maxwell2004). Distinctive fluvial signatures from Earth are valuable for interpretations of landforms and sedimentary records on planets with limited subsurface information. Thus, the hydrologic and erosive character of the Bjørnelva River outburst have large-scale implications not only for Earth, but also for other terrestrial planets (e.g. Mars).
5.7 Comparison of erosive and depositional patterns
Cataclysmic glacial outburst floods erode large channels and canyon networks (Smith, Reference Smith1993; Larsen and Lamb, Reference Larsen and Lamb2016), and abrupt cessation of these flows can leave coarse deposits (Baker, Reference Baker1973; Sjogren and Rains, Reference Sjogren and Rains1995; O'Connor and others, Reference O'Connor2020). The landscape of the Coronation – Spondin Scabland in the Canadian Prairies formed in front of the retreating Laurentide Ice Sheet and outburst floods left discontinuous gravel beds, large boulders and bedrock clasts (Sjogren and Rains, Reference Sjogren and Rains1995). Such erosional products have not been deposited by the Bjørnelva River outburst flood, as these large deposits would be detectable in high-resolution 3-D seismic (Lebedeva-Ivanova and others, Reference Lebedeva-Ivanova2018). This difference in depositional patterns can be explained by a catchment dominated by sedimentary bedrock for the region of the Bjørnelva River Canyon (Fig. 1).
While the deposits from the Bjørnelva River outburst flood differ from the largest identified events on Earth, the erosional power of the Bjørnelva River is comparable to other paleofloods (Sjogren and Rains, Reference Sjogren and Rains1995; Meinsen and others, Reference Meinsen2011; O'Connor and others, Reference O'Connor2020).
Outburst-related landforms expressed at the Earth surface can be studied at larger extents and in higher detail compared to buried paleo-landscapes (Smith, Reference Smith1993; Høgaas and Longva, Reference Høgaas and Longva2016; O'Connor and others, Reference O'Connor2020). While sedimentological analysis is a common procedure for glaciofluvial erosional morphology and sediments expressed at the Earth surface (Smith, Reference Smith1993; O'Connor and others, Reference O'Connor2020), boreholes and wells to analyze the canyon infill of this study have yet to be collected.
5.8 What can we learn from Bjørnelva River for modern rivers?
The case of the Bjørnelva River outburst flood indicates a discharge of 160 000 m3 s−1 of fresh water on a relatively flat and extensive shelf in the SW Barents Sea during an abrupt hydrologic event, most likely sourced from an ice-dammed or subglacial lake during the Early Pleistocene. In the following, we discuss the implications of this study towards constraining the evolution of glaciated and deglaciated landscapes and mechanistic traits of glacial lake outburst floods.
The incised valley of the Bjørnelva River was shaped by a high-energetic hydrological regime during a Pleistocene deglaciation. The ice-free topographic maps of Greenland and Antarctica show several wide plains where rivers can evolve and relief where lakes may form in the future (Fretwell and others, Reference Fretwell2013; Morlighem and others, Reference Morlighem2017). Extreme hydrologic events can be significant for the evolution of landscapes in regions currently covered by the Greenland and Antarctic ice sheets. The results of this contribution can be used as a potential analogue to study the morphological evolution of the current landforms developed by the melting of the large ice sheets and leading to outburst processes.
The Antarctic ice sheet is dominated by marine-terminating glacier outlets (Dowdeswell and others, Reference Dowdeswell2016). Numerous paleo-subglacial channels incised into crystalline bedrock are exposed on the seafloor of the Antarctic continental shelf and indicate channelized subglacial meltwater drainage fed by upstream subglacial lakes (Lowe and Anderson, Reference Lowe and Anderson2003; Livingstone and others, Reference Livingstone2013; Simkins and others, Reference Simkins2017; Munoz and Wellner, Reference Munoz and Wellner2018). Radar and altimetric data are common technologies used to detect subglacial lakes across Antarctica and the fourth inventory of Antarctic subglacial lakes includes 379 active subglacial lakes (Wright and Siegert, Reference Wright and Siegert2012; Siegfried and Fricker, Reference Siegfried and Fricker2018; MacKie and others, Reference MacKie, Schroeder, Caers, Siegfried and Scheidt2020). Dowdeswell and Siegert (Reference Dowdeswell and Siegert1999) estimated a volume of 4 000–12 000 km3 of water held in 77 of these Antarctic subglacial lakes. The meltwater stored in these lakes can drain over periods of months to several years with potential for reactivation of the channel network (Wingham and others, Reference Wingham, Siegert, Shepherd and Muir2006; Howat and others, Reference Howat, Porter, Noh, Smith and Jeong2015; Fricker and others, Reference Fricker, Siegfried, Carter and Scambos2016).
Several discharge events in the order of 102 to 103 m3 s−1 have been reported from Antarctica occurring during the last decades (Siegfried and Fricker, Reference Siegfried and Fricker2018). However, considering landform assemblages and volume estimates, the Labyrinth in the McMurdo Dry Valleys in East Antarctica is a better analogue for the Bjørnelva River Valley formation (Lowe and Anderson, Reference Lowe and Anderson2003; Sugden and Denton, Reference Sugden and Denton2004; Denton and Sugden, Reference Denton and Sugden2005; Lewis and others, Reference Lewis, Marchant, Kowalewski, Baldwin and Webb2006). The channels forming the Labyrinth incised a sill and shaped a valley up to 600 m in width and up to 250 m in depth (Lewis and others, Reference Lewis, Marchant, Kowalewski, Baldwin and Webb2006). The maximum estimated discharge for this catastrophic drainage, proposed to have occurred sometime between 14.4 and 12.4 Ma, is in the order of 1.6–2.2 × 10⁶ m3 s−1 (Lewis and others, Reference Lewis, Marchant, Kowalewski, Baldwin and Webb2006). Glacial lakes are rapidly growing in response to climate change and glacier retreat, and the peak in future glacier lake outburst events will most likely lag by several decades the responses of glacier lake systems to current warming (Harrison and others, Reference Harrison2018; Shugar and others, Reference Shugar2020). Large-volume outbursts, such as Bjørnelva River, might thus be more frequent processes on Earth during the next decades and into the 22nd century.
The Greenland ice sheet, on the other hand, comprises both marine- and land-terminating outlets (Dowdeswell and others, Reference Dowdeswell2016). The proglacial hydrologic environment of Greenland consists of rivers and lakes draining the ice margin (Chu, Reference Chu2014), with a total of 434 proglacial meltwater outlets from land-terminating portions of the ice sheet (Lewis and Smith, Reference Lewis and Smith2009). Seasonal fluctuations measured in proglacial streams and lakes draining this ice sheet show large uncertainties in discharge (Stott and Grove, Reference Stott and Grove2001; Rennermalm and others, Reference Rennermalm2012).
Ongoing deglaciation of both the Greenland and Antarctic ice sheet likely exposes terrestrial landscapes, resulting in changes of patterns in glacial meltwater discharge, including the development of proglacial landscapes in Antarctica. The geological archives of Greenland record several historic and Holocene outburst events (Russell and others, Reference Russell, van Tatenhove and van de Wal1995; Stott, Reference Stott2002; Lewis and Smith, Reference Lewis and Smith2009; Bamber and others, Reference Bamber, Siegert, Griggs, Marshall and Spada2013; Chu, Reference Chu2014; Cooper and others, Reference Cooper, Michaelides, Siegert and Dyke2016; Keisling and others, Reference Keisling, Nielsen, Hvidberg, Nuterman and DeConto2020). Meltwater outburst from large upstream lakes could reshape the highly dynamic proglacial environments and form similar landscapes as the ones proposed for the early Pleistocene in the SW Barents Sea. Our study thus contributes to the knowledge to estimate the range and character (river morphology and sedimentology) of large outburst floods along the margins of these large ice sheets. Large outburst floods might especially affect SW Greenland, where the average annual volumetric meltwater production is highest and hydrologic activity consequently greater compared to East Greenland (Lewis and Smith, Reference Lewis and Smith2009).
This study shows that buried wide plains with sharp channels and depositional bars can be preserved in high-resolution, as also observed in deeper stratigraphic levels of the SW Barents Sea (Corseri and others, Reference Corseri2018; Klausen and others, Reference Klausen, Nyberg and Helland-Hansen2019). Wide plains are characteristic landscapes in Arctic regions and the dry and cold climate prevailing in these regions favors the build-up of permafrost (Kanevskiy and others, Reference Kanevskiy, Shur, Fortier, Jorgenson and Stephani2011; Schirrmeister and others, Reference Schirrmeister, Froese, Tumskoy, Grosse and Wetterich2013). The Barents Sea at the time of the Bjørnelva River Valley formation is most likely characterized by such a climate and permafrost in the shale-dominated subsurface is discussed for landscape evolution of this paleo-surface (Bellwald and others, Reference Bellwald, Planke, Lebedeva-Ivanova, Piasecka and Andreassen2019). Our study shows that highly erosive fluvial events can occur in such dry and cold climates, a type of event also documented for the Coronation – Spondin Scabland of the Canadian Prairies (Sjogren and Rains, Reference Sjogren and Rains1995). Decadal outburst events in otherwise calm hydrological conditions, potentially combined with underlying permafrost, might shape upcoming wide plains in Arctic regions (e.g. West Greenland).
Extreme glacial floods further impact infrastructure and society (Roberts, Reference Roberts2005; Huss and others, Reference Huss, Bauder, Werder, Funk and Hock2007; Bajracharya and Mool, Reference Bajracharya and Mool2009; Dussaillant and others, Reference Dussaillant2010; Carrivick and Tweed, Reference Carrivick and Tweed2016; Harrison and others, Reference Harrison2018; Shugar and others, Reference Shugar2020). The geomorphological analysis of Bjørnelva River Valley shows that the channel is deepest closer to the source and shallows with distance. Most pronounced carving closer to the outburst source suggests that the erosive power and consequently destructive potential, for outburst floods on wide plains changes with distance. Diminishing carving downflow of Bjørnelva River Valley most likely implies that the flood discharge was not completely channelized anymore, but rather spilled over a larger area. Bjørnelva River Valley thus highlights that quantitative analyses of paleo-landscapes shaped by outburst flood events can inform geohazard assessments in areas at risk of outburst flooding today. New infrastructure in sensitive areas should be erected in safe zones with respect to the distance of outburst source, considering that the inevitable outburst could be more erosive closer to the source and flood extended areas farther downstream.
6 Conclusions
The high-resolution 3-D seismic data from the Hoop area in the SW Barents Sea show that channelized braided meltwater outflow and river bars related to the formation of Bjørnelva River Valley are developed on a glacial paleo-surface (Upper Regional Unconformity, URU). Bjørnelva River carved up to 23 m-deep channels into the Cretaceous sedimentary bedrock formed an average 1500 m-wide fluvial system during the Early Pleistocene. We infer this erosion was caused by one or more successive floods triggered from the outbursts of a lake dammed by the Barents Sea Ice Sheet, resulting in peak water discharges of ~160 000 m3 s−1, a volume comparable to the largest modern glacial lake outbursts.
This study shows that high-energy hydrological events can leave distinctive signatures in the sedimentary records of braided river systems, with two prevailing fluvial regimes in this case: (i) violent glacial lake outbursts carving a valley and channel belt and (ii) a less energetic braided river after the lake outbursts forming the streamlined braided bars. An average bar elongation of 2.54 ± 0.04 indicates that braiding and river bar formation of Bjørnelva River occurred along a gently dipping paleo-surface of 0.64 m km−1. Our observations show that the Bjørnelva River outburst character changes from carving to spillover along its drainage route and the geomorphologies identified in this contribution help to evaluate the destructive potential of outburst floods. We show that the URU does not only reveal expressions related to repeated large-scale glacial oscillations, but also glaciofluvial expressions formed in subaerial proglacial environments.
Bjørnelva River likely had a large impact on the landscape evolution of the SW Barents Sea, and may further have had an influence on the Barents Sea Ice Sheet dynamics. This contribution further illustrates that highly erosive fluvial events can occur in regions dominated by dry and cold climates, and help close knowledge gaps for the large-scale drainage evolution on Arctic plains during deglaciations. Thus, Bjørnelva River Valley could act as a potential analogue for landscapes developing in regions of the melting Greenland and Antarctic ice sheets.
Acknowledgements
We thank TGS, WGP and VBPR for allowing to publish the seismic data. Peter Sanderson is thanked to use his illustration on braided streams. Romain Corseri is acknowledged for valuable discussions and comments. Sverre Planke and Jan Inge Faleide acknowledge the support from the Research Council of Norway through its Centres of Excellence funding scheme, project 223272 (CEED) and project 228107 (ARCEx). Peter Haeussler, Bobby Reece, and Amy East are acknowledged for productive discussions of the manuscript. We thank the two reviewers Sean Gulick and Julia Wellner as well as the scientific editor Matthew Siegfried and associate chief editor Hester Jiskoot for detailed and constructive feedback.


 Open access