


Introduction
In late December 2019, a pneumonia-like disease of unknown aetiology was reported in Wuhan [Reference Zhu1], China, which was eventually identified to be caused by severe acute respiratory syndrome coronavirus-2 (SARS-CoV-2). This pneumonia was renamed coronavirus disease 2019 (COVID-19) and was announced by the World Health Organization (WHO) as a global pandemic on 11 March 2020. As of 8 November 2020, there have been 49 578 590 infected cases and 1 245 717 deaths reported on the WHO dashboard [2]. Clinical manifestations of COVID-19 range from no or mild symptoms to severe pneumonia, acute respiratory distress syndrome (ARDS), or even multiorgan failure and death.
A meta-analysis compromising 18 506 patients investigated the association between diabetes and COVID-19 and found diabetes was associated with a 65% higher risk for death [Reference Palaiodimos3]. Other risk factors, such as cardiovascular disease and hypertension, have also been shown to increase the severity of COVID [Reference Zheng4–Reference Nancy6]. The diseases mentioned above are usually associated with excessive adipose tissue accumulation causing metabolic and inflammatory changes [Reference Huttunen and Syrjanen7–Reference Seravalle G9]. Obesity has been identified as an independent predisposition factor for severe cases of severe acute respiratory syndrome (SARS) and Middle East respiratory syndrome (MERS) infection [Reference Van Kerkhove10], and a high genetic similarity was observed between SARS-CoV-2 and SARS-CoV (80%) and MERS-CoV (50%) [Reference Busetto11]. These data indicate that obesity might be a risk factor for the severity of COVID-19.
One previous study in China showed that only 18.95% of survivors were overweight, and 88.24% of non-survivors had a higher body mass index (BMI) [Reference Peng12]. In Germany, patients with ARDS were more overweight or obese (83%) than those with healthy BMI (42%) [Reference Dreher13]. More recently, some meta-analyses showed that obesity was associated with mortality, severity and predicted poor outcome in COVID-19 patients [Reference Foldi14–Reference Yang17]. However, there are some limitations to these meta-analyses. First, the number of eligible studies is small, ranging from 9 to 14. Second, the data from other countries are scarce, and most eligible studies are from China and the USA. Third, the definition of obesity is different between Eastern and Western countries. Last, the conclusions of previous meta-analyses may be altered due to the recent emergence of a large number of studies about the association between obesity and COVID-19. Europe and North America, which have the highest prevalence of obesity cases, has become the epicentre of the COVID-19 pandemic [18]. Therefore, it is necessary to re-explore the relationship between obesity and COVID-19, including susceptibility to SARS-Cov-2 infection, which was not analysed in previous meta-analyses and poor outcomes, as we have performed in the meta-analysis presented here.
Methods
Research strategy
This meta-analysis was performed following the PRISMA guidelines. A comprehensive search was performed using the PubMed, EMBASE and Cochrane Library databases for literature published between 1 January 2020 and 25 August 2020. The following words were utilised during the search: (COVID-19 or coronavirus or SARS-CoV-2) and (obesity or overweight or body mass index). Reference lists of eligible studies and relevant review articles were screened and evaluated for additional studies that could be used in analyses.
Inclusion and exclusion criteria
Inclusion criteria for the studies in our analyses were as follows:
(1) Studies published in English
(2) Studies investigating the association between obesity or overweight and COVID-19.
(3) Studies including both adults and children diagnosed with COVID-19.
(4) Cohort studies with prospective or retrospective designs.
Exclusion criteria from analyses were:
(1) Review articles, letters or commentaries.
(2) Duplicate studies.
(3) Studies in which data were not available.
Data assessment
Two individual authors (Jiao Yang and ZhiYing Ma) independently extracted the following information: study design, age, gender, susceptibility to COVID-19, the severity of COVID-19 (need for hospitalisation, severe cases, need for intensive care unit (ICU) admission, need for invasive mechanical ventilation (IMV) and mortality). Severe COVID-19 was defined according to the American Thoracic Society guidelines.
Statistical analysis
RveMan5.3 (Cochrane Collaboration) was used to analyse data with associated odds ratios (OR) and corresponding 95% confidence intervals (CIs). The generic inverse variance approach was used for the meta-analysis. A P < 0.05 was identified as statistically significant. The I 2 statistic was used to assess the heterogeneity among the studies analysed. An I 2 >50% or P < 0.1 indicated heterogeneity, for which the random-effects model was utilised. Otherwise, the fixed-effects model was used. In addition, publication bias was evaluated through visual inspections of funnel plots, and the quality of eligible studies was assessed using the Newcastle-Ottawa Quality Assessment Scale.
Results
Study characteristics
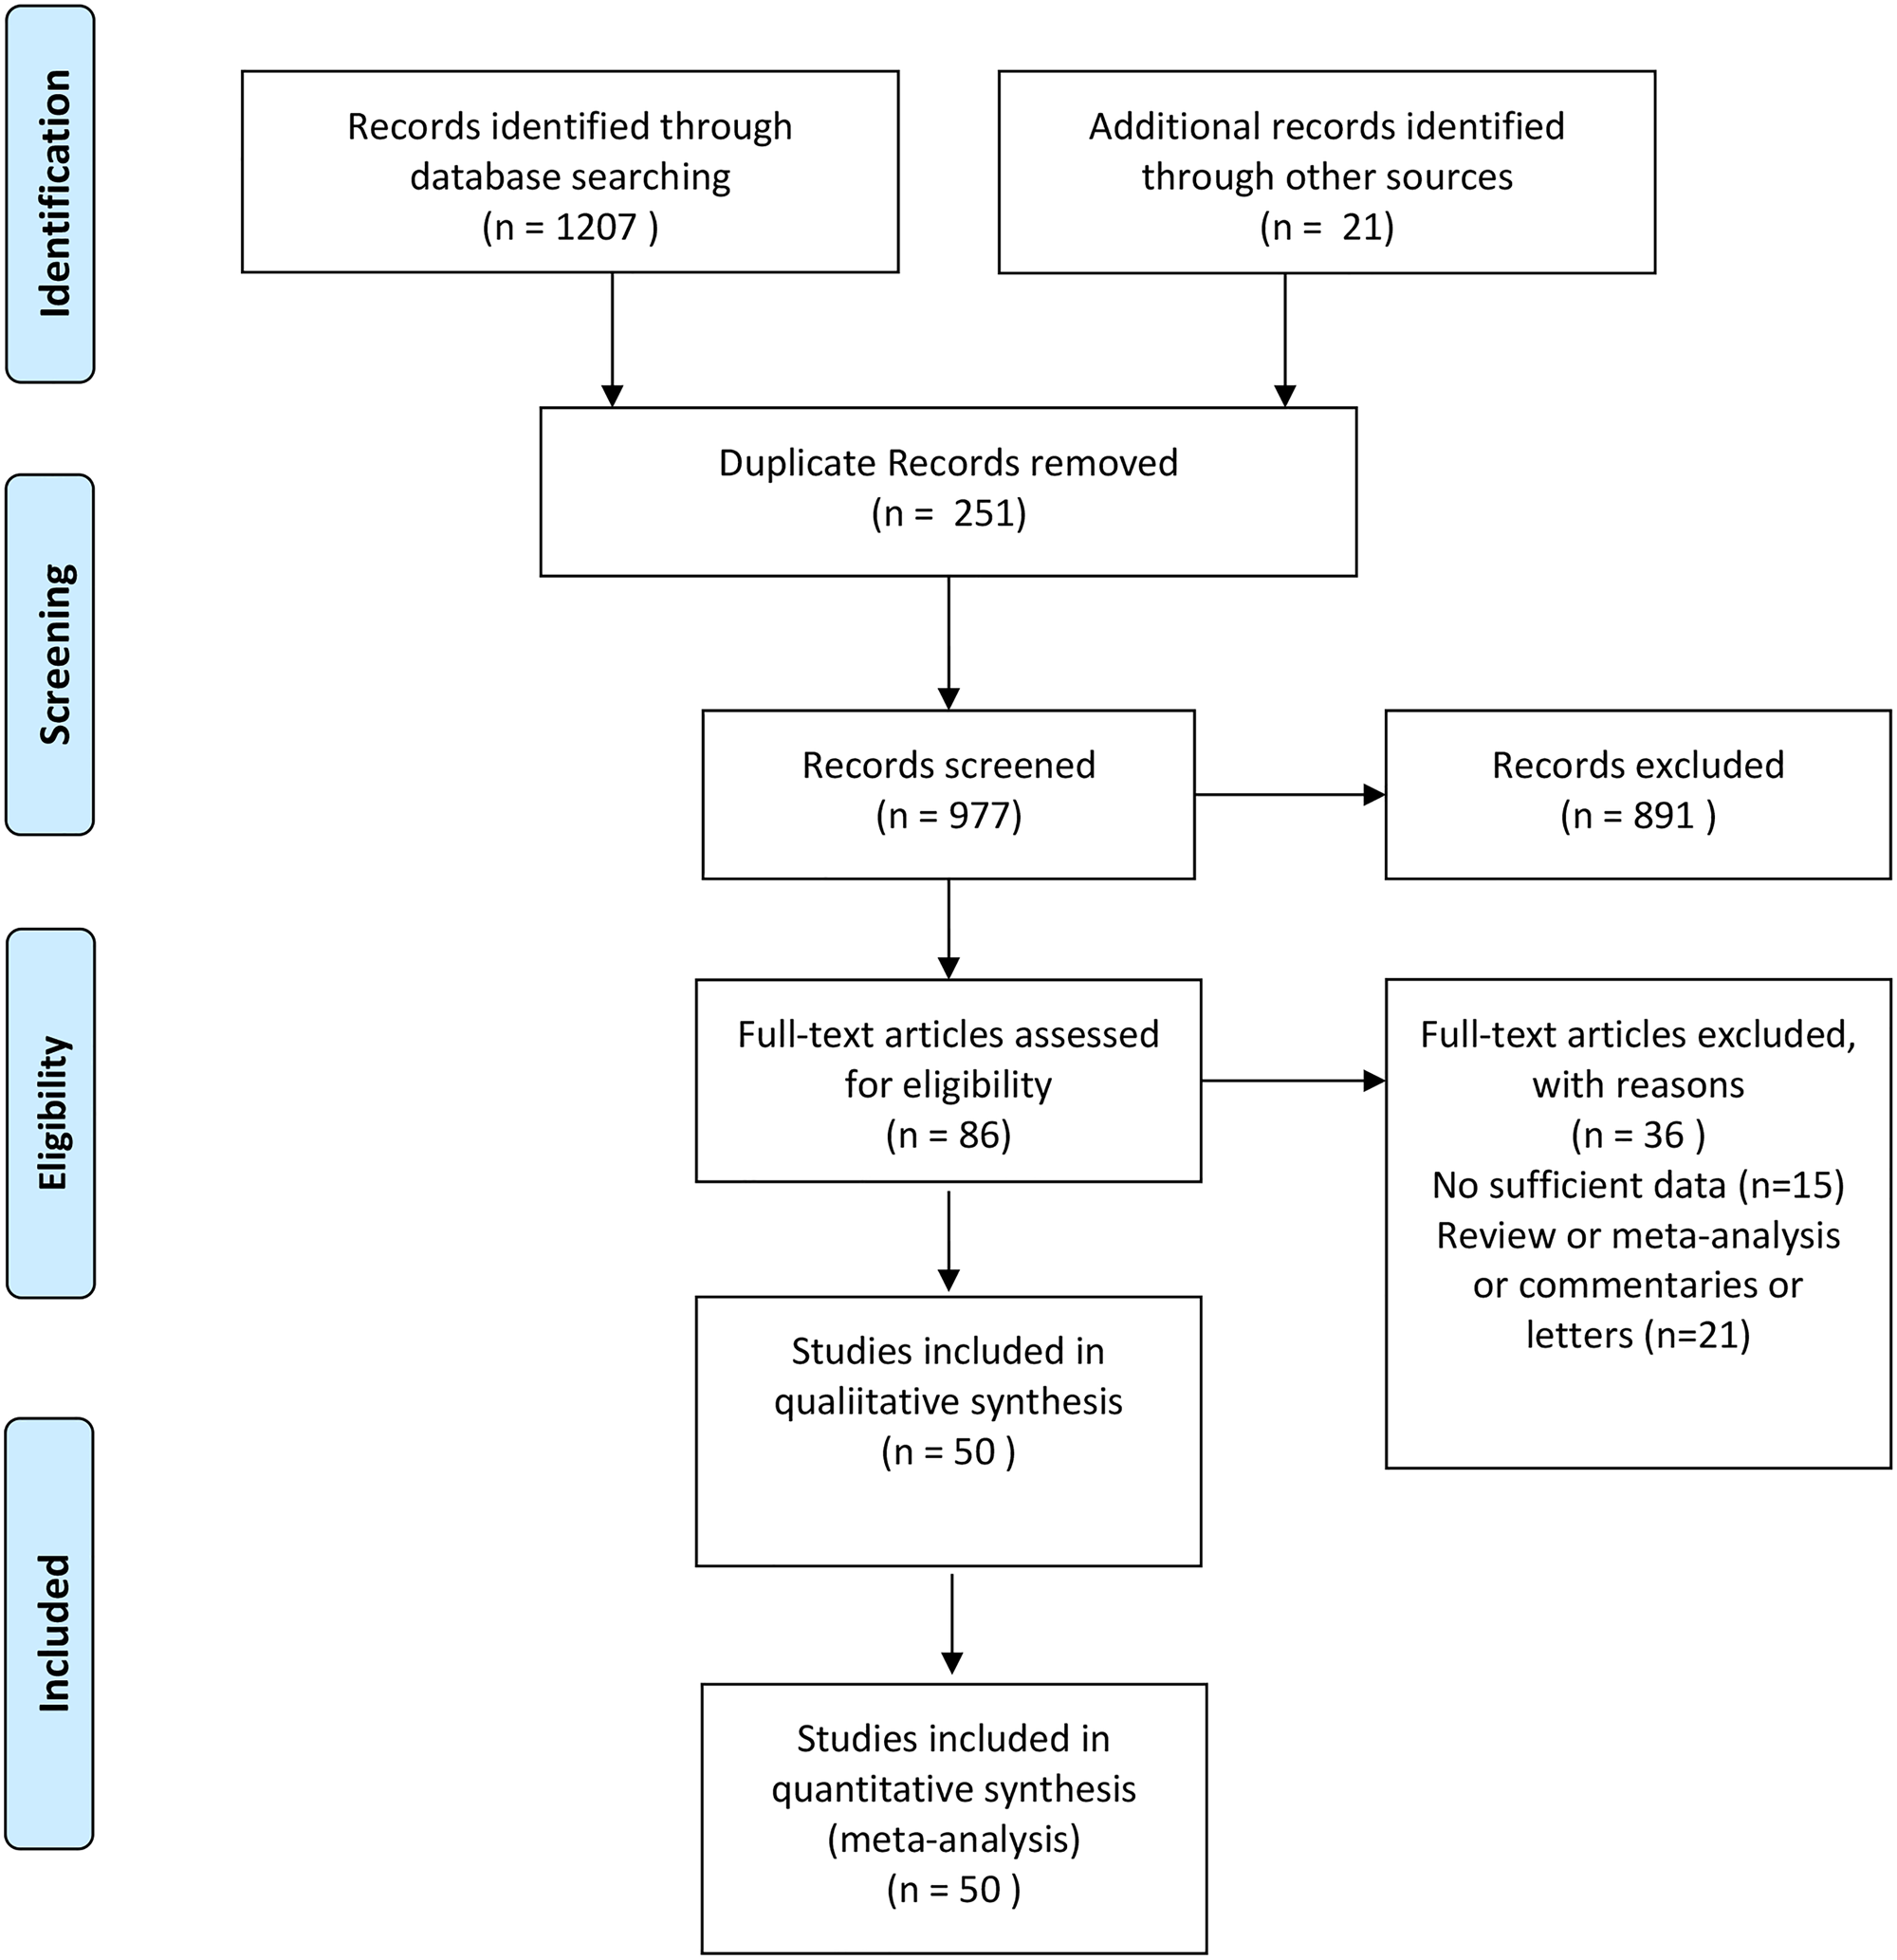
A total of 50 studies [Reference Busetto11, Reference Alkhatib19–Reference Lodigiani67] that included 18 260 378 subjects were eligible for the meta-analysis. Out of these 50 studies, 44 were retrospective and 6 were prospective cohort studies. Twenty-five studies were conducted in the USA, 6 in China, 4 in Italy, 4 in the UK, 4 in Mexico, 3 in France and 1 in Brazil, Singapore, South Korea and Bolivia. The incidence of obesity, defined as BMI ⩾30, varied from 5.57% to 68.48% in this meta-analysis. Detailed search strategies and characteristics of eligible studies are presented in Fig. 1 and Table 1, respectively. The Newcastle−Ottawa Quality Assessment Scale scores for all included studies were equal to or more than 6, as shown in Table 1, which is acceptable for a meta-analysis.
Flow diagram of the literature selection process.
Baseline characteristics of the eligible studies
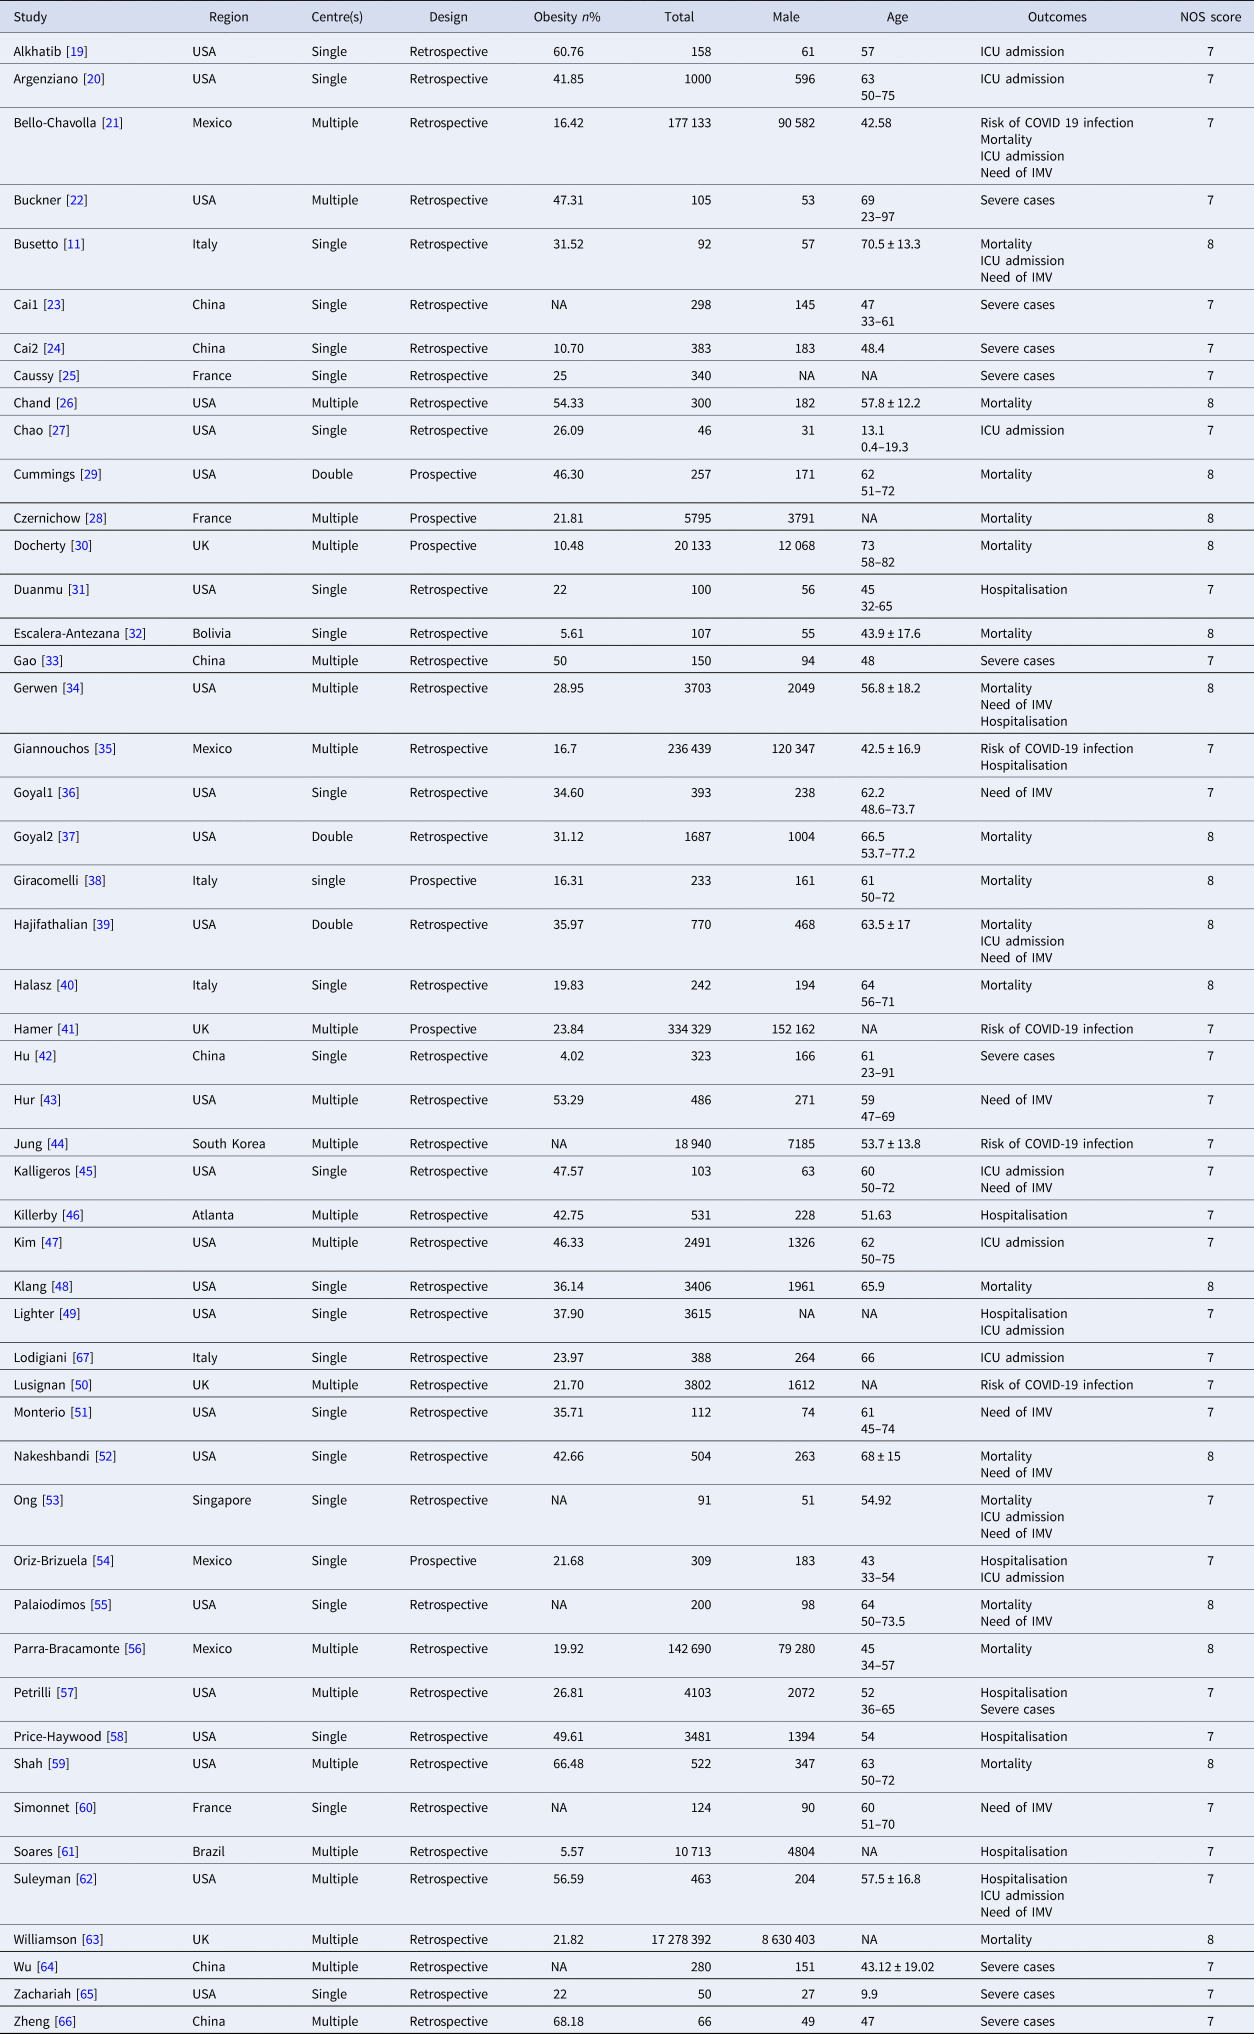
IMV, invasive mechanical ventilation; ICU, intensive care unit; NA, not available; NOS, Newcastle−Ottawa quality assessment scale.
Outcomes
Risk of COVID-19
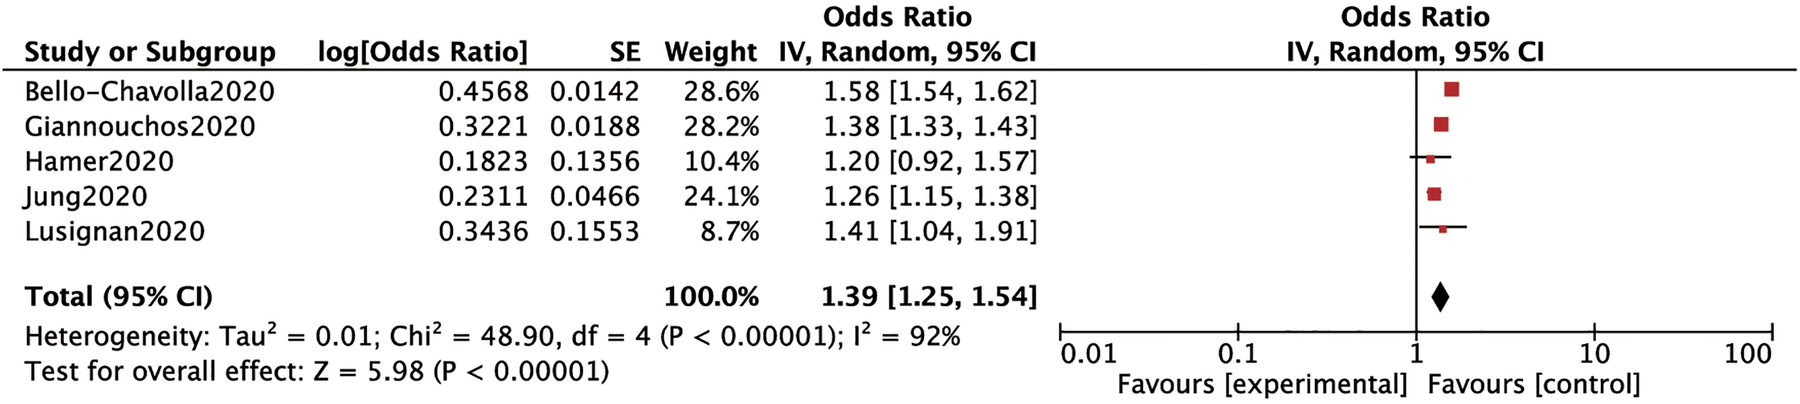
Five studies involving 753 597 cases mentioned the association between obesity and the risk of SARS-CoV2 infection. We used the random-effects model for analysis due to a high heterogeneity (P < 0.00001 and I 2 = 92%) between studies. This model suggested that obese subjects had a higher risk of SARS-CoV2 infection as compared to those without obesity (OR: 1.39; 95% CI 1.25–1.54; P < 0.00001) (Fig. 2).
Forrest plot depicting the risk of COVID-19.
Severity of COVID-19
Hospital admission: We conducted a stratified analysis to assess the relationship between BMI ranges and the need for hospital admission in patients with COVID-19. Patients with a BMI 25–29.9, BMI ⩾ 30 and BMI ⩾35 had higher rates of hospital admission than those with a BMI <25 (OR: 2.09, 95% CI 1.22–3.60, P: 0.007; OR: 2.45, 95% CI 1.78–3.39, P < 0.00001 and OR: 2.63, 95% CI 1.55–4.47, P: 0.0003, respectively) (Fig. 3). However, no significant increases in hospital admission rates were found for patients with a BMI between 30 and 34.9 (OR: 1.10, 95% CI 0.88–1.37, P: 0.4) than those with a healthy weight, as shown in Figure 3.
Forrest plot showing the severity of COVID-19: (a) BMI 25−29.9 and hospital admission, (b) BMI⩾30 and hospital admission, (c) BMI 30−34.9 and hospital admission, (d) BMI⩾35 and hospital admission, (e) BMI and severe cases, (f) BMI⩾30 and severe cases.
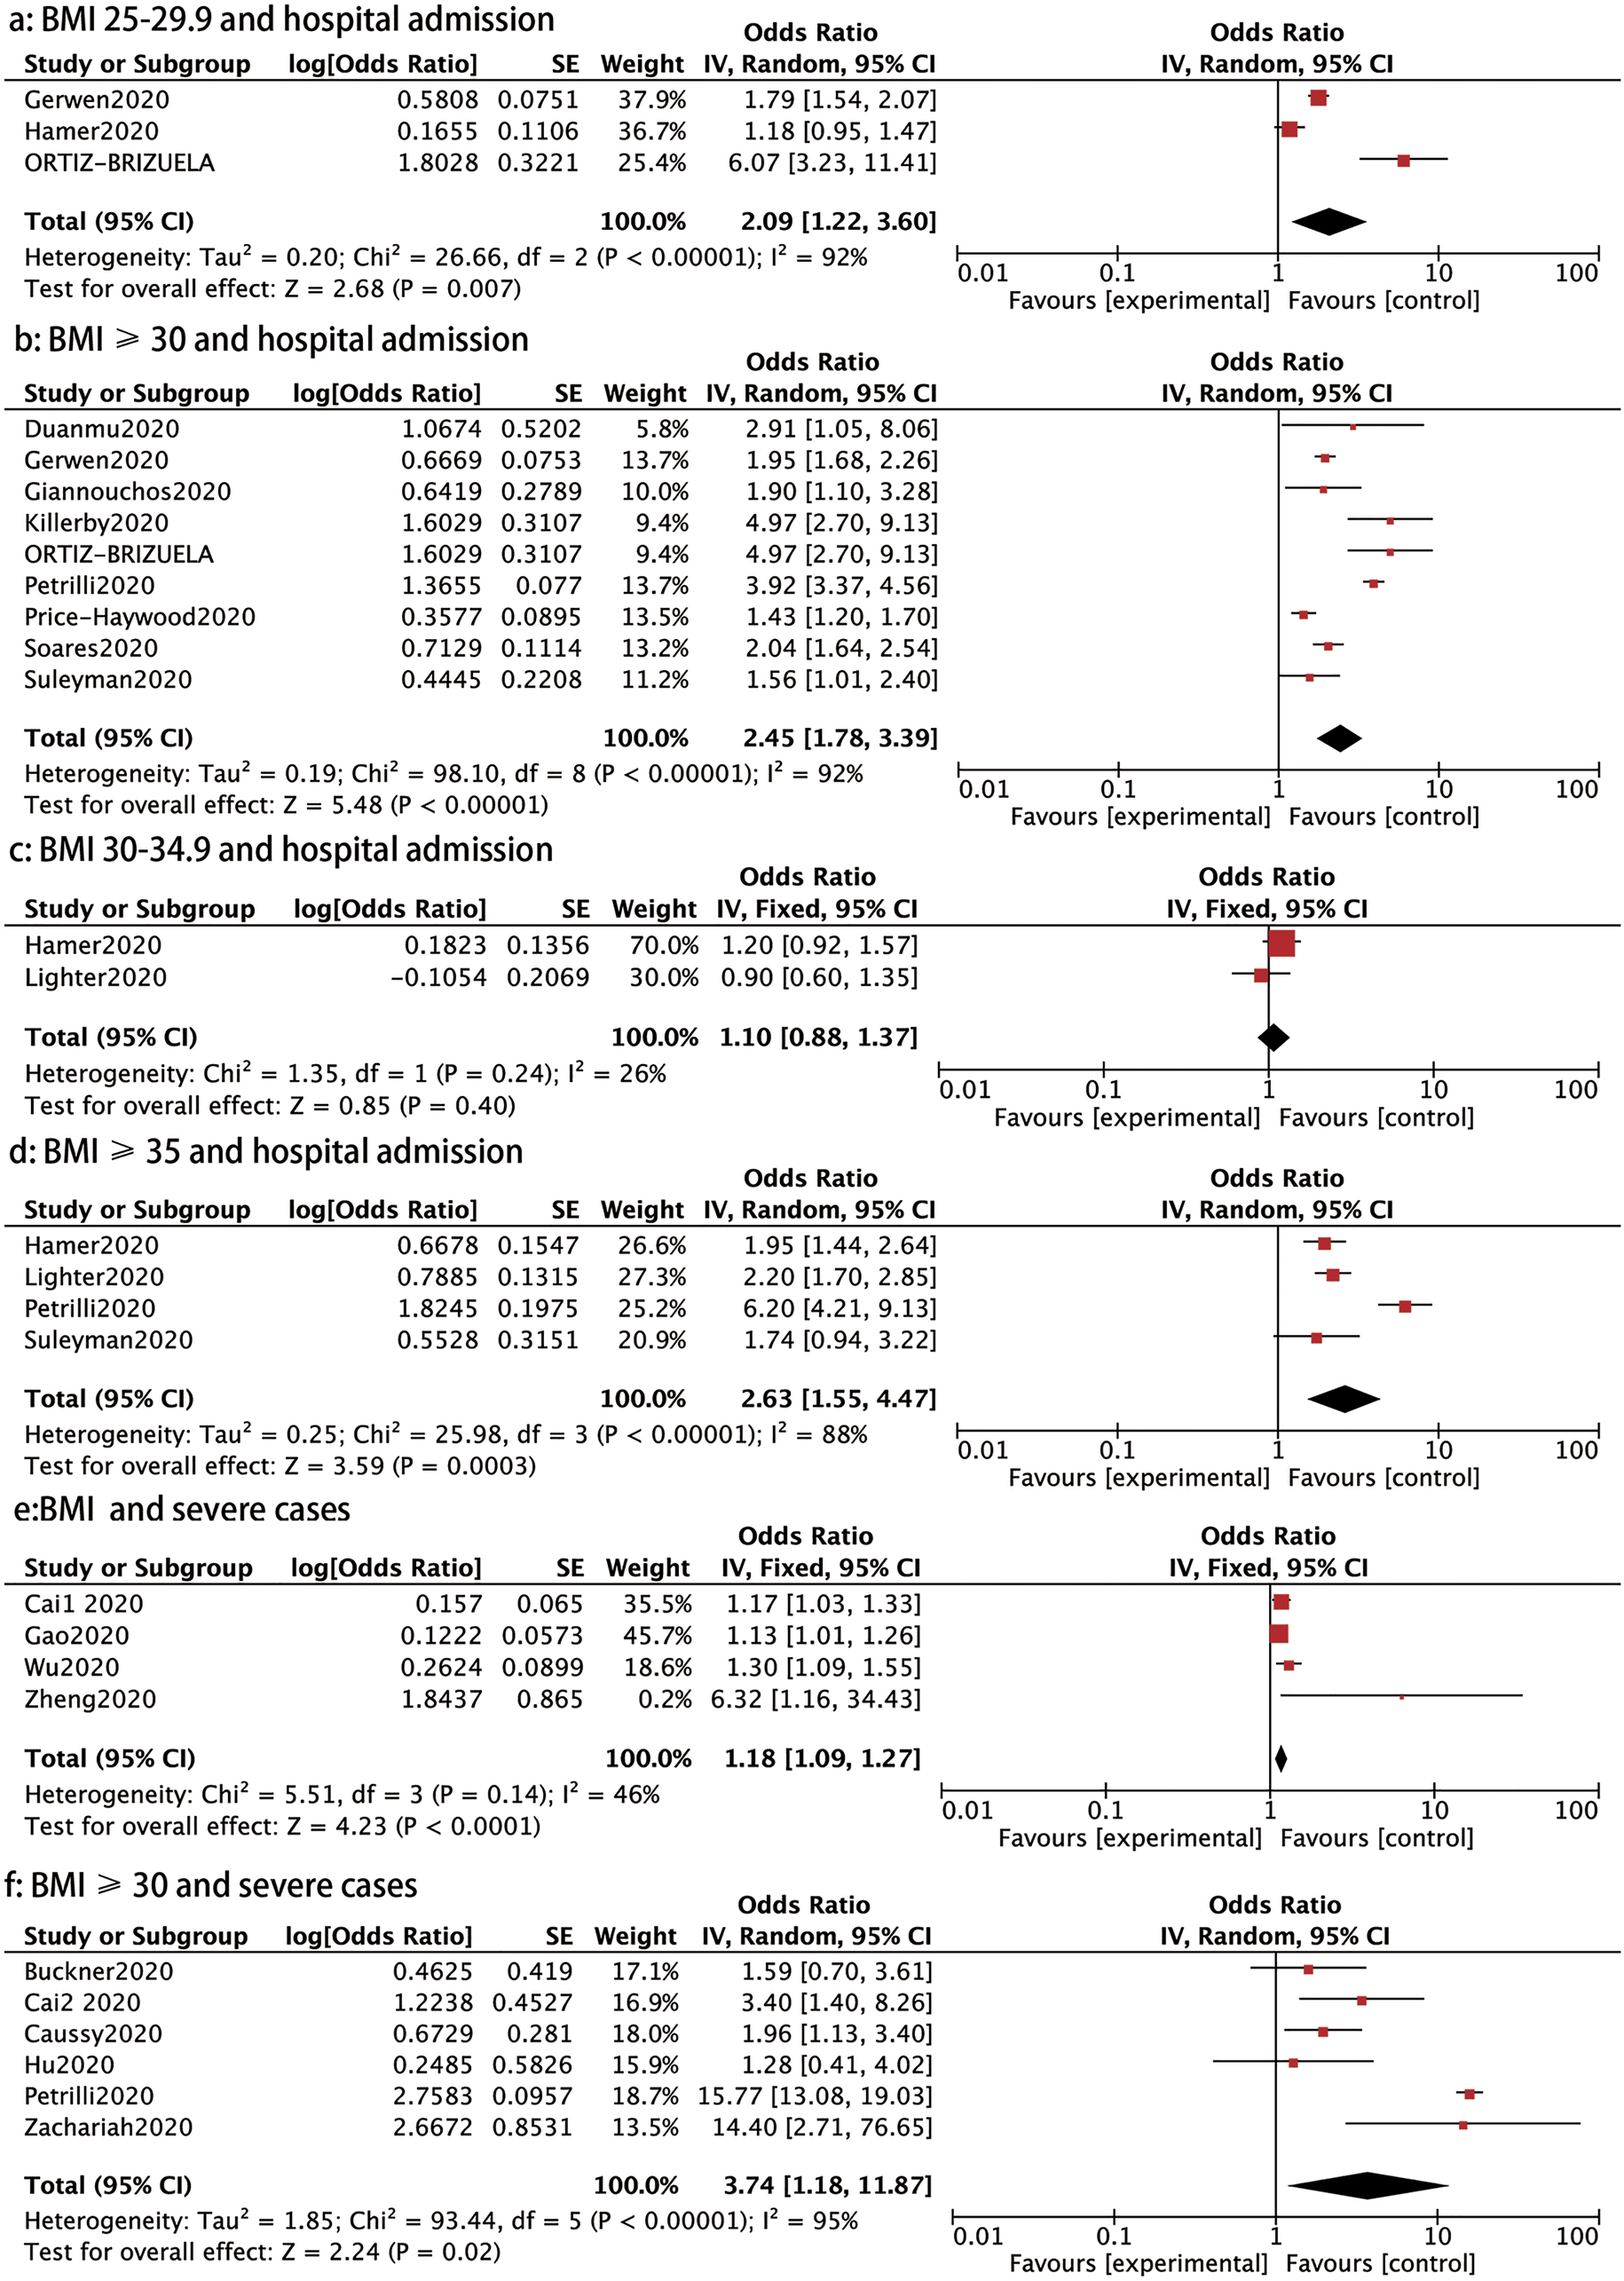
Severe cases: Ten studies reported on the association between BMI and severe cases of COVID-19. Four trials comprising 794 patients showed that those with severe diseases had a higher BMI than those with mild disease (OR: 1.18, 95% CI 1.09–1.27, P < 0.0001) (Fig. 3). In addition, patients with a BMI ⩾ 30 had a higher prevalence of severe cases than those with BMI < 30 (OR: 3.74, 95% CI 1.18–11.87, P: 0.02) (Fig. 3).
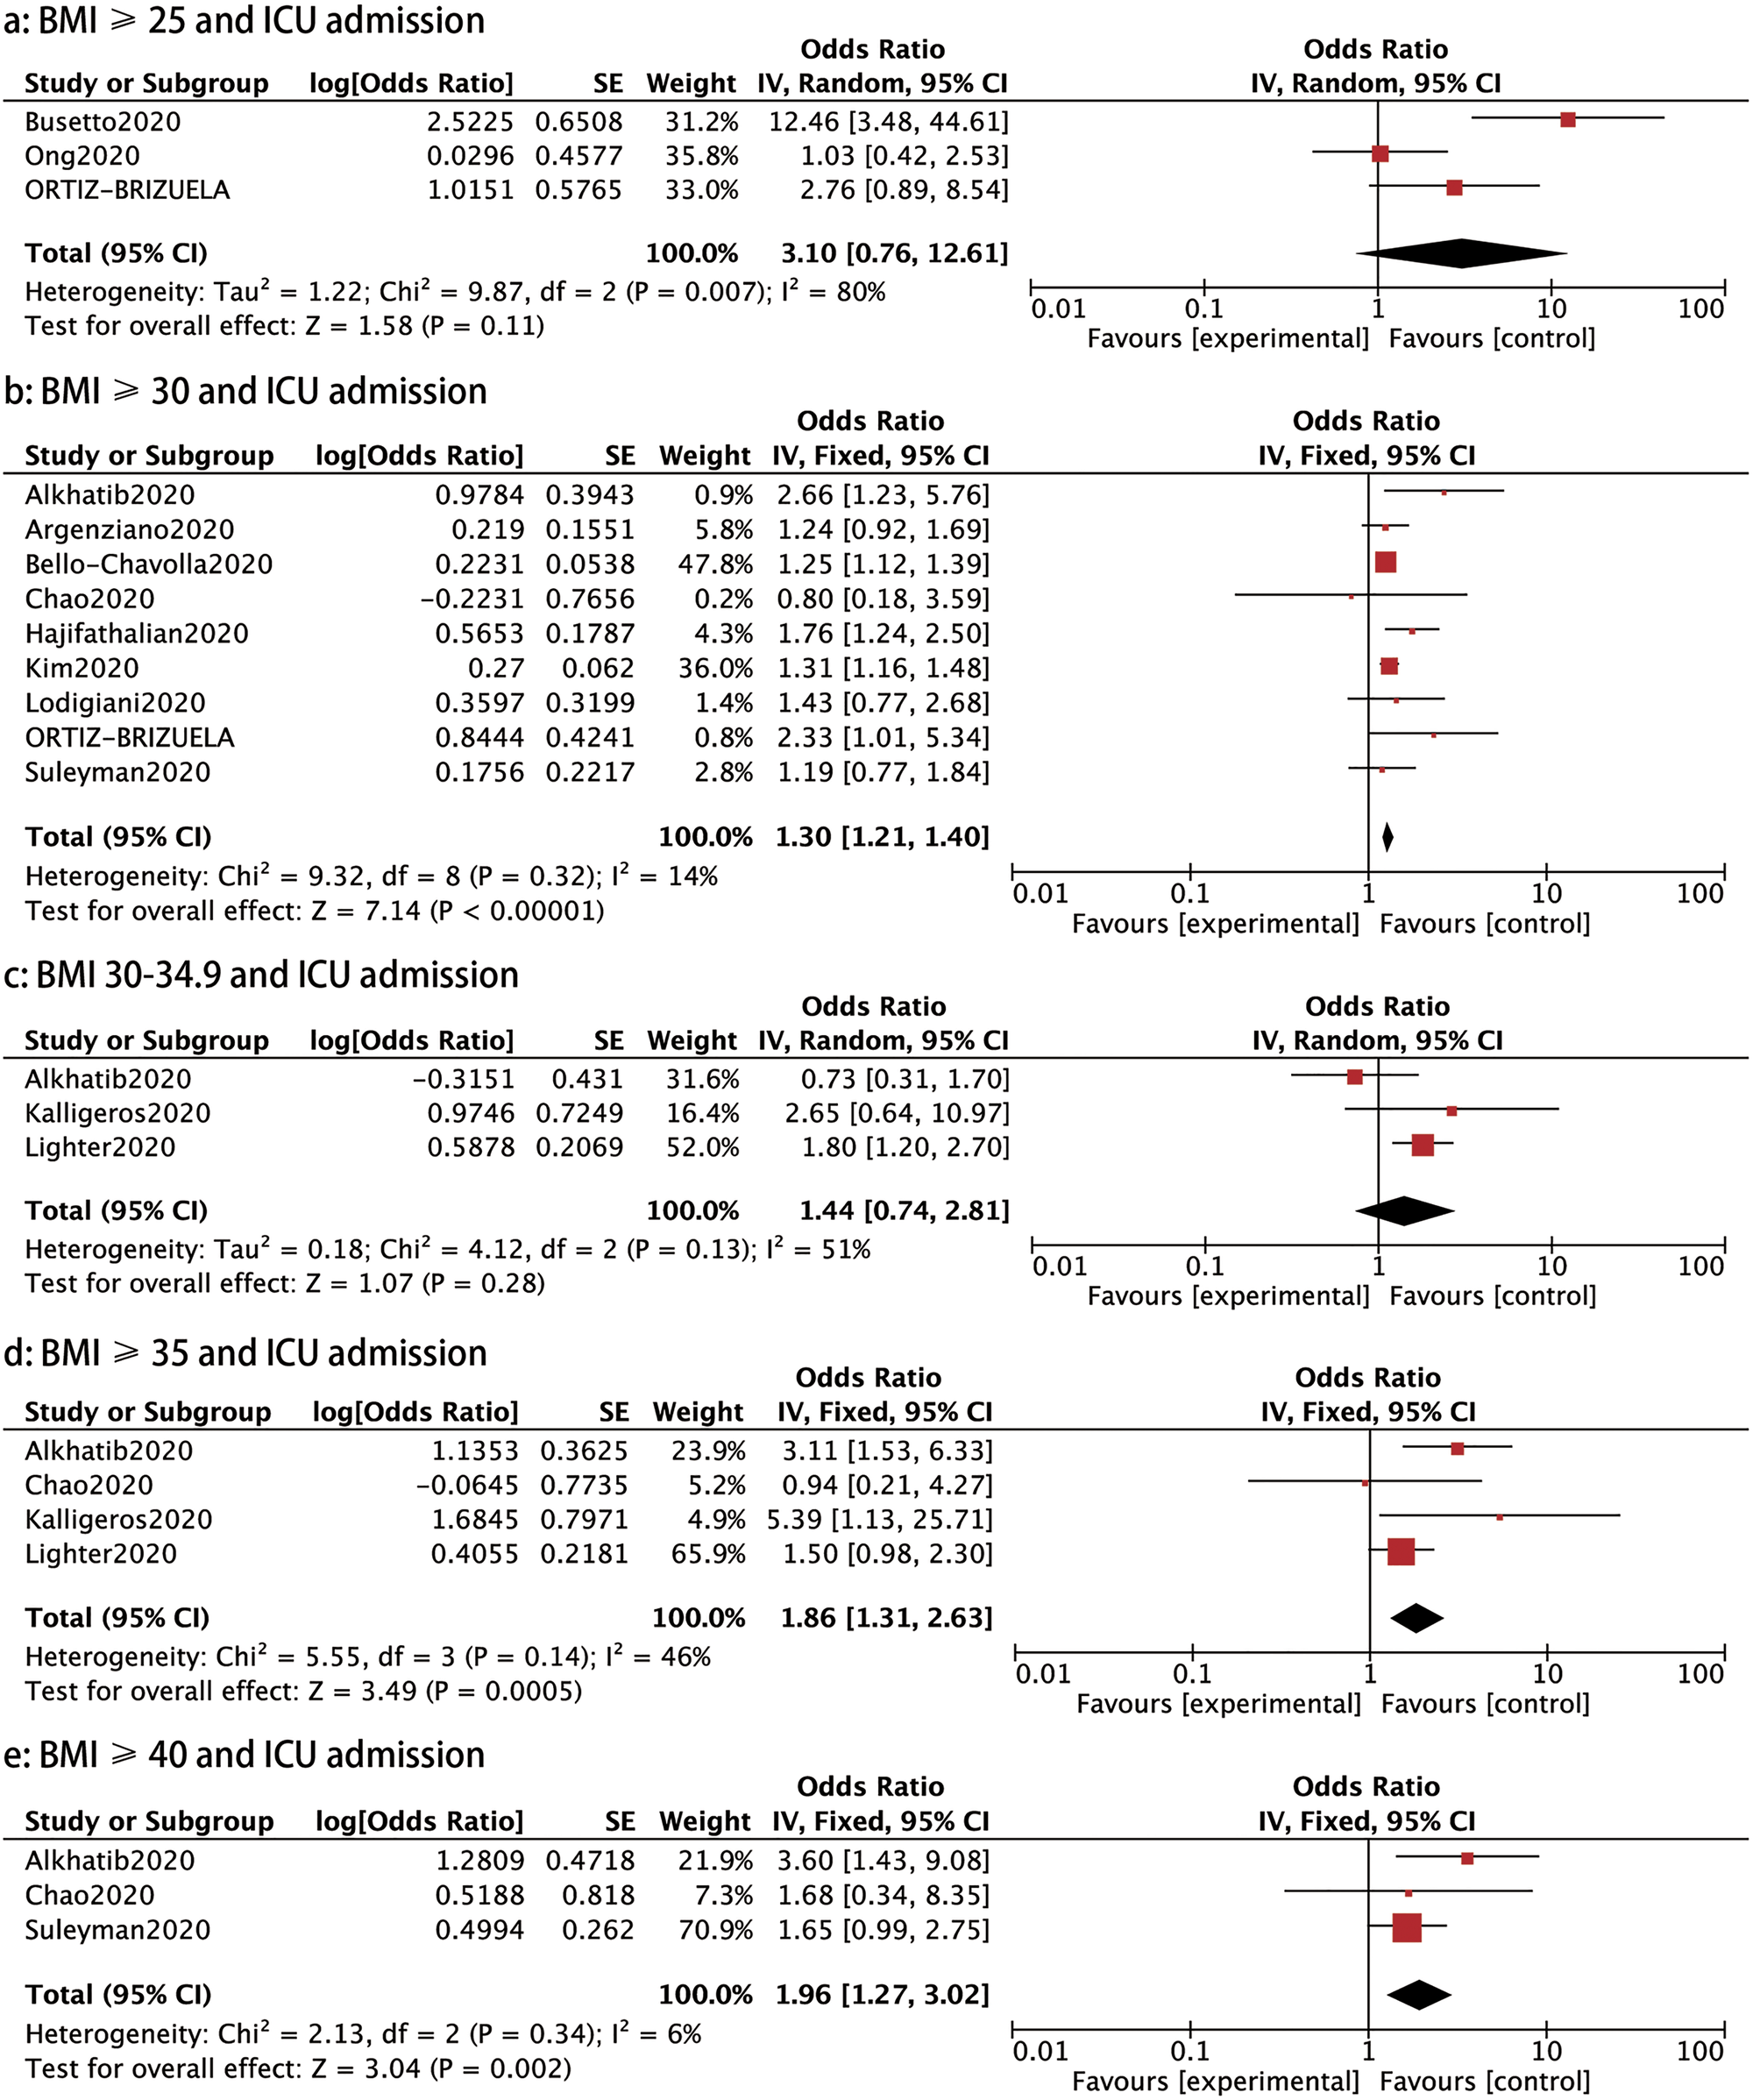
ICU admission: Eleven studies evaluated the incidence of ICU care in COVID-19 patients. A stratified analysis on the association of the different BMI classes and the rate of ICU admission was conducted. Patients with COVID-19 with a BMI ⩾30, BMI ⩾35 and ⩾40 had a higher probability of requiring ICU admission than those with a BMI < 30 (OR: 1.30, 95% CI 1.21–1.40, P < 0.00001; OR: 1.86, 95% CI 1.31–2.63, P: 0.0005 and OR: 1.96, 95% CI 1.27–3.02, P: 0.002, respectively), as shown in Figure 4. However, patients with a BMI ⩾ 25 or BMI 30–34.9 showed no significantly higher rate of ICU admission than those with a BMI < 25 or BMI <30 (OR: 3.10, 95% CI 0.76–12.61, P: 0.11 and OR: 1.44, 95% CI 0.74–2.81, P: 0.28, respectively) (Fig. 4).
Forrest plot showing the severity of COVID-19: (a) BMI⩾25 and ICU admission, (b) BMI⩾30 and ICU admission, (c) BMI 30−34.9 and ICU admission, (d) BMI⩾35 and ICU admission, (e) BMI⩾40 and ICU admission.
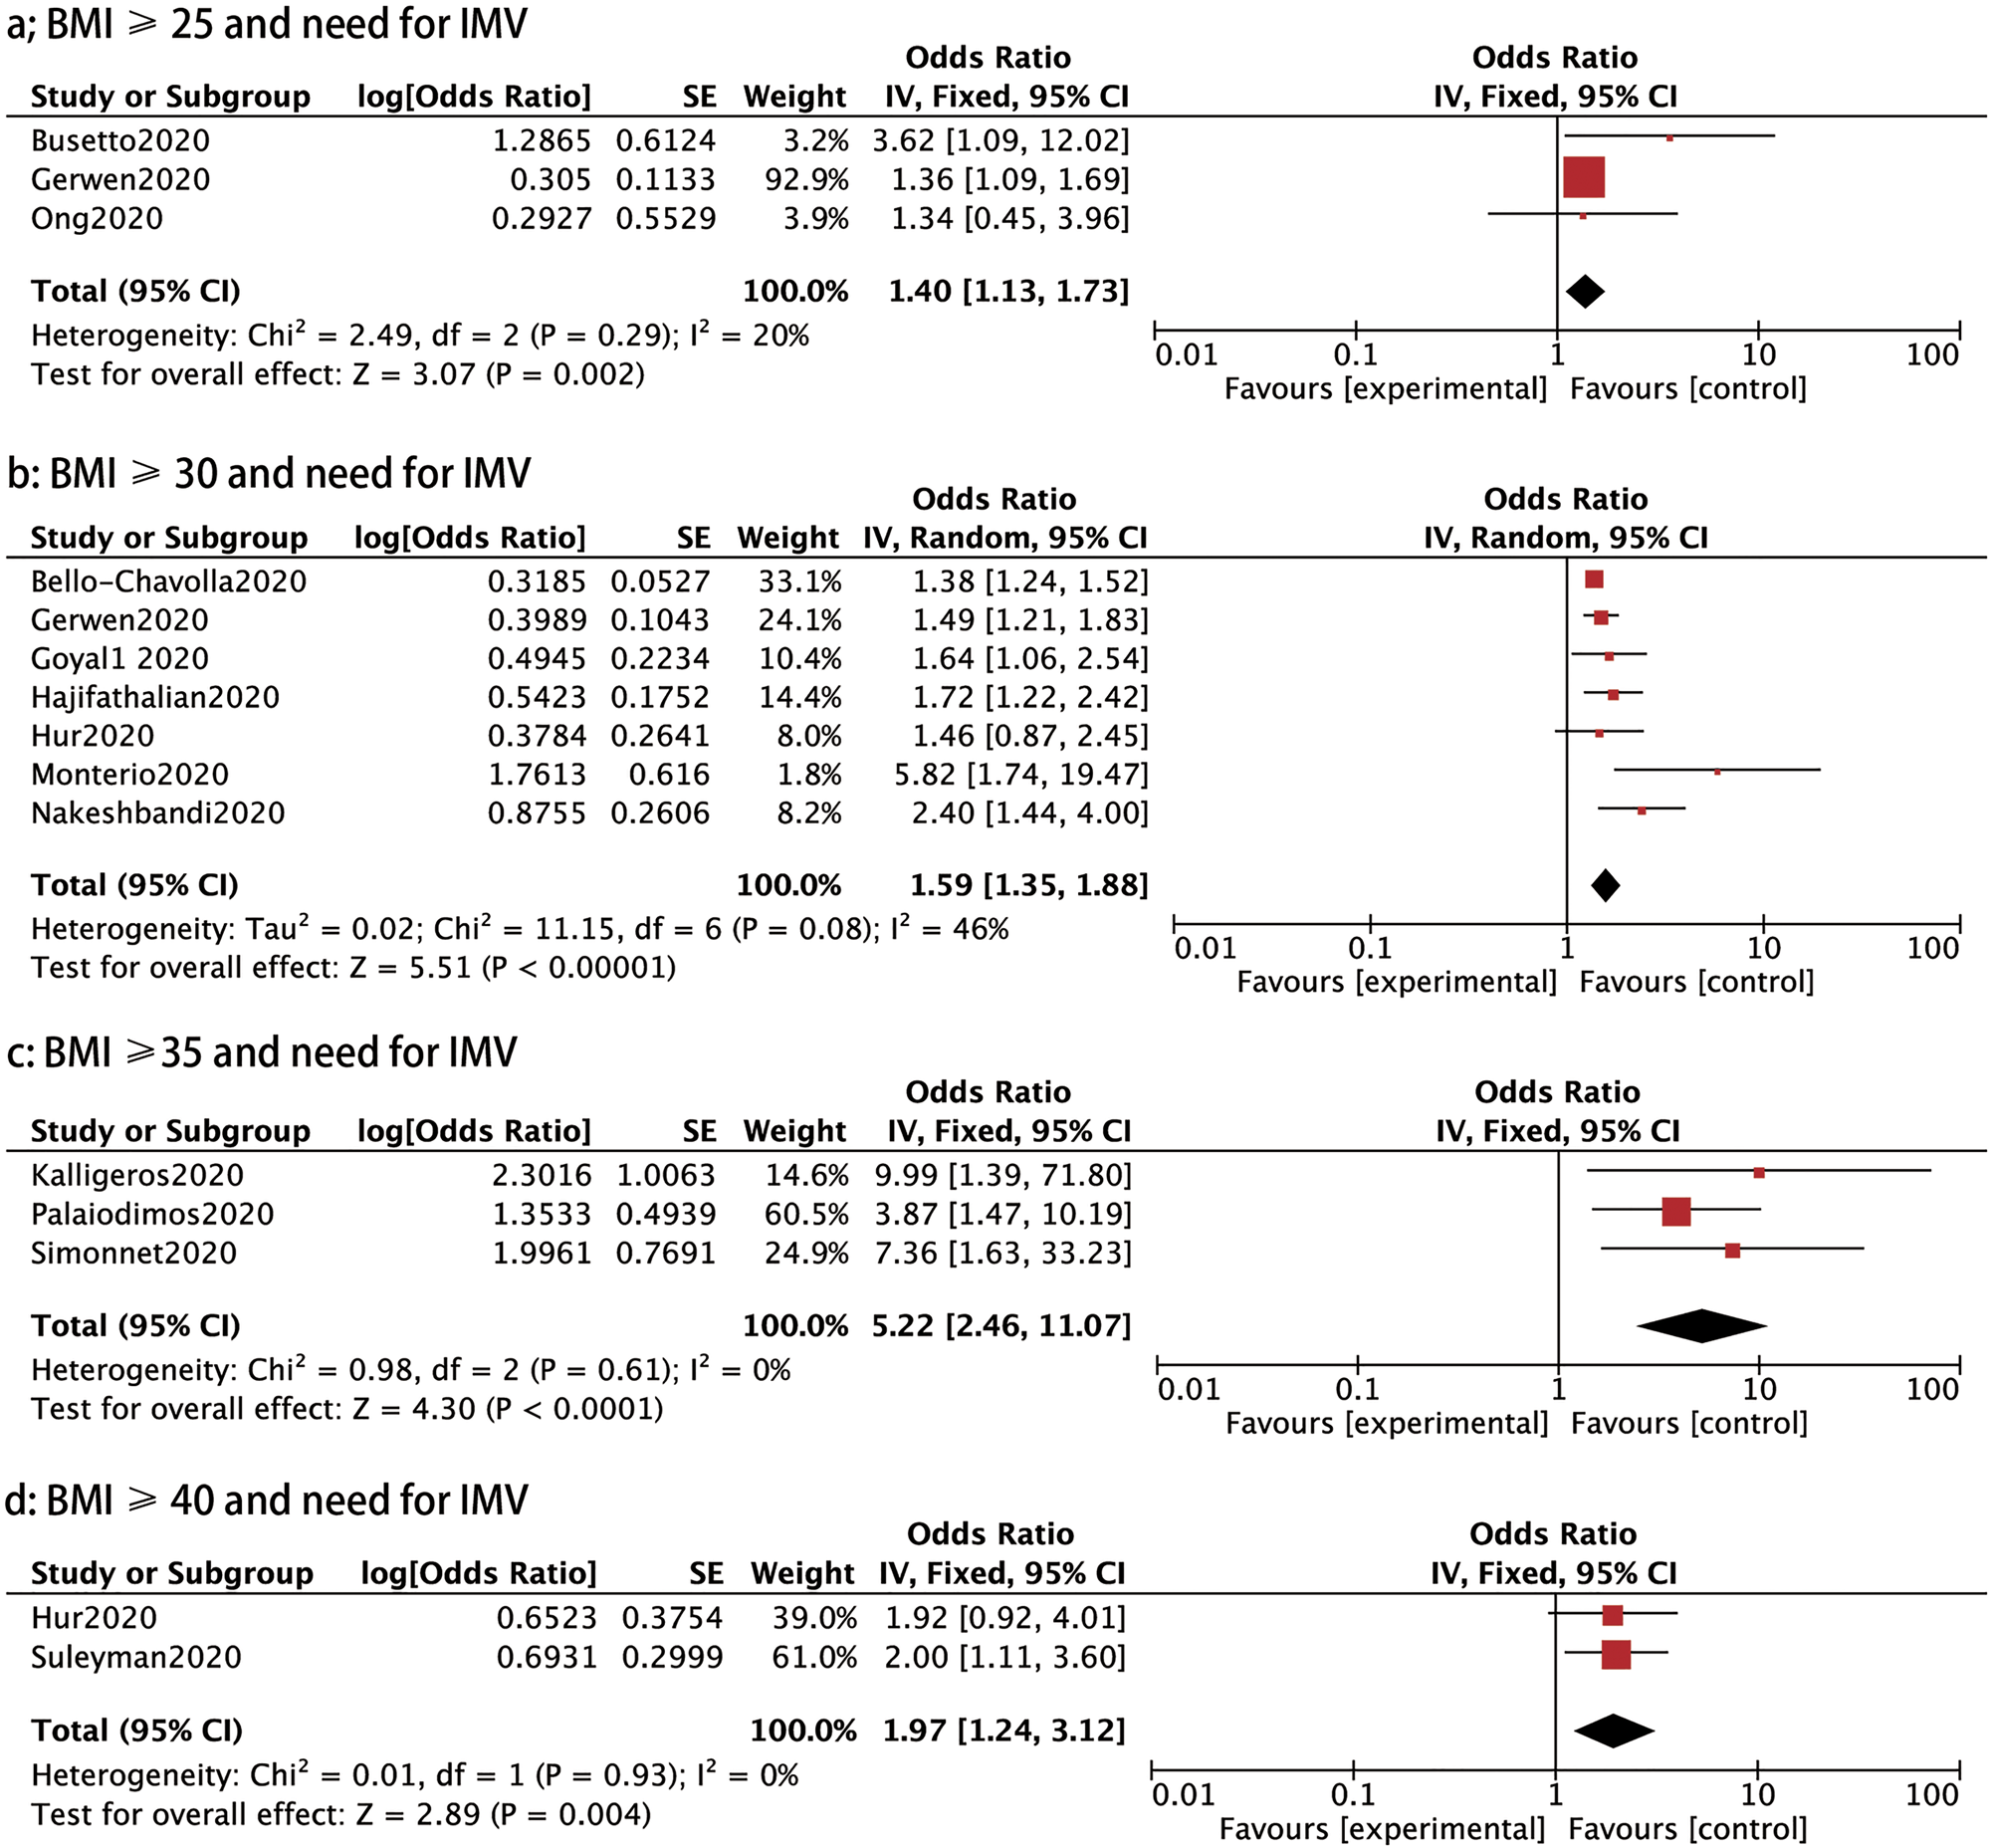
IMV: Thirteen studies assessed the association between BMI and the need for IMV in patients with COVID-19. We compared the requirement of IMV in different BMI groups and found that the need for IMV was notably raised in patients with a BMI ⩾25, BMI ⩾30, BMI ⩾35 and BMI ⩾40 compared to those with a BMI <25 (OR: 1.40, 95% CI 1.13–1.73, P: 0.002; OR: 1.59, 95% CI 1.35–1.88, P < 0.00001; OR: 5.22, 95% CI 2.46–11.07, P < 0.0001 and OR: 1.97, 95% CI 1.24–3.12, P: 0.004, respectively) (Fig. 5).
Forrest plot showing the severity of COVID-19: (a) BMI⩾25 and need for IMV, (b) BMI⩾30 and need for IMV, (c) BMI⩾35 and need for IMV, (d) BMI⩾35 and need for IMV, (e) BMI⩾40 and need for IMV.
Mortality
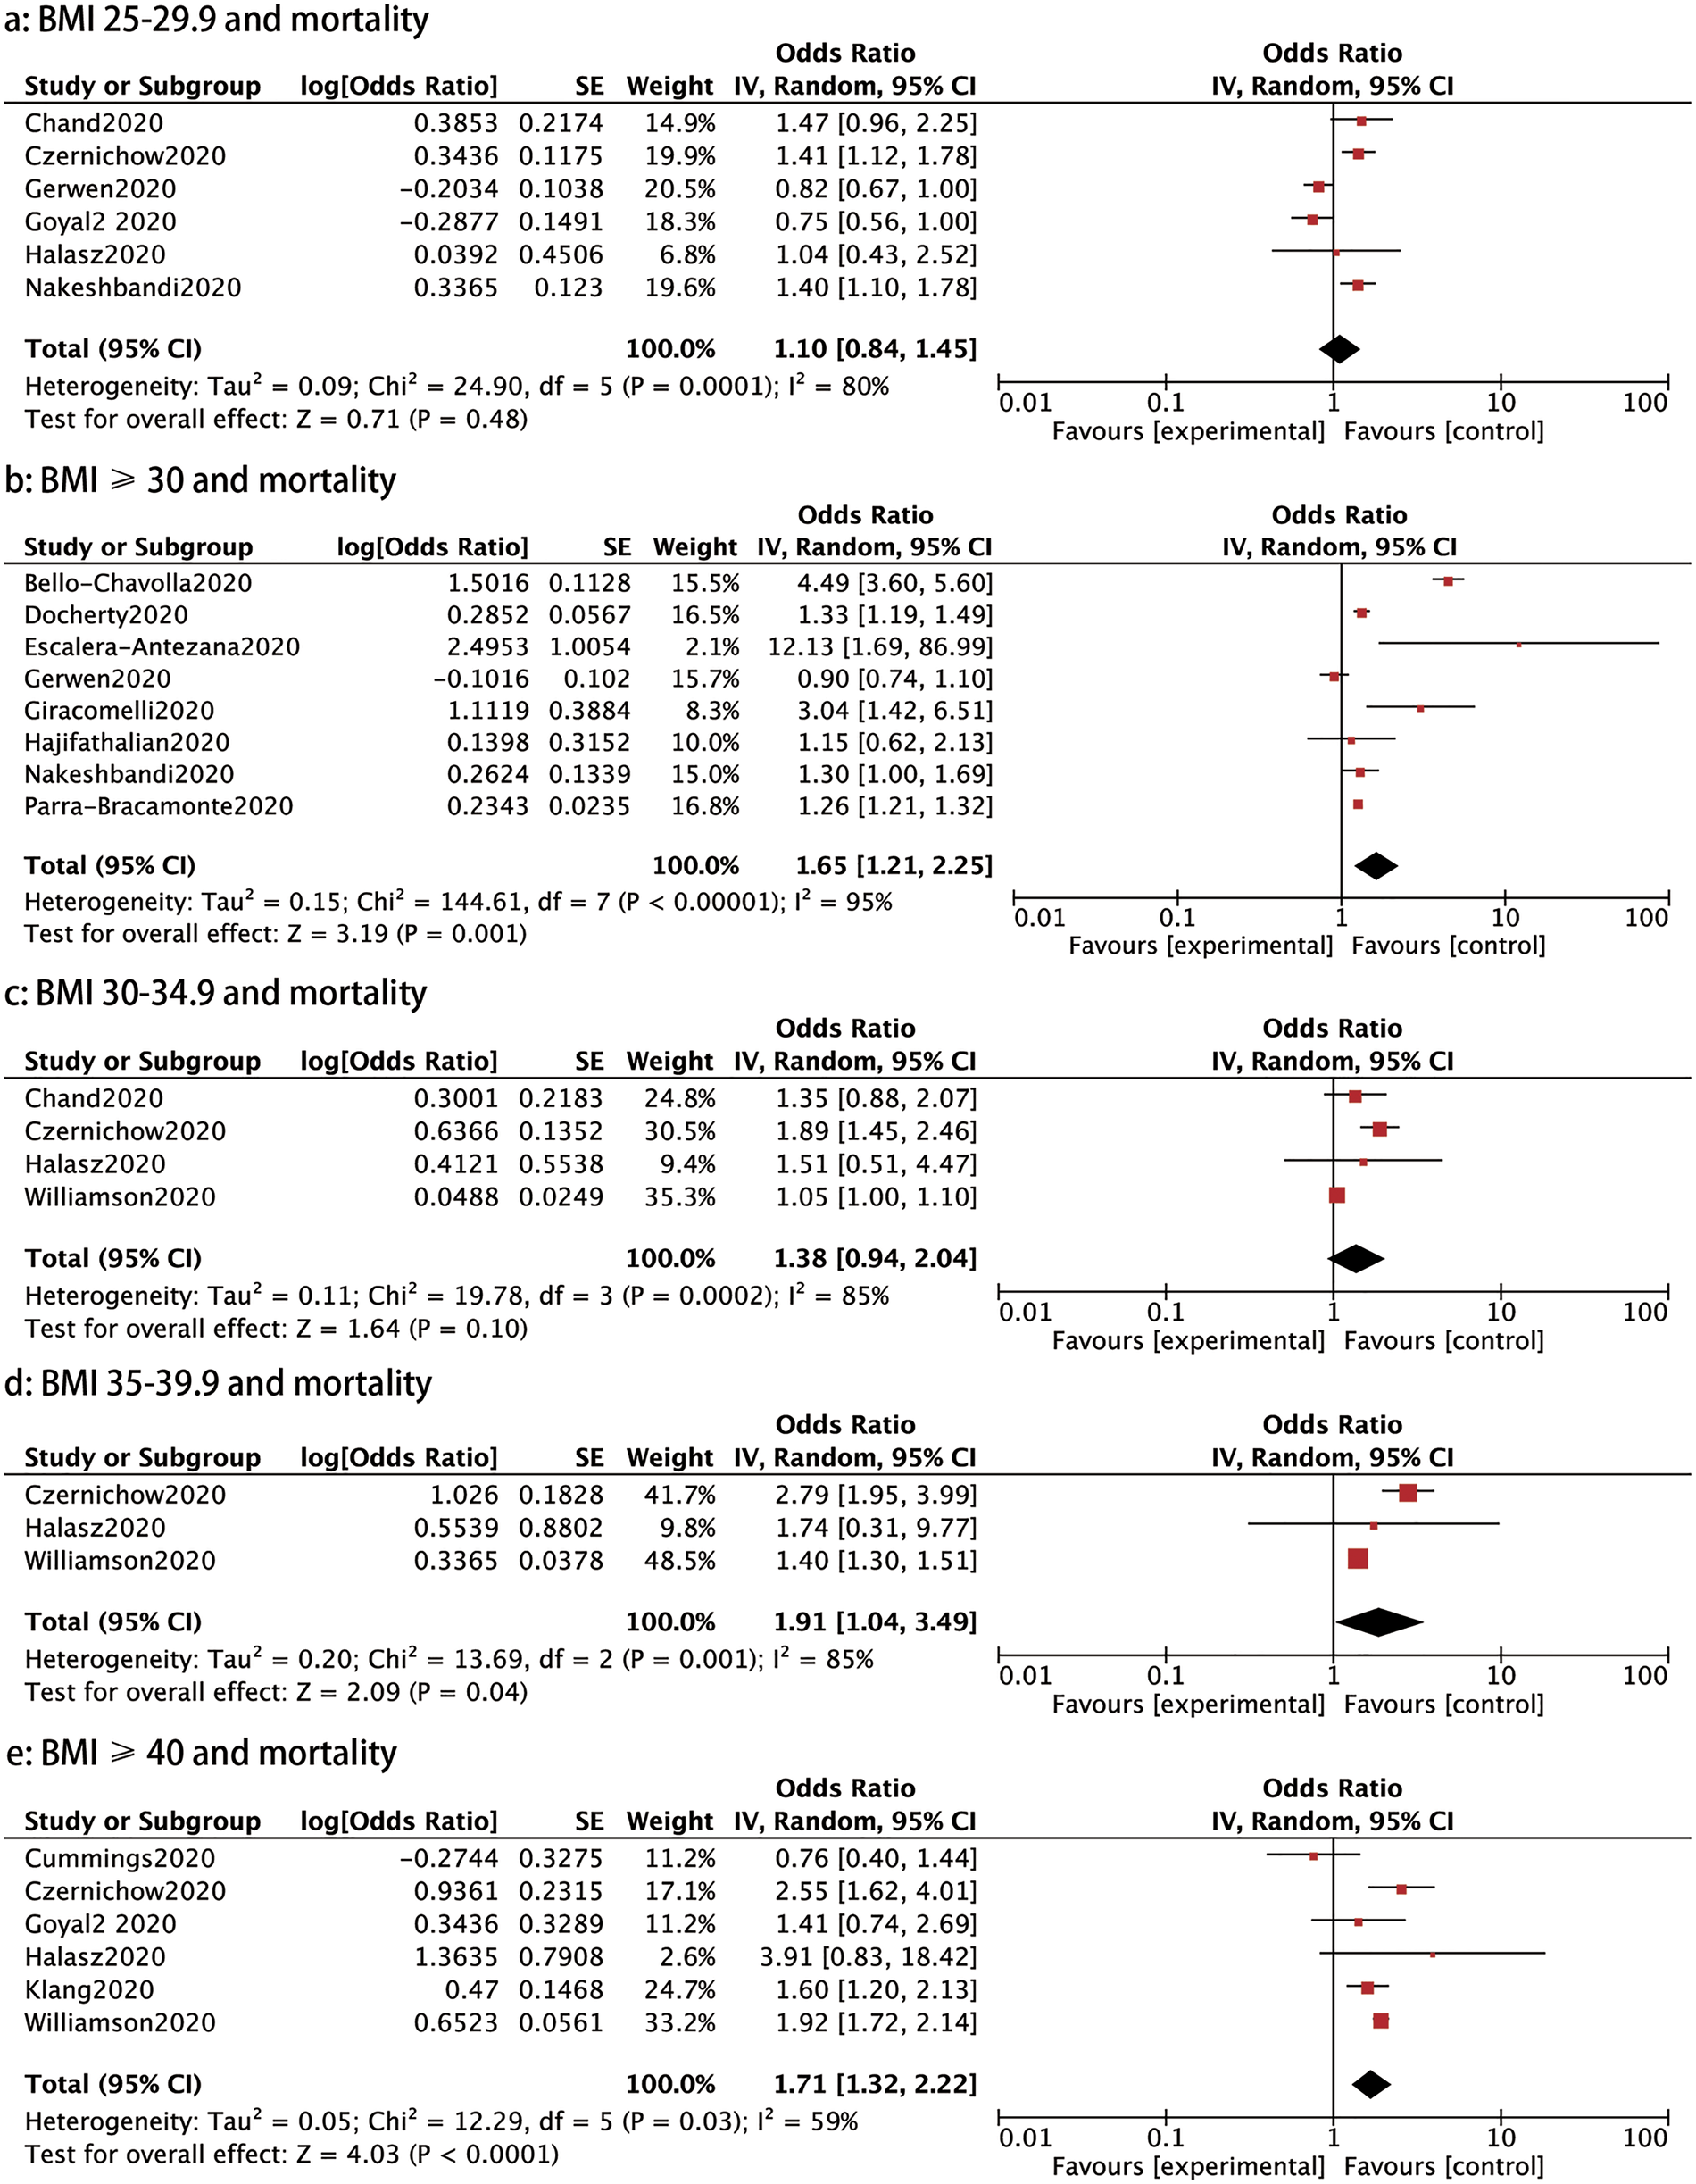
Fourteen studies investigated the association between different BMI categories and mortality. As shown in Figure 6, the mortality was significantly higher in patients with a BMI ⩾30, BMI 35–39.9 and BMI ⩾40 than those with a BMI < 30 (OR: 1.65, 95% CI 1.21–2.25, P: 0.001; OR: 1.91, 95% CI 1.04–3.49, P: 0.04 and OR: 1.71, 95% CI 1.32–2.22, P < 0.0001, respectively). Nevertheless, patients with a BMI between 25 and 29.9 and a BMI between 30 and 34.9 did not have a statistically significant higher risk of mortality than those with a BMI <25 (OR: 1.10, 95% CI 0.84–1.45, P: 0.48 and OR: 1.38, 95% CI 0.94–2.04, P: 0.1) (Fig. 6).
Forrest plot showing mortality caused by COVID-19: (a) BMI 25−29.99 and mortality, (b) BMI⩾30 and mortality, (c) BMI 30−34.9 and mortality, (d) BMI 35−39.9 and mortality, (e) BMI⩾40 and mortality.
Publication bias
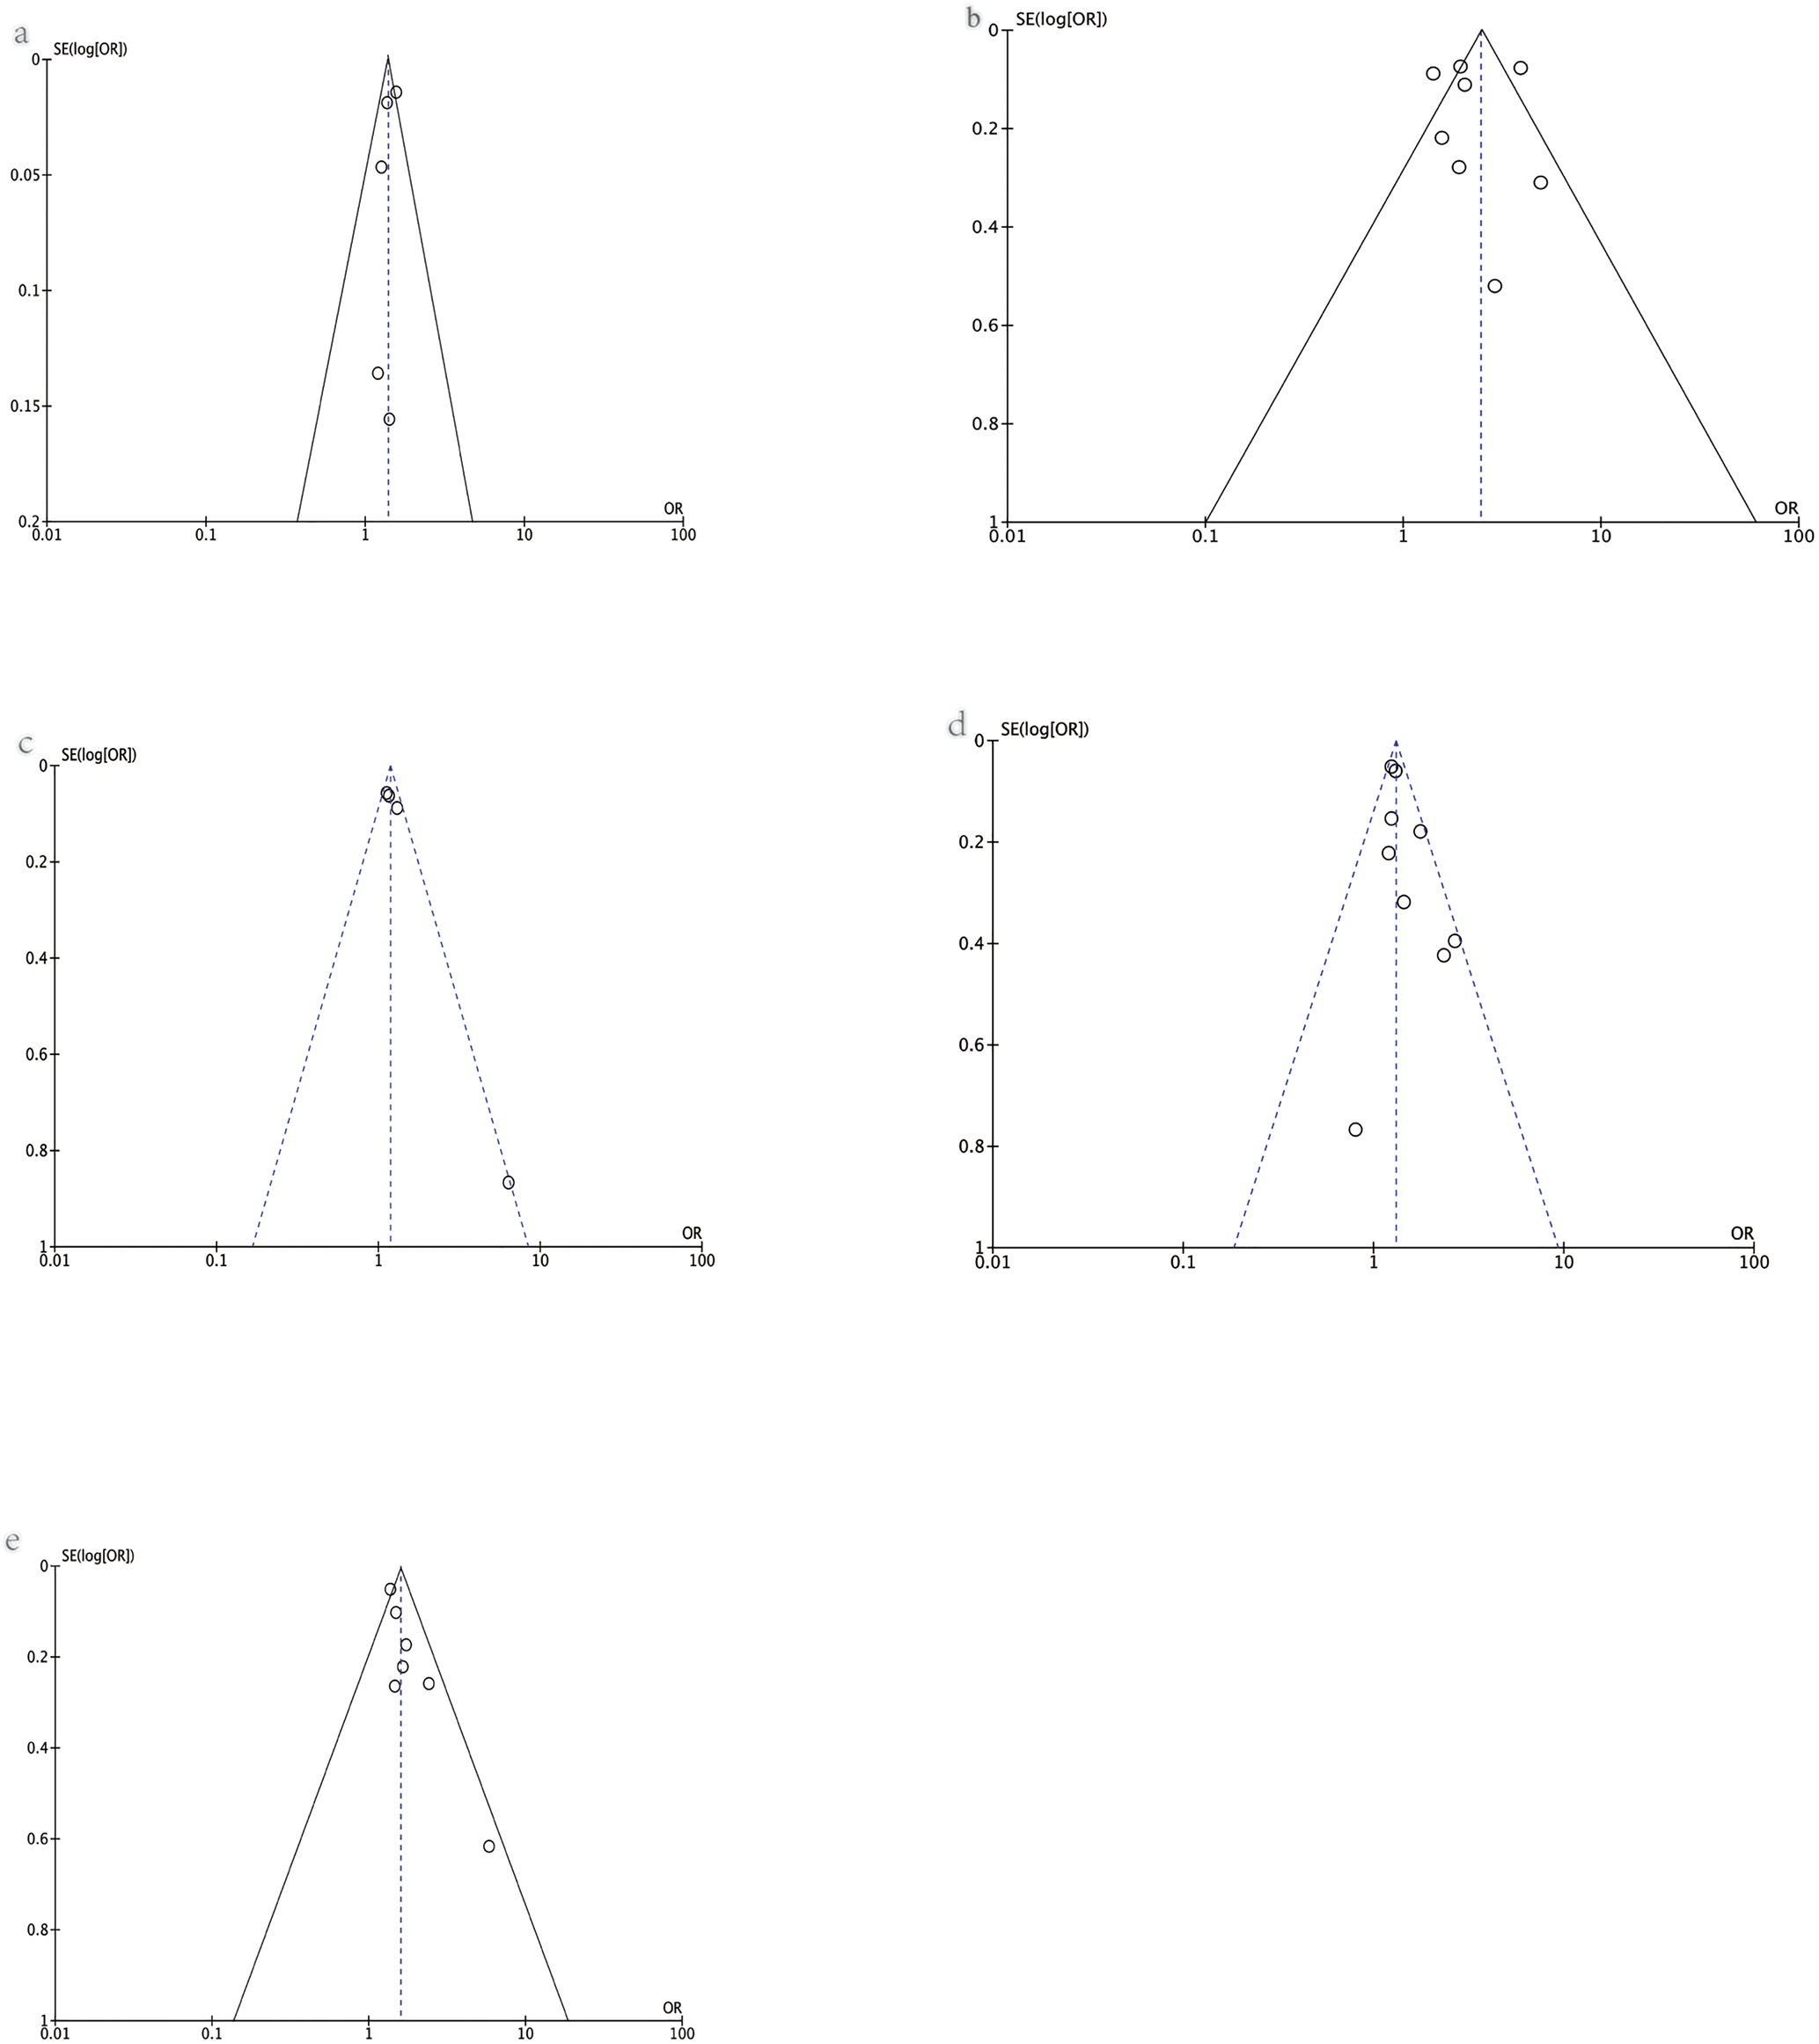
The publication bias was assessed using a visual funnel plot. No obvious publication bias was found for the outcomes assessed ((a) risk of COVID-19; (b) hospital admission; (c) severe cases; (d) ICU admission; (e) need of IMV) as shown in Figure 7.
Funnel plot of various outcomes: (a) risk of COVID-19, (b) hospital admission, (c) severe cases, (d) ICU admission, (e) the need for IMV.
Discussion
Our study found obesity increased the prevalence of SARS-CoV2 infection and the severity of COVID-19 (as assessed by the need for hospitalisation, severe cases, need for ICU admission, need for IMV and mortality). Patients with overweight presented with a higher rate of hospitalisation and higher requirement of IMV. However, a non-linear association between BMI and the severity of COVID-19 was found. To our knowledge, this study is the largest meta-analysis conducted so far to comprehensively explore the association between obesity and COVID-19.
Yates et al. analysed UK biobank data and found that overweight and obese patients were at a higher risk of getting the SARS-CoV-2 in a dose−response manner. Compared to a healthy weight, overweight, obese and severely obese (BMI ⩾35) subjects had a 1.31-, 1.55-, or 1.57-fold higher probability of SARS-CoV-2 positivity [Reference Yates68]. Chadeau-Hyam et al. reported that severe obesity is independently associated with the risk of obtaining COVID-19 with an odds ratio >1.05 by analysing the data from Public Health England [Reference Chadeau-Hyam69]. In our meta-analysis, patients with a BMI ⩾30 had a 1.39 times higher chance of having COVID-19 than those with a healthy weight, which was in line with previous studies.
Obesity was the most prevalent condition in inpatients with COVID-19 aged 18–49 years in a study conducted by Garg et al. [Reference Garg70], which suggests that obesity may increase the hospitalisation rate of patients with COVID-19. A prospective study in New York revealed that an increase in BMI (e.g. BMI >40 with 2.6 odds) in patients with COVID-19 was strongly associated with hospital admission [Reference Petrilli71]. In our meta-analysis, the odds ratios for hospitalisation rate were 2.09, 2.45 and 2.63 for patients with a BMI of 25–29.9, ⩾30 and ⩾35, respectively. This suggests that a higher BMI predicts a higher hospitalisation rate for patients with COVID-19. However, no significant association between patients with a BMI 30–34.9 and hospital admission was found, which may be attributed to the limited number of eligible studies reporting on this BMI group.
A study conducted in China reported that there were no patients with underweight who developed severe COVID-19, and that obese patients progressed to severe cases (39% in the obese group, 29.3% in the overweight group and 19.2% in the healthy weight group) [Reference Cai23]. An observational study revealed that severely ill patients had a higher BMI (mean, 24.78 vs. 23.20) than patients with non-severe disease [Reference Chen72]. This indicated that a higher BMI increased the chance of COVID-19 severity. Here, we found that BMI was a major influential factor for COVID-19 progression to severity (OR: 1.18). In addition, obese patients were 3.74 times more likely to get severe COVID-19 than those with BMI < 30. These data together indicate that obesity or a high BMI increases the chance of severe cases.
A large international multicentre study showed that the mean BMI of critically ill patients was 28.1, and the overall prevalence of obesity was 37.5% [Reference Chetboun73]. Cai et al. also reported that patients with a BMI ⩾ 24 (OR = 1.258, P = 0.005) were more likely to be admitted to the ICU [Reference Cai74]. However, we failed to find a positive association between overweight and the risk of ICU admission. However, patients with BMI ⩾30 and BMI ⩾35 showed a 1.30- and 1.86-fold odds of requiring ICU admission compared to those with a BMI <30. Therefore, there might be a positive correlation between the severity of obesity and the risk of ICU admission. Surprisingly, patients with BMI 30–34.9 presented no significant risk of ICU admission compared to those with BMI < 30, which should be confirmed in future studies.
Simonnet et al. reported data from the Lille University centre, showing that severe obesity (BMI ⩾35) was associated with a higher requirement for mechanical ventilation compared to patients with a healthy weight (81.8% vs. 41.9%) [Reference Simonnet60]. In Singapore, Ong et al. found that a BMI ⩾25 was significantly associated with mechanical ventilation (OR 1.16) [Reference Ong53]. Moreover, Chetboun et al. reported that the relationship between BMI and the risk of the need for IMV was linear, and the odds were 3.06-fold higher in patients with a BMI ⩾40 [Reference Chetboun73]. In our meta-analysis, the odds of IMV risk in patients with BMI ⩾25 and BMI ⩾30 were 1.40 and 1.59 times higher than those with BMI < 25 and BMI <30. For severely obese patients (BMI ⩾35) diagnosed with COVID-19, the odds of requiring IMV were 5.22. However, for morbidly obese patients (BMI ⩾40), the odds were 1.97. It appears that no significant linear relationship exists between higher BMI and the requirement of IMV, which is in contrast to previous studies [Reference Chetboun73].
A retrospective analysis of 112 patients with COVID-19 showed that 88.2% of non-survivors had a BMI ⩾25 compared to 18.8% of survivors [Reference Peng75]. Asare et al. showed that 733 of 1930 deaths from COVID-19 were contributed to obesity alone in patients without reported comorbid conditions such as hypertension and cardiovascular disease [Reference Asare76]. On the contrary, no difference in the mortality rates was found between those with obesity and the non-obesity arm [Reference Moriconi77]. In the study, patients with a BMI between 25 and 29.9 had no significant higher risk of mortality compared to those with a BMI <25. However, the odds ratio of mortality in patients with COVID-19 with a BMI ⩾30, BMI 35–39.9 and BMI ⩾40 were 1.65, 1.91 and 1.71, respectively. This suggests a positive relationship between obesity and mortality in patients with COVID-19. Surprisingly, patients with a BMI between 30 and 34.9 did not have a higher mortality risk.
The mechanism behind the finding that overweight or obesity may aggravate COVID-19 remains to be elucidated. Possible mechanisms have been presented in previous studies. Zieglet et al. reported that angiotensin-converting enzyme 2 (ACE2) facilitates cellular entry of SARS-CoV-2 [Reference Ziegler78]. Higher concentrations of ACE2 are not only expressed on lung tissues [Reference Zou79, Reference Verdecchia80], such as bronchial smooth muscle cells and alveolar epithelium, but also on extrapulmonary tissues, specifically the heart, kidney, ileum, jejunum and adipose tissues [Reference Zou79, Reference Hamming81]. The ACE2 gene-expression profile was assessed in the HCCDB gene-expression database, demonstrating that ACE2 gene expression was higher in human subcutaneous and visceral adipose tissue than in human lung tissue [Reference Al-Benna82], indicating excess adiposity may induce higher susceptibility of SARS-CoV-2 infection and higher infection severity in patients with COVID-19. Moreover, studies show that obesity disrupts the immune system, limiting its capacity to deal with a new virus like SARS-CoV-2 [Reference Milner83]. In severe cases, patients may have a cytokine storm, characterised by the overproduction of IL-6, TNF-α, monocyte chemoattractant protein-1 and leptin, resulting in an increased risk of vascular hyperpermeability and multiorgan failure [Reference Jose84, Reference van der Voort85]. Besides, respiratory physiology is altered in patients with obesity, resulting in decreased functional residual capacity and expiratory reserve volume, leading to subsequent ventilation−perfusion abnormalities and hypoxaemia [Reference Bahammam AS86, Reference Zammit87]. In addition, obesity has been associated with a high risk of developing venous thromboembolism [Reference Lorenzet88], which is frequently reported in COVID-19 cases and is correlated with a poor prognosis [Reference Kyriakoulis89].
There are some limitations of this study that should be noted. First, most studies included here were retrospective and were conducted in the USA. Additional prospective studies from other countries should be performed to validate the results presented here. Second, patients suffering from a SARS-CoV2 infection with BMI 30–34.9 presented no significant differences in hospitalisation rates, the need for ICU admission, or mortality compared with those without obesity. This might be attributed to the few eligible studies for this group of patients, and further studies are required to confirm these data. Third, we may have excluded some studies from this meta-analysis that reported outcomes related to obesity without mentioning the terms (obesity or overweight or body mass index). Last, experimental parameters such as c-reactive protein, interleukin-6, and coagulation index were not evaluated in this study.
In conclusion, obesity might increase the risk of SARS-Cov2 infection and aggravate the severity of COVID-19.
Conflict of interest
None declared.
Data availability statement
The data that support the findings of this study are openly available in at http://doi.org/10.1017/S0950268820003027.


 Open access