

Introduction
It is apparent that the world’s biodiversity has diminished more rapidly in the last five decades than at any other time in human history (Millennium Ecosystem Assessment 2005). By 2002, this crisis compelled the world’s leaders at the World Summit on Sustainable Development to commit (through the Convention on Biological Diversity [CBD]) ‘to achieve, by 2010, a significant reduction of the current rate of biodiversity loss at the global, regional and national levels as a contribution to poverty alleviation and to the benefit of all life on earth’. In response to the ‘2010 target’, considerable effort has been directed at developing suites of indicators to track trends in the rate of biodiversity loss (Green et al. Reference Green, Balmford, Crane, Mace, Reynolds and Turner2005, Mace Reference Mace2005, Pereira and Cooper Reference Pereira and Cooper2006, Mace and Baillie Reference Mace and Baillie2007). Of greatest influence has been the set of indicators adopted by the CBD at its seventh Conference of Parties in 2004 (Decision VII/30). This included indicators in seven focal areas: status and trends of the components of biological diversity, sustainable use, threats to biodiversity, ecosystem goods and services, traditional knowledge, access and benefits sharing, and resource transfers.
The first of these focal areas included the indicator ‘coverage of protected areas’, in recognition of the fact that conserving biodiversity through a site-based approach is one of the key components of any strategy to reduce biodiversity loss (Boyd et al. Reference Boyd, Brooks, Butchart, Edgar, da Fonseca, Hawkins, Hoffmann, Sechrest, Stuart and van Dijk2008). However, governments designate protected areas for a variety of reasons, and protected area networks may not be effectively targeted at the most important sites for biodiversity.
Important Bird Areas (IBAs), on the other hand, are designated specifically for the biodiversity they contain, in particular for the bird species and populations they support. They are identified using a set of objective, globally-standardised criteria, based on the presence of species of global conservation concern, assemblages of restricted-range and biome-restricted species, and large concentrations of congregatory species (Grimmett and Jones Reference Grimmett and Jones1989, Fishpool et al. Reference Fishpool, Heath, Waliczky, Wege and Crosby1998, Bennun and Fishpool Reference Bennun and Fishpool2000, Heath and Evans Reference Heath and Evans2000). IBAs are also effective at capturing other terrestrial biodiversity (e.g. Brooks et al. Reference Brooks, Balmford, Burgess, Hansen, Moore, Rahbek, Williams, Bennun, Byaruhanga, Kasoma, Njoroge, Pomeroy and Wondafrash2001, Pain et al. Reference Pain, Fishpool, Byaruhanga, Arinaitwe and Balmford2005) and often form the starting point for subsequent incorporation of data on other biodiversity to identity ‘Key Biodiversity Areas’ (Eken et al. Reference Eken, Bennun, Brooks, Darwall, Fishpool, Foster, Knox, Langhammer, Matiku, Radford, Salaman, Sechrest, Smith, Spector and Tordoff2004, Langhammer et al. Reference Langhammer, Bakarr, Bennun, Brooks, Clay, Darwall, De Silva, Edgar, Eken, Fishpool, da Fonseca, Foster, Knox, Matiku, Radford, Rodrigues, Salaman, Sechrest and Tordoff2007). Wherever possible, IBAs are identified and documented at the national level through a multi-stakeholder process. IBA identification and documentation have been completed across much of the world, and to date over 10,000 IBAs of global significance have been identified in 204 countries or territories (BirdLife International 2008; see http://www.birdlife.org/datazone/sites/index.html for more details). IBA identification is the first step in a process that leads to conservation planning, action, advocacy, capacity-building and monitoring.
In recent years, BirdLife International has developed, trialled and begun implementing a programme of IBA monitoring (Bennun et al. Reference Bennun, Matiku, Mulwa, Mwangi and Buckley2005). This is designed to be simple, sustainable and cost-effective, and to maximise local participation and institutional engagement. A simple methodology is used to assign scores (0–3) for the condition of IBAs (‘state’), the threats they face (‘pressure’) and the conservation action being taken (‘response’) (BirdLife International 2006a). Data derived from this monitoring are vital for local and national management and for assessing progress in reducing or even reversing the loss of biodiversity, as they provide measures for a global network of priority sites for biodiversity. In this paper, we provide the first examples of indicators derived from IBA monitoring, using Kenya as a case study.
Methods
Data sources for Kenyan IBAs
Data for this analysis were derived from Bennun and Njoroge (Reference Bennun and Njoroge1999), Otieno et al. (Reference Otieno, Ng’weno, Matiku, Mwangi, Bennun, Musila, Mulwa and Kiragu2005) and Musila et al. (Reference Musila, Ng’weno, Matiku, Mwema, Kanyanya, Mulwa, Musina, Buckley and Njehia2006), and cover 36 of the national total of 60 IBAs (i.e. those for which there were data in all three years). The latter two sources give details of changes at sites in each of state, pressure and response, and assign scores for these, using a methodology developed and tested by BirdLife International and its partner organisation in Kenya (NatureKenya) to monitor IBAs (see below). The raw data were collected using a simple and robust system grounded in national and local institutions with field staff and community groups at IBAs. Monitors based at, near, or visiting an IBA filled in a form providing information on the site. The form was then submitted to the National IBA Monitoring Coordinator. More than one form was submitted for some sites, by different people or at different times. The coordinator verified and assessed the submitted forms for consistency and then collated them, along with any other relevant information on the status of particular sites, including from satellite images, scientific and popular publications, official journals and gazettes, and the results of any other monitoring that may have been undertaken (e.g. for the International Waterfowl Census). Finally, the coordinator applied the standardised methodology to the available information, and, in consultation with other experts, assigned scores for state, pressure and response for each site.
As the global methodology for IBA monitoring evolved during the period 1999–2005, the scores published in Otieno et al. (Reference Otieno, Ng’weno, Matiku, Mwangi, Bennun, Musila, Mulwa and Kiragu2005) and Musila et al. (Reference Musila, Ng’weno, Matiku, Mwema, Kanyanya, Mulwa, Musina, Buckley and Njehia2006) could not be used directly to calculate IBA indices. Therefore, the information presented in the two reports and in the site accounts published in Bennun and Njoroge (Reference Bennun and Njoroge1999) were used to determine retrospectively standardised scores.
The 36 IBAs evaluated cover a broad range of habitats, including coastal and Eastern Arc forest (six IBAs), highland forest (five), moist evergreen forest (two), highland grassland (four), savannah grassland (seven), moist grassland (one), wetland (eight), papyrus swamp (two) and montane shrubland (one) (Bennun and Njoroge Reference Bennun and Njoroge1999, Fishpool and Evans Reference Fishpool and Evans2001).
Among these, 20 IBAs are entirely or largely designated as Protected Areas, including National Parks (six), National Game Reserves (one), Forest Reserves (five), National Monuments (one) and a combination of these plus game ranches and ungazetted forests (seven). Some of the IBAs have international designation, such as World Heritage Sites (e.g. Mount Kenya National Park and Forest Reserve), Biosphere Reserves (e.g. Mida Creek, Whale Island and Malindi-Watamu Coast) and Ramsar Sites (e.g. Lake Nakuru National Park, Lake Baringo and Lake Bogoria National Reserve) (Bennun and Njoroge Reference Bennun and Njoroge1999, Otieno et al. Reference Otieno, Ng’weno, Matiku, Mwangi, Bennun, Musila, Mulwa and Kiragu2005).
IBA monitoring methodology
(a) Calculating scores for state
As detailed information on the population sizes of those species triggering the IBA designation at each IBA (hereafter, ‘trigger species’) was unavailable, the state of each IBA was scored based on the area and condition of the key habitats on which the trigger species depend. State scores are entered on a scale of 0–3 (Table S1 in online supplementary material). They were derived from the proportion of estimated optimum habitat area remaining and the estimated optimum habitat quality for the trigger species, such that where all or part of a habitat within an IBA has been degraded so that it is thought likely to hold less than an optimum density of the trigger species, the area is ‘devalued’ accordingly (Table S2).
For IBAs with more than one trigger species occupying different types of habitats, state scores were derived for the habitat of each trigger species. To determine the overall score for the IBA, a ‘weakest link’ approach was used; i.e. the lowest (worst) condition for any key habitat for a trigger species determined the overall score for the IBA. This simple decision rule shows the precautionary approach adopted by the scoring methodology.
(b) Calculating scores for pressure
Pressure scores (0–3) were calculated by assessing threats to the trigger species. Threats were classified according to Salafsky et al. (Reference Salafsky, Salzer, Stattersfield, Hilton-Taylor, Neugarten, Butchart, Collen, Cox, Master, O’Connor and Wilkie2008). For each threat to each trigger species, the timing, scope and severity were assessed to determine the overall impact of that threat to the trigger species (see Table S3 for further details). The highest threat impact to any trigger species then determined the overall pressure score for the IBA (again, following a weakest link approach; Table S4).
(c) Calculating scores for response
Response scores were based on three complementary measures of action: the level of (1) formal designation of the site as an area for conservation, (2) management planning and (3) implementation of conservation action (Table S5). The overall response score for an IBA was calculated as the sum of the scores for the three different types of action (Table S6).
IBA indices
To compare between groups of IBAs, a bootstrapping method was used to calculate means and 95% CIs. For each group (divided by e.g. habitat, protection status, protection authority and size), the state, pressure and response scores for each year were resampled with replacement (9999 times) and the median score and 95% CIs calculated using the and 2.5, 50 and 97.5 percentiles of the bootstrapped sample. The scores for each year were then used to examine trends in more detail and significant differences between points were said to occur when the CIs did not overlap. The primary habitat types covering each IBA were classified as forest, grassland, wetland or other (Bennun and Njoroge Reference Bennun and Njoroge1999, Fishpool and Evans Reference Fishpool and Evans2001). Protected IBAs were defined as those that entirely or largely (i.e. by > 50%) overlapped National Parks, National Game Reserves, Forest Reserves, National Monuments and Community Game Sanctuaries (Bennun and Njoroge Reference Bennun and Njoroge1999, Fishpool and Evans Reference Fishpool and Evans2001). The government agency primarily responsible for managing each protected-area IBA was identified: Kenya Forest Service (formerly Forest Department), Kenya Wildlife Service or National Museums of Kenya. All IBAs were also assigned to one of three size classes: small (< 100 km2), medium (100–1,000 km2) or large (> 1,000 km2).
Data analysis
Scores for state, pressure and response were not normally distributed (Kolmogorov-Smirnov test, using SPSS software version 15, Field Reference Field2005). Non-parametric Kruskal-Wallis tests were used to test the significance of differences between years (1999, 2004 and 2005) for each of state, pressure and response, and to test for differences in these variables for IBAs in different habitat types, protected area status (i.e. protected areas versus non-protected areas), management authority (including joint authorities i.e. where two or more were responsible for a given site but had specific resource management roles) and size.
Multiple regression models were used to determine the predictors of the outcome (state) for each year using a hierarchical stepwise backward reduction model in SPSS. The independent variables used were: threats (pressure), conservation action (response) and year as covariates, with protected area status as a categorical variable. These models were designed for each year. On each iteration, the least effective independent variable was excluded, the datasets.
Results
The 36 IBAs included in the analysis for this study represented 60% of all Kenyan IBAs. This sample was not biased by provincial distribution, protected status or habitat, (chi-square tests: ![]() ,
, ![]() ,
, ![]() , all NS), but included more small and medium-sized sites than the complete set (
, all NS), but included more small and medium-sized sites than the complete set (![]() , P = 0.02).
, P = 0.02).
Pressure was the only significant predictor of state in 2004 and 2005, explaining 52% and 29% of the variance in those years (Table S7). In 2005, both pressure and response significantly predicted state, explaining 38.9% of the variance in the model (P < 0.001 and P < 0.05 respectively).
Overall trends
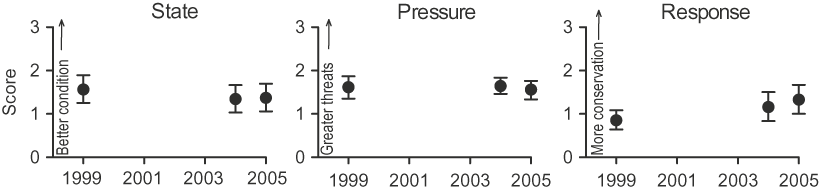
There was a decline in state and pressure scores for the 36 IBAs between 1999 and 2005, although this was not significant (Kruskal-Wallis test: state H[2] = 2.46, pressure H[2] = 0 .46, all P > 0.05, n = 36). However, response scores increased significantly from 1999 to 2005 (H[2] = 13.55, all P = 0.001, n = 36). Notably, the highest difference was in the response scores between 1999 and 2005 (Mann-Whitney test: U = 590, r = −0.23, P = 0.05, n = 36; Fig. 1).
IBA indices for state, pressure and response during 1999–2005 at Kenyan IBAs (mean ± 95% CI, n = 36).
In 2005, the principal threats impacting the IBAs (those with ‘high’ and ‘very high’ impact scores, n = 21) were agricultural expansion and intensification (31%), human-induced modification of natural habitats (14%), over-exploitation of natural resources (11%), invasive and problematic species (11%), residential and commercial development (8%), pollution (8%), human intrusion and disturbance (6%) and severe weather effects (3%). There was little change in the severity of these threats across the years monitored (1999–2005). However, over-exploitation of natural resources declined in frequency of occurrence (affecting 20 IBAs in 1999, eight in 2004 and four in 2005, H[2] = 19.86, P < 0.001).
A breakdown of the scores for each year (Fig. 2) shows that for state, the number of sites with ‘very unfavourable’ condition increased (from five in 1999 to eight in 2004 and 2005), while the number with ‘favourable’ condition decreased (from eight to four and six respectively). For pressure, the number of sites with ‘very high’ threats decreased (from four to two and one respectively) and the number with ‘medium’ threats increased (from seven to 15 and 13 respectively). For response, the number of sites with negligible conservation action decreased (from 11 in 1999 and 2004 to eight in 2005) and the number with ‘high’ conservation action increased (from zero to four to six). It is reasonable to infer that the combination of reduced number of IBAs with ‘very high’ threats and increased number of IBAs with ‘high’ conservation action from 1999 to 2005 may explain why both pressure and response were significant predictors of state in the latter year.
Number of Kenyan IBAs (n = 36) with different categories of scores for state, pressure and response during 1999–2005; figures give the number of IBAs.

Trends for IBAs in different habitats
The condition of IBAs in forest, grassland and wetland habitats was more or less consistently ‘unfavourable’ during 1999–2005 (Fig. 3). Similarly, there was no statistically significant difference in threats or response across habitats between years.
IBA indices (mean ± 95% CI) for state, pressure and response during 1999–2005 at Kenyan IBAs with different primary habitats; sample sizes are: Forests (n = 13), Wetlands (n = 10) and Grasslands (n = 11); two IBAs with primarily scrub and/or riverine woodland habitat were excluded.

Trends for protected vs. unprotected IBAs
Condition scores for protected IBAs improved slightly during 1999–2005, compared to a negative trend in the state of unprotected IBAs (Fig. 4). By 2005, protected IBAs (n = 20) were in better condition than those that were unprotected (n = 16), though this difference was not statistically significant (Mann-Whitney test: U = 0.111, P = 0.11; Fig. 4). As might be expected, protected IBAs had significantly higher scores for response than unprotected IBAs (U = 24, P = 0.001; Fig. 4). During 1999–2005, there was a 55% increase in the number of protected areas that had comprehensive and up-to-date management plans and a 25% increase in comprehensive conservation action at these sites. By 2005, only one unprotected IBA had a comprehensive management plan, but it still lacked comprehensive conservation action. However, limited to substantial conservation activities were recorded in 7 of the unprotected IBAs by 2005, representing a 38% increase from 1999 (Fig. 5 and Fig. 6). Despite the differences in responses, there was no significant difference in scores for pressure at protected versus unprotected IBAs (U = 160, P > 0.05; Fig. 4).
IBA indices (mean ± 95% CI) for state, pressure and response during 1999–2005 at protected (filled circles, n = 20) and unprotected (filled diamonds, n = 16) Kenyan IBAs.

Proportion of Kenyan protected area-IBAs (n = 20) and non-protected areas (n = 16) with different categories of scores for management planning during 1999–2005; figures give the number of IBAs.

Proportion of Kenyan protected area-IBAs (n = 20) and non-protected areas (n = 16) with different categories of scores for conservation action during 1999–2005; figures give the number of IBAs.

The overall state of protected IBAs managed individually by the Kenya Forest Service, Kenya Wildlife Service or National Museums of Kenya declined or remained stable during 1999–2005, while the state of IBAs jointly managed by more than one agency significantly improved (Fig. 7). This improvement can be attributed to a significant decline in threats and a significant increase of conservation interventions.
IBA indices (mean ± 95% CI) for state, pressure and response during 1999–2005 at protected Kenyan IBAs managed by the Kenya Forest Service (KFS; n = 4), Kenya Wildlife Service (KWS; n = 7), National Museums of Kenya (NMK; n = 1) or jointly by more than one of these agencies (JOINT; n = 8).

Trends for IBAs of different size
The state of small IBAs declined over the period despite an increase in response scores between 2004 and 2005 (Fig. 8). Response improved for IBAs in all size classes, but medium and large IBAs tended to have higher response scores than small IBAs (Fig. 8). This appears to be because a higher proportion were protected and received government support.
IBA indices (mean ± 95% CI) for state, pressure and response during 1999–2005 at Kenyan IBAs of different sizes (small < 100 km2; n = 9, medium 100–1000 km2; n = 19, large > 1000 km2; n = 8).

Trends in responses
A detailed breakdown of response scores shows that while there was little change in the formal protection of IBAs during the period, there was a steady increase in the proportion of IBAs with some level of management planning (Fig. 9). Similarly, the degree of implementation of conservation action improved during 1999–2005, with the percentage of IBAs receiving comprehensive and effective actions increasing from 0 to 14% and the percentage receiving little or no action decreasing from 58 to 25%.
Proportion of Kenyan IBAs (n = 36) with different categories of scores for conservation responses (protection status, management planning and conservation action) during 1999–2005; figures give the number of IBAs.

Discussion
Presenting IBA indices
The IBA indices presented here are the first examples published for any country, and their format is recommended for other countries and for regional and global analyses. The indices are calculated as the mean score for state, pressure and response, presented with 95% confidence intervals. A number of alternative approaches have been considered and rejected. One such would be to calculate the percentage (i.e. 0–100) or proportion (0–1) of the maximum possible score, and plot the mean of this value for all IBAs. The advantage of this is that 0–100 or 0–1 seems a more intuitive range of values, while 0–3 could be perceived as arbitrary. The disadvantage is that it is harder to explain what the values represent, and that 0 and 100 (or 1) do not really represent absolute minima or maxima for the parameters measured. For state, this is a particular problem, as ‘optimum’ state is not defined globally, and its interpretation may vary between sites and countries.
Another approach is to plot the percentage or proportion of IBAs in ‘near-favourable’ or ‘favourable’ condition, with medium or low threats, and with medium or high responses in place. This makes the reasonable assumption that these are the target categories for all sites. An advantage is that these are simple and easily communicated measures. For example, nearly all the indicators selected for the Millennium Development Goals are expressed as percentages or ratios (United Nations 2005). However, such an approach simplifies an already simple scoring system into even broader categories, and hence reduces its sensitivity still further, plus it does not allow variation across sites to be illustrated (e.g. through error bars).
For some purposes, it is helpful to present the results as stacked bars showing the percentage of sites in each score category (e.g. Figs 2 and 6). This more clearly demonstrates the scores as somewhat arbitrary categories, and it presents more detailed information than other approaches. For example, Fig. 2 shows that the proportion of sites in ‘favourable’ condition and the proportion in ‘unfavourable’ condition are both increasing, whereas this subtlety cannot be detected from the mean score trend in Fig. 1. However, a disadvantage is that the temporal scale is less clear if data points are not derived at regular intervals (e.g. it is not obvious in Fig. 2 that there is a five-year gap between the first two bars, but only a single year between the second and third bars). This approach is also problematic when attempting to compare scores for more than one subset of the data (e.g. for IBAs with different primary habitats, or for protected versus unprotected IBAs). For such comparisons, the simple graphs showing mean scores with confidence limits are easier to interpret.
BirdLife International (2006a) indicated that it may be useful to compare trends in the state, pressure and response scores at individual sites by comparing the current and previous scores (subtracting the latter from the former). The resulting trend score may vary from −3 (large decline) to +3 (large improvement). This approach was used in Otieno et al. (Reference Otieno, Ng’weno, Matiku, Mwangi, Bennun, Musila, Mulwa and Kiragu2005) and Musila et al. (Reference Musila, Ng’weno, Matiku, Mwema, Kanyanya, Mulwa, Musina, Buckley and Njehia2006) to compare the mean trend score for all sites. However, when more than two assessments have been made, it is preferable to calculate IBA indices as presented here, in order to demonstrate trends over a longer time period, to illustrate absolute values and to permit relative comparisons (between subsets of the data).
BirdLife International (2006a) assigned negative values to scores for pressure, i.e. ranging from zero (low pressure) to −3 (very high pressure). This was to emphasise that threats have negative consequences on sites. However, here we present threats on a positive scale (0 to 3), to facilitate direct comparison with state and response scores, and recommend this approach more generally.
The dataset used here had scores for all three parameters for all 36 IBAs for each time point. The remaining 24 IBAs in Kenya had gaps for one or more of the three assessments. Such gaps are likely to be the norm for some datasets, for all sorts of practical reasons. Where data gaps are preceded and followed by data (i.e. a score is missing for a site for one or more years within a series), the missing values can be produced by straightforward interpolation. For missing data at the beginning of time series (i.e. where interpolation is not possible), the gap could be filled by linear extrapolation of later trends, or a conservative approach could be adopted (i.e. assume no change). Similarly, for missing data at the end of time series, the gap could be filled by linear extrapolation of earlier trends, or by assuming no change. Once the site is reassessed in a subsequent year, the interpreted data point can then be recalculated (with greater certainty) by interpolation. Alternatively, interpolation could be achieved through a categorical regression model that includes site and year, plus covariates such as protection status.
Monitoring IBAs in Kenya
The overall trends in the state, pressure and response at Kenyan IBAs during 1999–2005, as measured by the BirdLife monitoring framework, are consistent with changes in the policy and management of natural resources that occurred in Kenya during this period. The 1999 national population census revealed there were 28.7 million people in the country, an increase of 34% over the previous decade (Central Bureau of Statistics 2008). This growth produced an increased (and often unsustainable) demand for natural resources from the forests, wetlands, grasslands and agricultural ecosystems in which IBAs are located (Ministry of Environment and Natural Resources 2000). The National Biodiversity Strategy and Action Plan identified increased population and poverty as the ultimate drivers of biodiversity loss (Ministry of Environment and Natural Resources 2000). A substantial proportion of Kenyans are poor, and poverty levels are higher in rural areas where most IBAs are located (World Resources Institute 2007). This, coupled with high unemployment rates, prompts rural communities to rely heavily on natural resources for fuel wood, water, building material, timber and grazing areas (Musila et al. Reference Musila, Ng’weno, Matiku, Mwema, Kanyanya, Mulwa, Musina, Buckley and Njehia2006). While the relationship between poverty and biodiversity is a complex one (BirdLife International 2006b), at the local level this often leads to unsustainable demands and negative impacts on biodiversity.
As a result of the growing impacts on natural ecosystems, a suite of changes in policy and the management of natural resources was commissioned by the Kenyan government during the period considered here. In 2000, the National Environment Management Authority was set up; subsequently, the Public Complaints Committee was established empowering communities to speak out on environmental damage, and Environmental Impact Assessment guidelines were published, providing a set of principles to be followed before engaging in major development projects. In 2003, the Wetlands Conservation and Management Policy was initiated by the government. In 2004, the Geology and Mining Act was also proposed for review. In 2005, a new Forest Act was passed with provisions for communities adjacent to forests to participate in their management. All these policy changes appear to have contributed to the improvement in IBA management (especially in Protected Areas), as measured by the mean response score.
Despite improved conservation responses, mean pressure scores at Kenyan IBAs declined only marginally in 2004 to 2005. This is an indication of the challenges to tackling these pressures effectively, and of the time lags between implementing conservation actions and reducing threats. The state of Kenyan IBAs, in fact, fell slightly during 1999–2005, although not significantly so. This appears again to reflect delays between implementing action and seeing impacts on the ground and also the short monitoring period. Differences may become more apparent with regular monitoring undertaken over a longer period. Those Kenyan IBAs that are officially protected have substantially greater conservation responses underway, have marginally (although not significantly) lower pressures, and are, consequently, in significantly better condition than those IBAs which are not protected. These results provide useful feedback to decision-makers and support the argument for the government to continue to commit and invest resources in current protected areas as well as to work with local communities to conserve biodiversity in unprotected IBAs. Both approaches are essential if Kenya is to achieve its commitment to reduce significantly the rate of biodiversity loss. The results also support the plans to get as many key sites as possible legally protected to promote the conservation of biodiversity.
There is some evidence that protected areas managed jointly by more than one agency may have fared better than those managed by one alone. Jointly managed sites showed improvements in responses, a greater reduction in pressures and the largest improvements in state, compared to sites managed by single agencies (Fig. 7). This might be explained by the benefits of pooling human and capital resources to fund management of these protected areas. At some of the IBAs (Mount Kenya, Mida Creek, Whale Island, Watamu, Kakamega Forest and Mount Elgon), there are increased financial resources deriving from projects funded by development and conservation organisations, working with local communities and government agencies to mitigate pressures caused by the high demand on natural resources.
It took approximately 1,000 hours to collect, compile and analyse data for the 36 IBAs in one year. This worked out at US$2,750 per year for the 36 IBAs (based on the 2008 charges for technical staff at the National Museums of Kenya, the national data repository). A significant proportion of this figure was covered by the operational costs of the national institutions involved; however, approximately one third was covered by conservation projects supporting community conservation groups or Site Support Groups at four IBAs in this sample. We argue that this represents good value for money given the utility of the individual site scores and of the aggregated IBA indices presented here, both for the adaptive management of natural resources and for monitoring the impacts of policy decisions. We recognise however that the approach to IBA monitoring employed here will not be feasible, at least for the foreseeable future, at all IBAs. Some are simply too remote and little visited to enable adequate data to be collected, while elsewhere political instability and lack of resources mean that on-the-ground monitoring remains a challenge. For these, a partial alternative exists through remote sensing. Buchanan et al. (Reference Buchanan, Donald, Fishpool, Arinaitwe, Balman and Mayaux2009) demonstrated that changes in land-cover—the most frequently reported threat to IBAs and the most prevalent threats at IBAs holding globally threatened species—are not only detectable, but quantifiable, through earth observation. While the methodology is still being refined, the preliminary results of Buchanan et al. (Reference Buchanan, Donald, Fishpool, Arinaitwe, Balman and Mayaux2009) strongly suggest that remote sensing has a role to play at least in the threat-assessment aspects of IBA monitoring.
A great body of work exists that explores setting up sustainable, simple and robust monitoring schemes, including those in developing countries involving local communities and site managers (Becker et al. Reference Becker, Agreda, Astudillo, Costantine and Torres2005, Bennun et al. Reference Bennun, Matiku, Mulwa, Mwangi and Buckley2005, Danielsen et al. Reference Danielsen, Burgess and Balmford2005, Uychiaoco et al. Reference Uychiaoco, Arceo, Green, De La Cruz, Gaite and Alino2005). However, there are challenges and limitations in establishing monitoring schemes (Danielsen et al. Reference Danielsen, Burgess and Balmford2005, Lengyel et al. Reference Lengyel, Deri, Varga, Horvath, Tothmeresz, Henry, Kobler, Kutnar, Babij, Seliskar, Christia, Papastergiadou, Gruber and Henle2008). In Kenya, limited access to data and information and lack of adequate infrastructure to enhance their collection, have been identified as hindrances to better utilisation and management of biodiversity (Ministry of Environment and Natural Resources 1994, 2000). This paper describes a simple but very useful approach to tracking trends in the condition of IBAs (state), the threats to them (pressures) and the conservation actions in place (responses). The system is sensitive enough to detect differences between sites and over time, but is sufficiently simple to be implemented with limited training and resources and without sophisticated technology. The results provide useful information for managers of individual protected areas, management agencies responsible for suites of sites and the national government.
Supplementary Material
The supplementary materials for this article can be found at journals.cambridge.org/bci
Acknowledgements
We are grateful to all those who contributed to the development of the BirdLife monitoring framework and who collected the monitoring data for Kenyan IBAs. It has been a collaborative effort involving the Kenya Forest Service, Kenya Wildlife Service, National Museums of Kenya, Nature Kenya members, A Rocha Kenya, and members of many Site Support Groups, including Kijabe Environment Volunteers, Friends of Kinangop Plateau, Lake Victoria Sunset Birders, Mount Kenya Biodiversity Group, Arabuko-Sokoke Forest Guides Association, Kakamega Environmental Education Programme, South Nandi Biodiversity Conservation Group and Mukurwe-ini Environmental Volunteers. We thank Neville Ash, Ian Burfield, Neil Burgess, Rob Clay, Will Crosse, David Knox and John Pilgrim for discussion of the merits of different approaches to calculating IBA indices, and Ian May and Mark Balman for help with data management. We are indebted to anonymous referees and Phil Atkinson for very constructive comments that greatly improved the paper. We also gratefully acknowledge funding for the monitoring work from the Darwin Initiative, The European Union and the Royal Society for the Protection of Birds.


