


Introduction
The gender gap in academia has been well substantiated with evidence. Across countries and disciplines, women appear to be underrepresented in top scientific journals, citation indexes, and the highest positions of career hierarchies (AAUP 2022; Diezmann and Grieshaber 2019; European Commission 2021; Hagemann Reference Hagemann2022; Huang et al. Reference Huang, Gates, Sinatra and Barabási2020).
As far as political science is concerned, the two major professional associations on both sides of the Atlantic, the American Political Science Association (APSA) and the European Consortium for Political Research (ECPR), have sponsored research projects aiming to investigate the extent of the gap between male and female academics. In addition, they have promoted practical policies designed to address the issue, and are continuing to monitor progress in the area (APSA 2022; Deschouwer Reference Deschouwer2020; Stockemer Reference Stockemer2022; Stockemer et al. Reference Stockemer, Blair and Rashkova2020).
The gender gap among political scientists has, thus, been researched in different national contexts. Southern Europe, however, has remained out of the main picture and is rarely part of the comparative framework. To bridge this gulf, our work focuses on three South European journals to reveal to what extent female academics are underrepresented in the discipline’s top journals in the region. We are also interested in unearthing the features of female authorship. Three questions stand out. First, do women prefer to work alone or with colleagues? And if so, with whom do they work? We define these choices as ‘publication strategies’. Second, at what level of the academic ladder are female authors getting published in these journals? Last, do women's publication strategies change according to their academic seniority? We believe that evidence-based replies to these questions—comparing the picture for female academics with that of their male colleagues—will help us to understand not only the roots of the gender gap but also how to reduce it.
Political Science is a well-established discipline in Southern Europe and presents a menu of different journals and book series in each country. To have an idea of the variety of approaches and research projects undertaken by political scientists in this region, it is sufficient to have a look at the recent Oxford Handbooks on politics, where the initial volume on Italian politics (Jones and Pasquino Reference Jones and Pasquino2015) has been followed by those devoted to Spain (Muro and Lago Reference Muro and Lago2020), Greece (Featherstone and Sotiropoulos Reference Featherstone and Sotiropoulos2020), Turkey (Murat Tezcür Reference Murat Tezcür2020) and Portugal (Fernandes et al. Reference Fernandes, Magalhães and Costa Pinto2022).
Despite the role played by political science in South European academic systems, research on the gender gap in its periodical publications is still in its infancy. While one area study journal, South European Society and Politics (SESP), has been the object of initial investigation (Verney and Bosco Reference Verney and Bosco2022), so far the official journals of the region’s national Political Science Associations remain off the radar.
The main aim of this article, therefore, is to cover the lack of research on the gender gap in South European Political Science journals. We do this by comparing the picture at SESP with the Italian Political Science Review/Rivista Italiana di Scienza Politica (RISP) and the Revista Española de Ciencia Política (RECP). For political scientists working on Southern Europe, SESP, as the only social science journal to cover the whole region, offers a major publication outlet at the international level. RISP and RECP, on the other side, are the official journals of the two main political science associations in Southern Europe. For political scientists in Italy and Spain, they provide a key publication destination at the national level. Even if they publish works authored by international scholars, these two journals are mainly composed by articles of Italian and Spanish authors.
This article is structured as follows. After presenting some main findings of the literature on the gender gap in political science journals (section two), we describe our data collection methods (section three). Next, we analyse the published output of RISP, RECP and SESP, in order to show the extent of the gender gap and compare it with the results for the main American and European political science journals. In the following two sections, we delve deeper into gender differentiation by looking at the authorship patterns adopted by male and female scholars (section five) and then by examining how these patterns vary by ‘academic age,’ i.e. the career stage of the authors (section six). Our hunch is that authors may choose different publication strategies at different points in their careers. Drilling down to a more detailed picture may thus help reveal the dynamics of the gender gap in academic publication. Such understanding, in turn, could contribute to the formulation of effective policies to bridge the gender fracture. Finally, we present our conclusions and their implications for the promotion of equality in academia.
The study of gender gap in political science journals
The gender dimension in political science publishing emerged from the shadows in the early 1990s, thanks to the efforts of the American Political Science Association (APSA), whose Committee on the Status of Women published a Report (Committee on the Status of Women 1992) that addressed the issue of gender inequalities in a discipline still largely dominated by men.
Among the various gaps unearthed was the significantly lower number of articles published by female scholars in top journals compared to their male colleagues. This was—and is—an important issue because promotions and career progression are largely based on the number and type of publications produced by academics. Several contributions in PS: Political Science & Politics, APSA’s journal of the profession, took stock of women's publications and discussed their features. The main results emerging from three decades of research on US political science showed that women were under-represented in the discipline’s top journals; that this did not appear to be due to the review process, which was not gender biased; and that at the core of the gap, there was a strong imbalance in the number of articles submitted to top journals by female academics compared to their male colleagues (Young Reference Young1995, Breuning and Sanders Reference Breuning and Sanders2007, Evans and Moulder Reference Evans and Moulder2011, Teele and Thelen Reference Teele and Thelen2017, Brown and Samuels Reference Brown and Samuels2018, Breuning et al. Reference Breuning, Gross, Feinberg, Martinez, Sharma and Ishiyama2018, Djupe, Smith and Sokhey Reference Djupe, Smith and Sokhey2019). Acting on these findings, APSA's presidency promoted a Task Force on Women's Advancement in 2017 and the Association has subsequently continued monitoring and addressing 'systemic inequity and inequality in political science' through various initiatives (Mershon Reference Mershon2022).
On the other side of the Atlantic, the European Consortium for Political Research (ECPR) presented data on male and female participation in ECPR's governance and activities in 2016, when the first issue of a Gender Study report was published (ECPR 2016). The publication included information such as women's presence in the Consortium’s Executive Committee since 2000, and among the Joint Sessions Workshop Directors and General Conference Section Chairs since 2012.
Particularly important, however, were the figures related to the ECPR's own journals, because for the first time the Gender Study 2016 revealed the number of articles submitted by women since 2006–2008 as well as the number of female editors and editorial board members.
The gender gap that emerged from this first study led the ECPR to adopt a 'Gender Equality Plan' in 2018 with the aim of increasing the presence of female scholars in all aspects of the organisation (Deschouwer Reference Deschouwer2020). Consequently, ECPR has kept on monitoring women’s contributions to academic journals, starting with its own ‘in-house’ publications and continuing with journals external to the Consortium. In 2021, for instance, the ECPR journal European Political Science organised a roundtable at the annual General Conference, where the editors of four major political science journals presented their data on the gender gap in submissions, publications, and review processes. The discussion showed that despite the different research areas covered by their journals, European Union Politics, Journal of Common Market Studies, South European Society and Politics, and West European Politics all shared similar gaps when it came to the gender of authors, both submitting and published, as well as reviewers (Stockemer Reference Stockemer2022).
Overall, the figures so far published in the ECPR yearly reports (ECPR 2016, 2017, 2018, 2019, 2020, 2021), as well as those in articles focusing on specific ECPR journals, highlight the existence of a vast gulf between the articles published by male academics and their female colleagues (Closa et al. Reference Closa, Moury, Novakova, Qvortrup and Ribeiro2020; Stockemer et al. Reference Stockemer, Blair and Rashkova2020). Thus, taking all the ECPR journals together, in the period 2016–2021, female submitters averaged 28.8% of the total and 32.6% of those who made it to publication. These figures are not extraordinary. Looking at the other European political science journals which published their in-house data, it is easy to recognise that there seems to exist a sort of 'one-third ceiling' for women in top journals, that is rarely exceeded and does not vary much from journal to journal (Bettecken et al. Reference Bettecken, Klöckner, Kurch and Schneider2022; Ghica Reference Ghica2021; Haastrup et al. Reference Haastrup, Milner and Whitman2022; Hagemann Reference Hagemann2022; Sindbjerg Martinsen et al. Reference Sindbjerg Martinsen, Goetz and Müller2022). In addition, the data on the ten top American political science publications in the period 2000 to 2015 show that the percentage of female contributors varies between the 18% registered by the American Journal of Political Science, and the 33.7% recorded by Political Theory (Teele and Thelen Reference Teele and Thelen2017, p. 435).
Like the present article, the cited studies do not investigate causality in any depth. Most of the works simply note the usual suspects: work/family balance and women’s increased responsibilities in the caring sphere (Dubois-Shaik and Fusulier Reference Dubois-Shaik and Fusulier2017); male control of influential academic networks (van den Brink and Benschop Reference van den Brink and Benschop2014); women’s greater participation in academic service tasks and general ‘academic housework’ (Guarino and Borden Reference Guarino and Borden2017); and last but not least, the impact of women’s lower self-esteem on their academic production (for a general introduction to the literature on this sensitive topic, also known as the ‘imposter phenomenon’, see Verney and Bosco Reference Verney and Bosco2022). How do South European journals match up against this broader picture of women’s reduced role in academic publications? This is the subject to which we will now turn.
Methods and dataset
As mentioned above, our data are drawn from three academic journals important to the political science profession in Southern Europe. The Italian Political Science Association (SISP) was first established in 1973; in 2022 SISP’s website reported 350 ordinary members (www.sisp.it). RISP is one of the Association’s two official journals. Founded in 1971 by Giovanni Sartori, RISP has always been published three times a year. In 2009 it first began to include some articles written in English, while in 2013, English became the journal’s official language (Verzichelli Reference Verzichelli2013). Since 2015, RISP has been published by Cambridge University Press.
The Spanish Association of Political and Administrative Science (AECPA) was founded in 1993; in 2023 its website declares around 600 members. RECP is its official journal. Published in Spanish, RECP was established in 1998 and produced its first issue in 1999. During its first decade, the journal was published twice a year, moving to three since 2010 (Jerez and Luque Reference Jerez and Luque2016).
Finally, SESP was born in 1996 as an area studies journal covering seven South European countries (Portugal, Spain, Italy, Greece, Turkey, Malta, and Cyprus). Initially publishing three issues a year, it increased to four in 2006. Since 2005, SESP has been published by Routledge.
While SESP was an international journal from the start, RISP and RECP were born as official outlets of their respective political science associations. As long as RISP was published in Italian, most of the authors were Italian, but once the journal began publishing in English, many non-Italian academics also submitted their work, often collaborating with Italian political scientists. In the period under consideration (2011–2022), for instance, international scholars amounted to 23% of the authors, while the remaining 77% were Italian authors affiliated with Italian universities. Finally, the Spanish journal was more internationalized than the Italian one because scholars from various Latin American countries submitted their work to RECP over time. As both journals have been publishing articles by an increasing number of non-Italian and non-Spanish authors, it is not possible to assess whether women publish in proportion to their presence in the national discipline. Today, in fact, the three journals can all be considered as international journals.
Our research is based on the record of articles published in these three journals from 2011 to 2022. The previous works suggested that the decade 2011–2020 was an important timespan for women authors, in which they improved their publication footprint (Verney and Bosco Reference Verney and Bosco2022). For the current research, we brought the picture up to date by adding 2021 and 2022, 2 years of especial interest, given the negative impact of the COVID-19 pandemic on women’s professional lives.
For each article, we recorded the gender of the author(s) and their career stage when the article was published. In the case of SESP, both gender and career stage were identified primarily from the biographical notes which the authors themselves wrote to be published alongside their articles in the journal. In cases where this information was not provided in the biographical notes, we searched for it online, e.g. through authors’ webpages or curricula vitae. For RISP and RECP, which do not provide complete biographical data on their authors, we researched this information online. This proved to be a labour-intensive process and one which became more difficult to achieve the further back in time we went. For this reason, the analysis of the career stage of the authors is based on a shorter, 8 year timespan, from 2015 to 2022.
One of the major problems we encountered was how to classify career stages, as this involved comparing university positions across countries with different systems of academic hierarchy. We ended up with four broad career categories. The most junior group includes pre-PhD researchers (whether PhD candidates, postgraduate students or other). A second early career category covers researchers who already hold a PhD but who are not yet in a tenure-track post. Owing to the low number of cases in the most junior group, in our results these two working stages have been aggregated into a unified ‘Early Careers’ category. The next group, which we have called ‘Assistants’, includes Assistant Professors and other scholars on career-track contracts. Finally, the senior ranks consist of two classes: Associate and Full Professors (‘Associates; Full Profs’). In the following sections, we move on to analyse the size and features of the gender gap which we found in the three journals under study.
How large is the gender gap in South European journals?
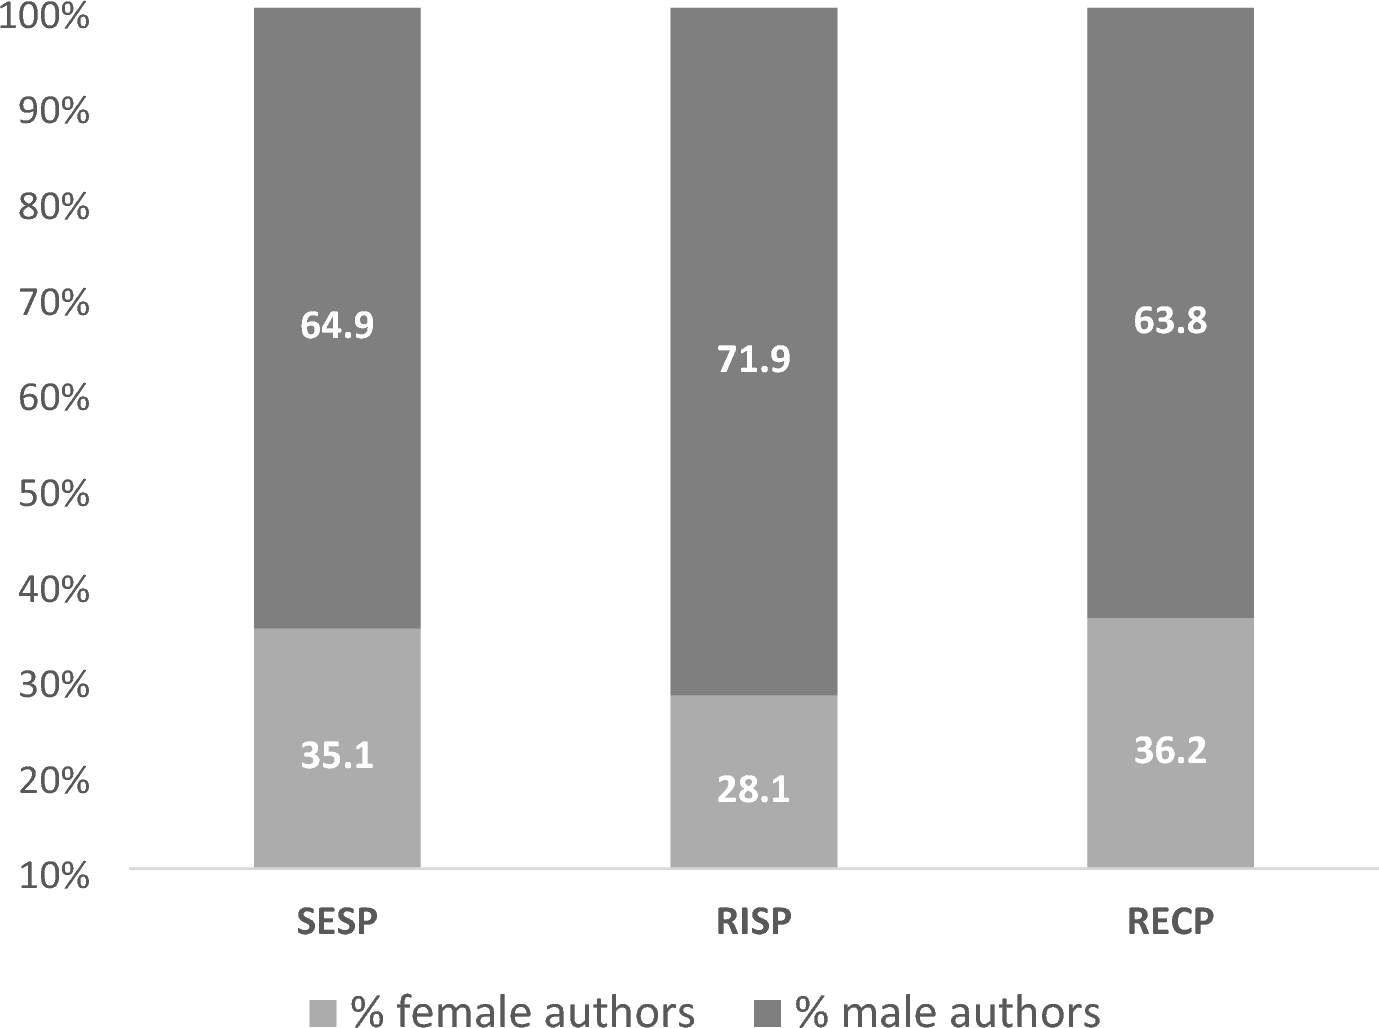
Between 2011 and 2022, the three political science journals published a total of 794 articles, which involved 1395 authors. Of these, just 459 were women, i.e. 32.9% of the total. As shown in Fig. 1, both SESP and the Spanish RECP present a ratio of almost two male authors for every female, while the Italian RISP has an even higher percentage of male authors (72%).
Male versus Female authors in SESP, RISP and RECP (2011–2022 average).

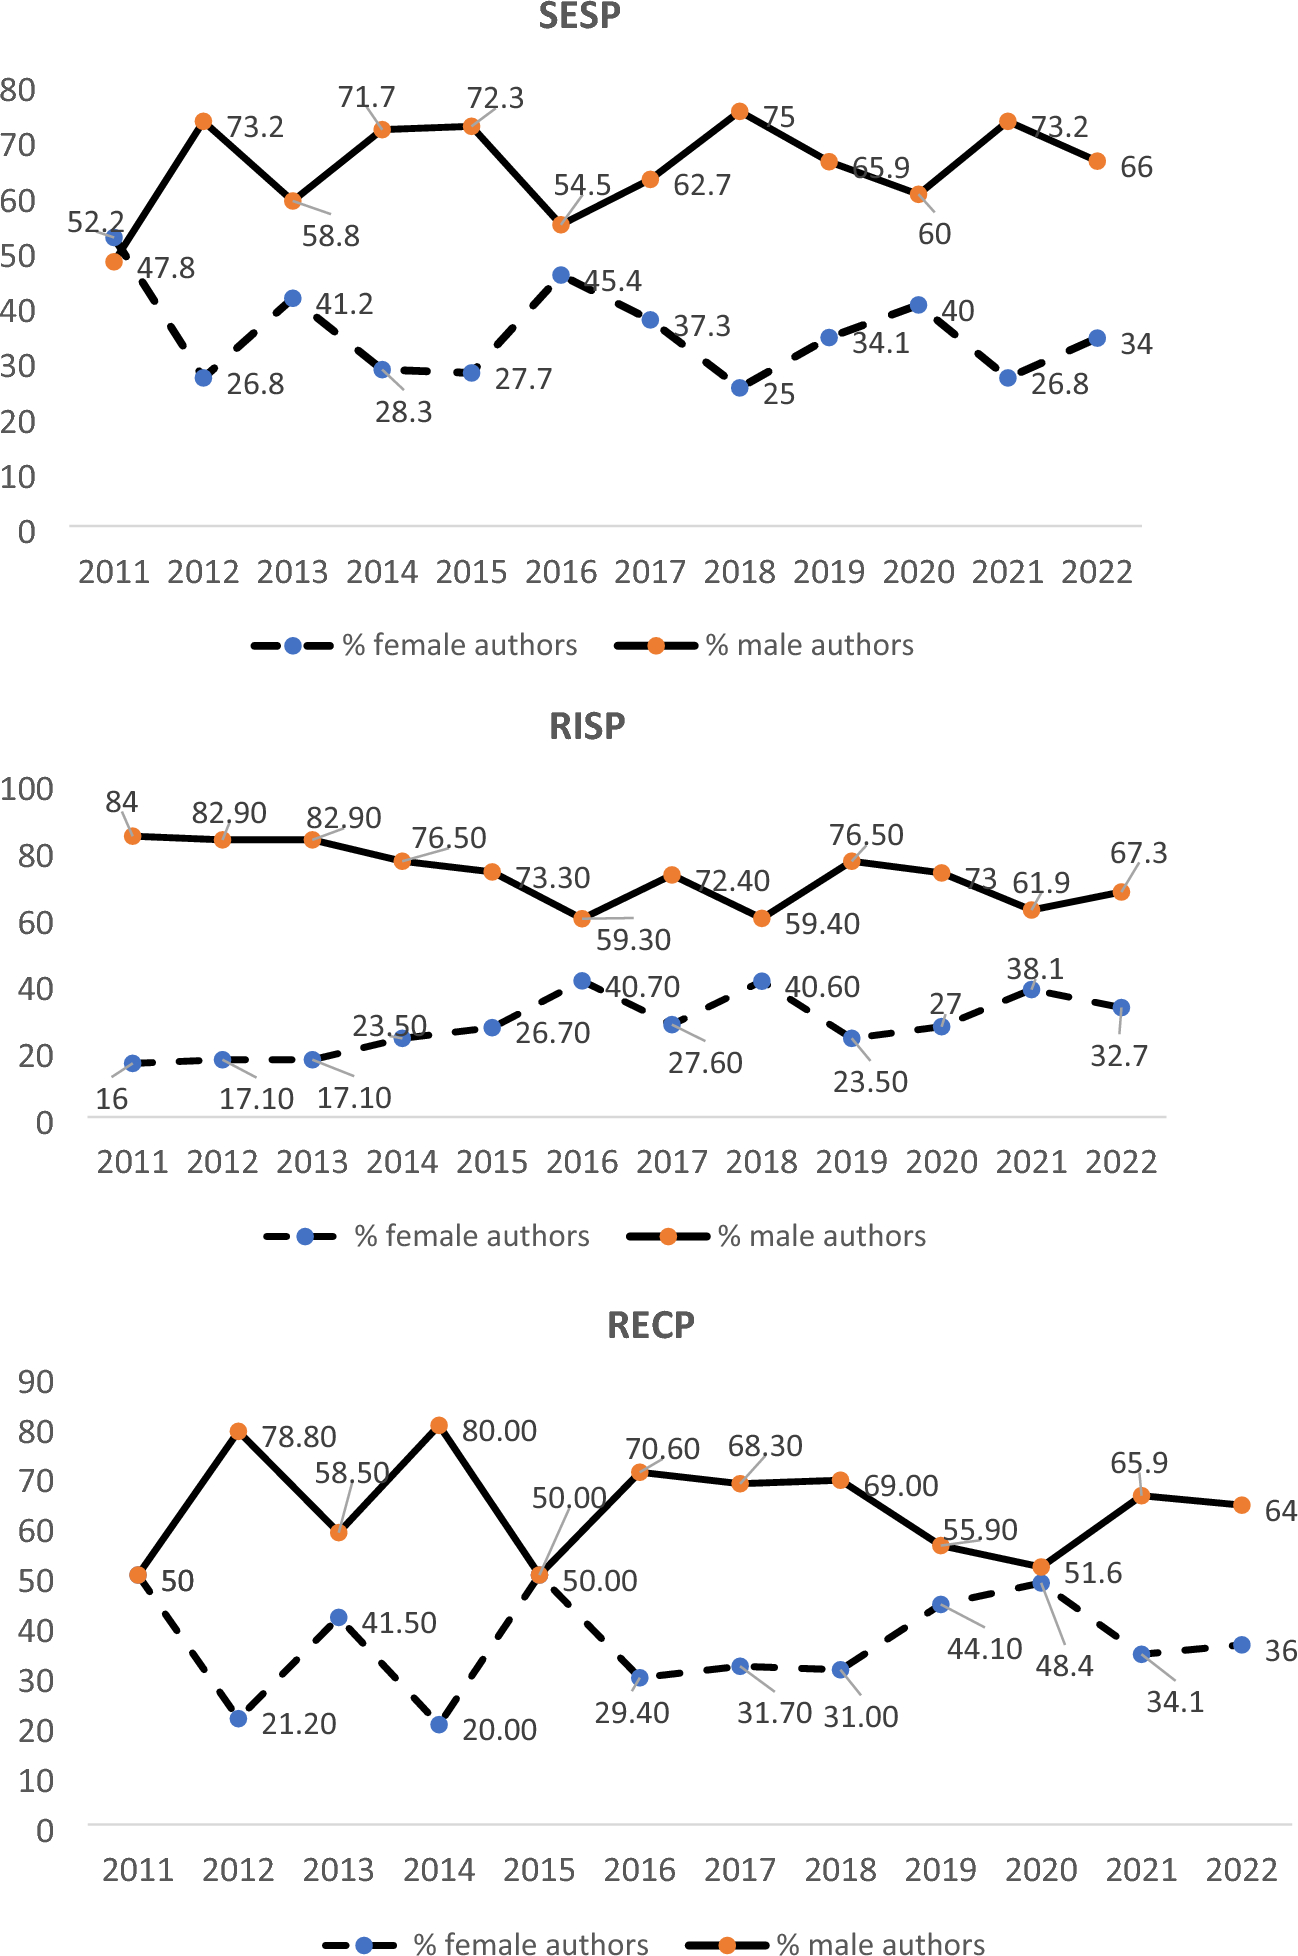
Of course, the male–female ratio is not consistent over time, and it changes according to the publication decisions made every year (see Fig. 2). Overall, and if we disregard 2021 when both SESP and RECP have a lower share of women—possibly due to the pandemic—the trend seems to be for an increasing number of women authors. Nevertheless, what is apparent from the figure below, showing the individual trajectories of each of the three journals, is that the gender gap is a permanent feature. There is only one year, 2011, in which one journal (SESP) has slightly more female than male authors. Meanwhile, in every other year, in all three journals, the numerical predominance of men is clear and overwhelming.
Percentage of female versus male authors, per year, in SESP, RISP and RECP, 2011–2022.

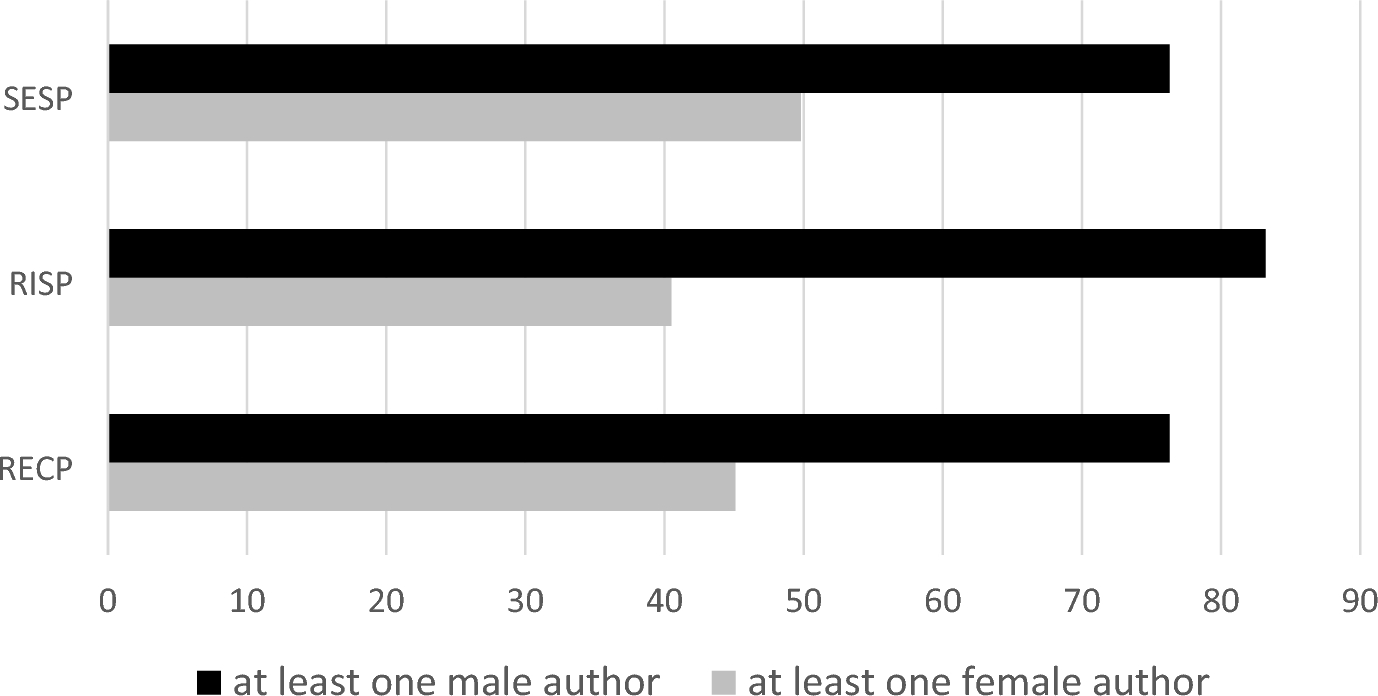
Overall, the authorship gender gap in the three South European journals is consistent with the findings of American and European journals. The gap, however, can also be examined in a different way. Instead of counting individual authors, we can look at the published articles. As these are very often the result of collaborative efforts, how big a contribution do men and women make to the total published output of each journal?
As shown in Fig. 3, female authors are involved in a maximum of half the articles published in any individual journal. In contrast, male authors contribute to three quarters of the articles or more. In other words, in the three journals it is rare to read an article without any male authors.
Percentage of published articles in SESP, RISP and RECP with at least one male/female author (2011–2022).

Thus, answering the question we posed at the beginning of this section, the data from the 2011–2022 period show the presence of a clear gender gap, as male authors significantly outdistance their female colleagues in our three journals.
The 12 years under consideration were closed by the COVID pandemic, which had disruptive effects on work-family balance across society, academics included. As shown through surveys and interviews, the lockdown measures made it extremely difficult for scholars to maintain preceding levels of productivity and research. However, it appears that women paid the highest price for the new situation because of increased household demands. Female scholars, in fact, were less able than their male colleagues to ring-fence time for tasks like research and the submission of their work (Minello 2020; Shalaby, Allam and Buttorff Reference Shalaby, Allam and Buttorff2021; Deryugina et al. Reference Deryugina, Shurchkov and Stearns2021). The initial findings, based on academics' answers to surveys, were later confirmed by other research. Squazzoni et al. (Reference Squazzoni, Bravo, Grimaldo, García-Costa, Farjam and Mehmani2021), examining submissions to more than 2300 Elsevier journals during the first phase of the pandemic, showed that the larger number of submissions were by men compared to women (see also Ucar, Torres and Elías Reference Ucar, Torre and Elías2022 on preprint repositories). This gender distortion, of which women were acutely aware, is considered to have worsened pre-existing gender inequalities (Breuning et al. Reference Breuning, Fattore, Ramos and Scalera2021).
An accurate assessment of the pandemic’s impact on the gender gap in the three South European journals cannot be made without information on the submissions. Furthermore, the specific impact of the pandemic is not the goal of the current work, which aims to establish the broader picture over the last 12 years. However, it can make sense to conclude this section by stressing that the trend towards bridging the authorship gap, seen in Fig. 2, seems to have been abruptly interrupted after the outbreak of the coronavirus pandemic. But more research is needed to substantiate this conclusion.
Do men and women publish in the same way?
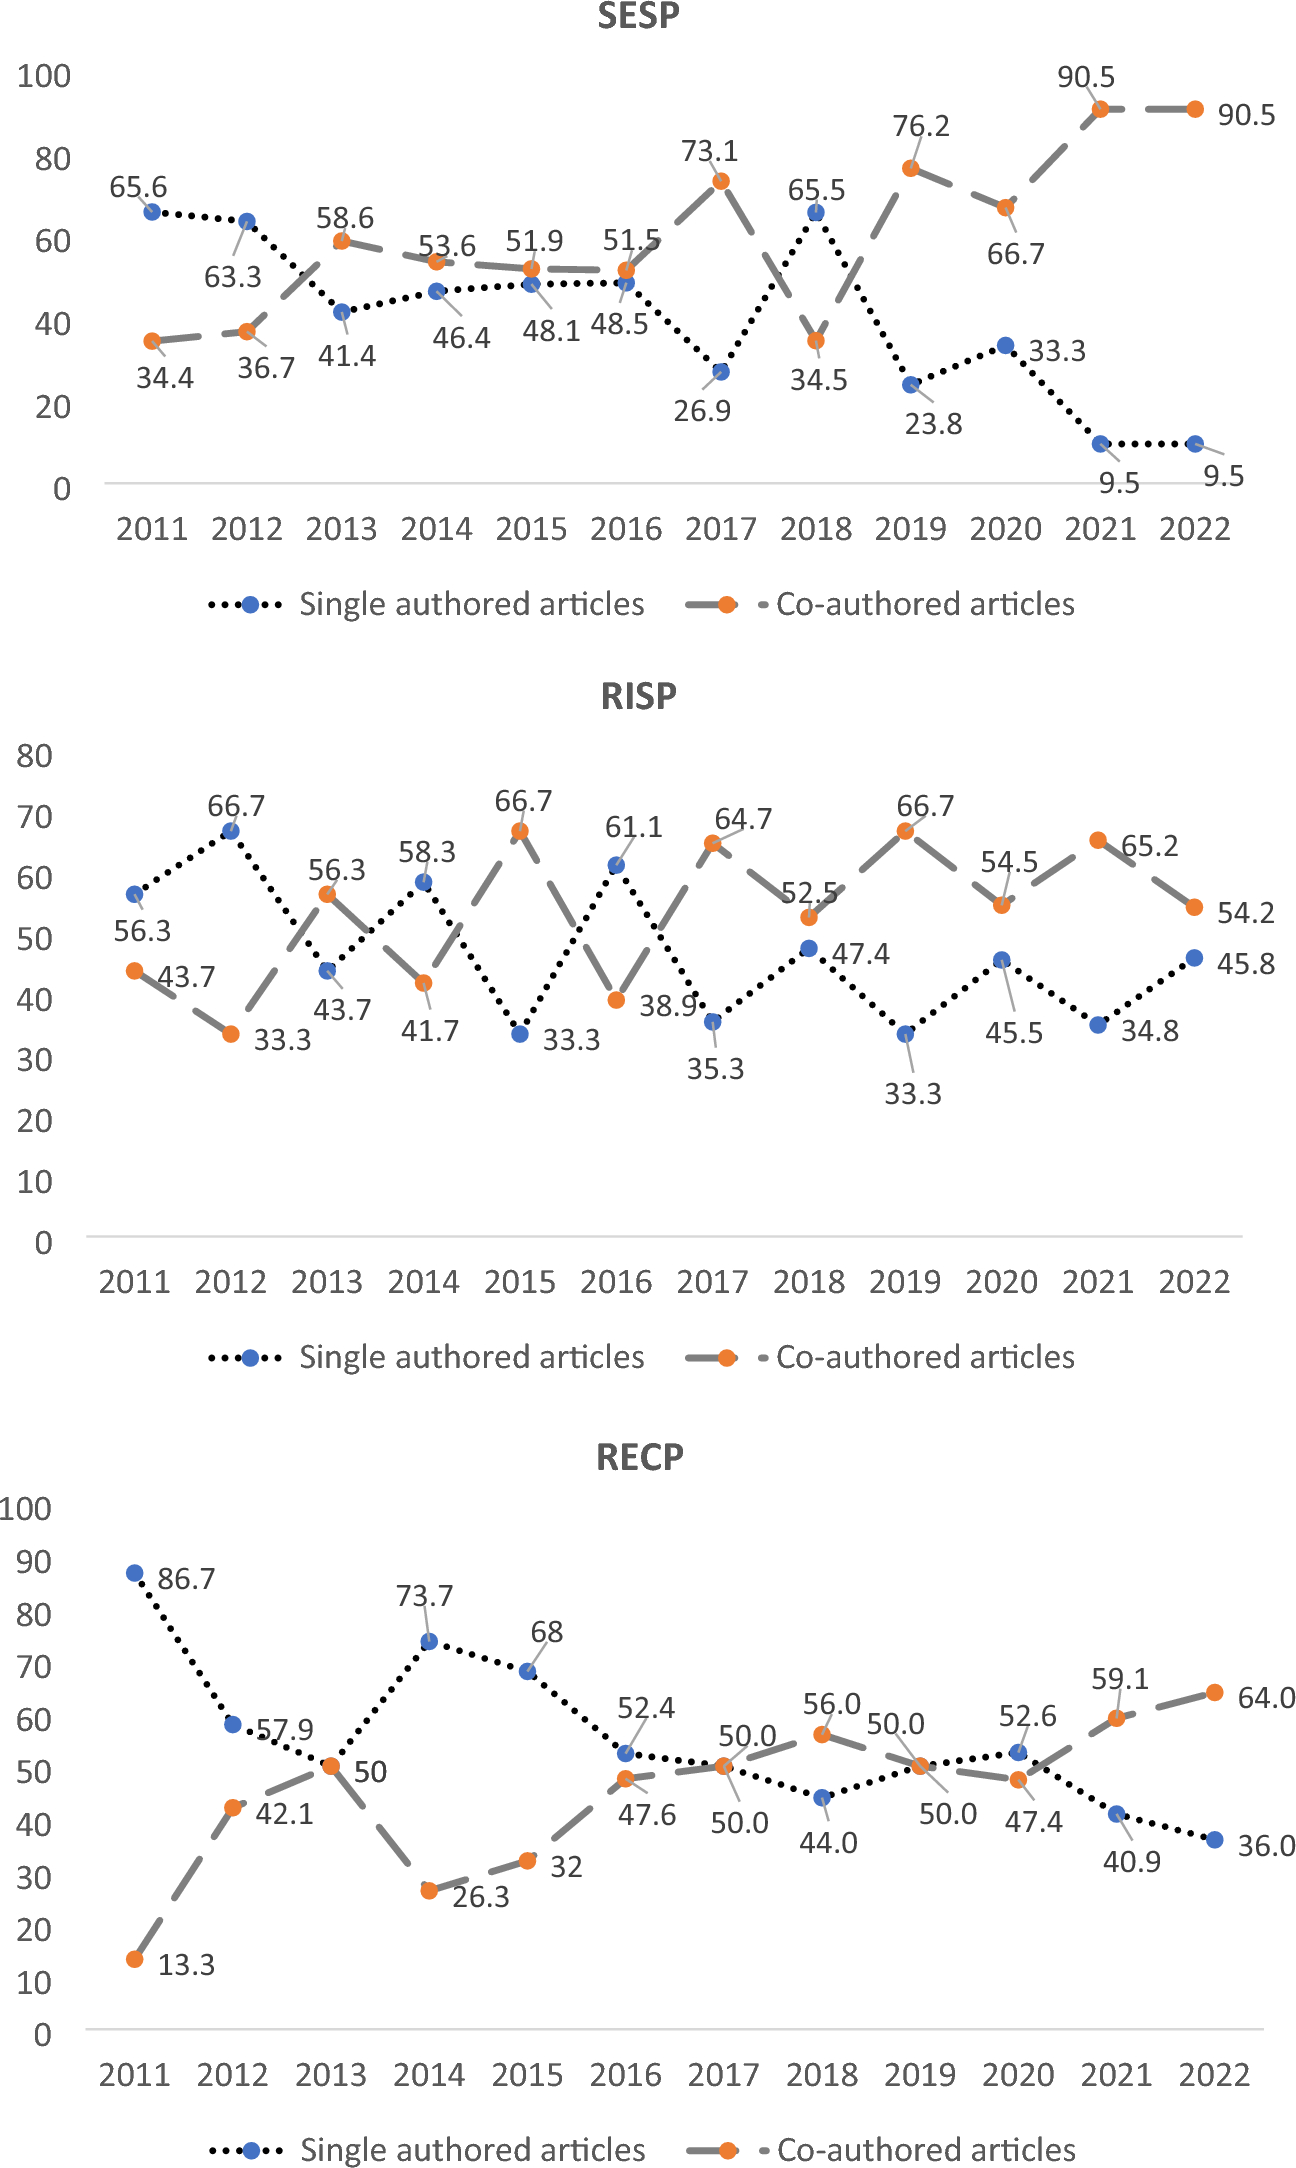
In investigating publication strategies, we classified published articles into five types of authorship: solo female author, solo male author, female team, male team and mixed-gender team. The last three make up the co-authored category, which has become increasingly important over the period examined. In 2011–2022, more than half of the articles in SESP were co-authored (57.1%), while the remaining 42.9% were published by solo authors, with similar percentages found in RISP (53.6% versus 46.4%). In RECP, instead, we found a higher proportion of single-authored articles (53.7%) than co-authored ones (46.3%).
In Fig. 4, the rising trend of co-authorship over the decade is clearly visible. So much so that it amounts to a rather dramatic shift in the publication 'industry'. SESP, for instance, moved from almost two-thirds of single-authored articles in 2011, to an inverse situation with two-thirds or more of articles being co-authored in the last 4 years examined (2019–2022). In RISP, despite wide fluctuations year by year, co-authored articles have clearly predominated. Finally, in RECP, the trend has changed from a strong preponderance of solo-authored articles to a situation of near parity of the two categories, followed by a clear predominance of co-authorship since the pandemic.
Percentage of single- and co-authored articles, per year in SESP, RISP and RECP, 2011–2022.

This collaborative revolution has been made possible by some important developments. The first is the new communication technologies which have facilitated co-authorship among authors who are not working on the same site or even in the same country. The second is the tendency in the field of political science for the expansion of quantitative research, which is more likely to involve multiple authors than qualitative studies (Henriksen Reference Henriksen2016, Reference Henriksen2018). In addition, the early data available indicate that the COVID pandemic is likely to have reinforced the trend: authors facing new pressures generated by lockdowns, often including trying to work while supervising their children’s online education, found sharing the tasks of article-writing a solution which allowed the maintenance of some research output under the difficult new conditions. Last, but certainly not least, the rules of the game for career advancement have also played a crucial role. The increasing quantification of academic assessment has resulted in pressure to publish more articles. In addition, the tendency to measure academic worth in terms of the h-index—i.e. on the basis of the number of citations an individual’s work has received—has transformed co-authoring into a rational strategy, as it allows researchers to share the work needed to complete a paper, without dividing the citations (Henriksen Reference Henriksen2016; Ossenblok et al. Reference Ossenblok, Verleysen and Engels2014).
Despite its importance, men and women seem to have exploited the 'collaborative revolution' in distinct ways. In their examination of SESP's output, Verney and Bosco (Reference Verney and Bosco2022) found that co-authoring with male colleagues is particularly important for women, while men prefer to publish alone or in male-only teams. In other words, a mixed-gender path seems to be the preferred publication strategy for women compared to a same-gender one for men. Are these clearly gendered publishing choices shared by the authors of the other two journals?
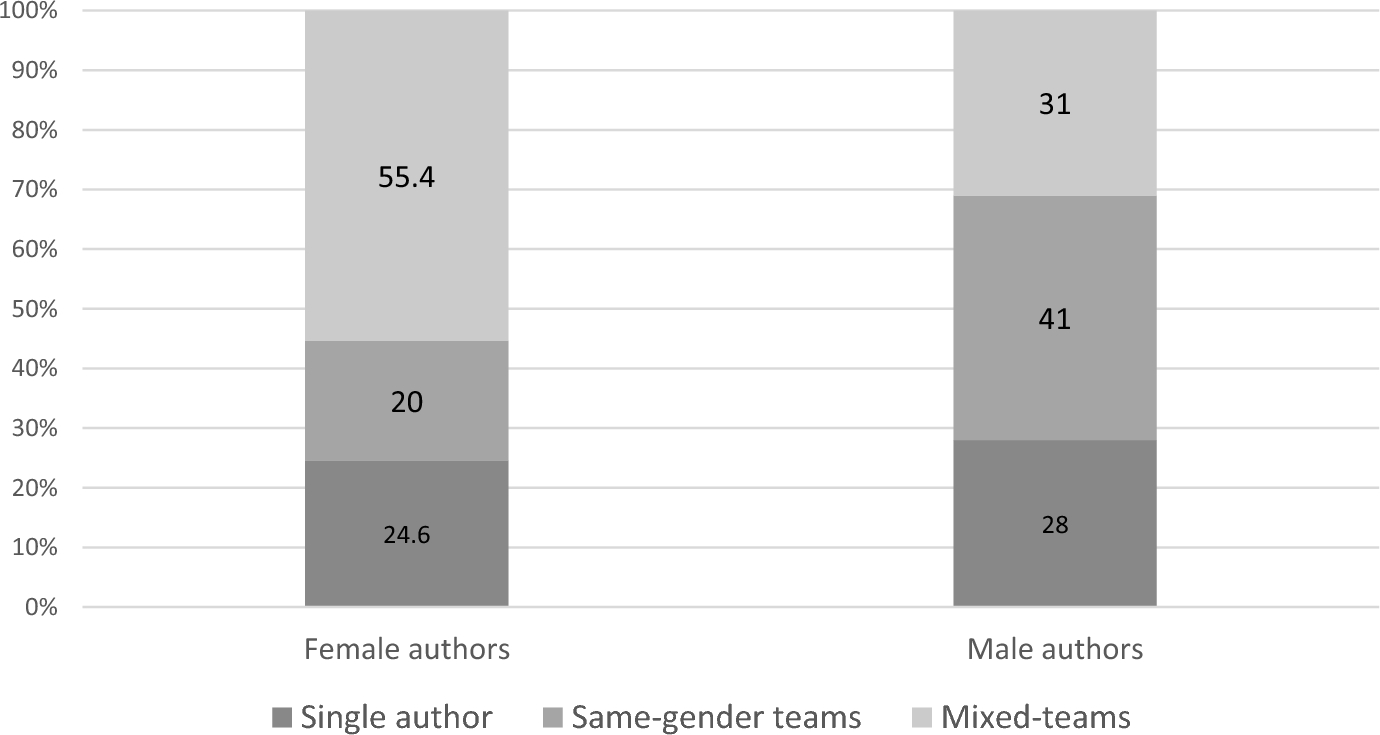
The differentiated authorship patterns initially found for SESP were confirmed in the research on RISP and RECP. Figure 5 shows the aggregate averages for our three South European journals. The most striking finding is that female academics overwhelmingly achieve publication in the context of mixed-gender articles (55.4%), while for male scholars the most important category (41%) is same-gender authorship.
Published articles in SESP, RISP and RECP by gender and authorship type, 2011–2022 (%).

Regarding women, only a limited proportion (20%) of articles are authored by women-only teams and the remaining 24.6% by female single authors. The point to be stressed, therefore, is that the absolute majority of the articles published by women are co-authored with male colleagues. The fact that mixed-gender collaboration is the predominant form of authorship for female political scientists in the USA was first noticed by Fisher et al. (Reference Fisher, Cobane, Vander Ven and Cullen1998) and has recently been confirmed by Teele and Thelen (Reference Teele and Thelen2017, p. 441), who showed that 44.8% of the articles written by female academics in ten political science journals over 15 years were the result of collaboration with male colleagues. From this viewpoint, therefore, it appears that South European journals are following a general pattern, albeit at a higher degree of intensity.
Switching to men, their published articles follow a radically different path, characterised by predominant homophily. Male authors, in other words, prefer to create associations with others similar to them; something which emerges particularly in situations where males are the majority, like in academia (van den Brink and Benschop Reference van den Brink and Benschop2014; Kwiek and Roszka Reference Kwiek and Roszka2021).
As shown in Fig. 5, for male scholars, the most important type of authorship concerns articles published within same-gender teams. Instead, the percentage of men who choose to collaborate with scholars of the opposite gender (31%) is quite low in comparison to their female colleagues.
In conclusion, while men opt mainly to work with colleagues of the same gender, women have a clear preference for joining forces with male scholars. In addition, while women follow the same publication pattern across different journals, this is not the case for men. Thus, although the general rule of 'homophily', is predominant in SESP and RISP, RECP presents a more equilibrated choice between the three types of publications involving men (male solo articles, male only teams and mixed teams).
These findings lead to two key conclusions for the analysis of the gender gap. First, working with colleagues of the same gender does not play a significant role in women’s published output. Second, for women, working with men is much more important to academic publication success than working with women is for men. Male scholars, on the other hand, prefer publication strategies characterised by individualism and homophily, as two-thirds or more of the articles published in the three journals are signed by solo authors or male-only teams.
Seniority, gender, and publication patterns
To explore further the gendered pattern of publications, we investigated the career position of the authors. We were puzzled by the findings on the gendered publication strategies and wondered whether these were replicated at each career juncture. In addition, we wanted to see if there might be specific points in their careers where men and women would share similar patterns of publication. Finally, we were interested to investigate the publication formats chosen at the early career stage when affirmation in the scientific community is particularly important.
In this case, our analysis was performed at the aggregate level—all three journals together—because once we broke down our sample by both article type and author career stage, the number of cases in some of the categories was too small to produce significant and comparable percentages.
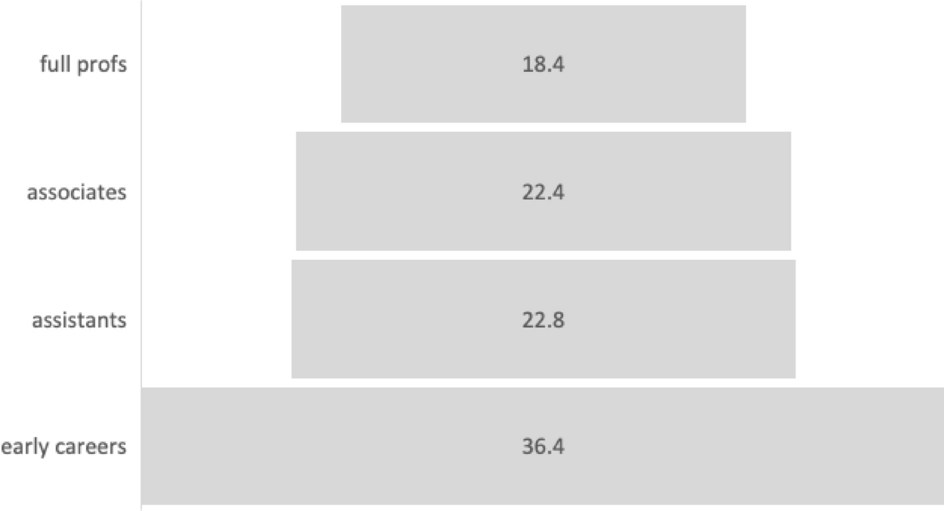
In the three journals, the distribution of authors by academic seniority presents a large percentage of early career scholars at the bottom, tapering off to a small group of full professors at the top (Fig. 6). The non-senior authors (early careers and assistants) who published in the three journals are about 60% of the total, with the remaining 40% split between associates (22.4%) and full professors (18.4%). Those on the lower rungs of the career ladder, therefore, constitute the fundamental publishing base of the journals.
Authors by academic seniority: aggregate percentage for SESP, RISP and RECP (2015–2022).

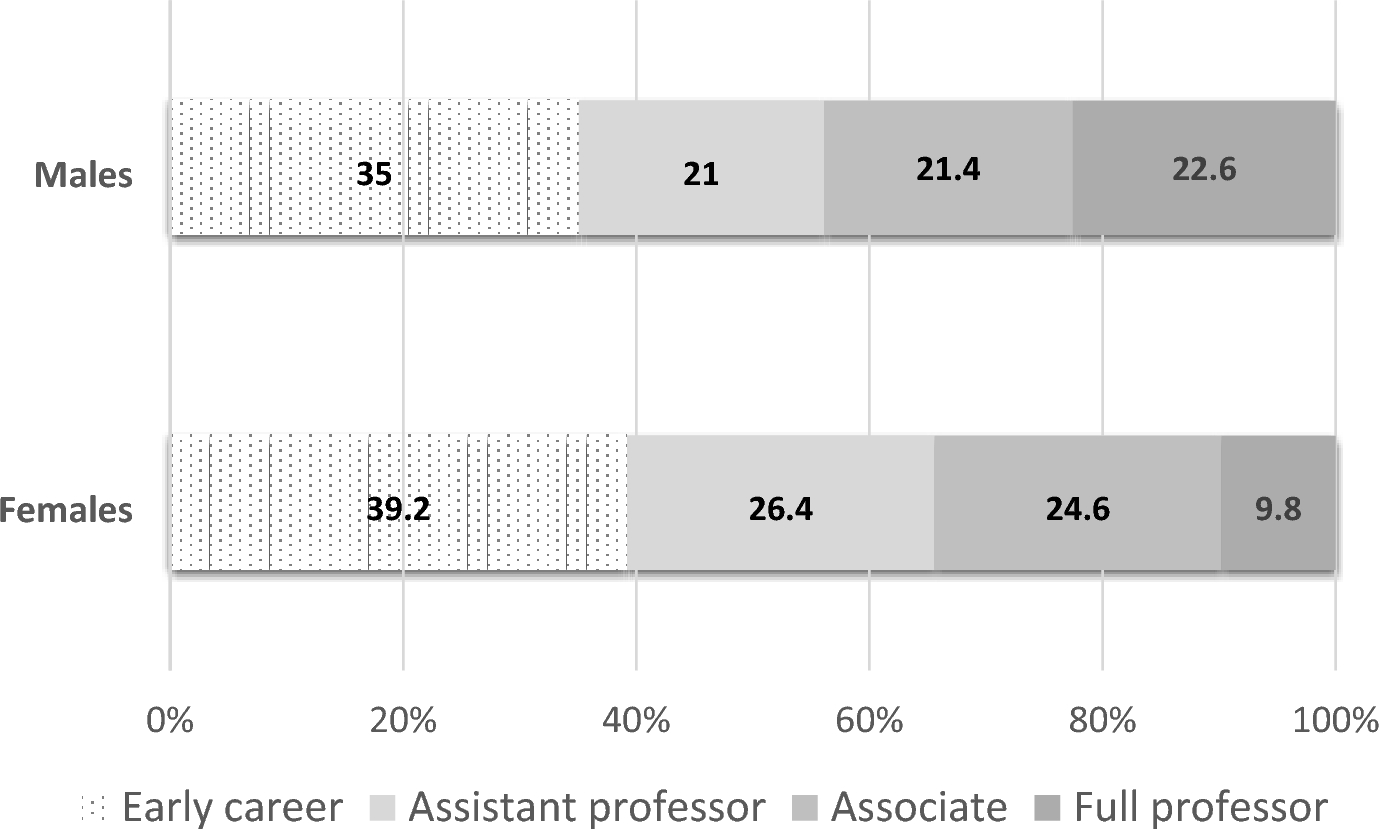
If we break down academic seniority by gender, we have a clearer picture of the academic positions of male and female authors. Figure 7 presents two different universes: in particular it is interesting to notice that while 22.6% of the male authors are full professors, among the female authors less than 10% belong to this category. Furthermore, the uneven career distribution of authors may have implications for increasing/reducing the gender gap in their published articles records, as we will see in Fig. 8.
Authors by gender and academic seniority: aggregate percentage for SESP, RISP and RECP (2015–2022).

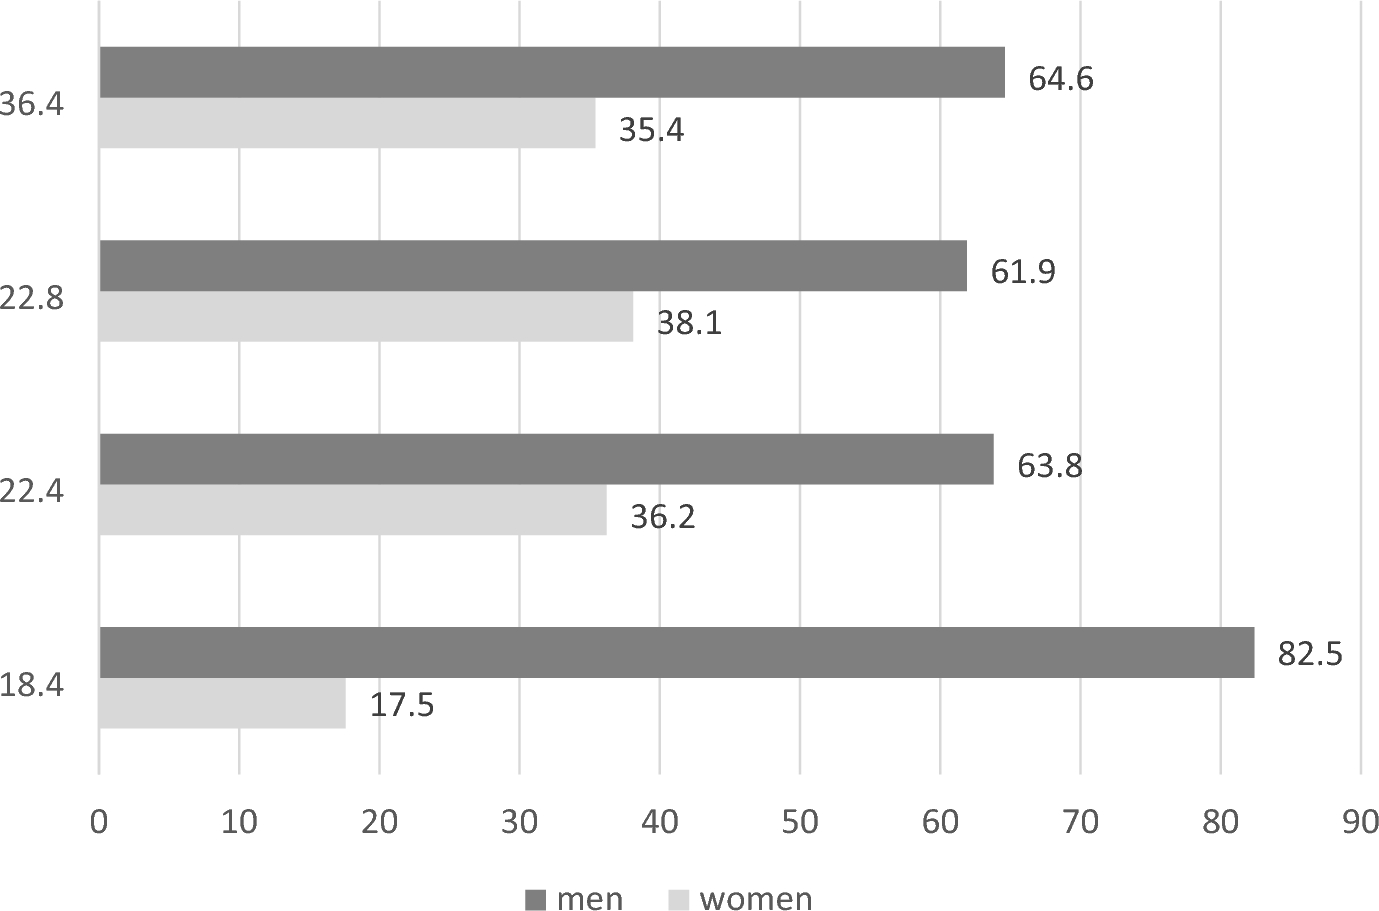
In Fig. 8, the career categories have been broken down by gender. As can be seen, at each step of the academic ladder, male authors overwhelmingly dominate. In particular, the largest gender gaps occur in the early and most mature career stages, where men outnumber women by about 1.8:1 and 4.7:1, respectively. The small proportion of women among full professors is not so surprising as they are a minority at this career stage. Furthermore, this can be regarded as a legacy issue, deriving from the past of the profession in which male full professors heavily outnumbered women.
Male and Female authors at each career stage (aggregate percentages for SESP, RISP and RECP, 2015–2022).

However, an issue of particular concern is the gender difference in publication rates among junior scholars, hungry for career advancement. Given the importance of publications for winning academic jobs in a competitive environment where positions are scarcer than the candidates available, this puts women at a major disadvantage from the start. It has been shown that ‘early productivity leads to later productivity’, with those who published more early on continuing to do so later, because ‘initial differences accumulate over time to produce large differences over entire careers’ (Habicht et al Reference Habicht, Lutter and Schröder2021, 9672). This early career gender gap in the total number of publishing authors is thus an important key to the perpetuation of the gender fracture in academia and suggests how hard it will be to bring about change.
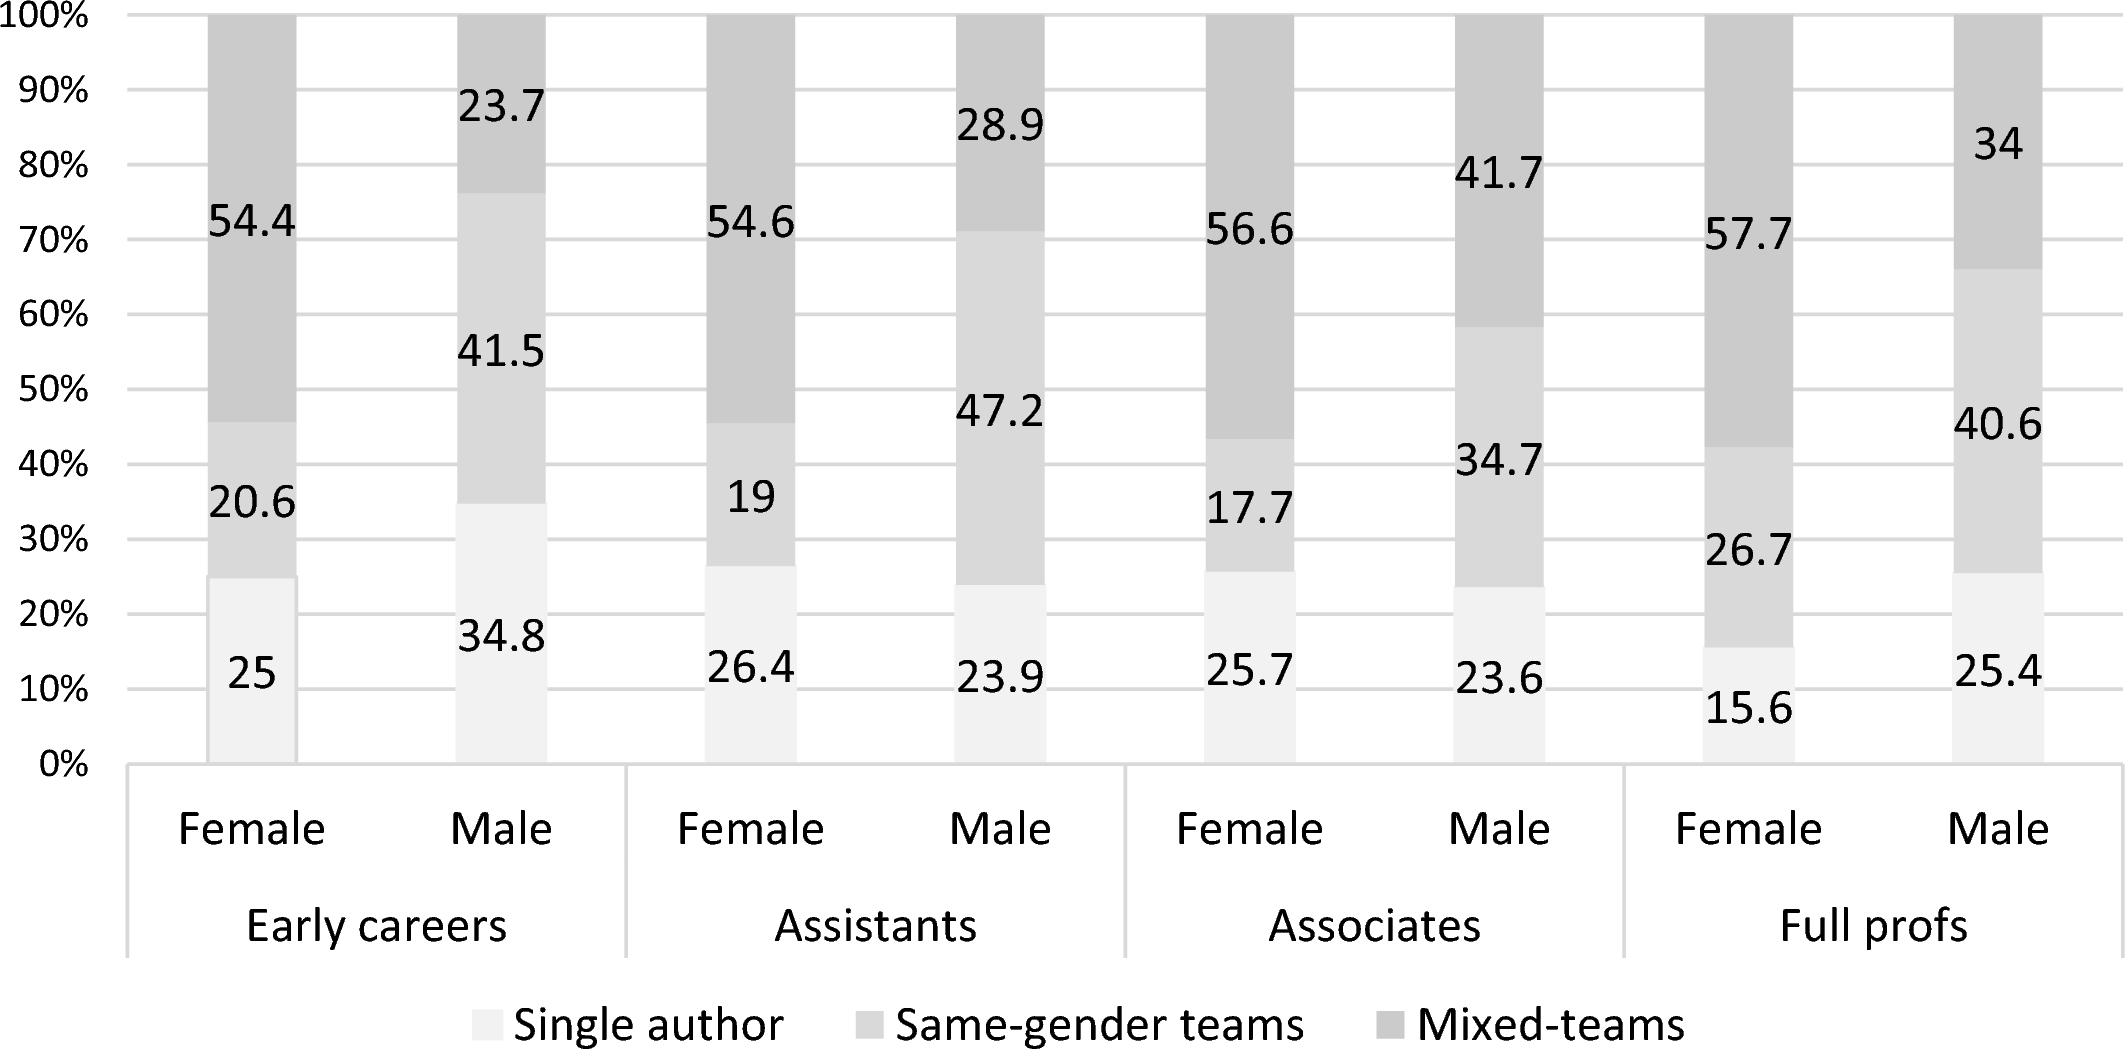
We now turn to look at how male and female academics achieve publication success at different career stages. Men and women do not approach their jobs in the same way. Instead, their professional growth seems based on different types of articles at each point of their careers. This cleavage is clearly visible in Fig. 9, which highlights male and female publication strategies at different career stages. Several issues deserve attention.
Authors' publication strategies, by gender and career stage (2015–2022).

First, the only case in which there is a stable pattern across career junctures is the choice of women for mixed-gender teams. As can be seen, the percentage of women who publish with male colleagues varies between 54.4% (among those at the beginning of their careers) and 57.7% (full professors). In other words, working with men is a consistent lifetime female strategy to achieve publications.
Second, for male academics, co-authoring in mixed-gender teams is always significantly less important than for women, ranging between 23.7% (early careers) and 41.7% (associates).
Third, the latter pattern is particularly striking at the early-career stage, where women choose to publish in collaboration (75%) more than men (65.3%), while those who publish alone are only 25%, compared to 34.8% for their male colleagues. As found by Kwiek and Roszka (Reference Kwiek and Roszka2022, 1706), "while publishing in co-authorships is safer (the risk of openly hostile criticism is reduced, and the responsibility for errors is divided between all co-authors), it may not suffice to obtain a permanent job, or in some systems, to keep it". At a crucial career stage, when young researchers are attempting to make a breakthrough, women in far larger numbers than men go for a safe option—but one which may not necessarily be the optimal choice for their careers (more on this below).
Fourth, opposite trajectories for men and women are also visible in the case of single-gender teams. For women, the minor relevance of this category remains the case across career stages, with a small increase when they become full professors. For men, in contrast, publishing with other men is very important, especially during the initial phases of their careers. The same-gender versus mixed-gender choice, in other words, digs a deep cleavage between male and female academics from the beginning of their careers.
The final point to be stressed concerns single-author articles, a category which is particularly important in establishing scholars' reputation. It has previously been noticed that female academics publish alone less than their male colleagues (West et al. Reference West, Jacquet, King, Correll and Bergstrom2013). With solo authorship, academics introduce and defend their research, taking full responsibility—and full credit—for what they publish. This is crucial at the early career stage as "junior faculty use single-authorship as signals about their ability to perform independent research" (Kwiek and Roszka Reference Kwiek and Roszka2022, p. 1707). However, when we consider the authors' academic seniority, the picture does not present any variety. In particular, in the three journals, just one in four female authors published alone at the early-career stage, and the share of solo articles did not increase significantly with seniority. For men, in contrast, this type of article is more important in the initial career phase than later.
The data show the different routes that men and women follow to succeed in academic publication. Strong differentiation applies consistently along the whole career path, as at each stage of the ladder men and women choose divergent publication strategies. Early career men publish in teams with colleagues of the same gender or alone, while only a limited percentage choose to work with women. At the ‘Assistants’ stage, men pursue the same strategy, but with increased authorship within same-gender teams. It is only when they become associate professors—a senior role in academia—that they radically change strategy, preferring mixed-gender teams over solo and same-gender authorship. Finally, as full professors, men seem more balanced in their choice of one of the three publication strategies. In short, men tend to work more with women once they reach senior ranks rather than before.
In contrast, women do not vary their publication strategies much over the course of their careers. More than half of them, in fact, opted for mixed-gender collaboration, regardless of whether they were at the beginning or the end of their working lives. The rest are divided between those who publish alone and those who choose to work with other female colleagues. Even if the share of the former is slightly larger than the latter, we need to highlight that the early career women who succeed in publishing alone amount to just 25%, and that this percentage does not rise significantly in the following two career steps, while falling below 16% for those who become full professors. As publishing alone—especially at the start of one's career—is fundamental for establishing one's name in the community, the strategy which women are primarily following to achieve publications (i.e. co-authoring) is not necessarily the best route to career success.
For those interested, a statistical analysis—multinomial logit models—is presented in the Appendix of the article. The multinomial logistic coefficients and the resulting probability figures further substantiate the conclusions of our work.
Conclusions
Through our research, we confirmed that the three South European journals we examined are characterised by the same gender gap found in American and European political science journals. In SESP, RISP and RECP, in fact, female authors account for around one-third or less of the total number of published articles.
Delving deeper into male and female publications, we found that the three journals also share a second type of gender cleavage. We define this as the ‘publication strategy gap’, with mixed-gender teams being the preferred authorship option for an absolute majority of women but not for men. Instead, male authors prefer same-gender strategies as at least two-thirds publish with same-gender colleagues or alone.
Our understanding of the gender gap and the publication strategy gap in South European political science journals has been enriched by a novel analysis of the role played by academic seniority. Our most important finding is that at each career stage, the publication gap intersects with the strategy gap. Not only are female authors overall fewer than men, but the members of the two genders choose diametrically opposed publication strategies across their entire working lives.
On the one hand, we have seen that while the overwhelming presence of male authors occurs consistently at all career stages; it is especially high in the categories of early career researchers and full professors. On the other hand, we noticed that male and female authors follow different publication patterns throughout their careers. The presence of a broadly similar picture in all three journals suggests that women’s weaker publication footprint is not influenced by local specificities: gender is the key variable.
This research leaves us concerned about the publication gender gap in general but most especially at the early career stage. Later, the reduced presence of women could be partly a legacy issue, connected with the male-dominated tradition of the profession. What we did not expect to find was such a strong gap among junior scholars. This is a particular cause for disquiet given its implications for the perpetuation of women’s minority presence into the future. We believe that attempts to address the gender imbalance would be especially relevant at this career stage. Junior female academics should be encouraged to publish more and to publish solo. Professional associations, academic journals and university mentors need to think creatively about how to reach this goal.
Acknowledgements
The authors would like to thank Evelyn Karakatsani for research assistance with the data collection.
Funding
Open access funding provided by Università degli Studi di Firenze within the CRUI-CARE Agreement.
Appendix
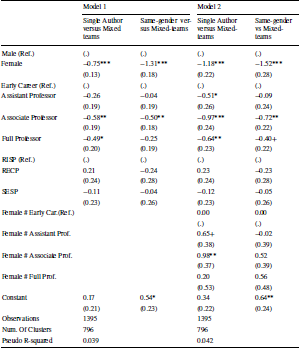
Table 1 shows the multinomial logit coefficients, in which the dependent variable is the publication strategy. In both models the reference category is publishing in Mixed Teams. The main explanatory variables are gender and academic career. Model 1 includes these variables together with the specific journal in which the authors have published: RISP, RECP or SESP. Model 2 adds the interaction term between Gender and Academic Position.
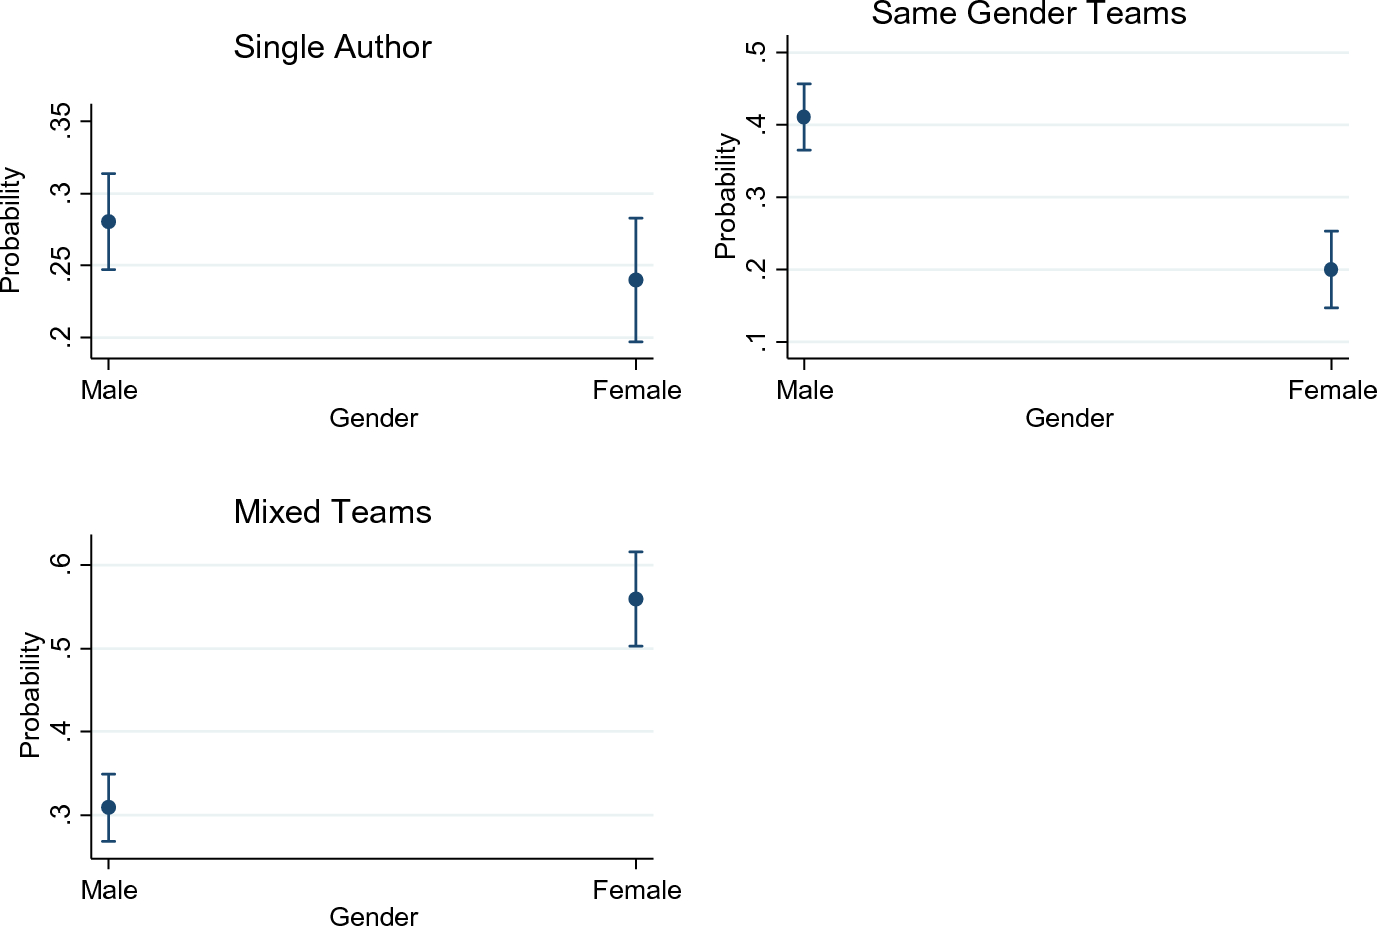
In line with Fig. 5 in the main text, Model 1 shows that the probability for women to publish as solo authors or in same-gender teams (rather than in mixed-gender teams) is lower than for men. To understand the magnitude of these gender differences, Figure A1 shows the expected probabilities of following these different publication strategies by author’s gender. In general, men have a 20 percentage point higher probability to work in same-gender teams while women have a 25 per cent higher probability to work in mixed-teams, with these differences being statistically significant at the 95% level. The effect of gender on publishing as single authors is not statistically significant, showing no difference between males and females.
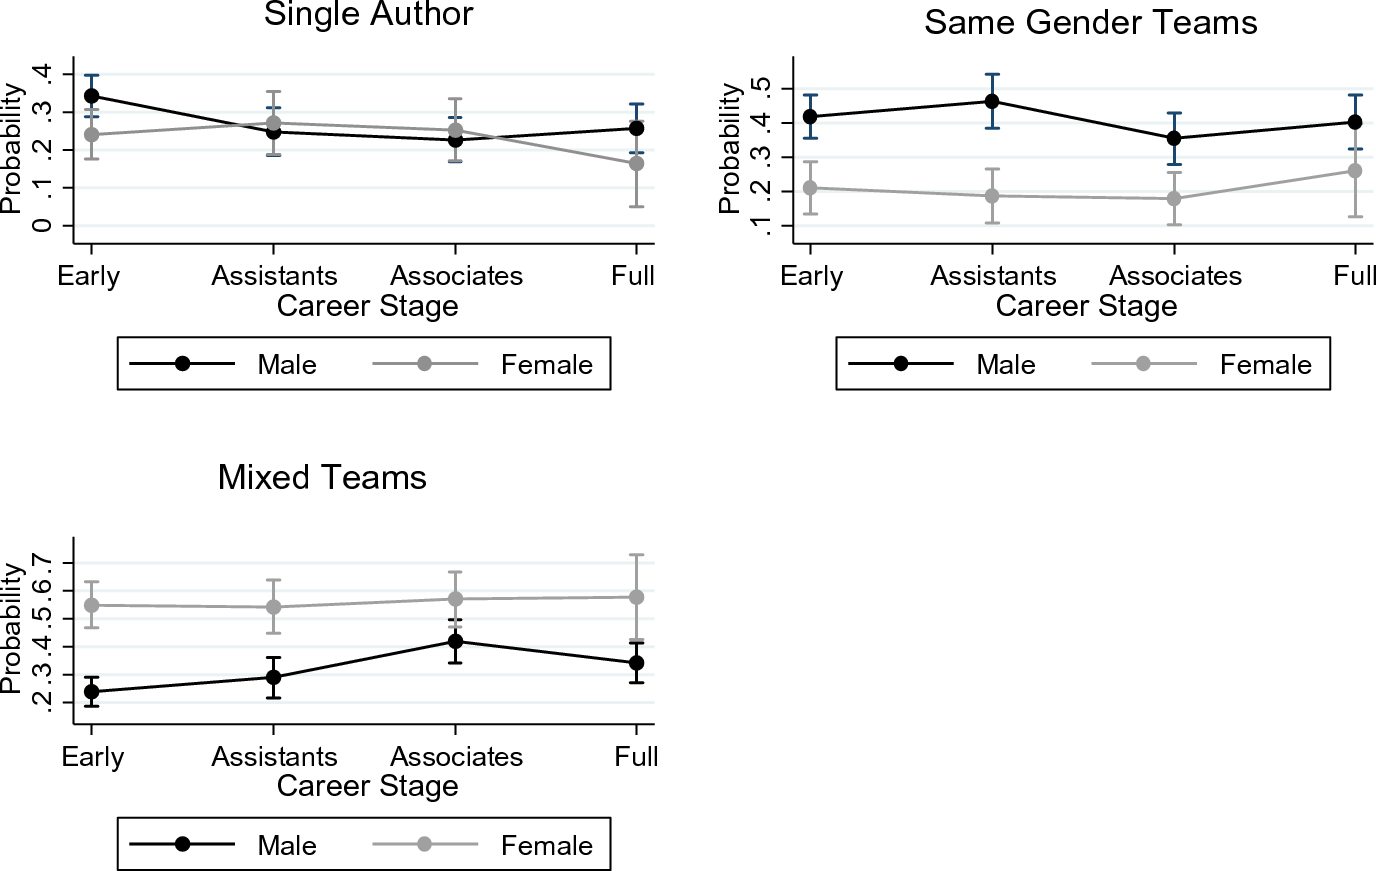
Model 2, and particularly the interaction coefficients, verifies the gender differences in terms of authorship according to academic career stage. As the interaction coefficients and their statistical significance depends on the reference category adopted, it is more illustrative to calculate the expected probabilities. Thus, we can observe the probabilities by publication strategy considering gender and academic career, replicating previous Fig. 9. As shown in Figure A2, in the case of single authorship, assistant and associate professors have a similar probability of choosing this publication strategy regardless of gender. Women in the early career and full professor stages have a lower probability - around 10 percentage points – of publishing alone in contrast with their male colleagues. These differences are not statistically significant at the 95% level. However, relaxing the confidence intervals to the 90% level makes the gender differences at the early career stage statistically significant, while they remain not significant for full professors. The low number of full female professors publishing alone (7 cases) makes the confidence intervals bigger, which could explain this no significance despite the large differences.
Moving on to same-gender teams, female academics have a remarkably lower probability than men of opting for this strategy. The differences are statistically significant for all career stages with the exception of full professors. As with solo authorship, the small number of female full professors working in all-women teams (12 cases) could condition the statistical significance.
In contrast, men have a markedly lower probability than women to publish in mixed-teams. The differences are statistically significant at 95% level across all career stages except for associates, where it is significant at 90%.
The impact of gender and academic position on publication strategy

Multinomial Logit Regression Coefficients. Standard errors in parentheses.
+ p<0.1 * p<0.05 ** p<0.01 *** p<0.001
Standard errors have been clustered by article, as the authors are grouped in articles. However, whether using clustering or not, the standard errors barely change the results.
Probability of publication strategy by gender. Confidence intervals show 95% level

Probability of publication strategy by gender and career stage. Confidence intervals show 95% level


 Open access

